


Características


¿Tienes alguna pregunta?
Recomendar
5 diapositivas
Tracking Milestones and SMART Goals Presentation
Visualize your SMART goals with clarity using this arrow-based infographic template. Each step—Specific, Measurable, Achievable, Relevant, and Time-bound—is clearly segmented to track progress and prioritize objectives. Fully editable in Canva, PowerPoint, and Google Slides, it’s perfect for planners, project managers, and strategists seeking to streamline goal achievement.


26 diapositivas
Ethical Business Practices Presentation
Promote integrity with our Ethical Business Practices presentation template, suitable for PowerPoint, Keynote, and Google Slides. This essential tool is crafted for business leaders, compliance officers, and educators who aim to reinforce the importance of ethics in the corporate environment. Our template facilitates a clear understanding of ethical standards in business operations. It includes slides on ethical decision-making, corporate governance, social responsibility, and the long-term benefits of maintaining high ethical standards. With customizable layouts, you can present real-world scenarios, ethical frameworks, and company policies that illustrate your commitment to ethical conduct. This SEO-optimized template is key for reaching audiences interested in building trust and credibility through responsible business practices. Use this template to lead discussions on ethics, influence corporate culture positively, and showcase how ethical behavior is not just right but also beneficial for business success.


22 diapositivas
Simple Pitch Deck Presentation
Streamline your pitch process with this no-frills Pitch Deck template, designed for clear communication and powerful impact. From the get-go, the cover slide clearly announces your purpose, inviting audiences into your business narrative. The template smoothly transitions from one slide to the next, each one a stepping stone in building your case — from problem to solution. It includes a neatly organized table of contents, thought-provoking mission and vision statements, and data-rich slides for a deep dive into your business metrics. Each section, marked with bold, numbered headers, keeps your presentation on track and your audience engaged. A final 'Thank You' slide adds a touch of professionalism, and the credits section ensures that your sources are transparently acknowledged. This pitch deck is ideal for startups and businesses looking to capture attention and convey their story succinctly.


10 diapositivas
Concept Mapping with Bubble Map
Break down complex ideas into visual clusters with this hexagon-style concept mapping template. Designed to organize information into thematic groups, it's ideal for brainstorming, mind mapping, or presenting strategies and workflows. Each section uses color-coded bubble maps for easy navigation. Fully editable in PowerPoint, Keynote, and Google Slides.


5 diapositivas
Editable Data Charts Presentation
Bring your data to life with a clean, engaging layout that makes every insight easy to understand. This presentation helps you explain percentages, comparisons, and key metrics with clarity while keeping your narrative smooth and professional. Designed for clear data storytelling and effortless editing, it's fully compatible with PowerPoint, Keynote, and Google Slides.


23 diapositivas
Kitsune Startup Strategy Presentation
This startup strategy template is designed for clear communication of business vision, target market, and unique value proposition. It also includes slides for marketing strategies, team introduction, and financial overview. Its clean, professional layout makes it ideal for investors or stakeholders. Compatible with PowerPoint, Keynote, and Google Slides for easy customization.


7 diapositivas
World Map Infographic Presentation Template
The world map includes 195 recognized countries around the globe. This geographic world map template includes detailed background information and facts on each country, with flags and outline images of each country. You can easily see where all 195 countries are located on this map, and which countries share borders with each other. This overall template design is easy to read and highly informative for any geography enthusiast who wants to learn more about the different countries in the world. This World map template include all continents, regions of the world, oceans and seas.


7 diapositivas
College Schedule Infographic Presentation
A College Schedule infographic is a visual representation of a typical college schedule, which includes classes, extracurricular activities, and other commitments. This template can be used to help students plan and organize their time effectively, ensuring that they can balance their academic and personal responsibilities. This infographic includes weekly timed schedules in table and chart formats to present the schedules in a clear and easy to understand way. This template is a helpful tool for college students looking to manage their time effectively and balance their various tasks.


10 diapositivas
Business Growth and Market Statistics Presentation
Showcase key business growth trends and market insights with the "Business Growth and Market Statistics" presentation templates. These visuals are crafted to enhance clarity in communicating growth drivers, market dynamics, and performance metrics effectively. Ideal for corporate presentations, they're compatible with PowerPoint, Keynote, and Google Slides, ensuring a professional look across all platforms.


5 diapositivas
Editable Mind Mapping Presentation
Clarify complex thoughts with the Editable Mind Mapping Presentation. This sleek template features a central profile design with five branching points to visualize ideas, processes, or strategies. It's perfect for brainstorming sessions, team collaboration, or project planning. Fully customizable and compatible with PowerPoint, Keynote, and Google Slides.


7 diapositivas
Comparison Infographic Presentation Template
A comparison Infographic is a visual representation that compares two or more things. It's used to show the similarities and differences between items, ideas, or concepts. It can be used to compare different products, services, options, or even facts and figures. This template works with Powerpoint, Keynote and Google Slides, so you can use it on any computer. This template includes fun pictures and allows you to add your own. This template also has many different charts, graphs and boxes so you can enter your own information. Use this comparison template to compare anything you need.


6 diapositivas
Big Data Visualization Dashboard Presentation
Bring your data story to life with a slide that feels dynamic, modern, and effortlessly clear. This presentation highlights key metrics through clean icons and a bold circular progress graphic, making complex information easy to follow and visually engaging. Perfect for sharing insights, tracking performance, or presenting analytics updates. Fully compatible with PowerPoint, Keynote, and Google Slides.


20 diapositivas
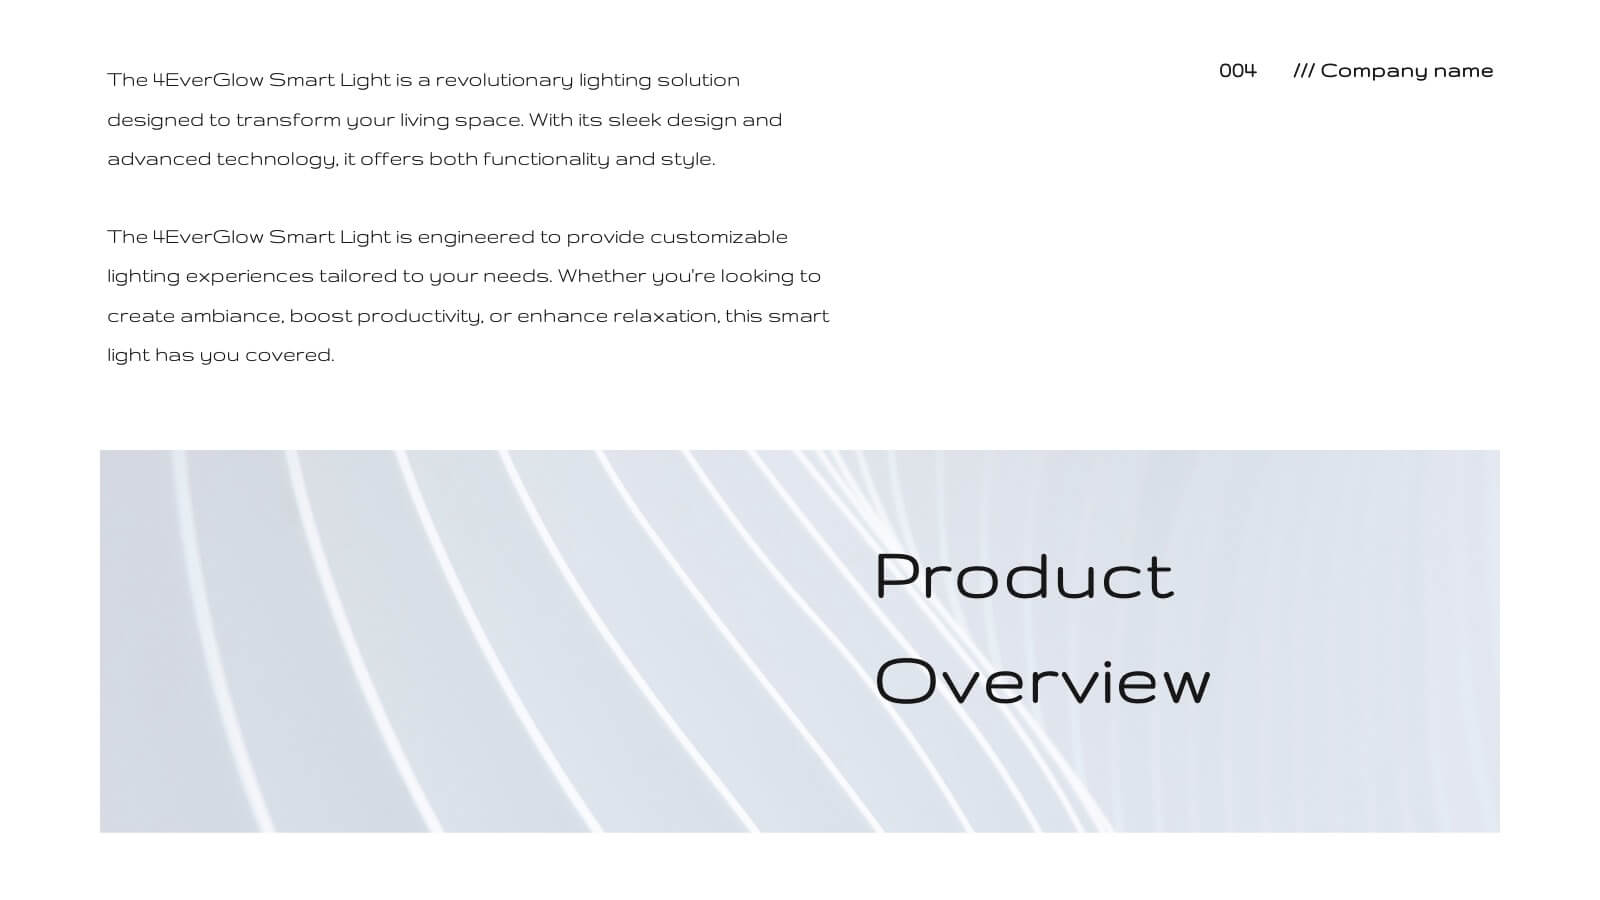
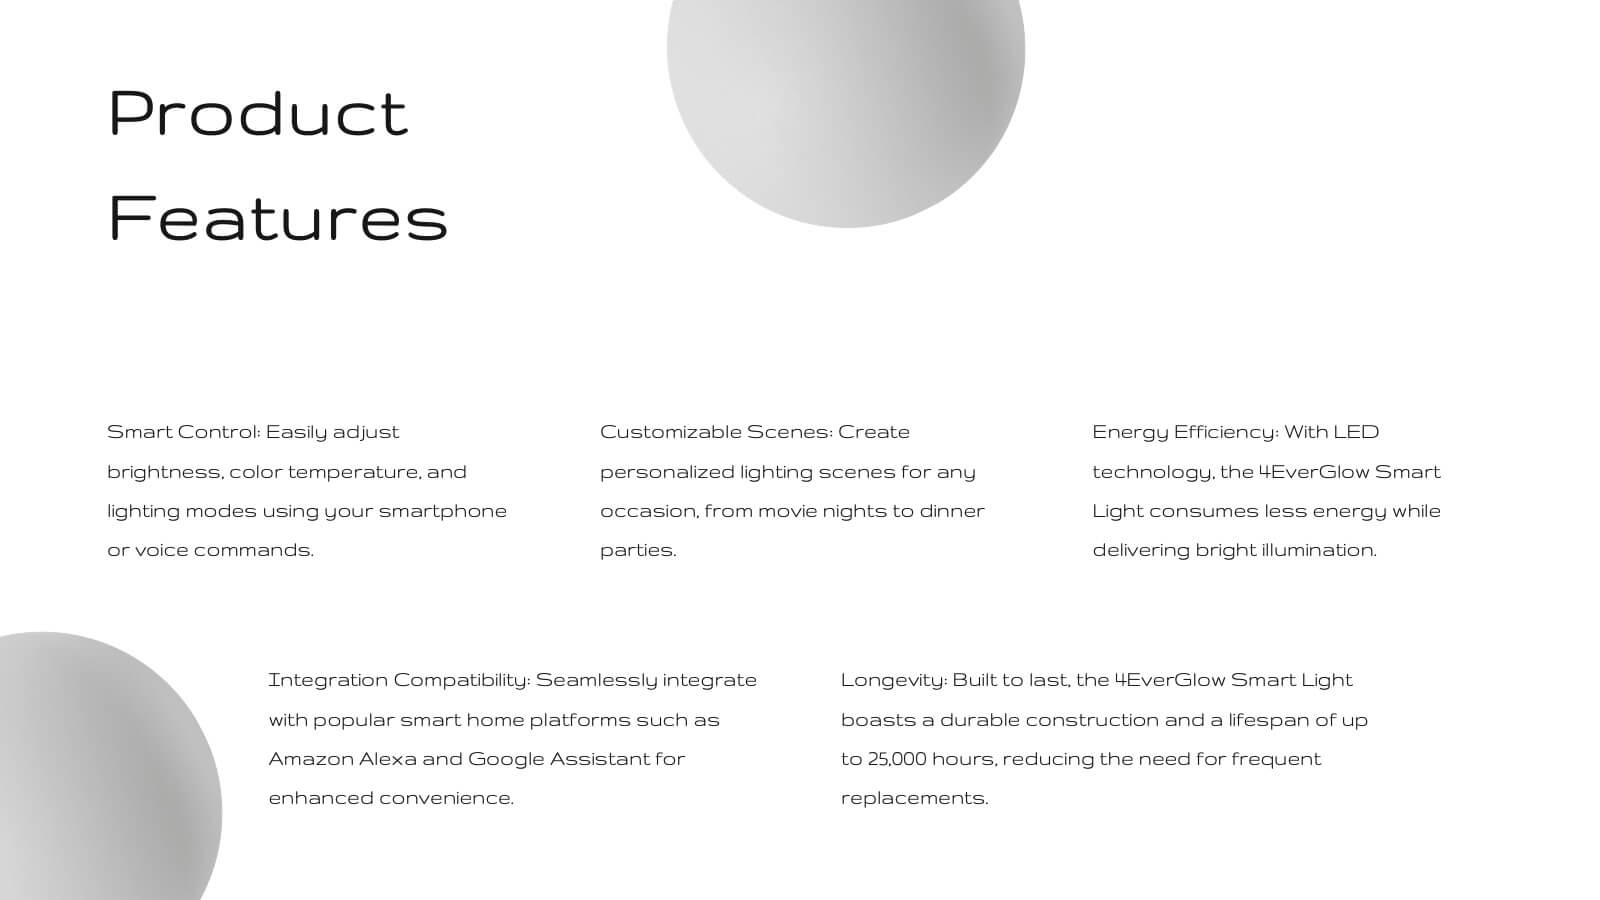
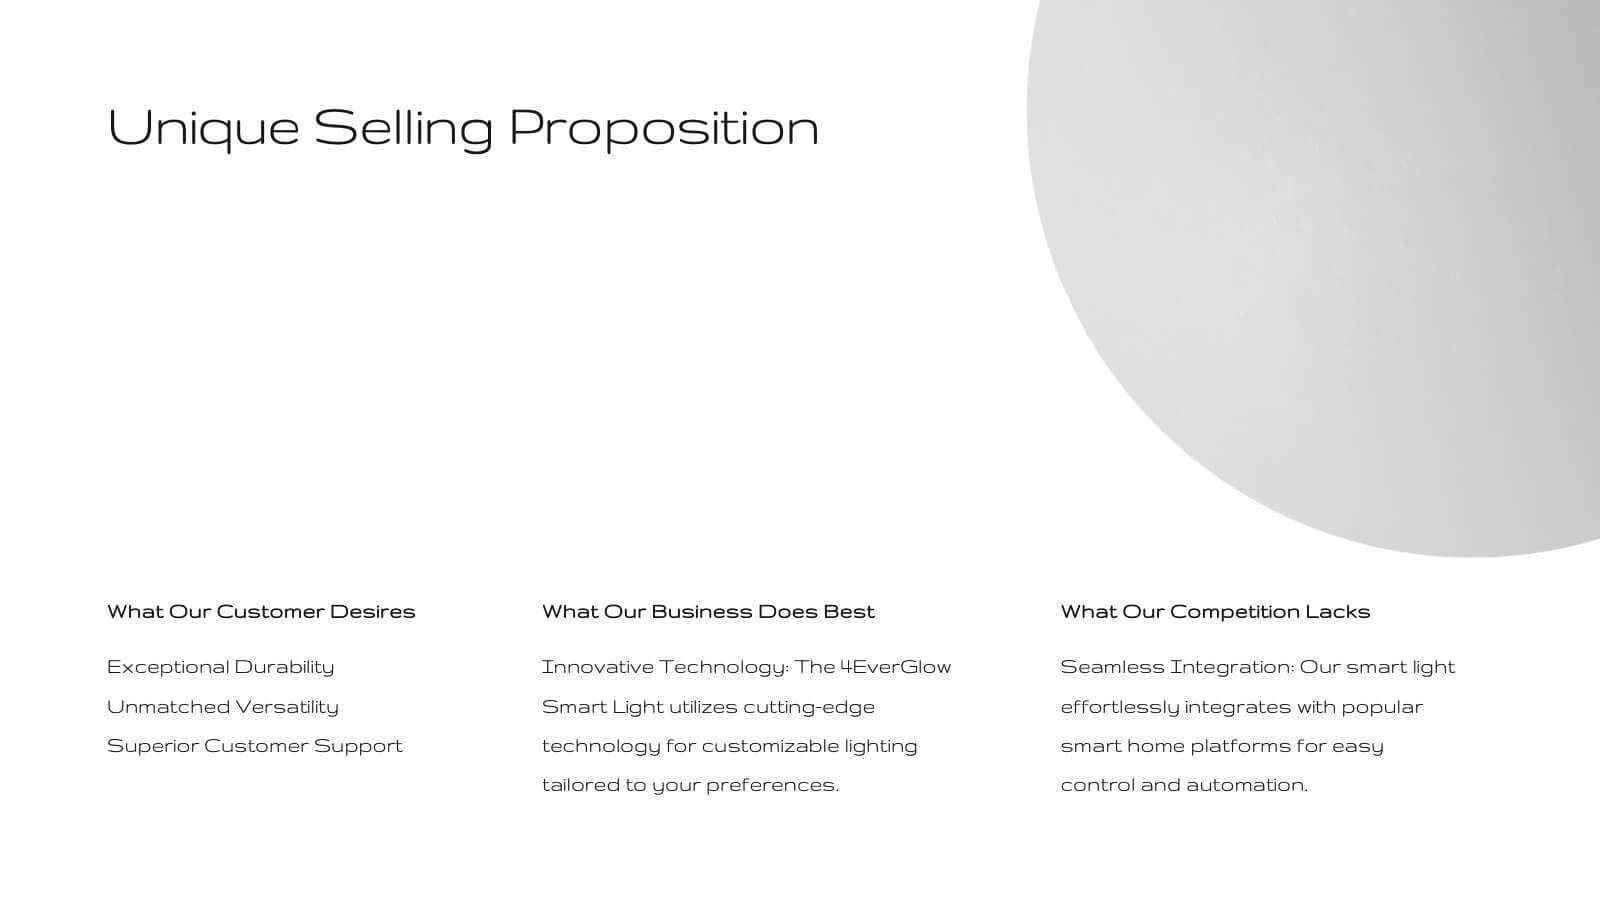
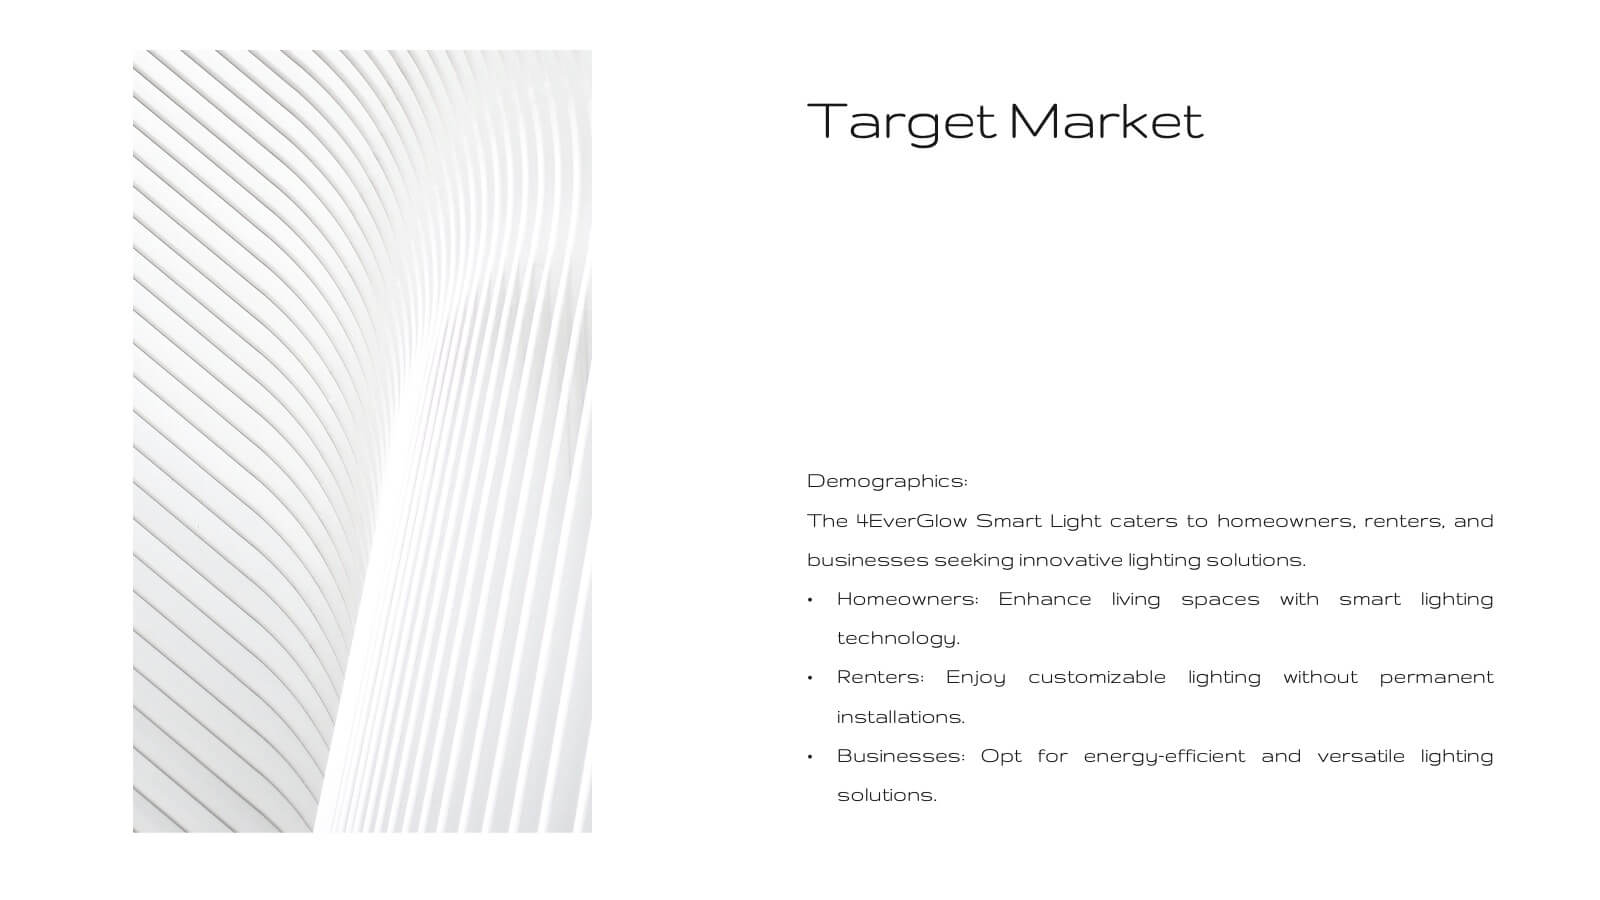
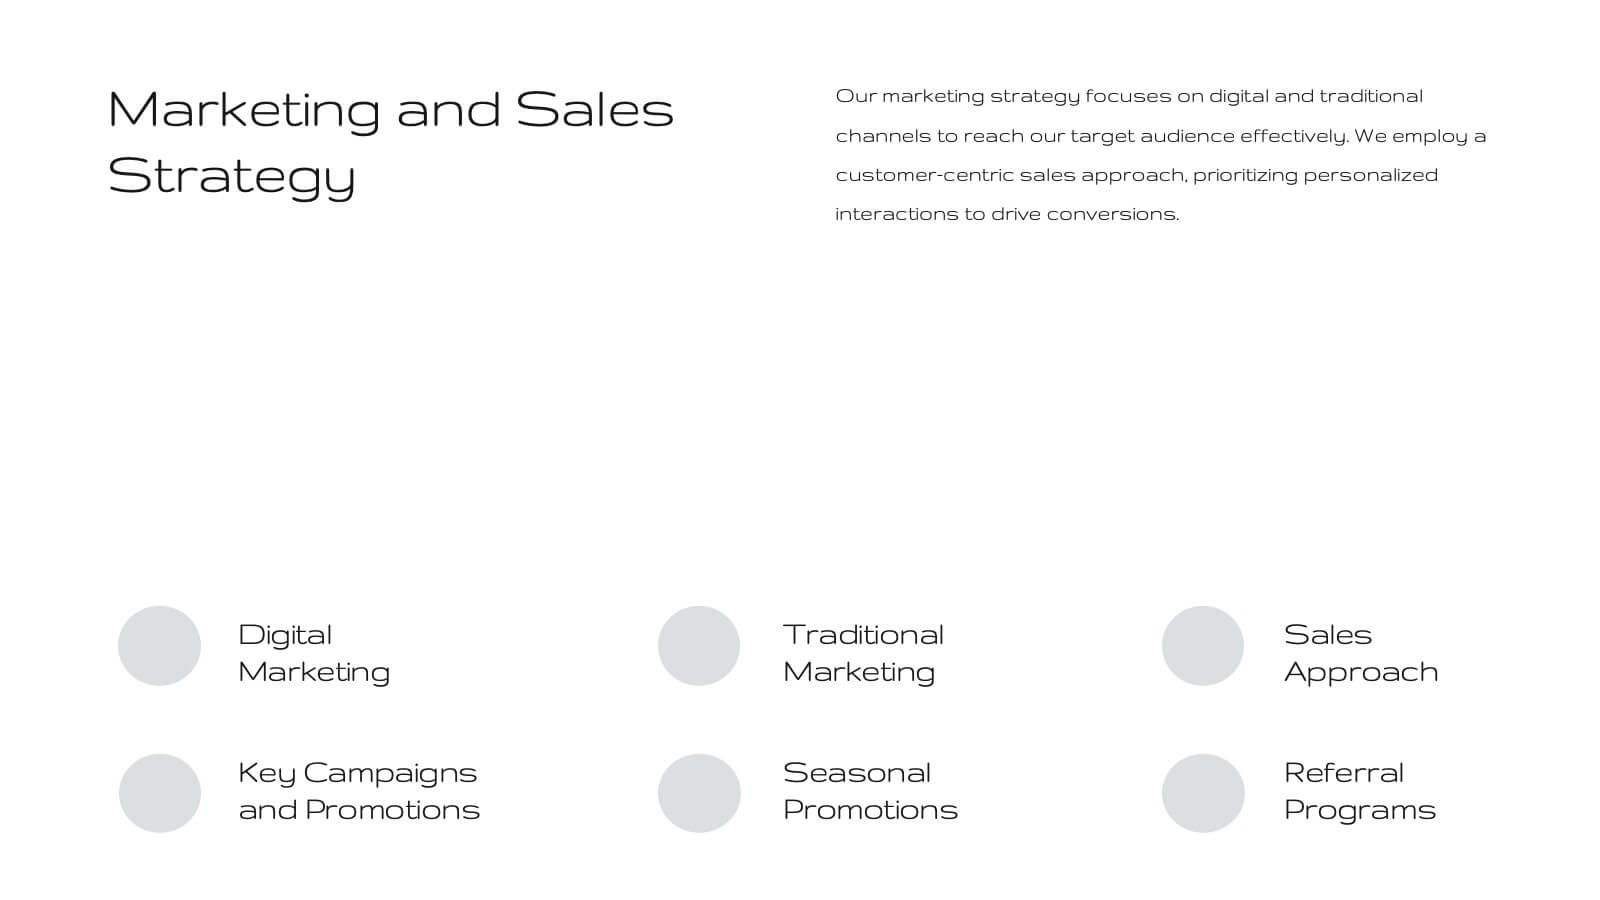
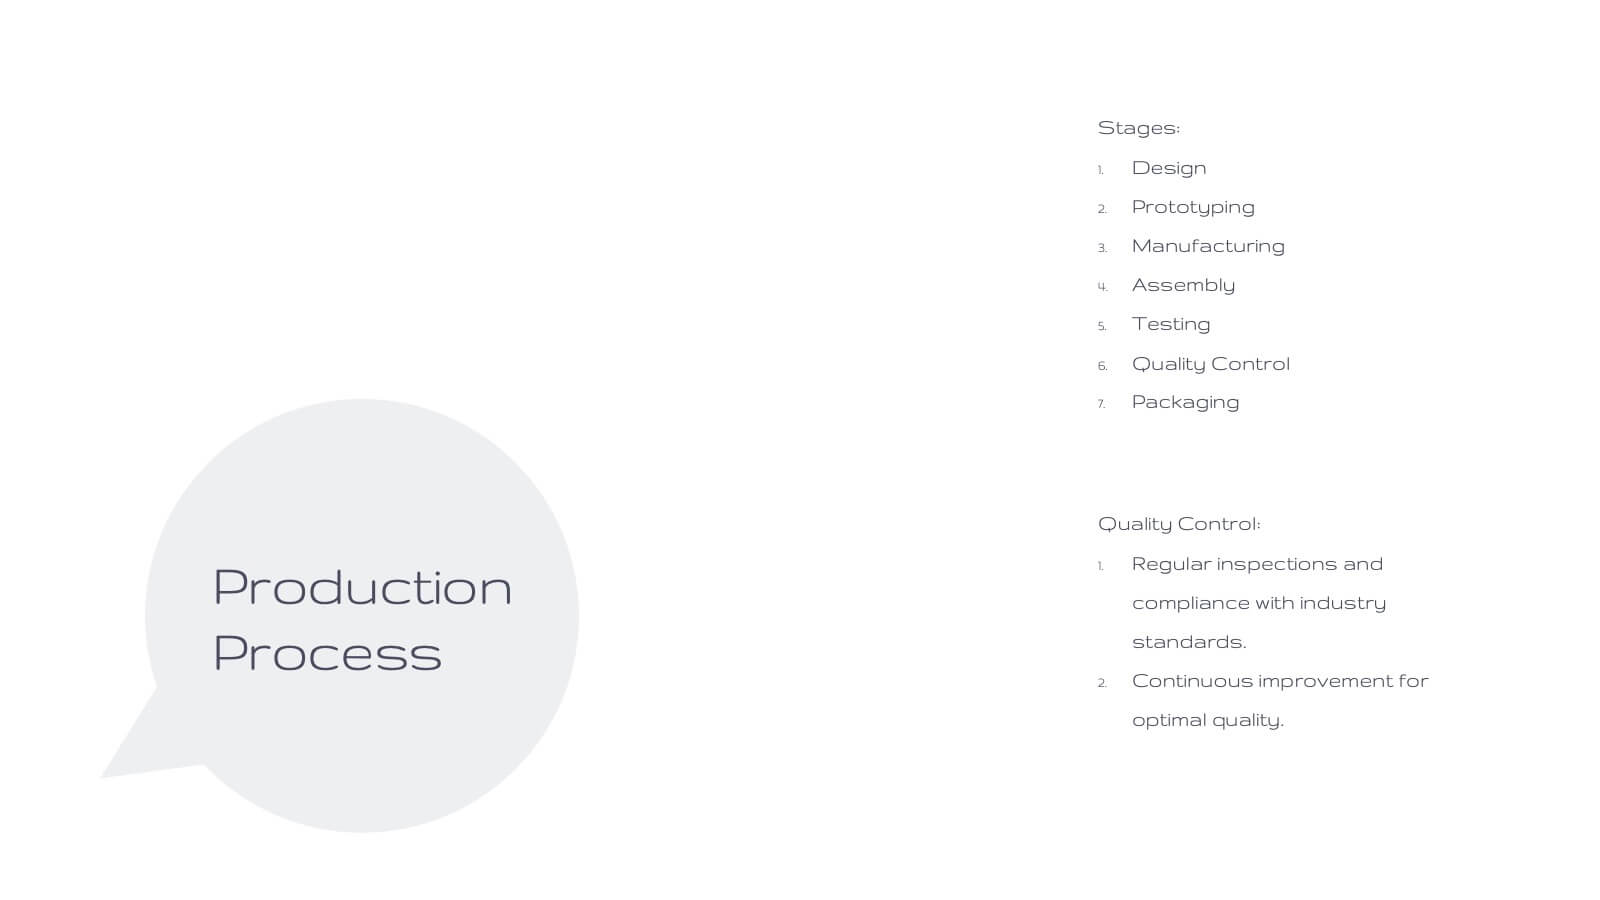
Unity New Product Proposal Presentation
Unveil your product strategy with this modern, comprehensive template! Highlight your company overview, product features, and unique selling proposition. Perfect for presenting market analysis, pricing strategy, and technical specifications. Ideal for product managers and developers. Compatible with PowerPoint, Keynote, and Google Slides.

21 diapositivas
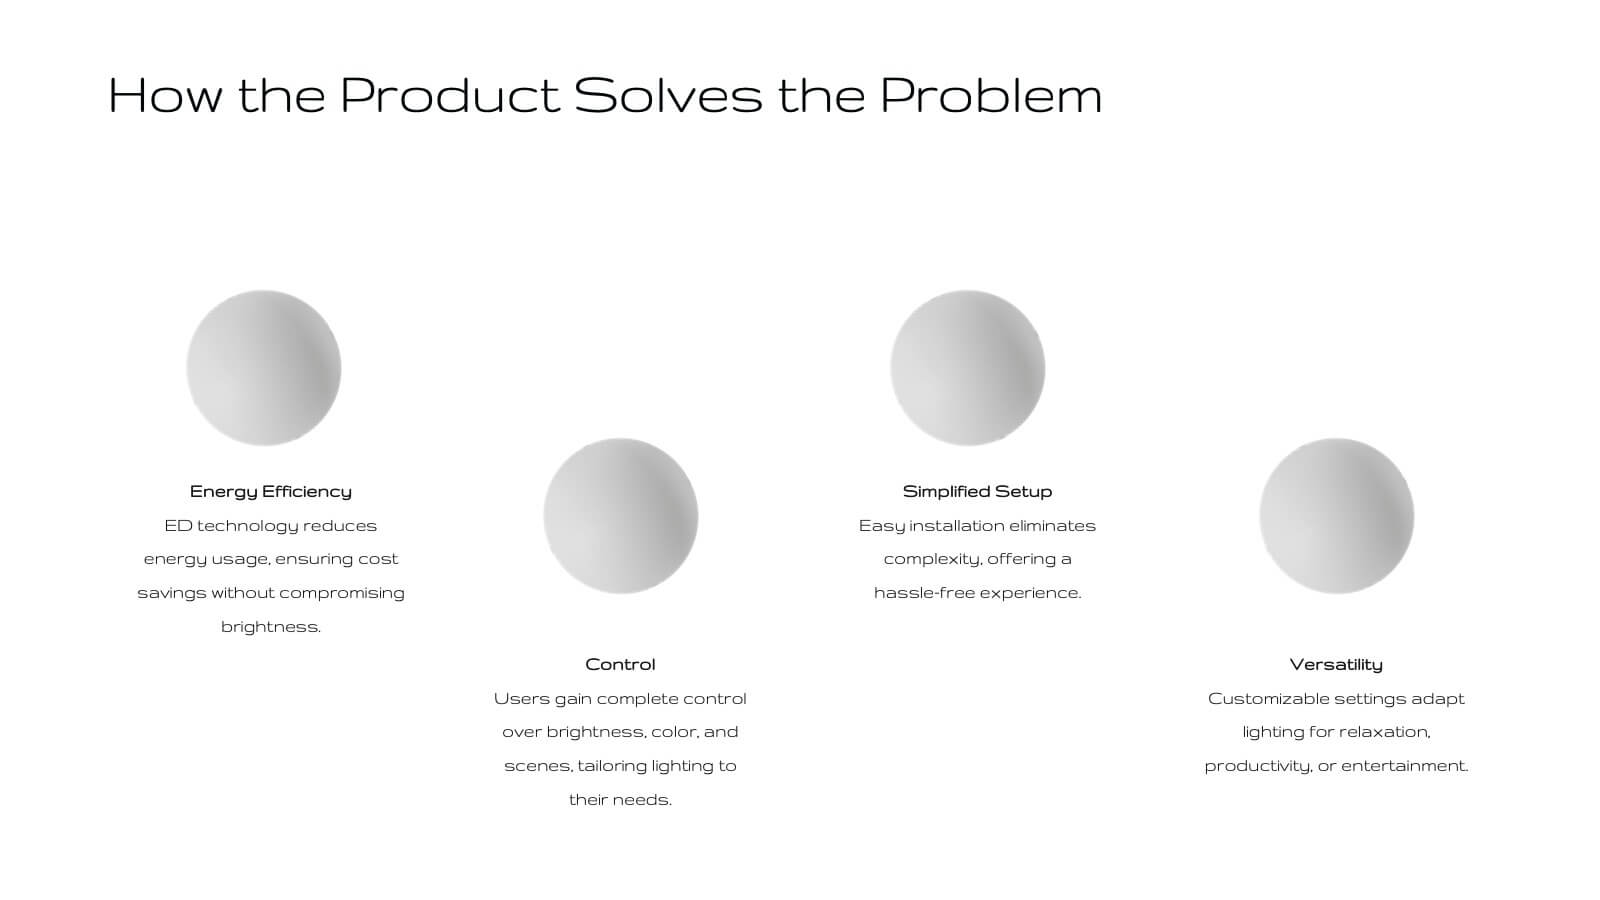
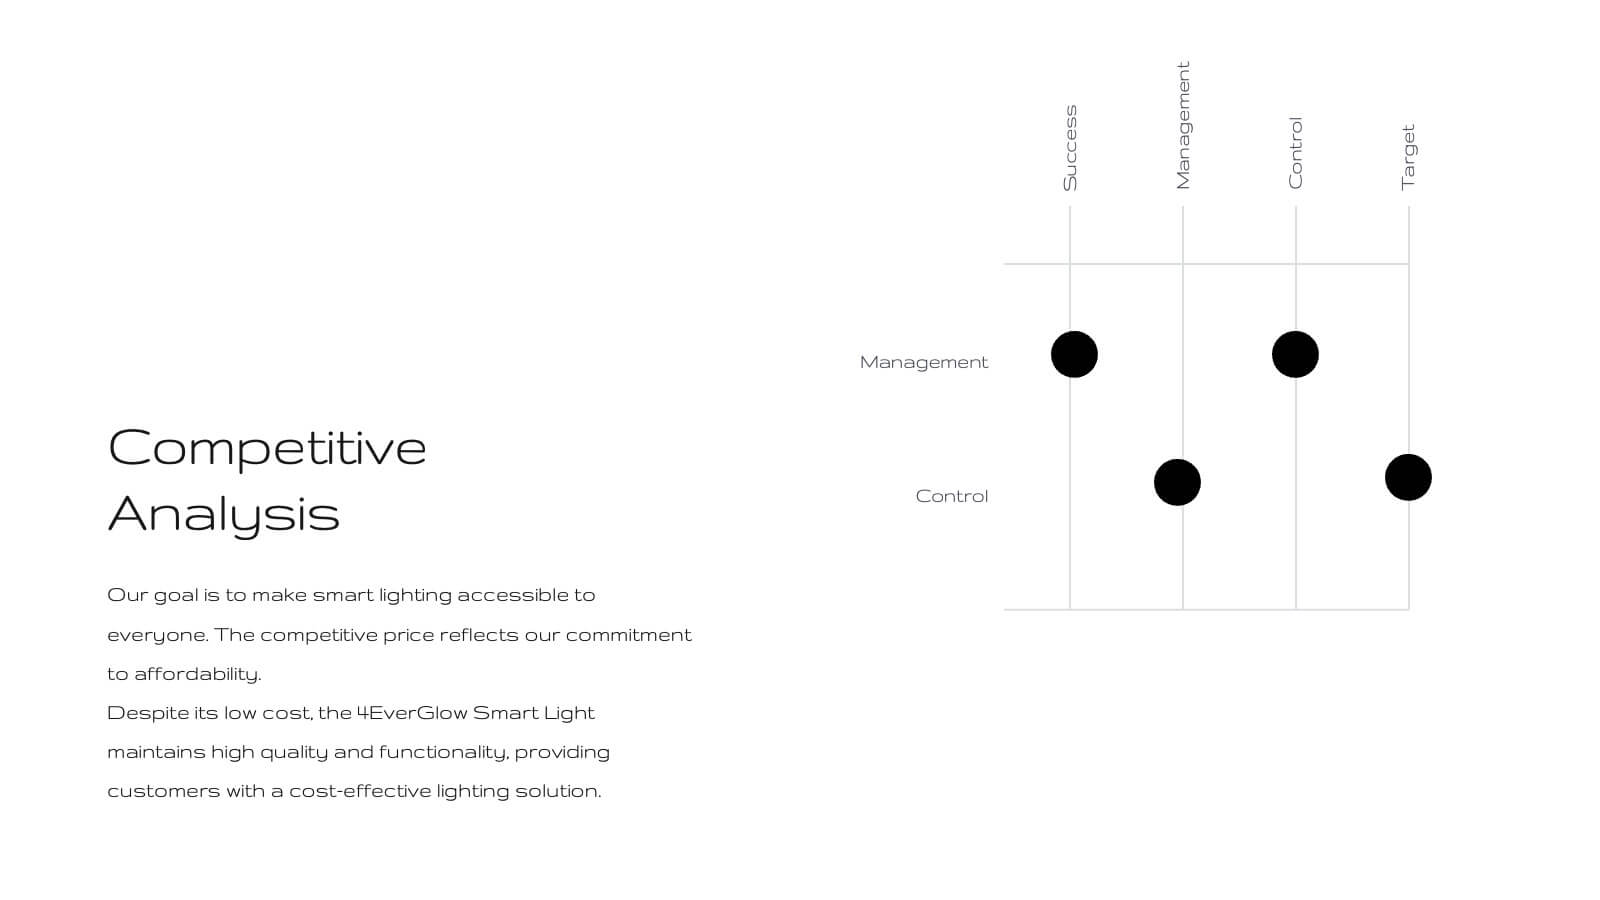
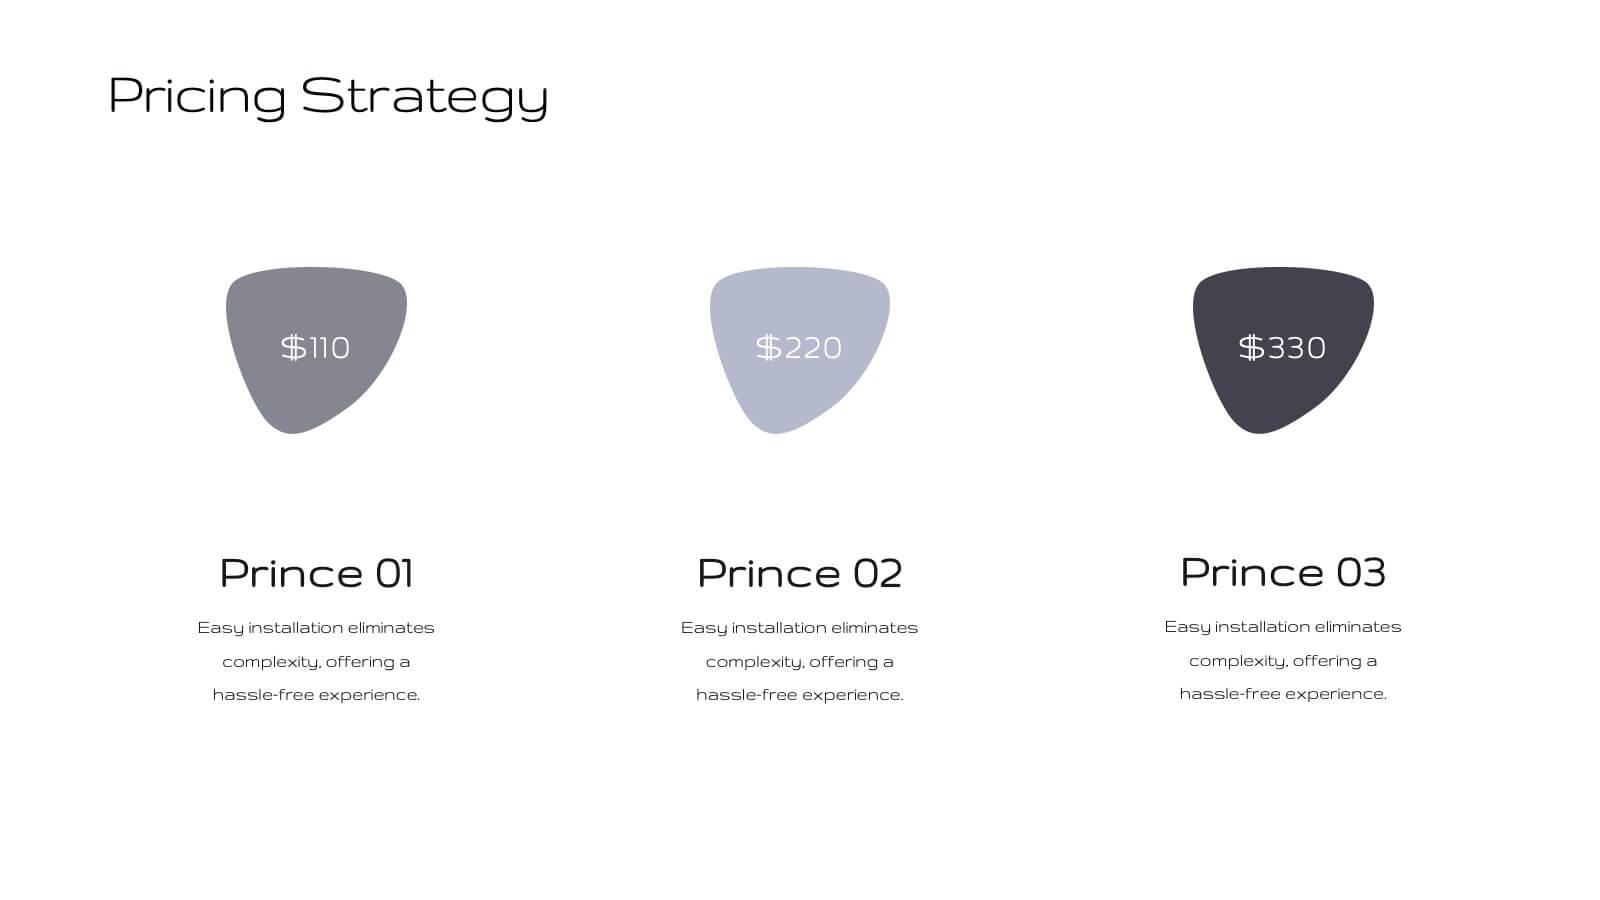
Fortuna Product Development Plan Presentation
Unveil your product's potential with this elegant, minimalist presentation template. Perfect for detailing product development, features, and market strategies, it features a clean design that emphasizes clarity and professionalism. Highlight key aspects like customer pain points, competitive analysis, and pricing strategies to captivate your audience. Compatible with PowerPoint, Keynote, and Google Slides, it ensures seamless presentations on any platform.


4 diapositivas
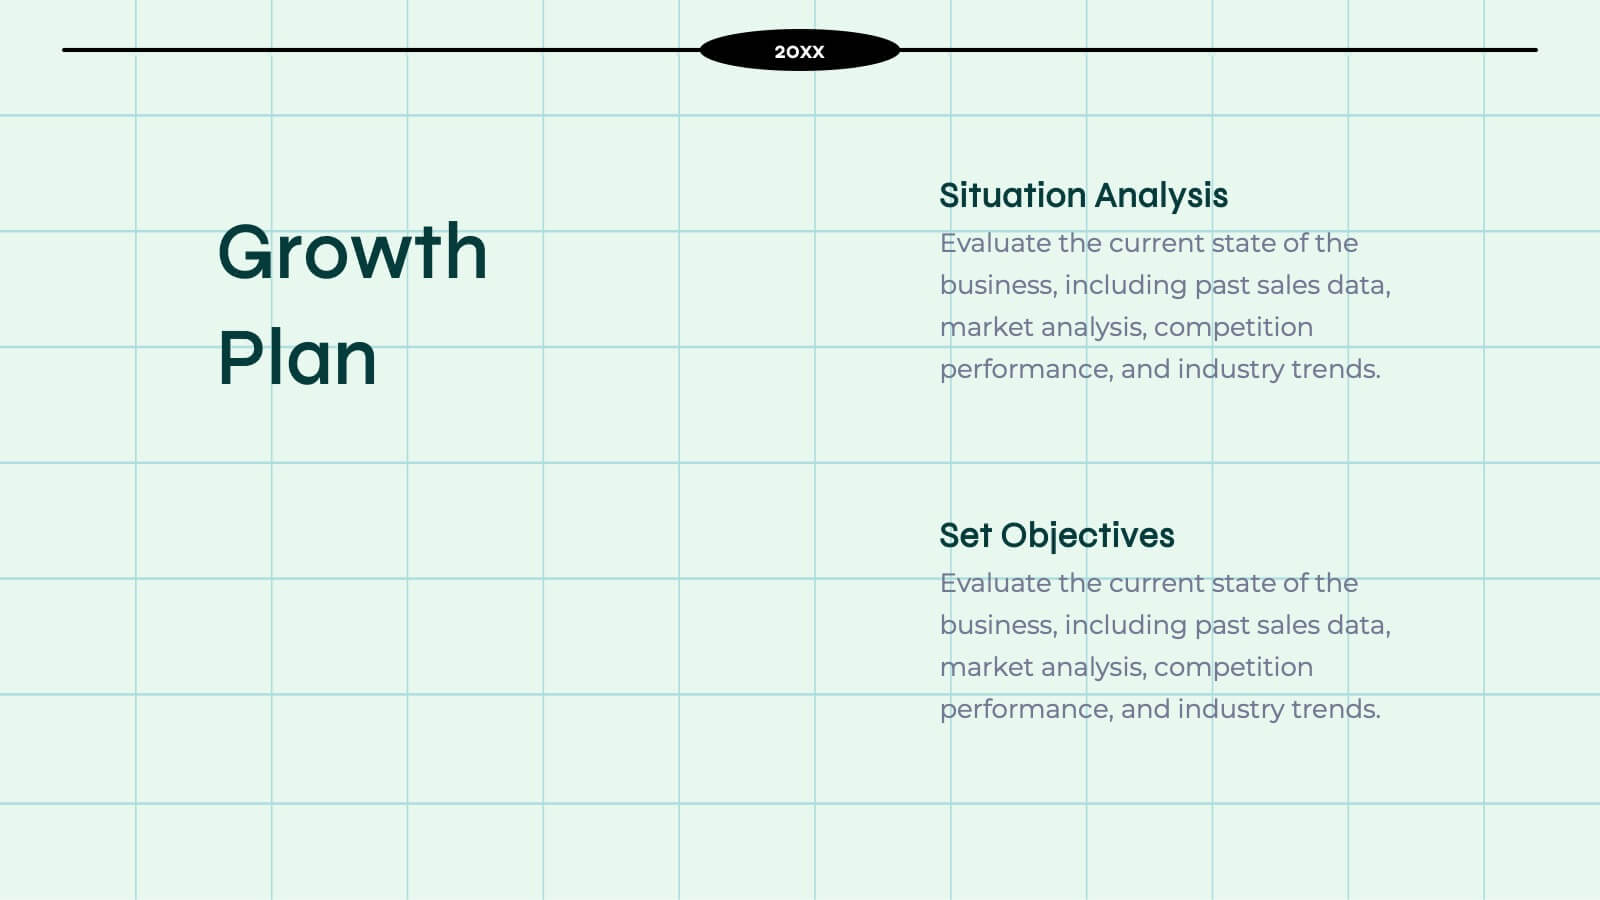
Identifying Performance Gaps
Clearly showcase the steps needed to bridge critical performance gaps with this modern template. Ideal for strategic planning, business reviews, and goal-setting sessions. Highlight each stage of growth with dynamic visuals. Fully customizable for PowerPoint, Keynote, and Google Slides.


7 diapositivas
E-Learning Solutions Infographic
Elevate the e-learning experience with our E-Learning infographic. Featuring a harmonious blend of serene purple and crisp white, this infographic encapsulates the transformative world of digital learning. Tailored for educators, e-learning consultants, and instructional designers, it vividly illustrates the nuances of online education. Incorporated within are ingenious graphics, relevant icons, and dedicated image placeholders, all set to anchor your content and enhance comprehension. Regardless of your preferred platform – PowerPoint, Keynote, or Google Slides – this template is your tool to effectively convey the dynamism of e-learning.


5 diapositivas
Breast Cancer Awareness Day
Raise awareness and educate with this visually impactful Breast Cancer Awareness Day template. Featuring circular infographic elements styled in a breast tissue-inspired layout, this slide design is ideal for campaigns, health education, corporate wellness events, and social initiatives. Each section can be customized with key data, statistics, or actionable messages. Fully editable in PowerPoint, Keynote, and Google Slides.