


Características


¿Tienes alguna pregunta?
Recomendar


6 diapositivas
Stakeholder Analysis and Engagement
Effectively map out internal and external stakeholders with this structured hexagon-based layout. This presentation highlights six key groups—Employee, Manager, Shareholder, Society, Media, and Customer—centered around your company. Ideal for corporate strategy, stakeholder engagement, or CSR planning. Fully customizable in PowerPoint, Keynote, and Google Slides.


6 diapositivas
Investment Property Infographics
Step into the world of real estate with enthusiasm! This infographic opens doors to a wealth of opportunities. From the allure of rental income to the tax advantages that can boost your financial gains, we unveil the secrets that make investment properties a wise choice. Becoming a successful investor requires knowing the terrain. Dive into the nuances of property location, type, and market conditions. Gain insights into financing options, from traditional mortgages to innovative strategies. Uncover the art of property valuation, where location, condition, and appreciation potential hold the keys to your success. With this engaging infographic compatible with PowerPoint, Keynote, and Google Slides, sharing your real estate wisdom has never been easier. Empower yourself with the knowledge to unlock the potential of investment properties and set sail on a journey towards financial freedom.


6 diapositivas
Stock Market Investment and Analysis Presentation
Showcase your market insights with this dynamic zigzag arrow diagram—perfect for highlighting bullish vs. bearish trends, financial analysis, and investment milestones. The slide features a split-path layout with icons and editable text areas to clearly compare strategies or illustrate turning points. Fully customizable in PowerPoint, Keynote, and Google Slides.


5 diapositivas
Employee Benefits and Compensation Presentation
Effectively communicate your company’s value proposition with this Employee Benefits and Compensation Presentation. This clean and professional diagram highlights four key benefit categories in a circular flow, perfect for HR teams, onboarding materials, or internal strategy reviews. Easily editable in PowerPoint, Keynote, or Google Slides, it's ideal for showcasing wellness perks, bonuses, insurance, and more.


5 diapositivas
Business Comparison Infographics
Elevate your business presentations with our business comparison infographics, the perfect tool for showcasing competitive analysis. In a striking array of orange and red tones, these infographics are designed to command attention. Entrepreneurs, business analysts, and students of business studies can leverage this template. Compatible with Powerpoint, Keynote, and Google Slides. Its creative style integrates compelling graphics and icons, simplifying complex data into digestible, engaging visuals. Ideal for meetings, or educational content, these infographics offer a clear, comparative insight, empowering informed business decisions.


34 diapositivas
Founder Startup
A Founder Startup, is a newly established business venture that is typically founded by one or more individuals or groups with an innovative idea, concept, or product. This template is designed to help you create a professional and compelling presentation that showcases your startup and its founders in a impactful way. Compatible with PowerPoint, Keynote, and Google Slides. Included in this template are a variety of pre-designed slides that will help cover different aspects of your startup, such as team introduction, overview, vision and mission, product or service description, market analysis, financials, and more.


22 diapositivas
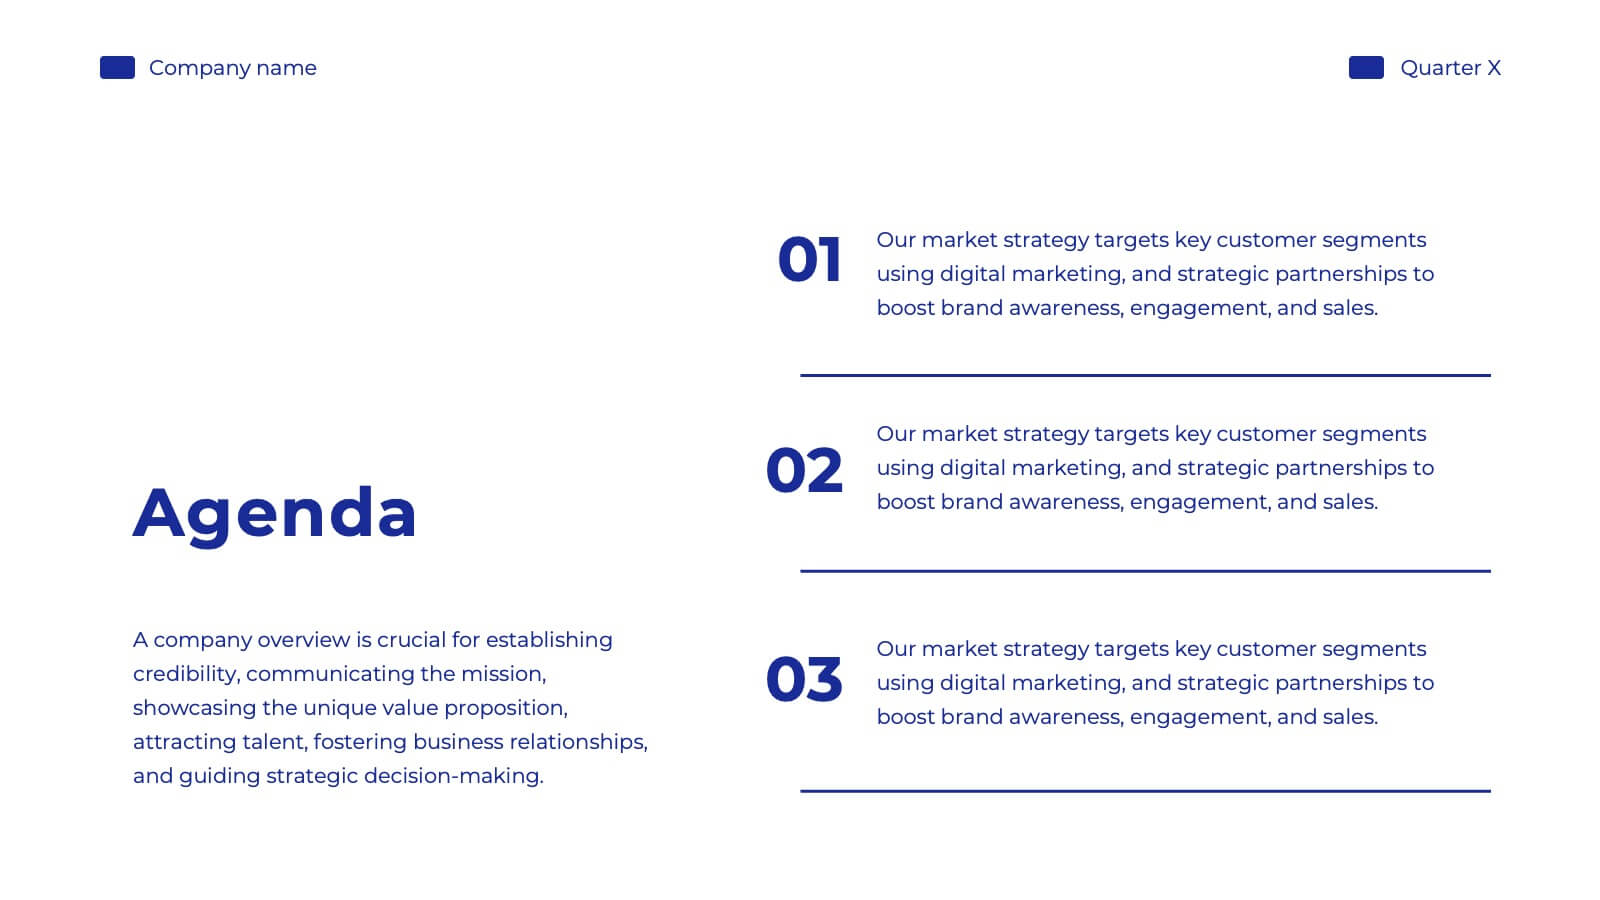
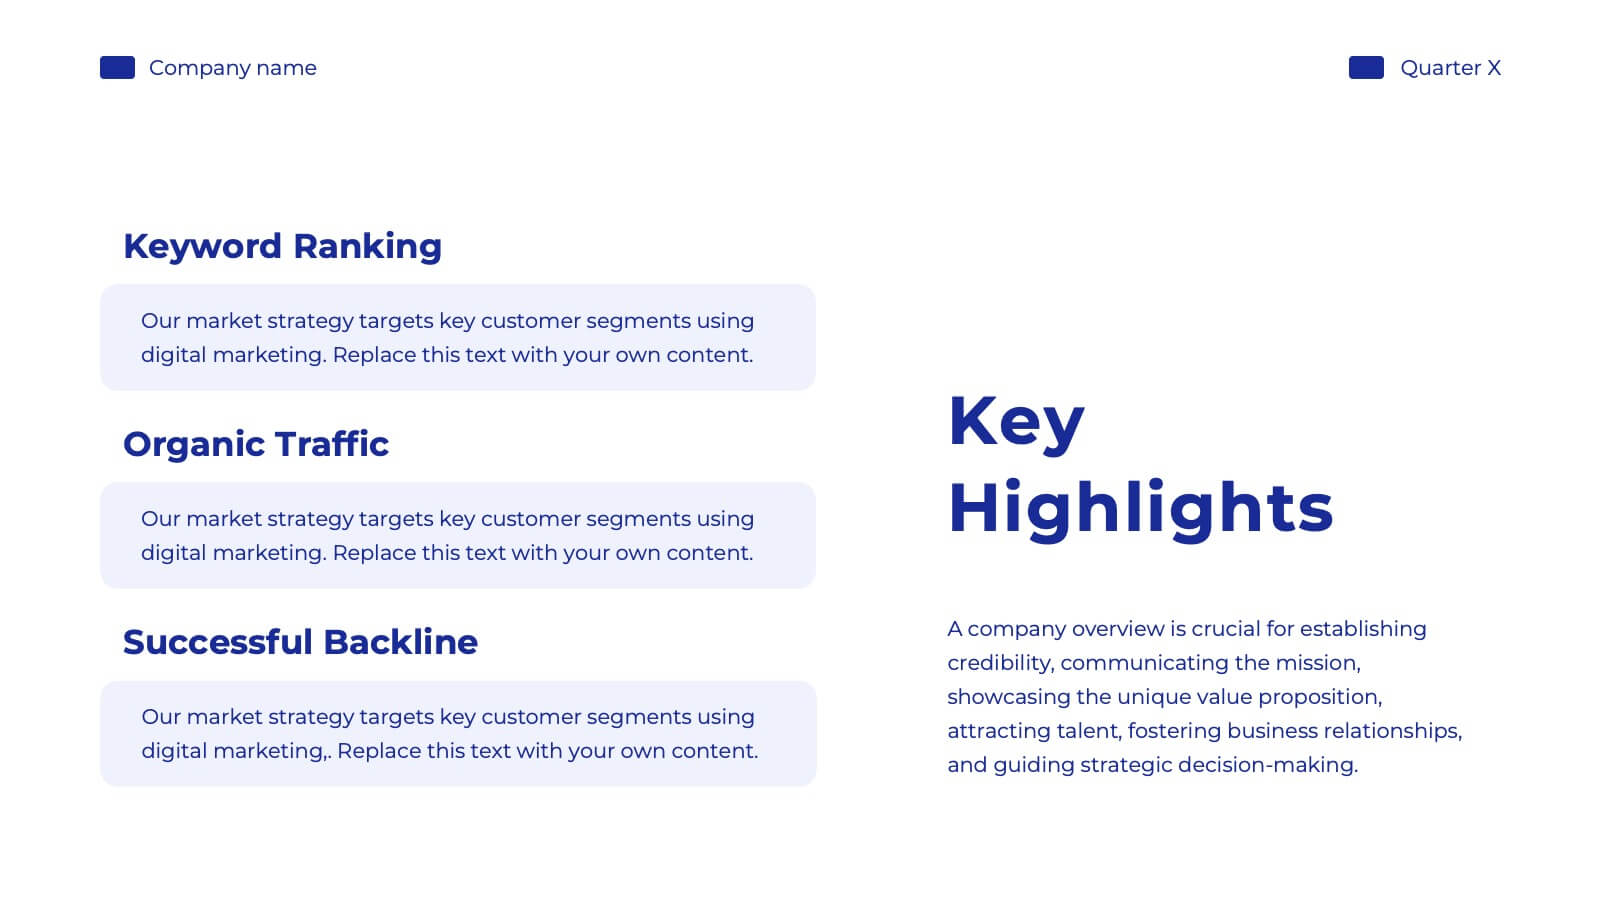
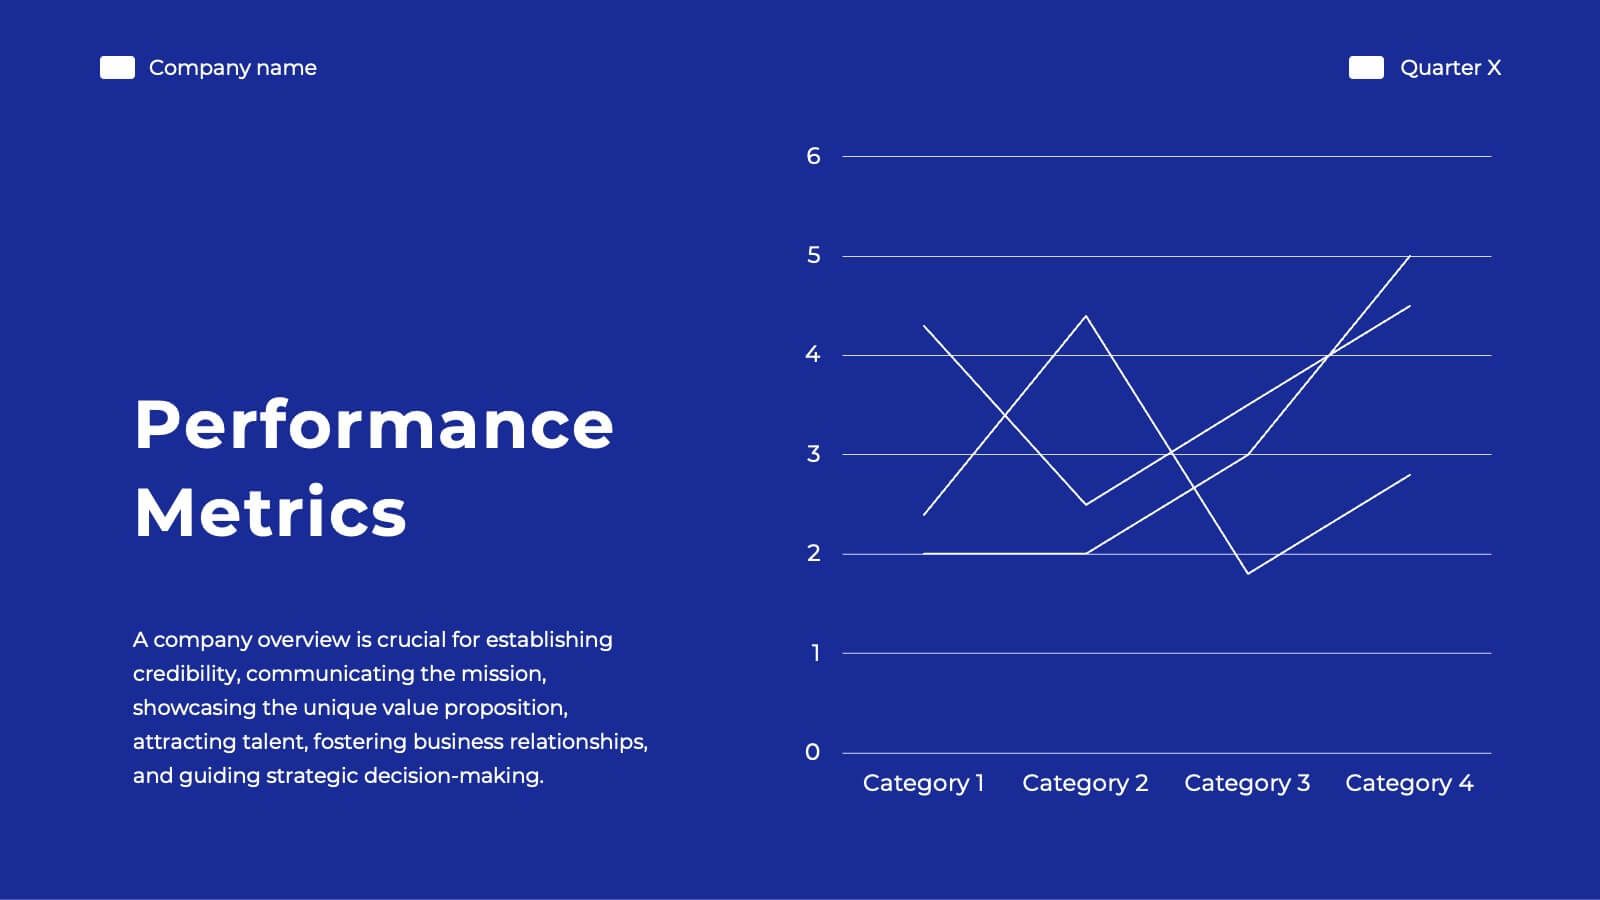
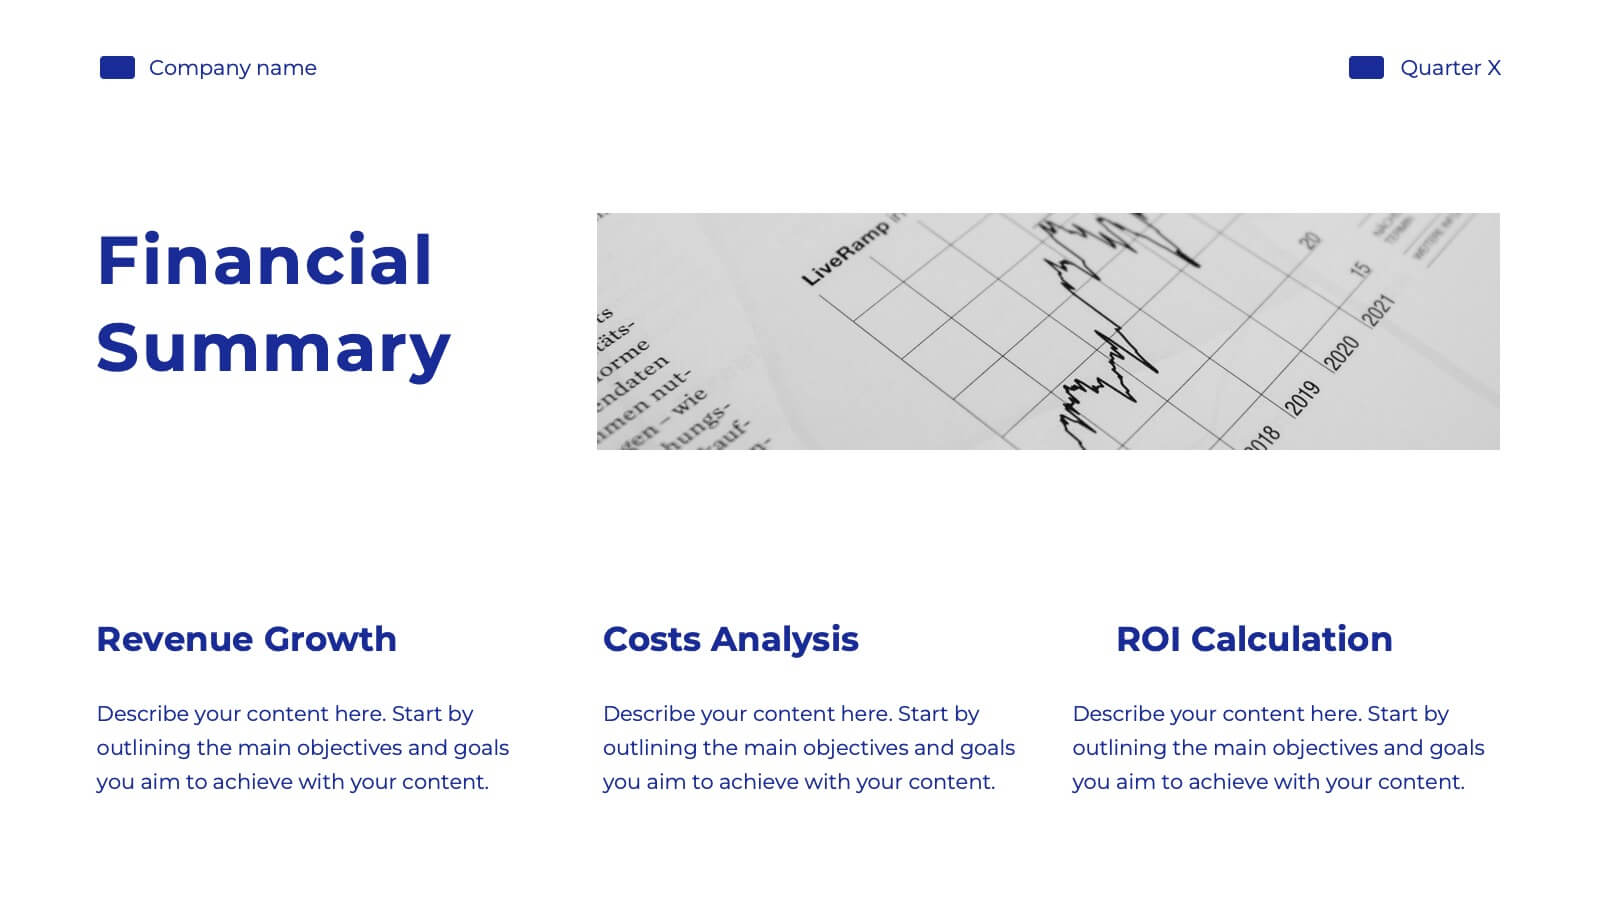
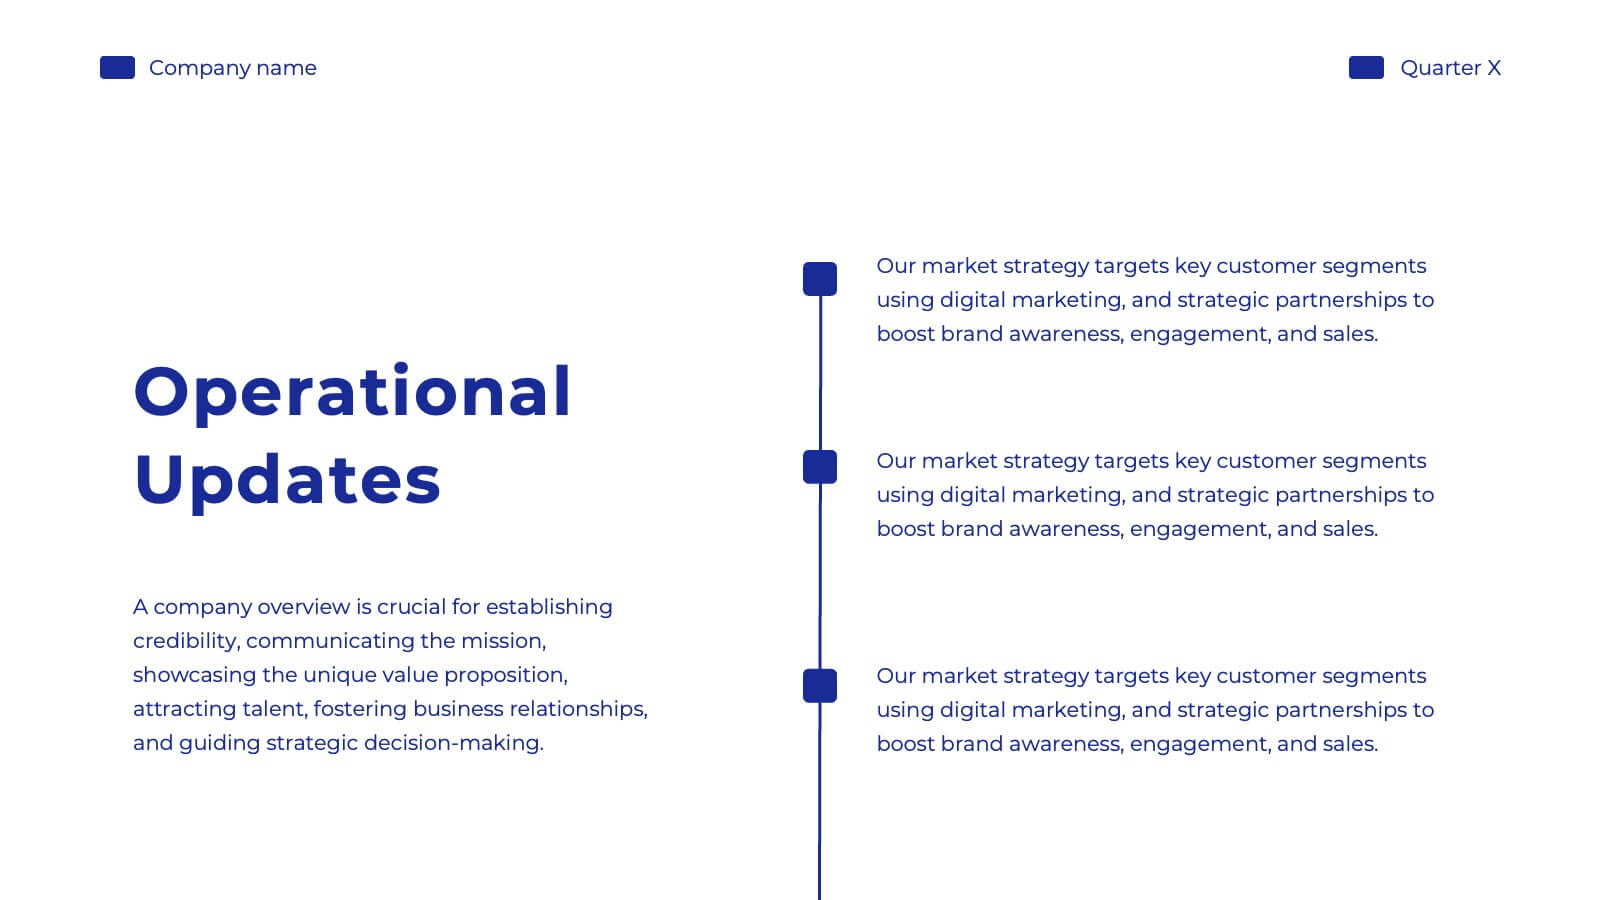
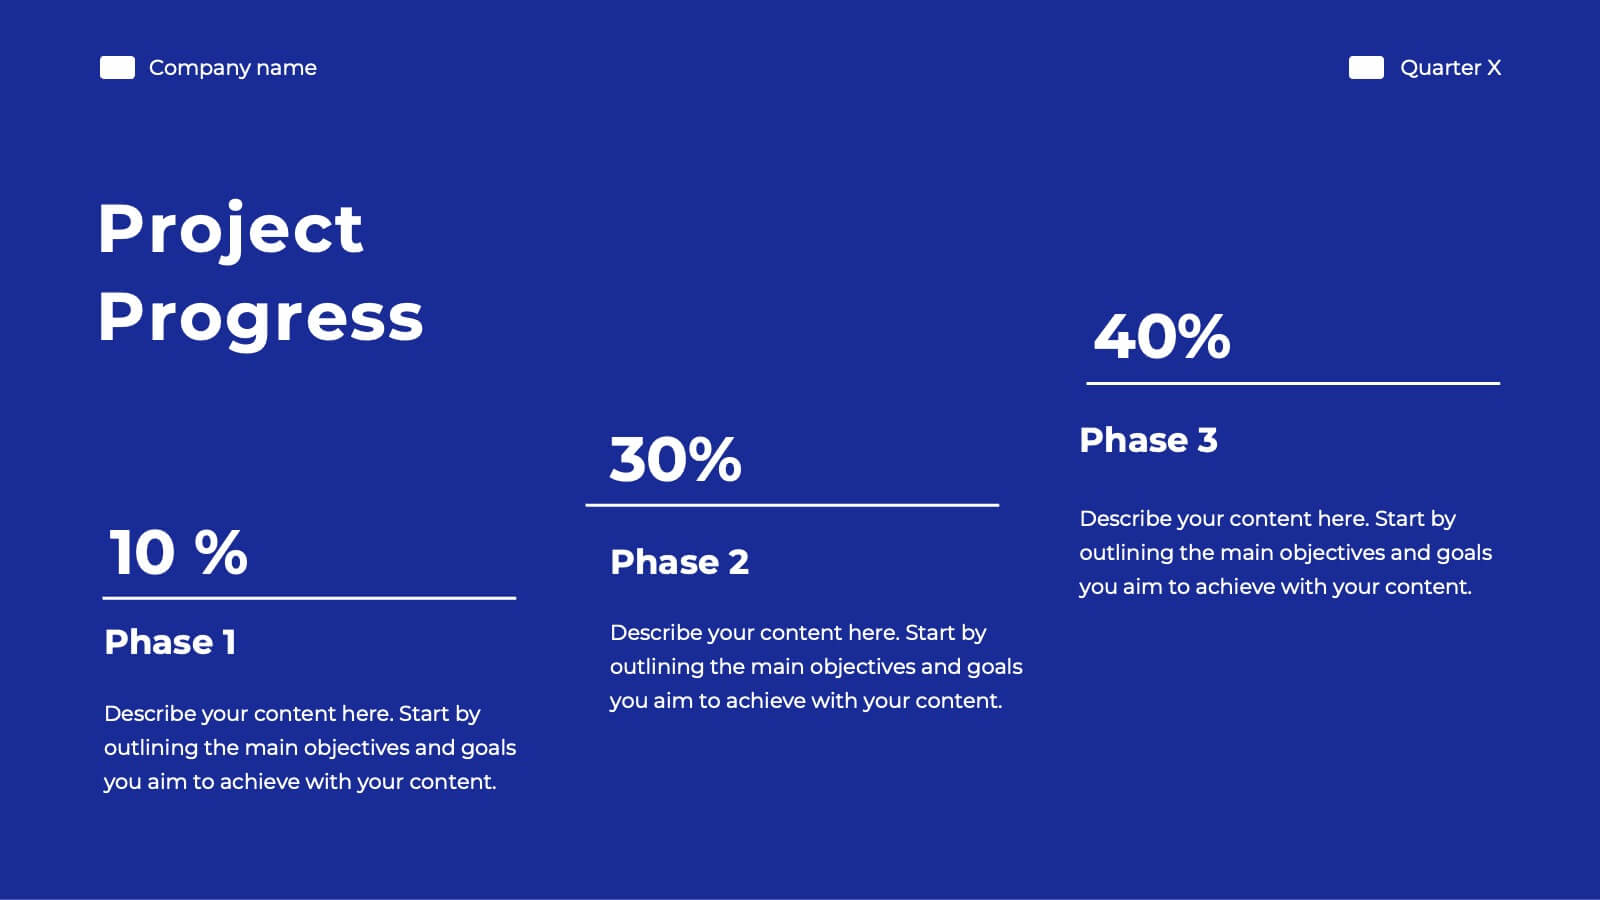
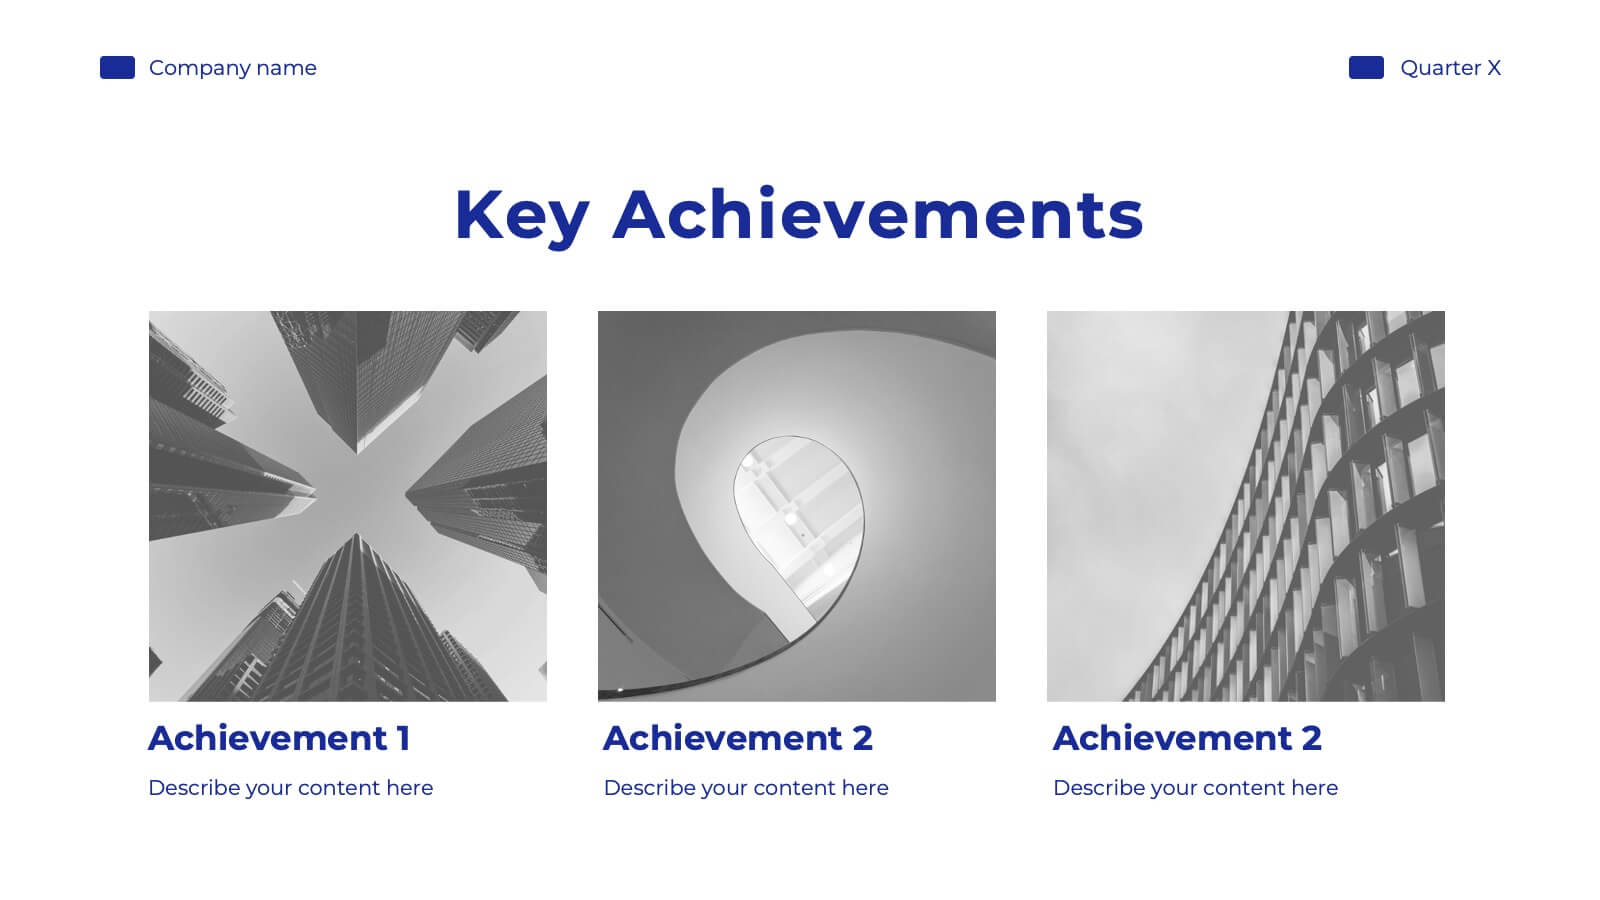
Frost Financial Report Presentation
Transform your brand with this comprehensive rebranding project template! Perfect for presenting brand identity, market analysis, and strategic positioning, it includes slides for logos, color palettes, and brand guidelines. Engage your audience with visually striking designs and detailed content. Compatible with PowerPoint, Keynote, and Google Slides for easy, professional presentations on any platform.


26 diapositivas
Construction Engineering Dark Presentation
Elevate your project narratives with our construction engineering dark presentation template, tailored specifically for industry professionals who desire clarity and precision. This template, steeped in dark shades complemented by stark orange and green accents, offers a sophisticated canvas for your plans. It's an essential asset for construction engineers and contractors seeking to outline project scopes, or innovative engineering solutions. Compatible with Powerpoint, Keynote, and Google Slides. Included are purposeful graphics and technical icons, all arranged to underscore your presentation's professionalism and comprehensive nature.


7 diapositivas
Growth Infographics Presentation Template
Our Growth Infographic template is a minimal modern design that combines data analysis and professional presentation. The presentation contains a set of slides with various information texts for your topic. This template is compatible with powerpoint and allows you to customize the color schemes, which makes it suitable for any theme and image style. Showcase your company’s growth by using this infographic template. This template can be used as a promotional tool for your business or to show growth results in order to attract investors. This template is a high quality, dynamic presentation!


2 diapositivas
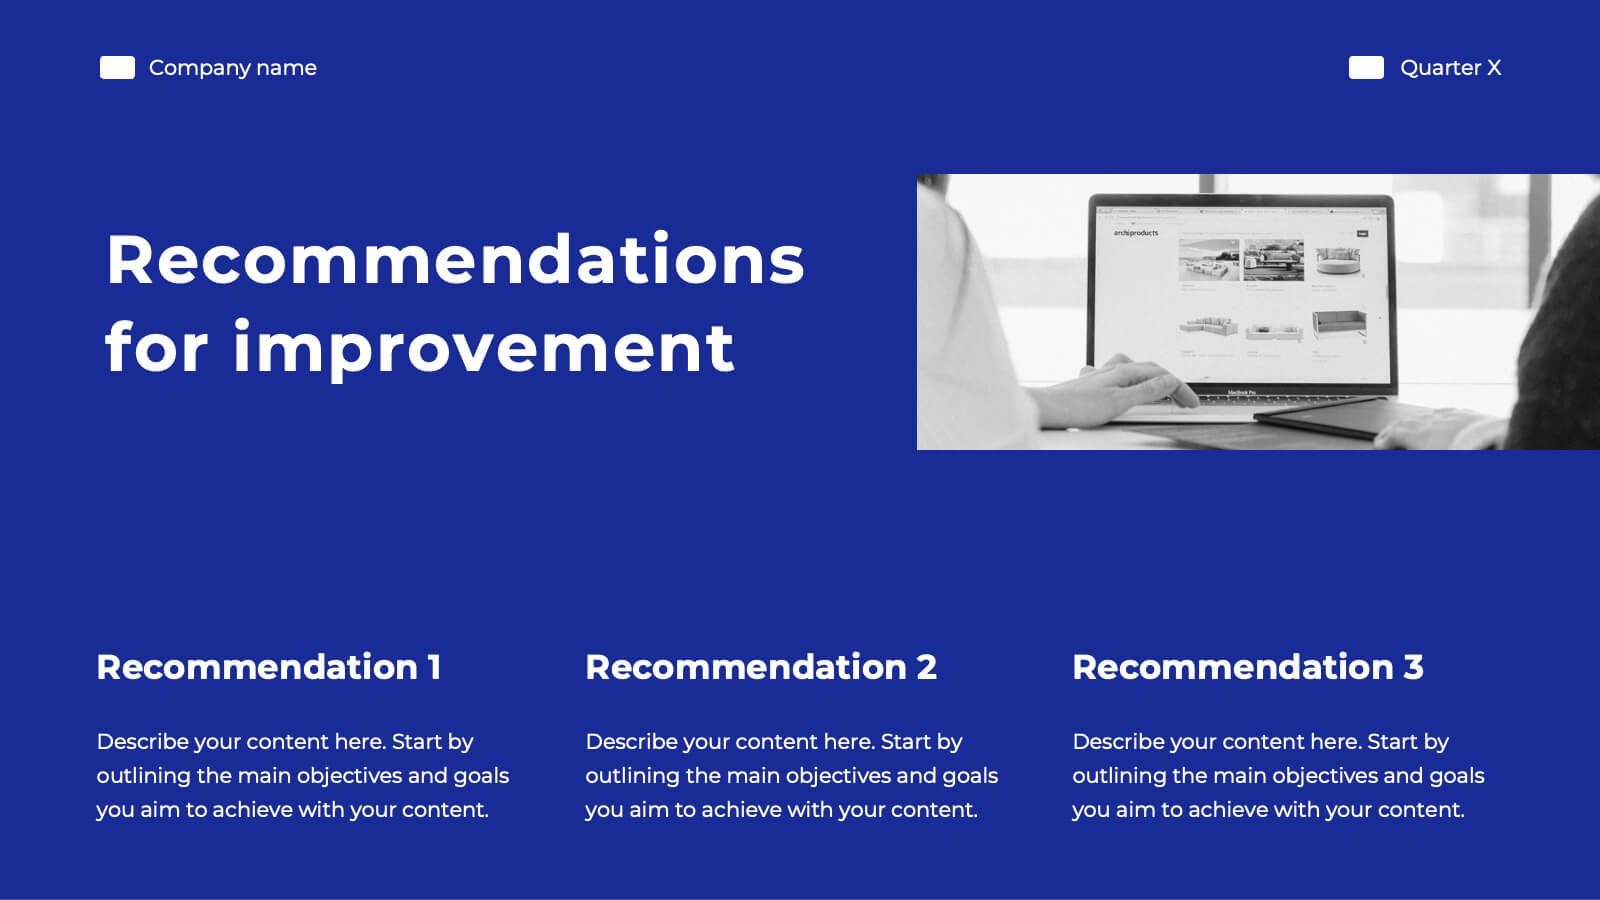
Website UI Mockup Device Display Presentation
Showcase your website's interface with the Website UI Mockup Device Display slide. This professional and modern layout features a desktop screen to elegantly present your web design, user interface, or digital product. Perfect for designers, developers, and marketing presentations. Fully editable and compatible with PowerPoint, Keynote, and Google Slides.


6 diapositivas
Industry Analysis Porter's 5 Forces Presentation
Analyze industry competition with this Porter's Five Forces template! This structured layout visually breaks down key factors like buyer power, supplier influence, competitive rivalry, new market entrants, and substitution threats, making it ideal for strategic planning and market assessments. Fully customizable and compatible with PowerPoint, Keynote, and Google Slides.


5 diapositivas
The Problem of Food Waste Infographics
Food Waste refers to any food that is discarded or lost along the food supply chain, from production to consumption. These vertical infographics are designed to cover the problem of food waste and can be designed to highlight statistics and facts about the issue. This infographic can be used to show how much food is wasted annually and the negative impact that this waste has on the environment. In the text boxes provide tips for reducing food waste, such as buying only what you need, storing food properly, and using leftovers creatively. Included are engaging visuals, such as icons and illustrations, and a clear layout.


10 diapositivas
Agile Scrum Framework Presentations
Kickstart your workflow with a clear, energetic layout designed to simplify complex processes and highlight each stage of your agile cycle. This presentation explains how iterative teamwork, transparency, and fast delivery shape efficient project management. Clean visuals guide viewers through structured steps. Compatible with PowerPoint, Keynote, and Google Slides.


26 diapositivas
Home Solar Power System Presentation
Harness the incredible power of the sun and transform your home with our vibrant and detailed presentation on home solar power systems! Discover the benefits and functionalities of solar energy, designed to help you understand how solar panels work, their environmental impact, and cost savings. Our engaging template covers essential topics like installation processes, efficiency comparisons, and maintenance tips. It includes a variety of infographics, charts, and diagrams to illustrate complex information clearly and effectively. Perfect for homeowners, energy consultants, or anyone interested in sustainable living, this template offers a visually appealing and informative guide to adopting solar power. Customize each slide to fit your needs, whether you're presenting to a small group or a large audience. Compatible with PowerPoint, Keynote, and Google Slides, this template ensures a smooth and professional presentation experience. Ideal for showcasing the future of clean energy and encouraging the switch to renewable resources.


7 diapositivas
Innovation Infographics Presentation Template
Our innovation Infographic template is a trendy and professional way to present innovation to your audience in a way that keeps them engaged. This design features simple yet striking elements which will deliver your message, while the font and color scheme gives you that flexibility to personalize this template to your brand’s identity. We have designed this presentation template to help you create and deliver engaging content for your audience. It is a powerful tool that helps you build interest, generate leads and position yourself as an authority on the subject of innovation.


6 diapositivas
Business Plan Steps Infographic
A business plan is a written document that outlines the goals, strategies, and financial projections of a business. This infographic template is designed to serves as a roadmap for the organization, providing a comprehensive overview of how the business will operate and achieve its objectives. This infographic outlines the key steps involved in creating a comprehensive business plan. The template provides tips on presenting the business plan in a professional and visually appealing manner. It incorporates visuals to support key points, and organizing the document with headings, subheadings, and bullet points for readability.


4 diapositivas
Project Responsibility Assignment Matrix Presentation
Visualize team roles and task accountability at a glance with this Project Responsibility Assignment Matrix. This structured layout categorizes assignments using the RACI model—Responsible, Accountable, Consulted, and Informed—organized by team and position. Ideal for project managers, team leads, and operations planners, it helps ensure clarity, reduce overlap, and promote accountability across departments. Easily editable in PowerPoint, Keynote, and Google Slides for seamless customization and cross-platform use.