


Características


¿Tienes alguna pregunta?
Recomendar


4 diapositivas
Marketing Plan Overview
Visualize your marketing cycle with this clean, three-stage arrow diagram. Each segment—labeled A, B, and C—represents a key phase in your marketing strategy, making it ideal for campaign planning, product launches, or promotional timelines. Fully editable in PowerPoint, Keynote, and Google Slides for effortless customization.


2 diapositivas
Stylish Title Cover Presentation for Reports Presentation
Set the tone with a title slide that means business—without being boring. This stylish cover layout gives your report presentations a polished, modern look while keeping the focus clear and professional. Ideal for executive updates or client-facing decks, it’s fully editable and works perfectly in PowerPoint, Keynote, and Google Slides.


5 diapositivas
Likelihood vs Impact Risk Matrix Presentation
Clearly prioritize your risks with the Likelihood vs Impact Risk Matrix Presentation. This intuitive grid layout lets you map potential threats based on severity and probability, helping teams focus on what matters most. Ideal for strategic planning, audits, and project risk reviews. Editable in PowerPoint, Canva, Keynote, and Google Slides.


3 diapositivas
Project Proposal Executive Summary
Summarize your project proposal with clarity and visual appeal using this clean executive slide. Highlight key metrics, growth indicators, and progress updates alongside a modern photo layout that keeps your audience engaged. This template is fully customizable and compatible with PowerPoint, Keynote, and Google Slides for easy, polished presentations.
3 diapositivas
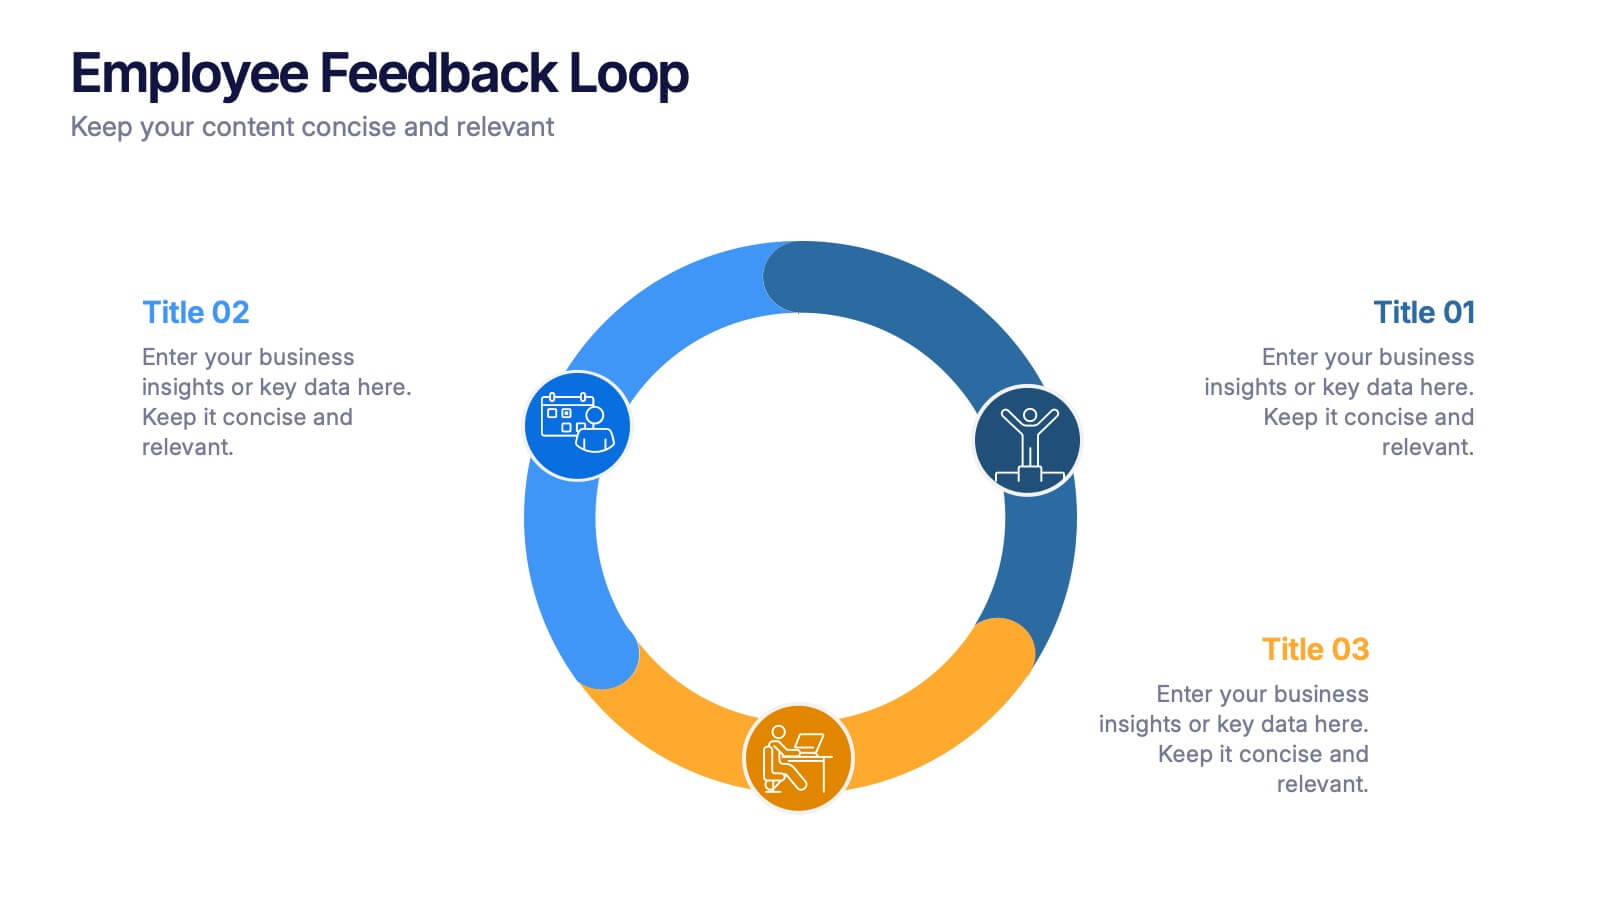
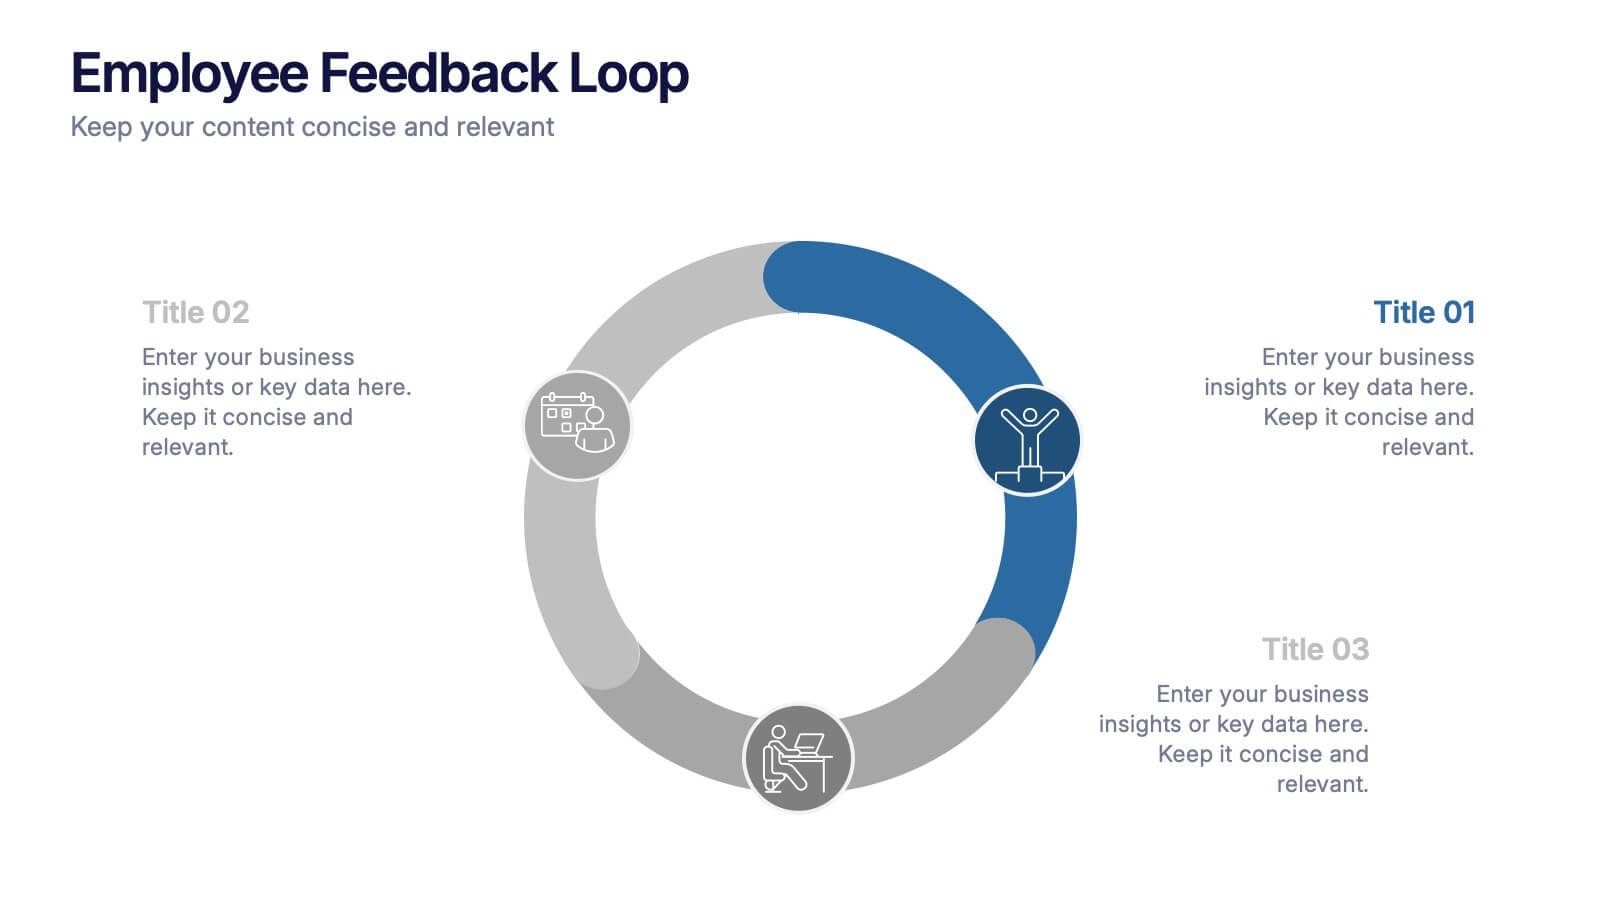
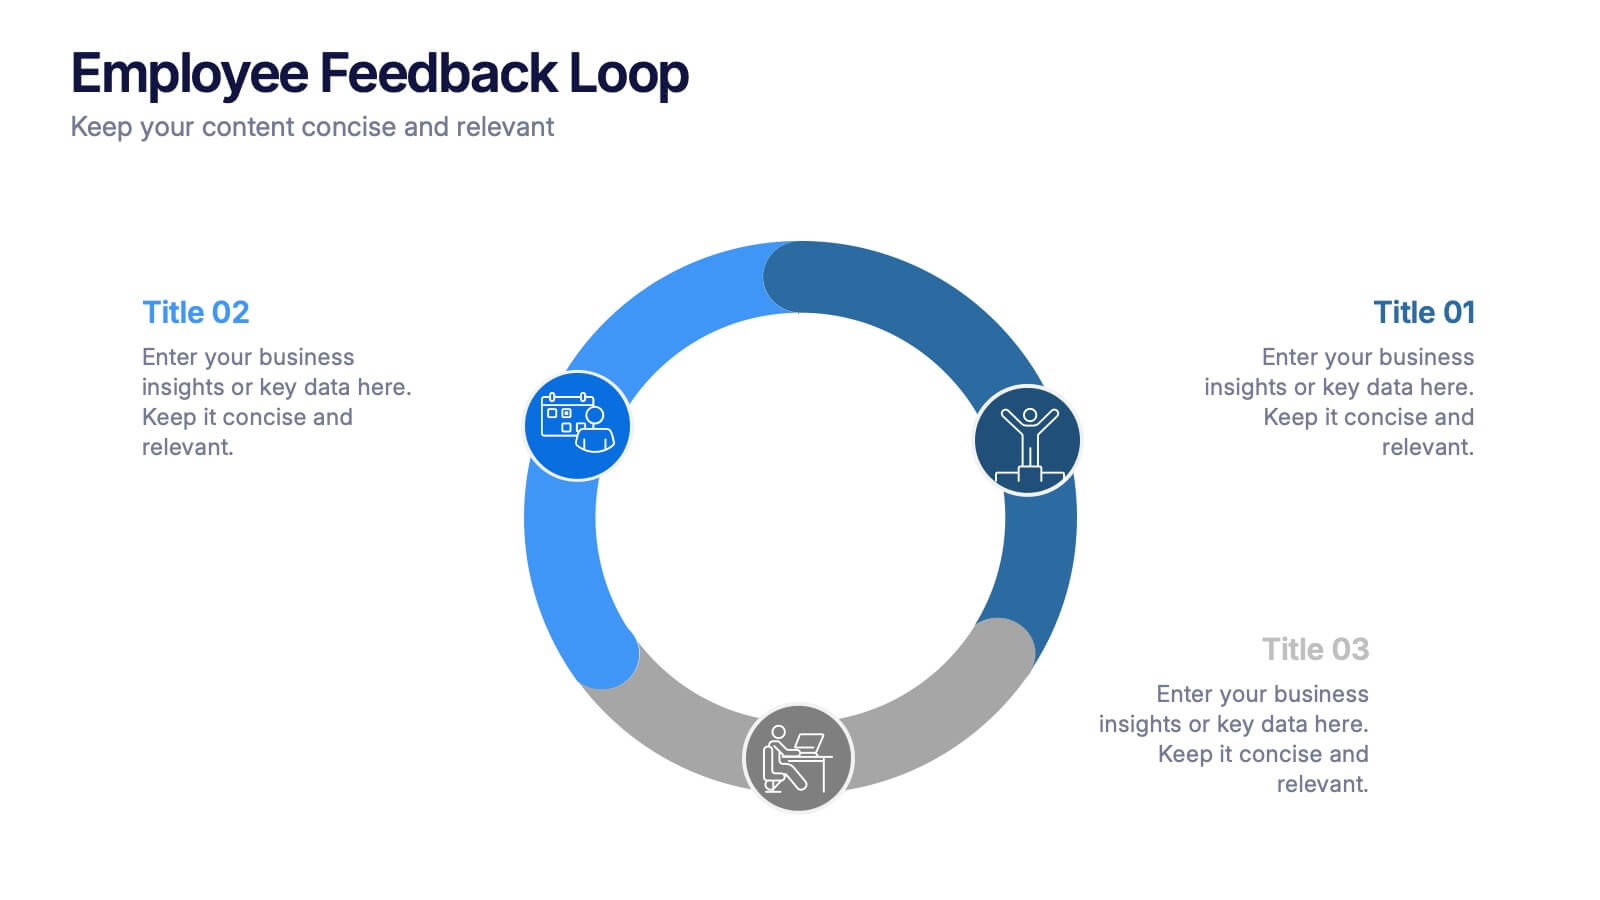
Employee Feedback Loop Presentation
Keep your team connected and continuously improving with this engaging presentation design. Ideal for showcasing communication strategies, feedback cycles, and performance insights, it helps visualize the process of collecting and acting on employee input. Fully customizable and compatible with PowerPoint, Keynote, and Google Slides for effortless, professional presentations.


10 diapositivas
Creative Business Pitch Deck Presentation
Make your ideas stand out with a presentation that blends creativity and professionalism. Perfect for entrepreneurs and teams showcasing innovative business concepts, it helps structure your pitch with clarity and impact. Fully customizable and compatible with PowerPoint, Keynote, and Google Slides for seamless editing and polished results.


5 diapositivas
Asia Geographic and Business Analysis Map Presentation
Gain a strategic edge with the Asia Geographic and Business Analysis Map template, designed to visualize market trends and demographic data across the region. Ideal for businesses, investors, and academics, it supports PowerPoint, Keynote and Google Slides. This adaptable template is perfect for presenting geographic data analyses and exploring regional business potentials.


5 diapositivas
Food Waste in School Infographics
Food Waste in schools is a significant issue that can have economic, environmental, and social impacts. These vertical infographics aim to raise awareness about the magnitude of the problem and provide actionable steps to reduce food waste in schools. These can be used as valuable tools to highlight the issue of food waste in school environments. The visually appealing illustrations, informative content, and color schemes make it effective for raising awareness and promoting sustainable practices in school environments. Compatible with Powerpoint, Keynote, and Google Slides.


5 diapositivas
Professional Business Proposal Presentation
Make your pitch stand out with a polished, minimal design that highlights every key stage of your business strategy. This clean visual layout is perfect for outlining project phases, services, or data-driven insights with clarity and impact. Fully compatible with PowerPoint, Keynote, and Google Slides for easy customization.


6 diapositivas
Virtual Meeting Best Practices Presentation
Master your online meetings with this sleek, illustrated layout featuring a character graphic and clear content blocks. Designed to share virtual etiquette, tools, or steps for effective communication, it’s ideal for remote team briefings and onboarding. Fully editable and compatible with PowerPoint, Keynote, and Google Slides.


8 diapositivas
3D Infographic Design Presentation
Make your data pop—literally—with a stacked design that brings depth and clarity to your message. This 3D infographic template helps break down layered concepts, step-by-step processes, or hierarchical data in a visually striking way. It’s fully customizable and compatible with PowerPoint, Keynote, and Google Slides for easy presentation building.


5 diapositivas
Regional Sales Heatmap Presentation
Showcase performance by region with this Regional Sales Heatmap Presentation. This template highlights U.S. state-by-state sales data using gradient color coding and a clear legend system. Easily customizable for quarterly reports, territory analysis, or sales strategy reviews. Compatible with PowerPoint, Keynote, and Google Slides.


10 diapositivas
4-Step Business Process Presentation
Present your ideas with clarity and impact using this clean, structured layout made for professionals who value organization and design. Perfect for outlining strategies, steps, or lists, it keeps your message focused and engaging. Easily customizable and fully compatible with PowerPoint, Keynote, and Google Slides for polished results.


7 diapositivas
Company Structure Infographic
Company structure, often referred to as organizational structure, outlines how a company is organized in terms of hierarchy, roles, responsibilities, and the flow of information. Discover the inner workings of your organization with our Company Structure Infographic. This visually captivating and informative infographic serves as a guide to understanding the hierarchical layout, roles, and relationships within your company. Compatible with Powerpoint, Keynote, and Google Slides. Illustrate the structure levels within the company, showcasing the roles and responsibilities at each level and how they contribute to the company's success.


5 diapositivas
Secure Cloud Storage and Access Presentation
Highlight your data protection strategy with the Secure Cloud Storage and Access presentation slide. Featuring a central cloud shield icon with five connected callouts, it’s perfect for illustrating encryption methods, access protocols, or compliance points. Fully editable in PowerPoint, Keynote, and Google Slides.

1 diapositiva
Success Roadmap and Personal Achievement Presentation
Visualize your path to success with the Success Roadmap and Personal Achievement Presentation. This stepwise layout guides your audience through key milestones, making it perfect for showcasing personal growth, career progression, or business achievements. Each step features a distinct icon and space for focused insights. Fully editable in Canva, PowerPoint, Keynote, and Google Slides.


6 diapositivas
Experience-Based Smile Indicator Slide
Visualize customer sentiment with the Experience-Based Smile Indicator Slide Presentation. Featuring a clean horizontal scale of five emotive icons—from delighted to dissatisfied—this slide is ideal for summarizing user experience, support ratings, or service feedback. Fully customizable in PowerPoint, Keynote, and Google Slides, it's a smart, visual way to display satisfaction levels.