


Características


¿Tienes alguna pregunta?
Recomendar


21 diapositivas
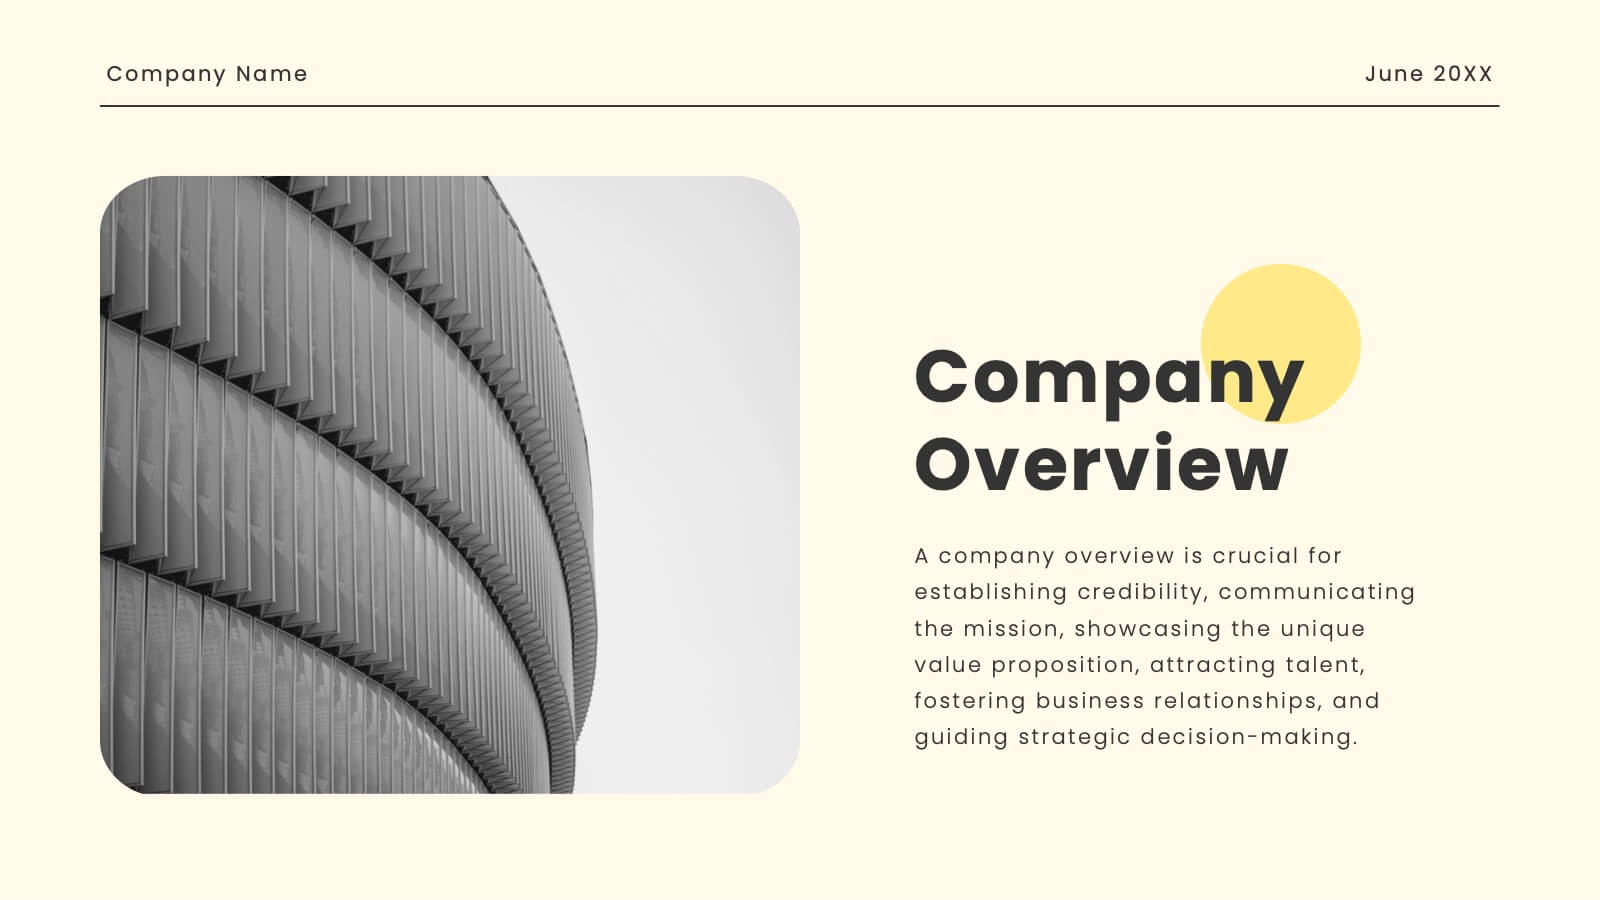
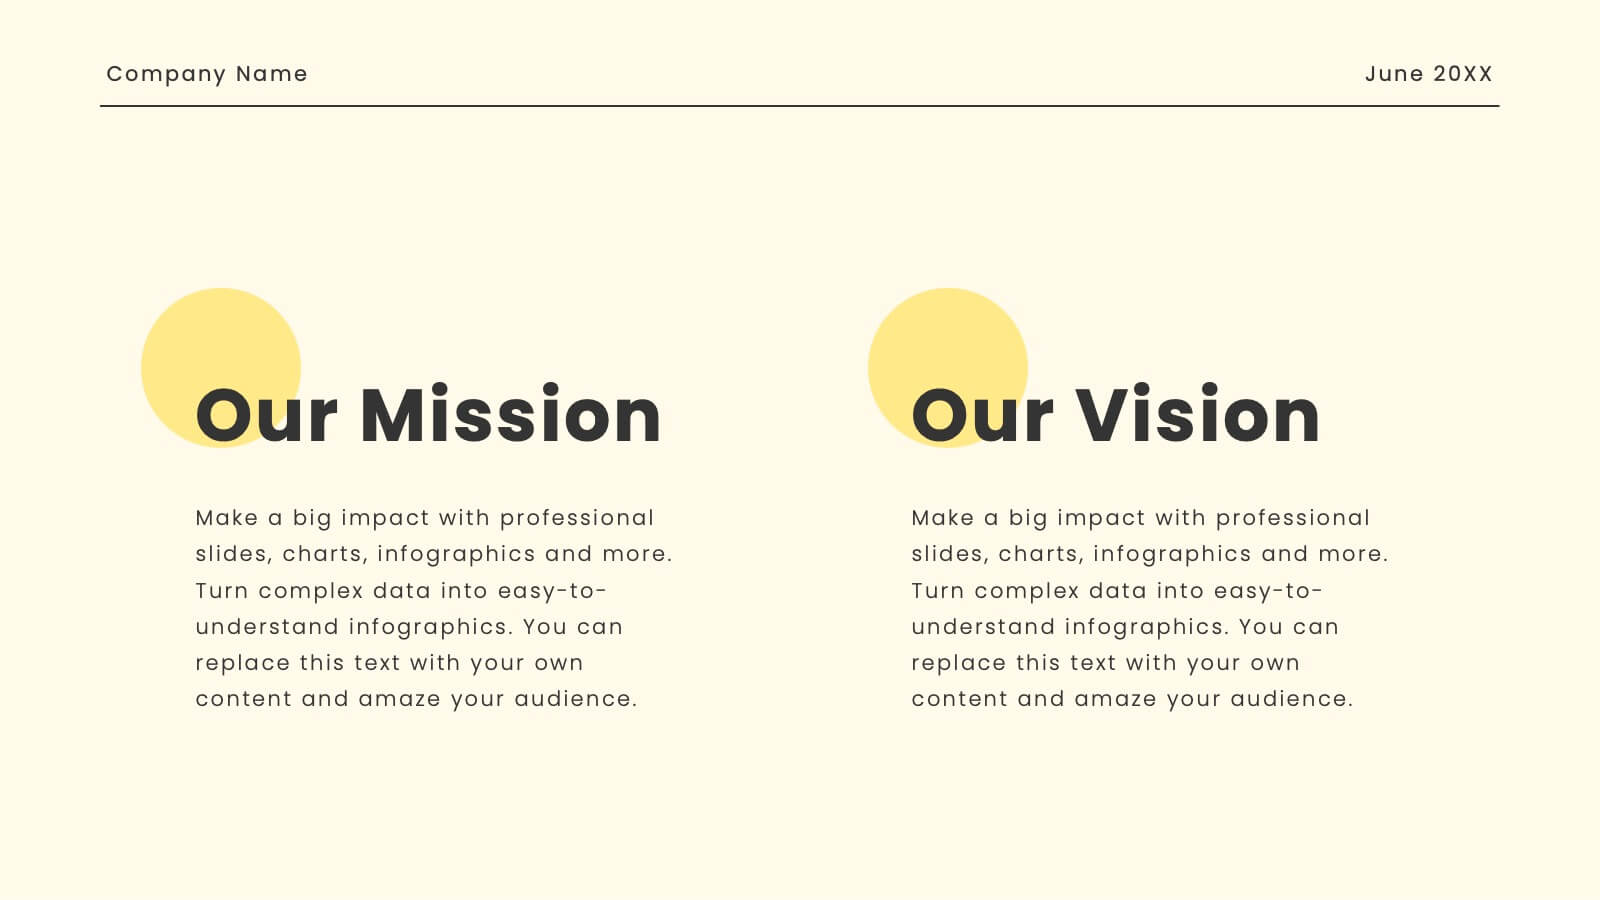
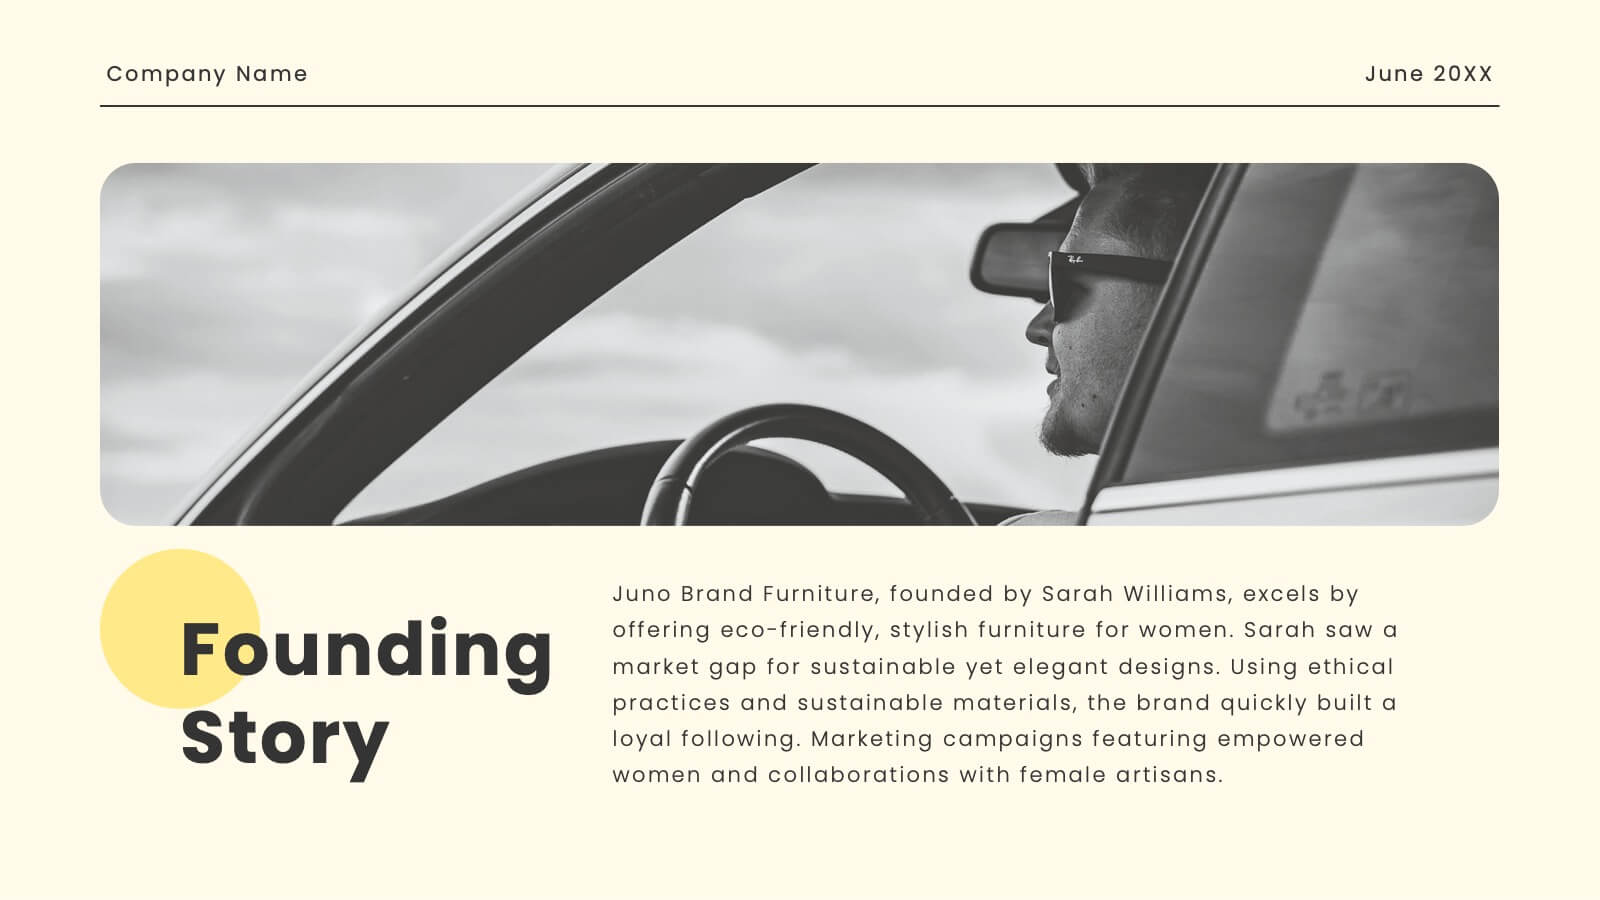
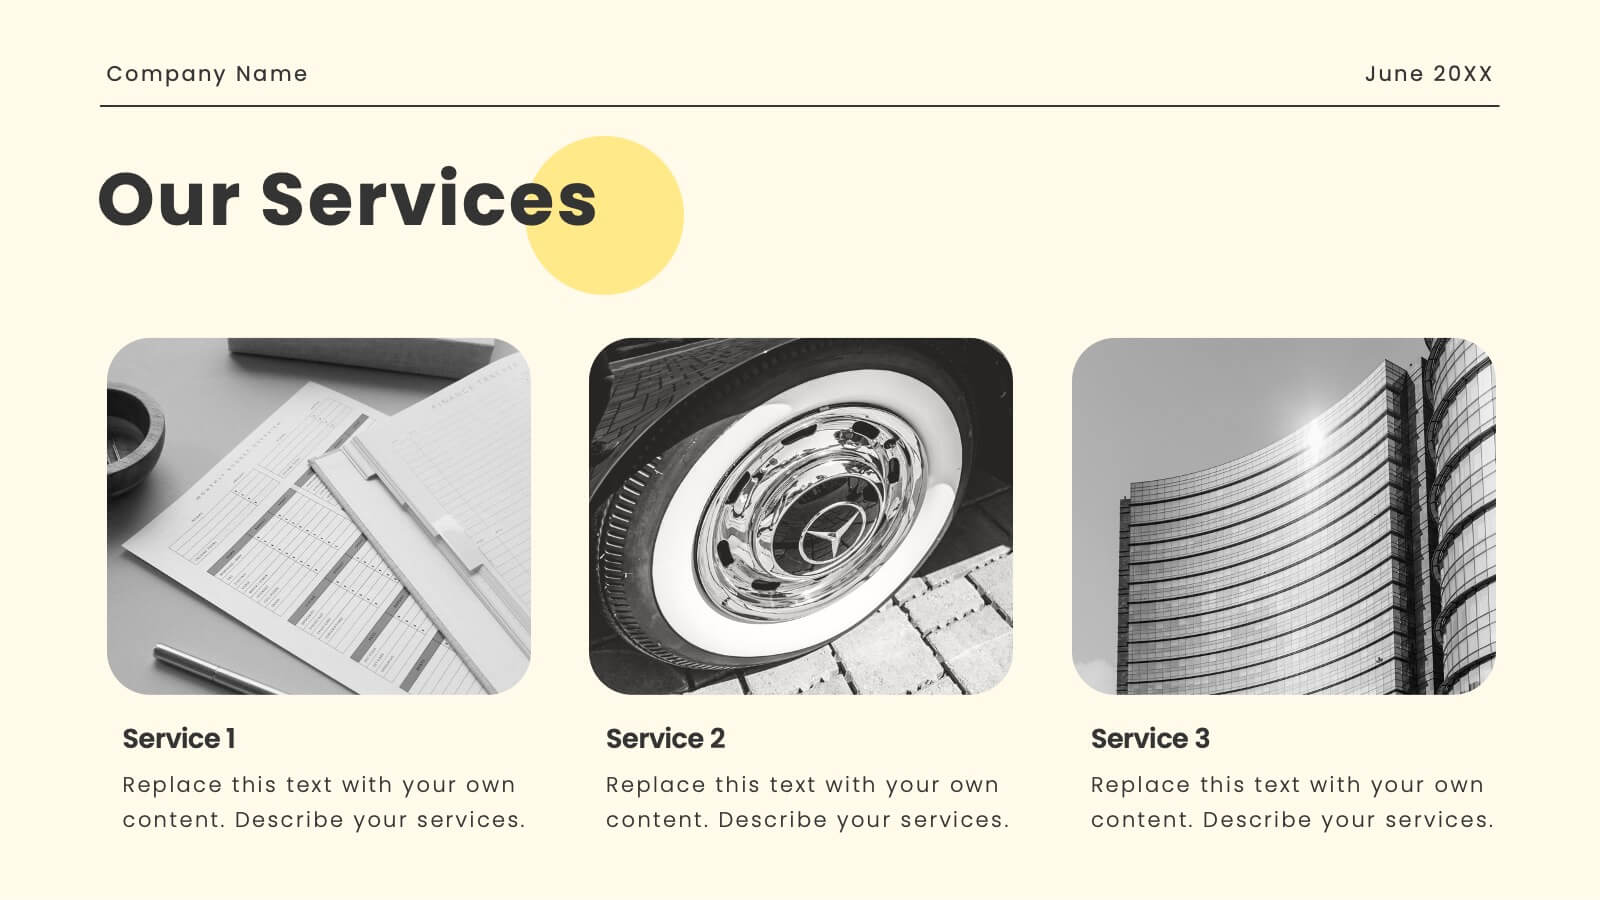
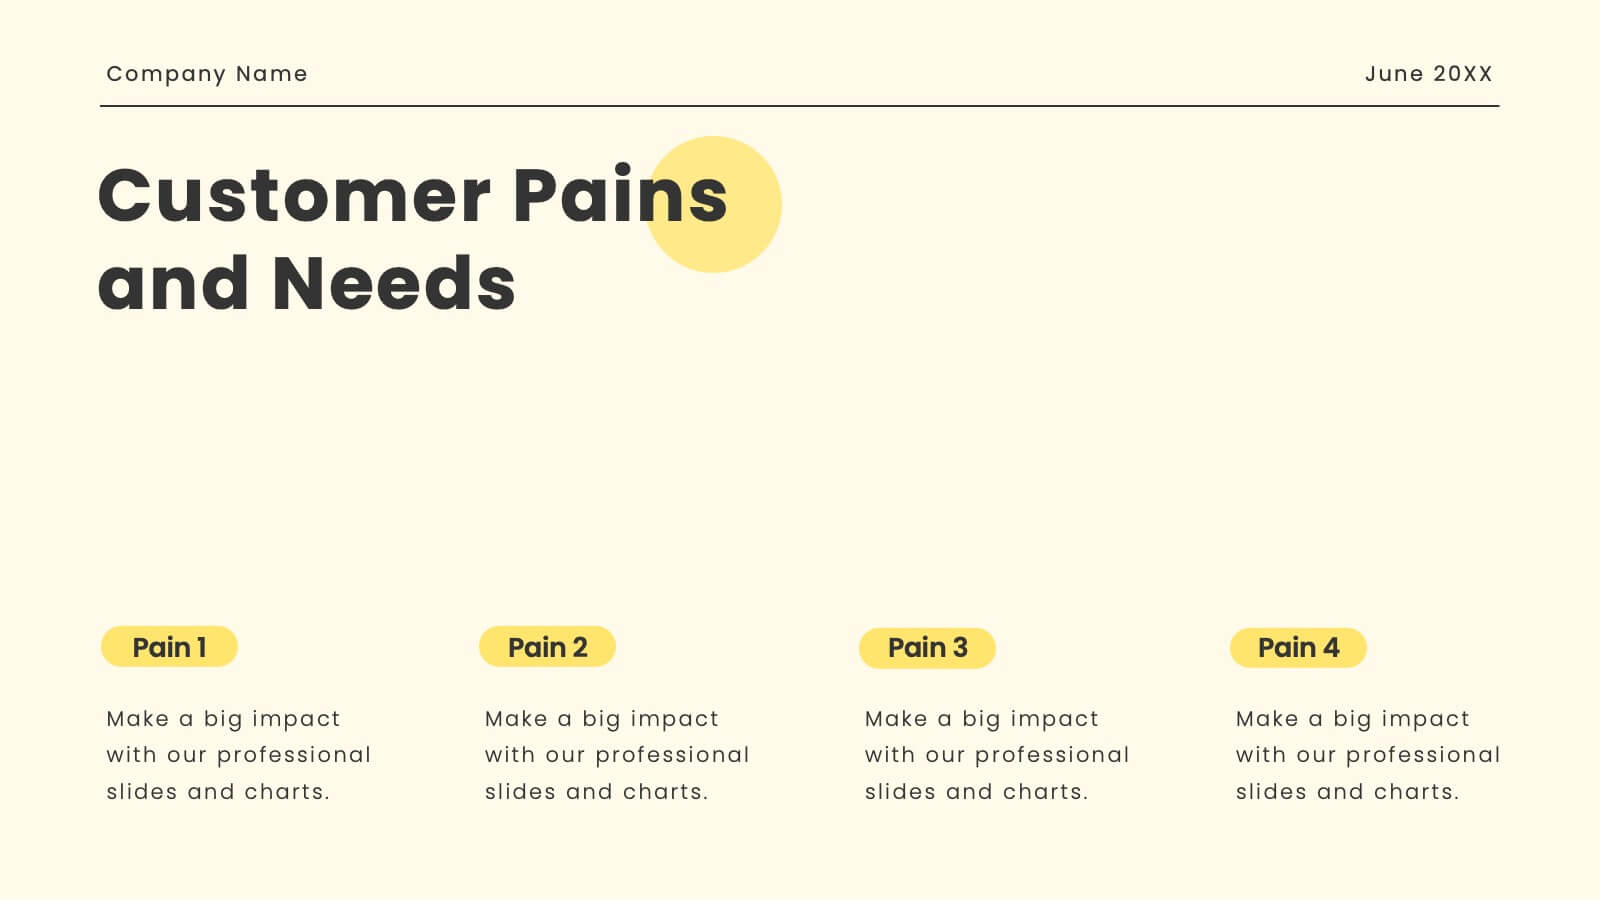
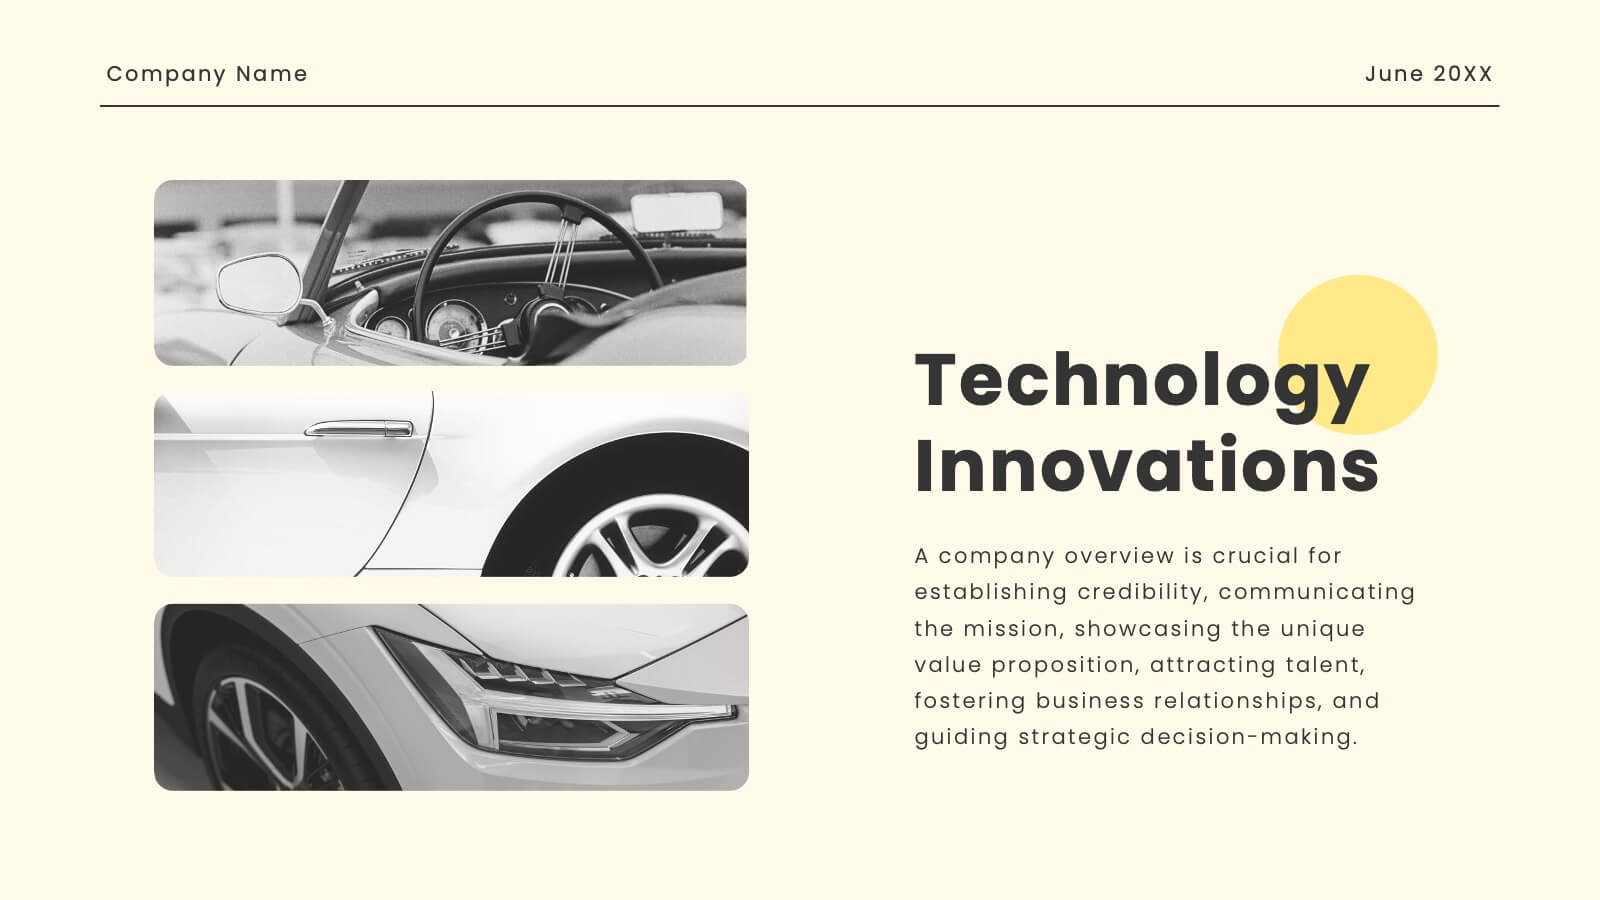
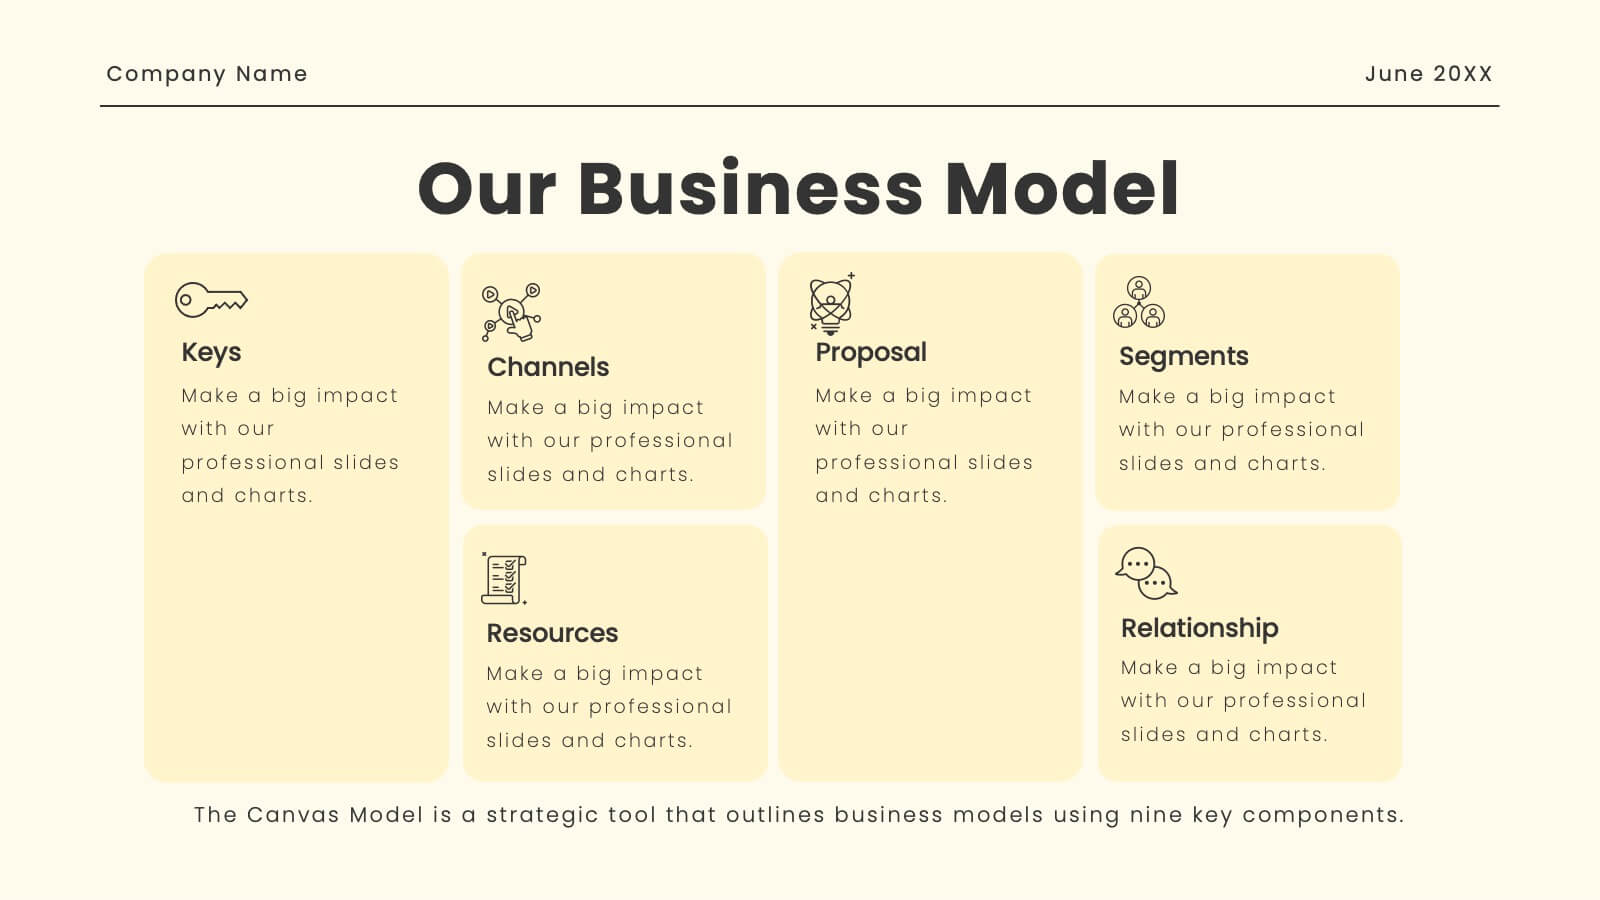
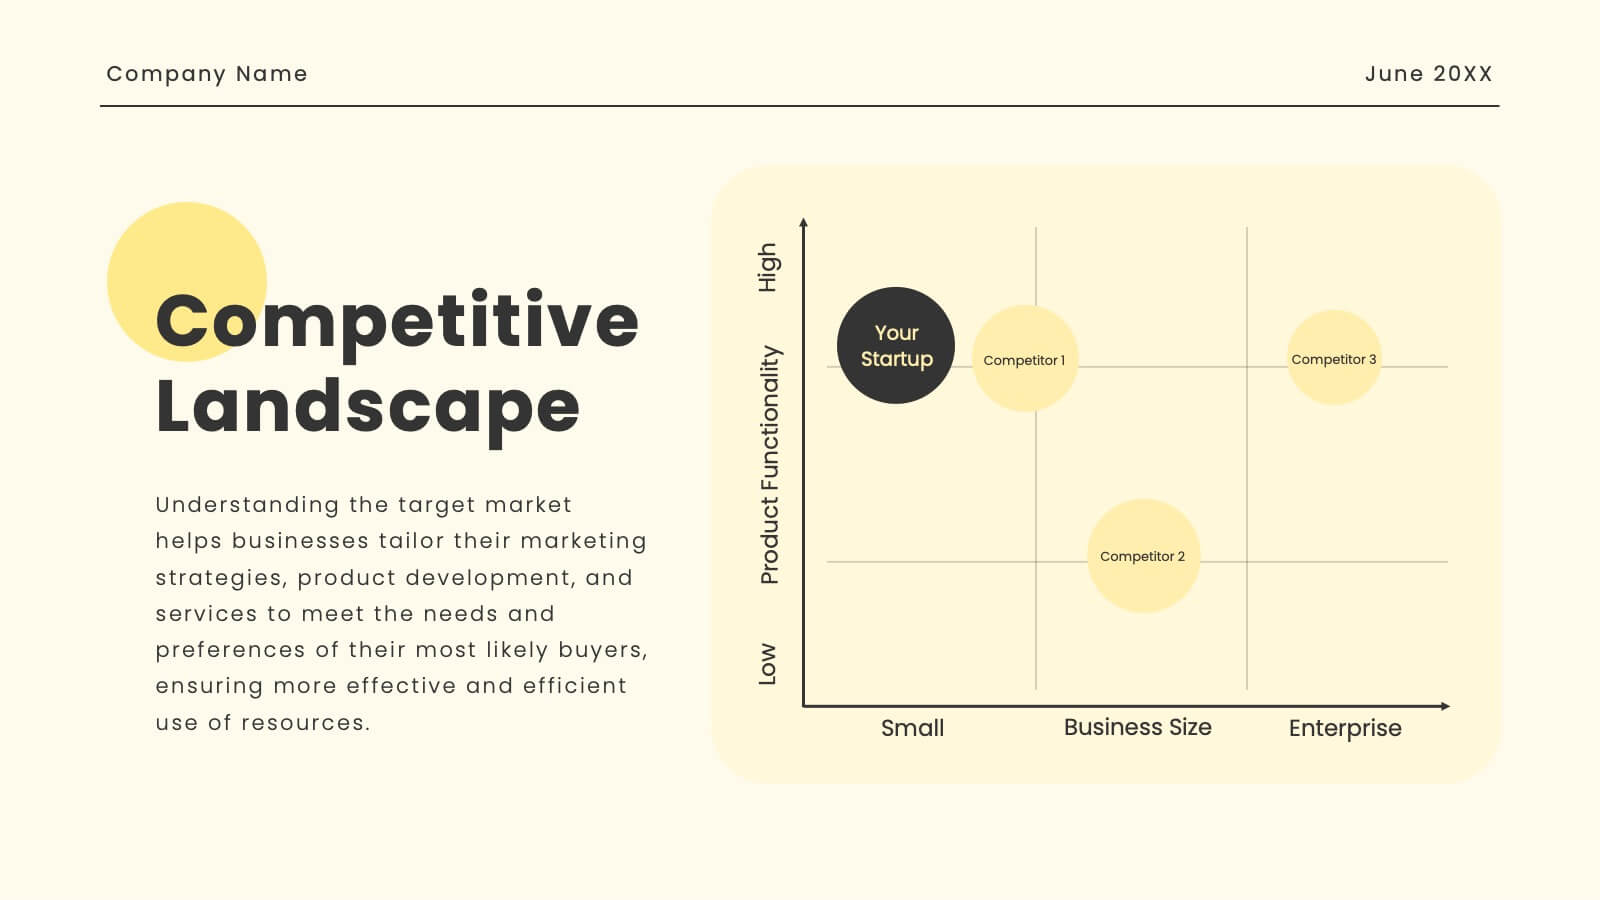
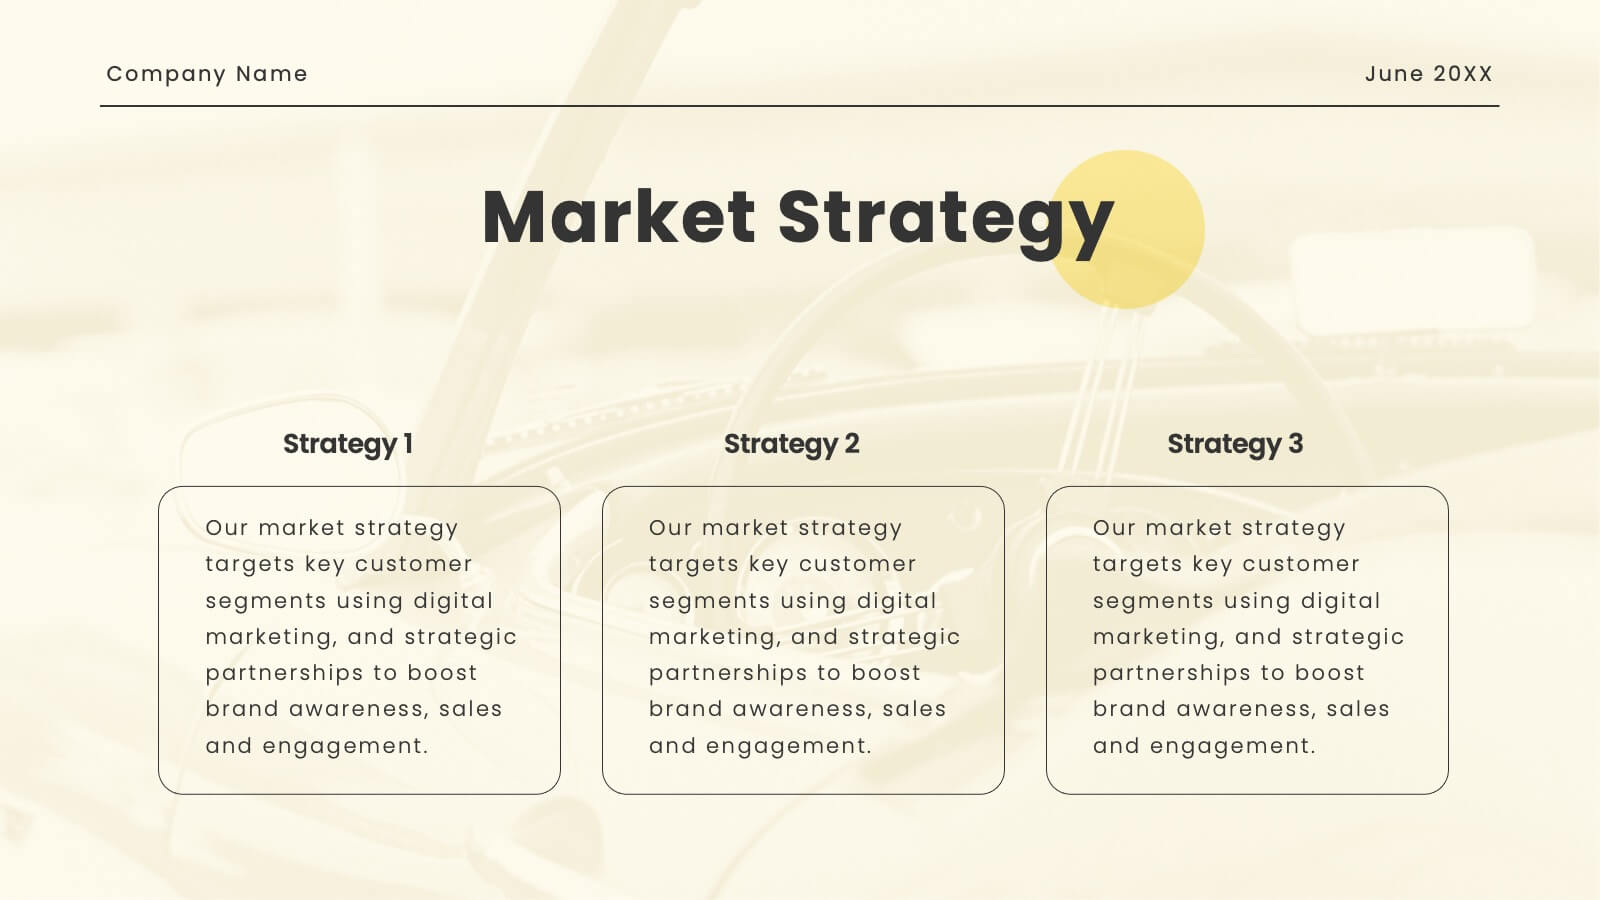
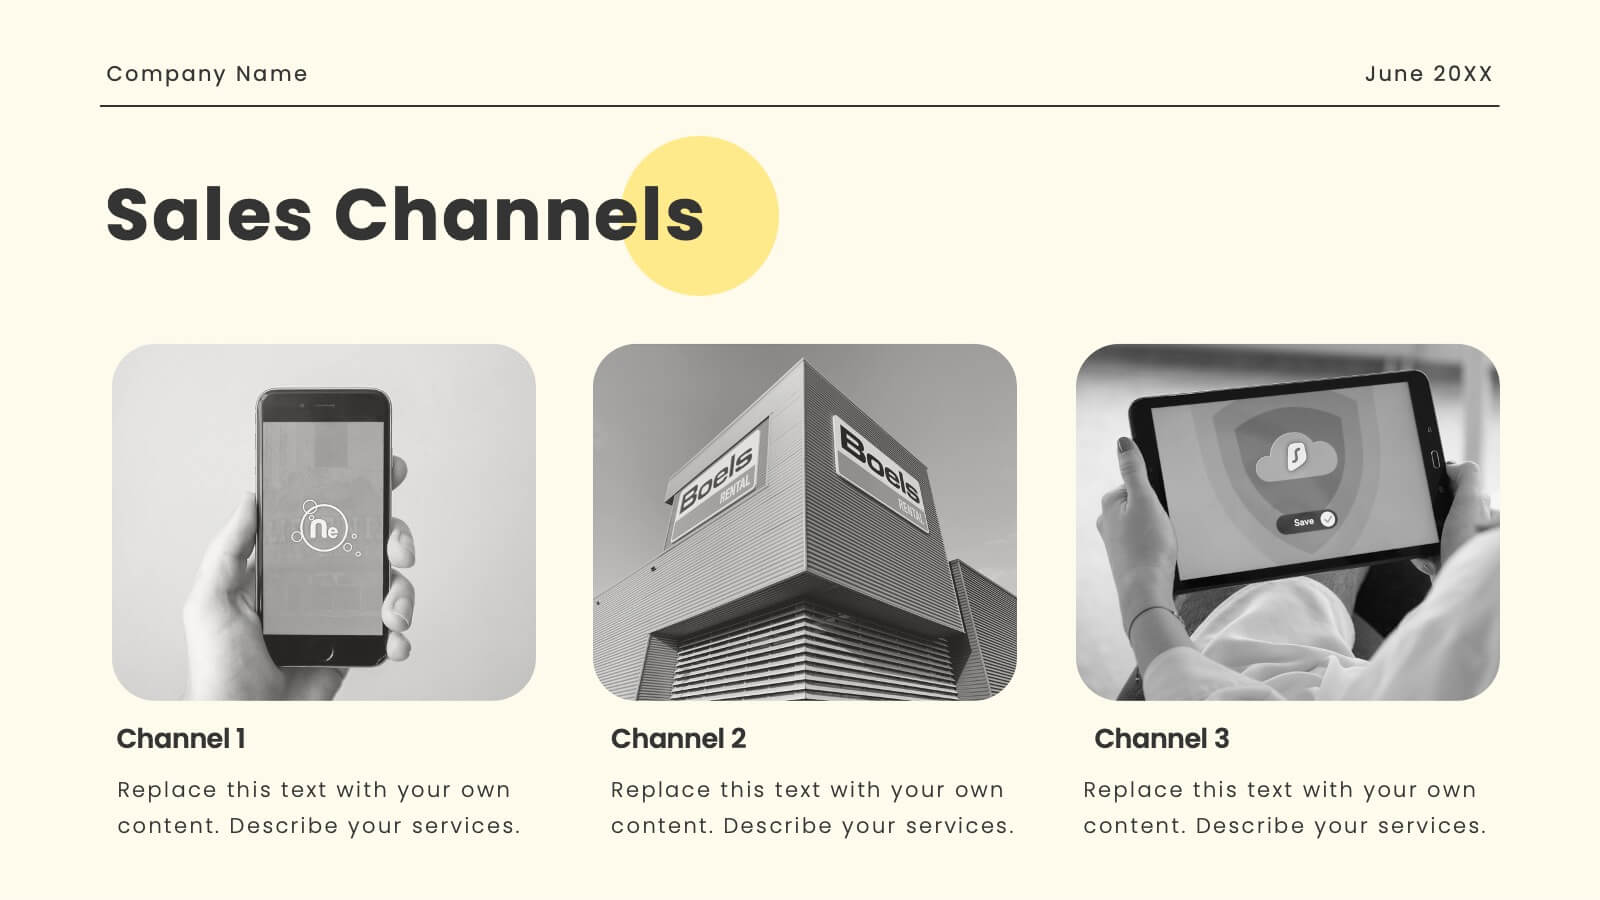
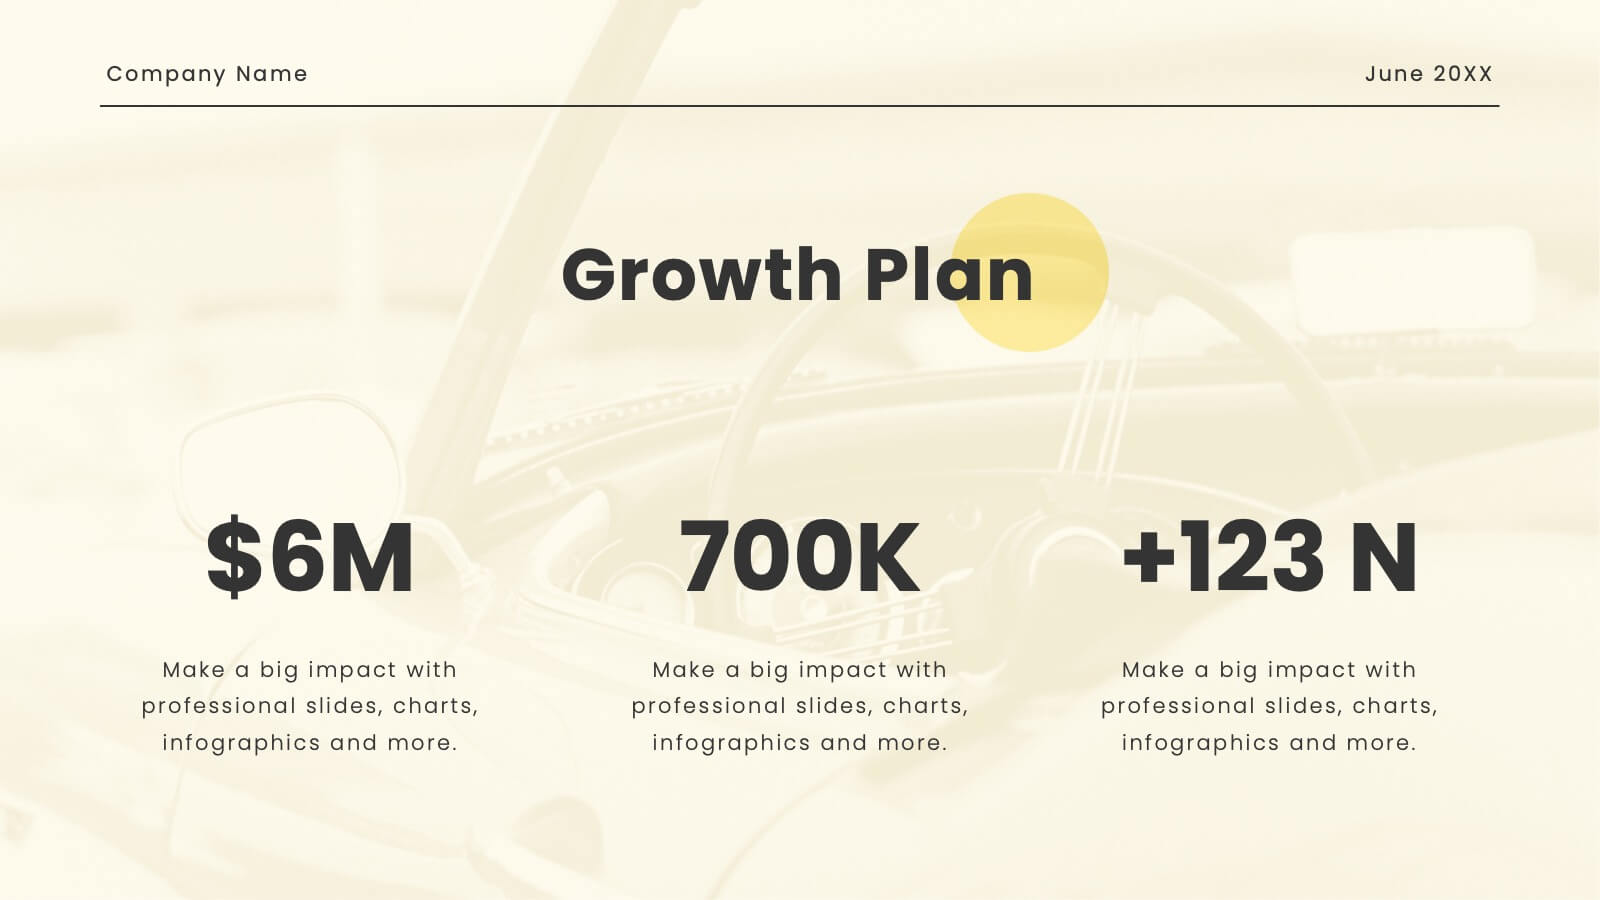
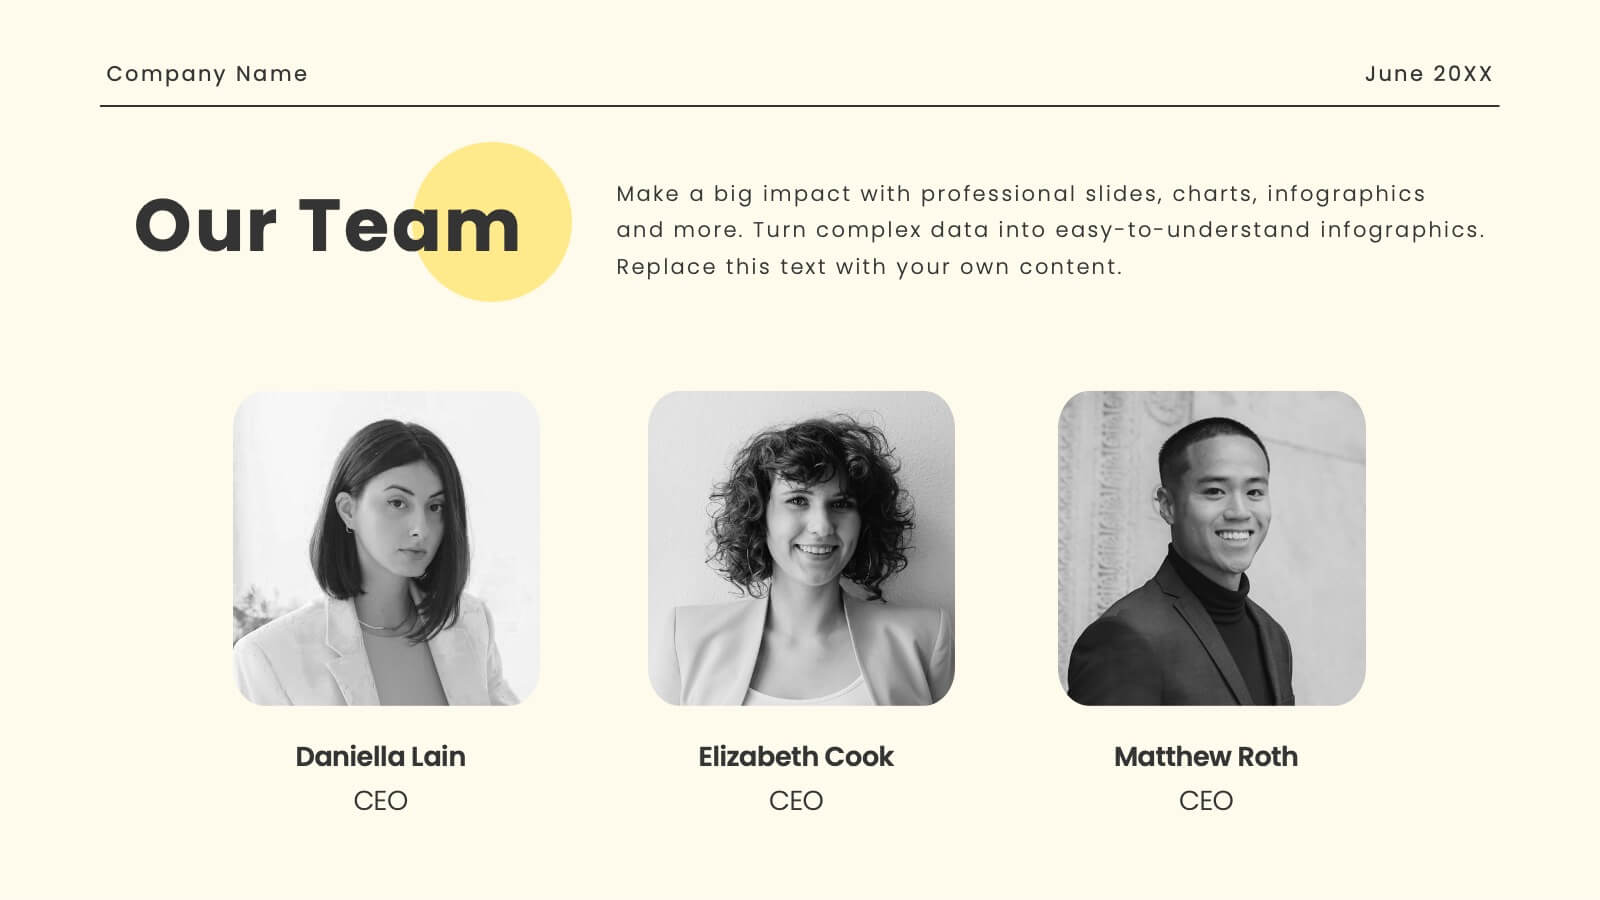
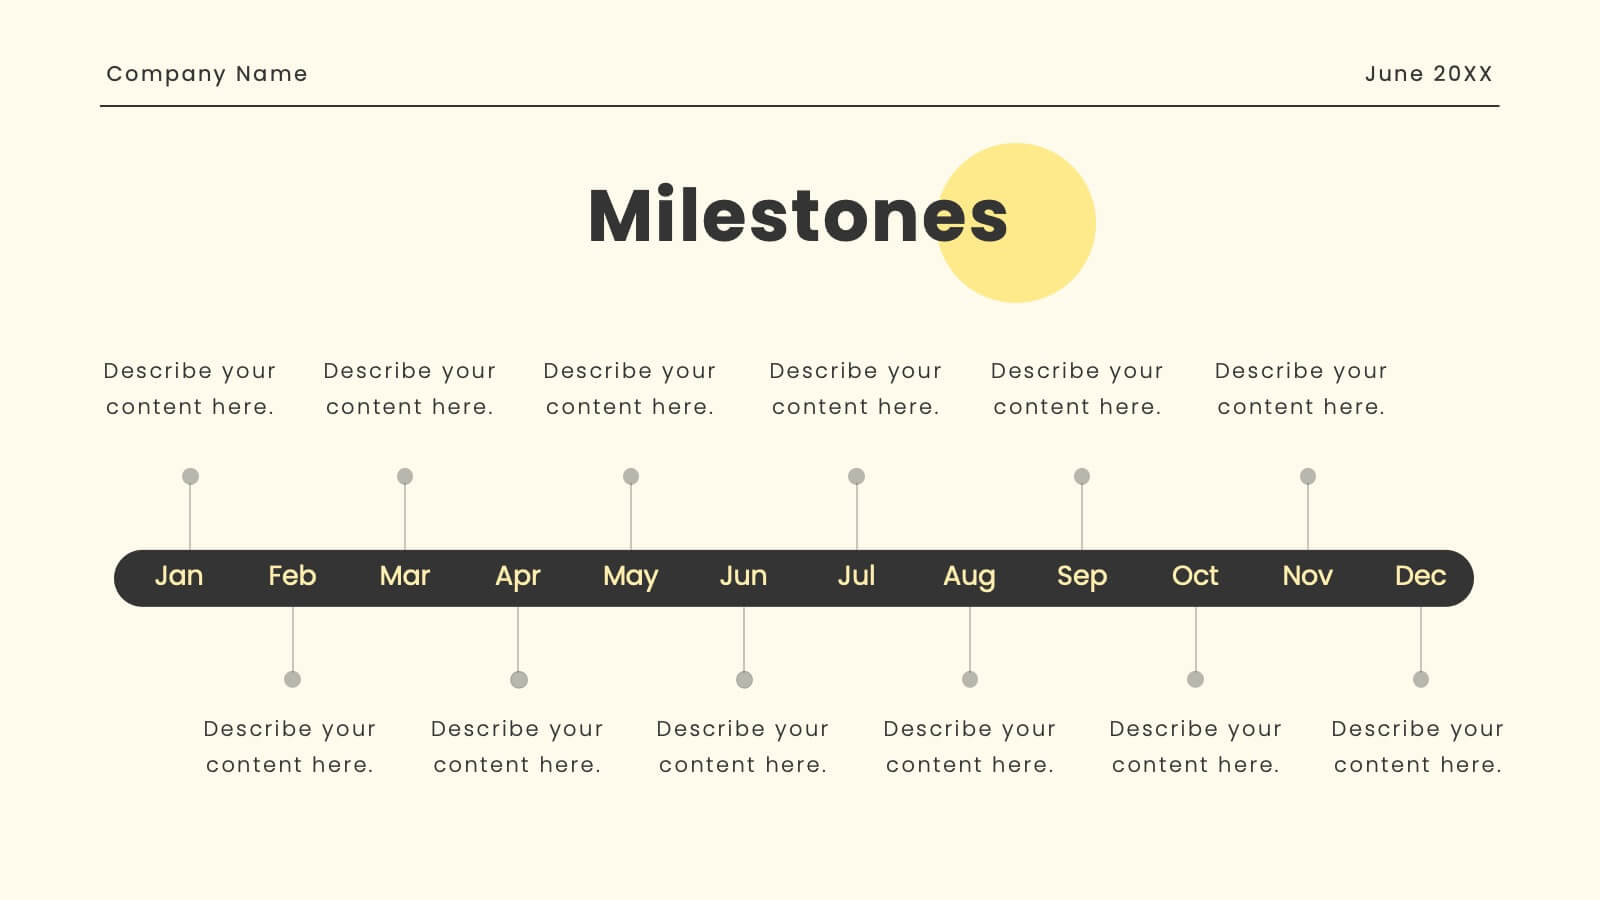
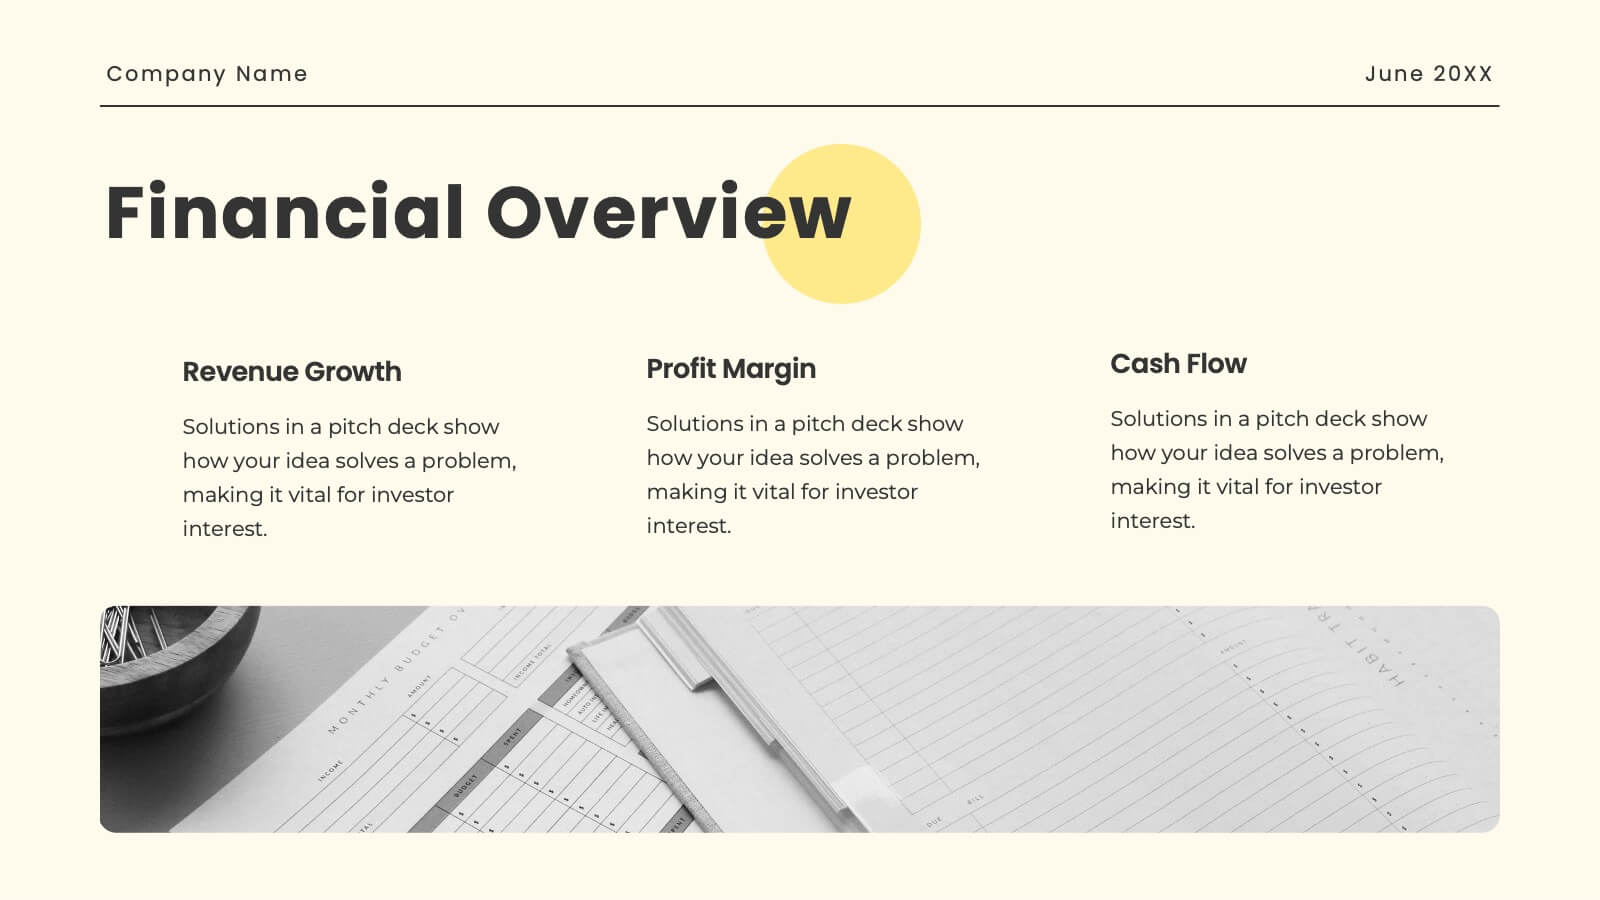
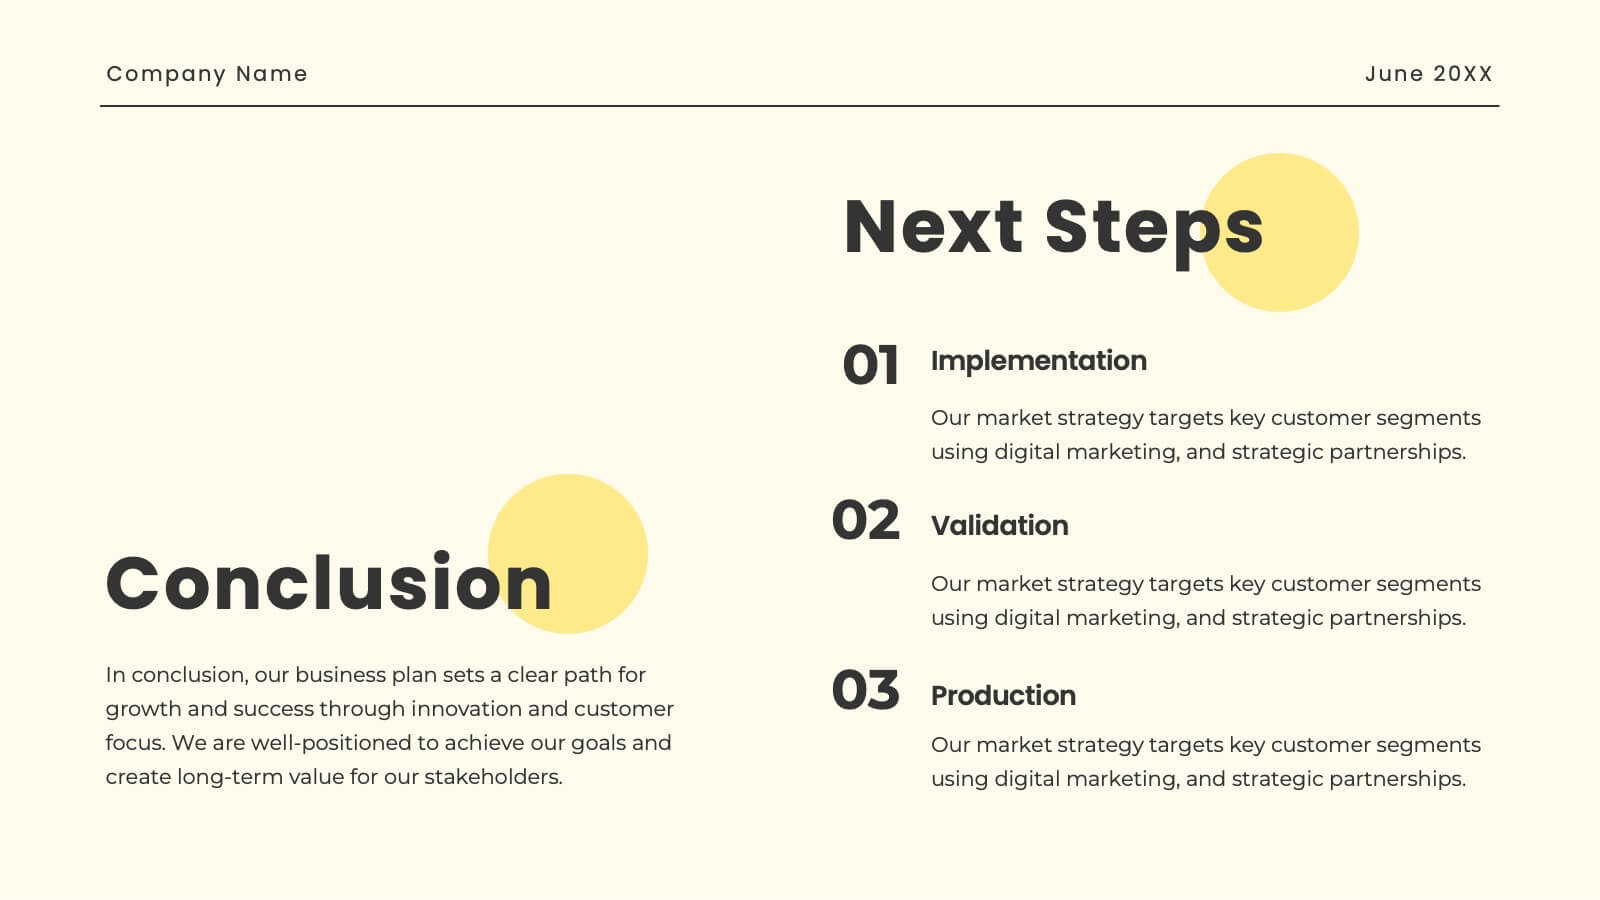
Oasis Startup Business Plan Presentation
Present your corporate business plan with confidence! This template includes sections for company overview, mission, vision, services, target market, and more. Showcase your market strategy, sales channels, growth plan, and financial overview. Perfect for conveying a professional and comprehensive business plan. Compatible with PowerPoint, Keynote, and Google Slides. Impress your audience today!


6 diapositivas
Organizational Change Management Strategy Presentation
Navigate organizational change effectively with this dynamic and structured presentation slide. Featuring a puzzle-piece design, this template visually represents the interconnected steps of change management. Ideal for business leaders, HR professionals, and consultants, it helps illustrate transition processes, strategic adjustments, and team alignment. Fully editable, allowing you to customize text, colors, and layout to fit your business needs. Compatible with PowerPoint, Keynote, and Google Slides for effortless use.


3 diapositivas
Process Mapping with Tree Diagram Presentation
Optimize Your Workflow! The Process Mapping with Tree Diagram Presentation simplifies complex processes, illustrating decision paths and workflows in a clear, structured format. Perfect for business strategy, operations, and project planning, this fully editable template enhances understanding and efficiency. Compatible with PowerPoint, Keynote, and Google Slides, ensuring seamless customization.


6 diapositivas
TAM SAM SOM for Target Reach Forecasting Presentation
Break down your market reach with clarity using the TAM SAM SOM for Target Reach Forecasting Presentation. This sleek, layered circle diagram is ideal for illustrating your total addressable market, serviceable market, and obtainable market. Customize easily in PowerPoint, Keynote, or Google Slides to align with your brand and business strategy.


4 diapositivas
Strategic Growth Next Steps Presentation
Achieve sustainable growth with the Strategic Growth Next Steps Presentation template. This structured, step-by-step layout guides your audience through key phases of business expansion, helping to communicate priorities and action plans effectively. The wavy path design adds a dynamic flow to your strategy, ensuring clarity and engagement. Fully customizable for PowerPoint, Keynote, and Google Slides, making it a versatile tool for strategic planning and business development.


6 diapositivas
Project Summary Report Presentation
Enhance your project reviews with our "Project Summary Report Presentation" template. This slide is expertly designed to summarize key project aspects such as objectives, milestones, and outcomes, structured into sections labeled A, B, and C. Featuring an image of a collaborative team setting, the template underscores the essence of teamwork and productivity in project management. Each section is organized to clearly communicate your project’s progress and results to stakeholders. Ideal for project managers and teams, this template supports effective storytelling in project updates. Compatible with PowerPoint, Keynote, and Google Slides, it’s an essential tool for delivering impactful and organized project presentations.


5 diapositivas
Product Development and Innovation Presentation
Showcase your Product Development and Innovation process with this structured and visually appealing infographic. Designed with interconnected gears and a step-by-step approach, this template is ideal for illustrating stages of product design, research, and launch. Fully customizable and compatible with PowerPoint, Keynote, and Google Slides.


7 diapositivas
Business Continuity Plan Infographic Presentation
A well-written business plan helps entrepreneurs focus on their next steps, anticipate challenges and overcome them before they occur. This template will guide you through the process of writing a professional, successful and effective business plan. This template design is highly visual, vibrant and engaging with neutral colors. It uses the best parts of a business plan, such as graphs and charts, to visualize your ideas. This business plan infographic is a sharp visual aid for investors, partners, board members and anyone else who needs to know more about what you do and how you plan to grow.


2 diapositivas
Pink Ribbon Event Slide Deck Presentation
Bring awareness and compassion to your presentation with a bold ribbon design that symbolizes unity and support. Perfect for health campaigns, charity events, or educational talks, this layout helps you share key messages with clarity and impact. Fully compatible with PowerPoint, Keynote, and Google Slides for easy customization.


10 diapositivas
Sustainable Farming Practices
Present eco-friendly agricultural strategies with this visually structured layout. Featuring a linear process flow and eco-themed icons, this slide is ideal for outlining key sustainability practices, steps, or phases. Use it for presentations on regenerative agriculture, organic farming, or environmental policy. Fully editable in PowerPoint, Keynote, and Google Slides.


4 diapositivas
Turning Ideas into Impact Presentation
Showcase your transformation journey from concept to achievement with this bold visual layout. The three-step diagram—idea, action, success—makes it ideal for project planning, product development, or strategic execution. Easily editable in PowerPoint, Keynote, and Google Slides for pitch decks, business roadmaps, or innovation workflows. Clean, modern, and impactful.


21 diapositivas
Cerberus Project Timeline Presentation
Bring your project vision to life with a well-structured plan that flows effortlessly. This presentation covers everything from objectives and timelines to budget breakdowns, team introductions, and next steps, helping you communicate key details with clarity. Perfect for internal or client presentations, and fully compatible with PowerPoint, Keynote, and Google Slides.


5 diapositivas
Organic Search Growth Plan Presentation
Grow your visibility the natural way with this sleek and easy-to-follow organic strategy slide. Perfect for outlining SEO goals, keyword clusters, and growth tactics, this visual layout makes your presentation clean and compelling. Fully compatible with PowerPoint, Keynote, and Google Slides for flexible editing across platforms.


7 diapositivas
Enforcement Law Infographic Presentation
A Law Enforcement Infographic is a visual representation of key concepts, statistics, and procedures related to law enforcement. This template can be used to provide an overview of various aspects of law enforcement, such as crime rates, policing strategies, and legal procedures. This infographic includes a variety of icons, illustrations, and other design elements law themed to enhance the visual appeal and make it more appealing for your viewers. This template is compatible with Powerpoint, Keynote and Google Slides making it easy to customize and edit with your own text and information.


6 diapositivas
Objective Research Infographics
Enhance your presentation on "Objective Research" with our professionally designed infographic template. This template, compatible with PowerPoint, Keynote, and Google Slides, is the perfect tool for presenting complex research data in a clear and engaging manner. Our template boasts a clean, modern design with a neutral color scheme, making it ideal for both corporate and academic settings. The layout is expertly crafted to showcase your research objectives, methodologies, and findings in a visually appealing way. It includes elements like graphs, charts, and bullet points, ensuring your data is not only accessible but also impactful. Easy to customize and user-friendly, this template empowers you to convey your research objectives with clarity and professionalism. Whether you're presenting to colleagues, students, or stakeholders, this infographic template will elevate your presentation and make your data stand out.


5 diapositivas
DMAIC Six Sigma Framework
Visualize process improvement with this clear and structured DMAIC Six Sigma slide. Perfect for business analysts, quality teams, and project managers, it highlights each phase—Define, Measure, Analyze, Improve, and Control—in a streamlined format. Fully editable in PowerPoint, Keynote, and Google Slides.


6 diapositivas
Table of Content Layout Presentation
Kick off your presentation with a clean, modern layout that instantly guides your audience through each section with clarity and style. This design highlights key topics in a structured, easy-to-follow sequence, making navigation simple and intuitive. Fully compatible with PowerPoint, Keynote, and Google Slides for seamless use.