


Características


¿Tienes alguna pregunta?
Recomendar


7 diapositivas
Sports Management Infographic
Sports management involves planning, organizing, and coordinating activities related to sports and recreation. Step into the dynamic world of sports with our engaging sports management infographic. This template isn't just a game plan; it's a visual journey through the strategies, insights, and principles that drive success in the thrilling realm of sports management. Compatible with Powerpoint, Keynote, and Google Slides. Use this template to explore winning strategies, leadership insights, and the dynamics of this exciting field, and gear up to manage sports with precision, passion, and finesse.


8 diapositivas
Credit Card Comparison Presentation
The "Credit Card Comparison" presentation template visualizes the differences between credit and debit card options in a straightforward and engaging way. Featuring side-by-side comparisons, the template allows for easy insertion of key points such as fees, benefits, and suitability for different user profiles, making it an excellent tool for financial educators, advisors, and banking professionals. The template’s design ensures that the content is accessible and relatable, making complex financial concepts easier to grasp for the audience. This makes it ideal for presentations aimed at educating consumers about financial choices or for internal training within financial institutions.


6 diapositivas
Business Case Studies Analysis Presentation
Turn insights into impact with this clean and professional layout designed to showcase real-world business challenges and results. Perfect for summarizing objectives, methods, and key outcomes, it helps you tell a clear and compelling story. Fully compatible with PowerPoint, Keynote, and Google Slides for easy customization and presentation.


8 diapositivas
Project Milestones and Deliverables Presentation
Visualize your project’s journey with this step-by-step milestone timeline—ideal for tracking key phases, task ownership, or delivery checkpoints. The diagonal path connects colorful icons and editable text blocks, helping teams align on objectives and timelines. Compatible with PowerPoint, Keynote, and Google Slides.


5 diapositivas
Human Capital Planning Overview Presentation
Streamline workforce strategies with the Human Capital Planning Overview Presentation. This structured template helps visualize talent development, succession planning, and HR workflows in clear, step-by-step layouts. Perfect for HR leaders, consultants, and executives. Fully editable in PowerPoint, Keynote, and Google Slides for seamless customization to match your team or organization.


23 diapositivas
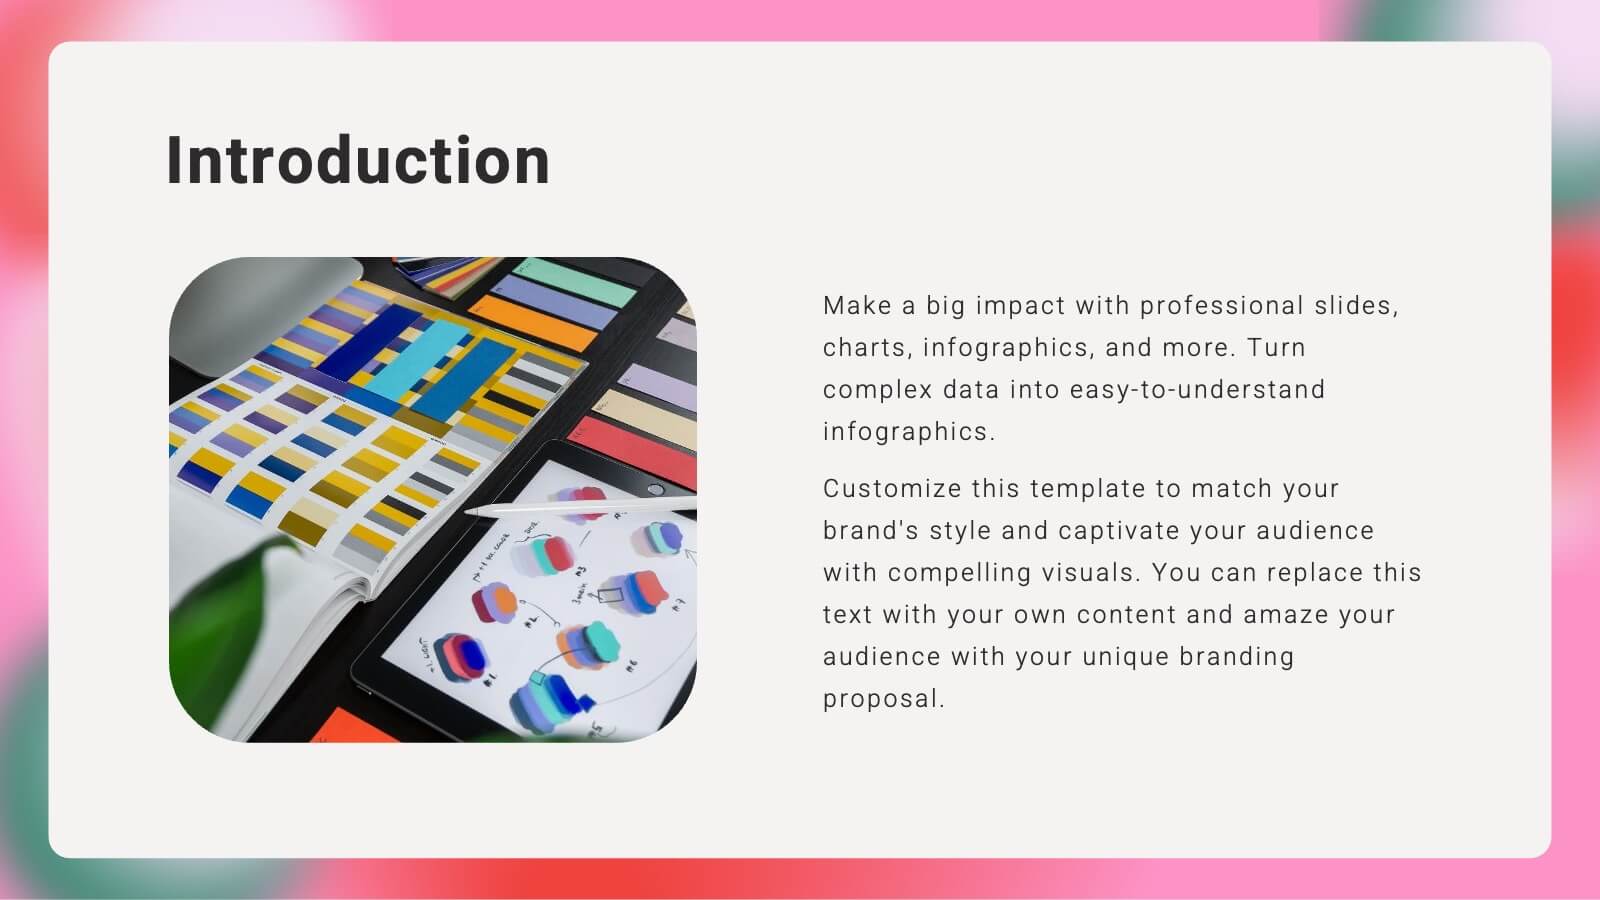
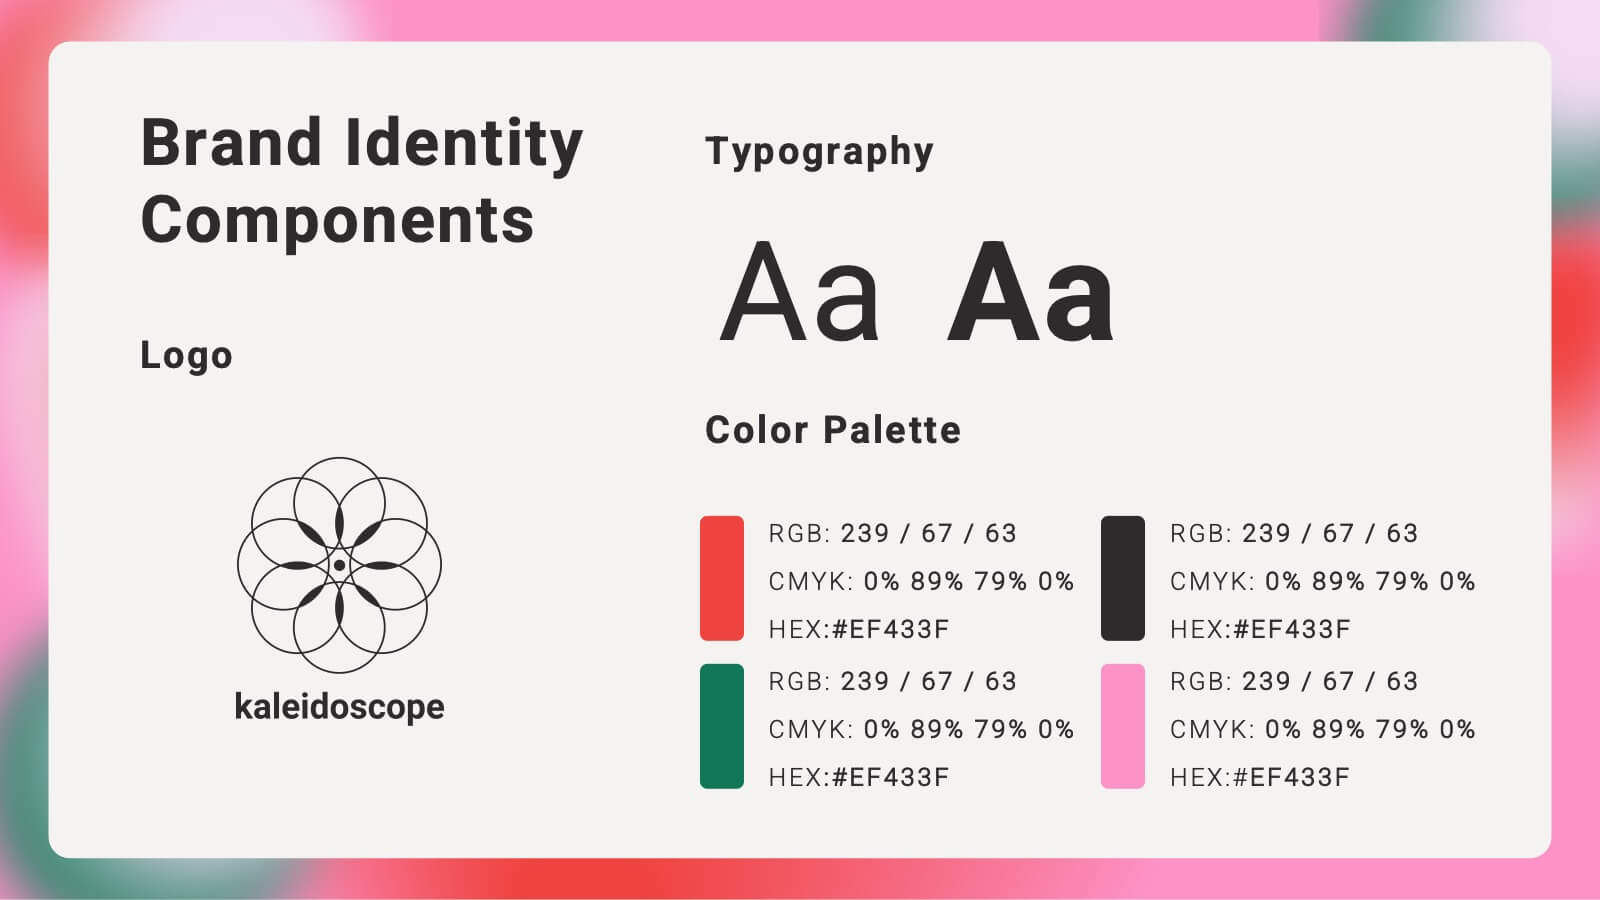
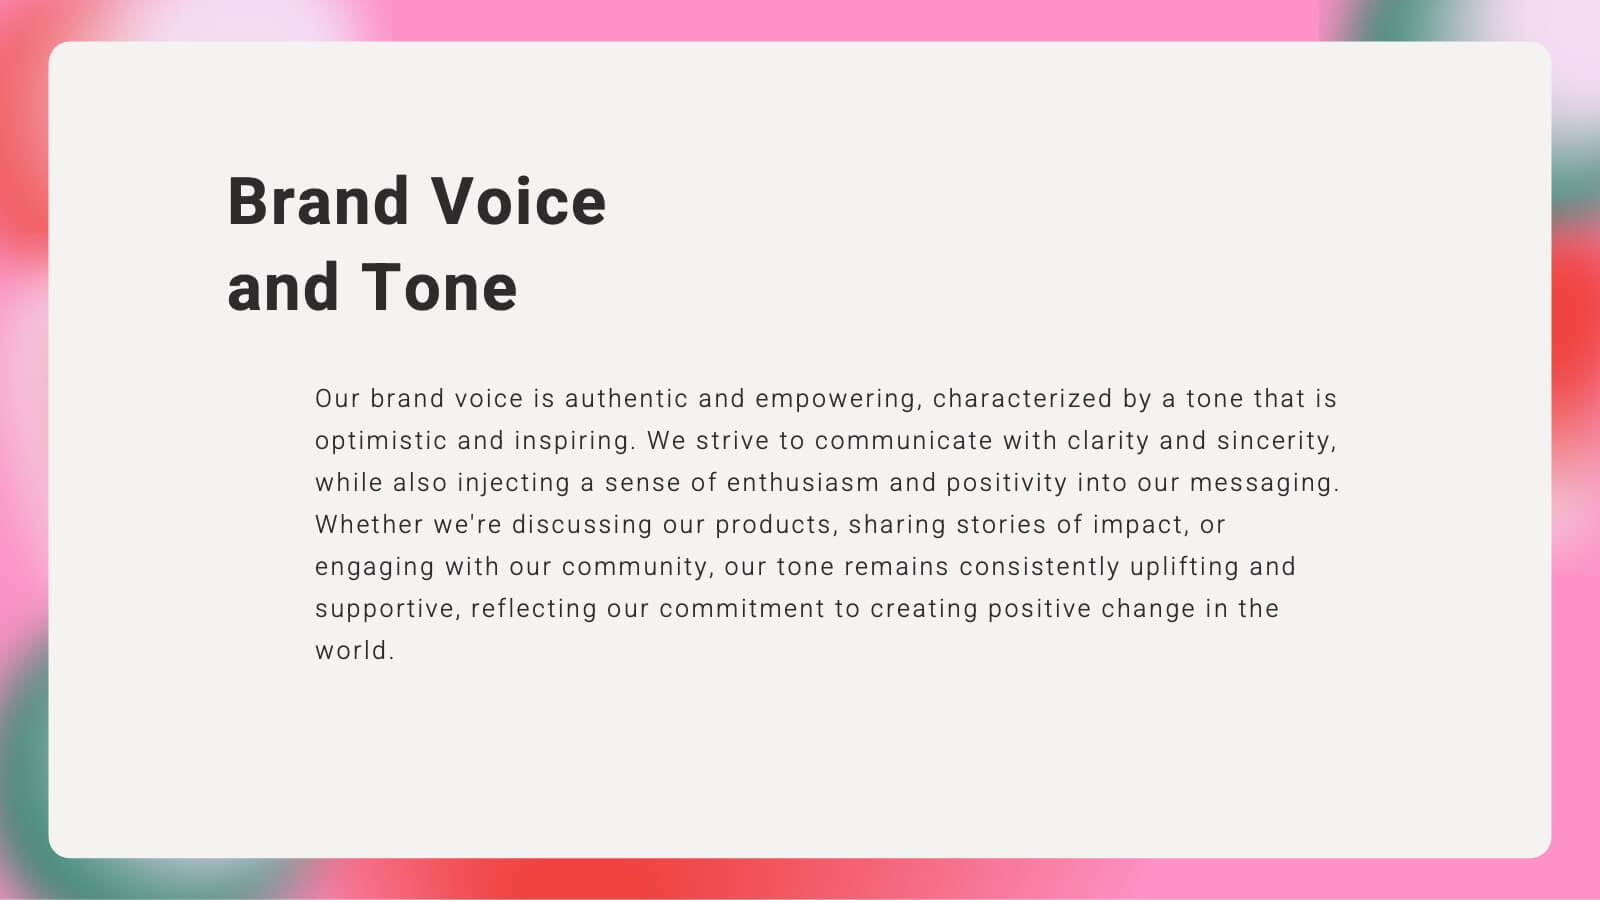
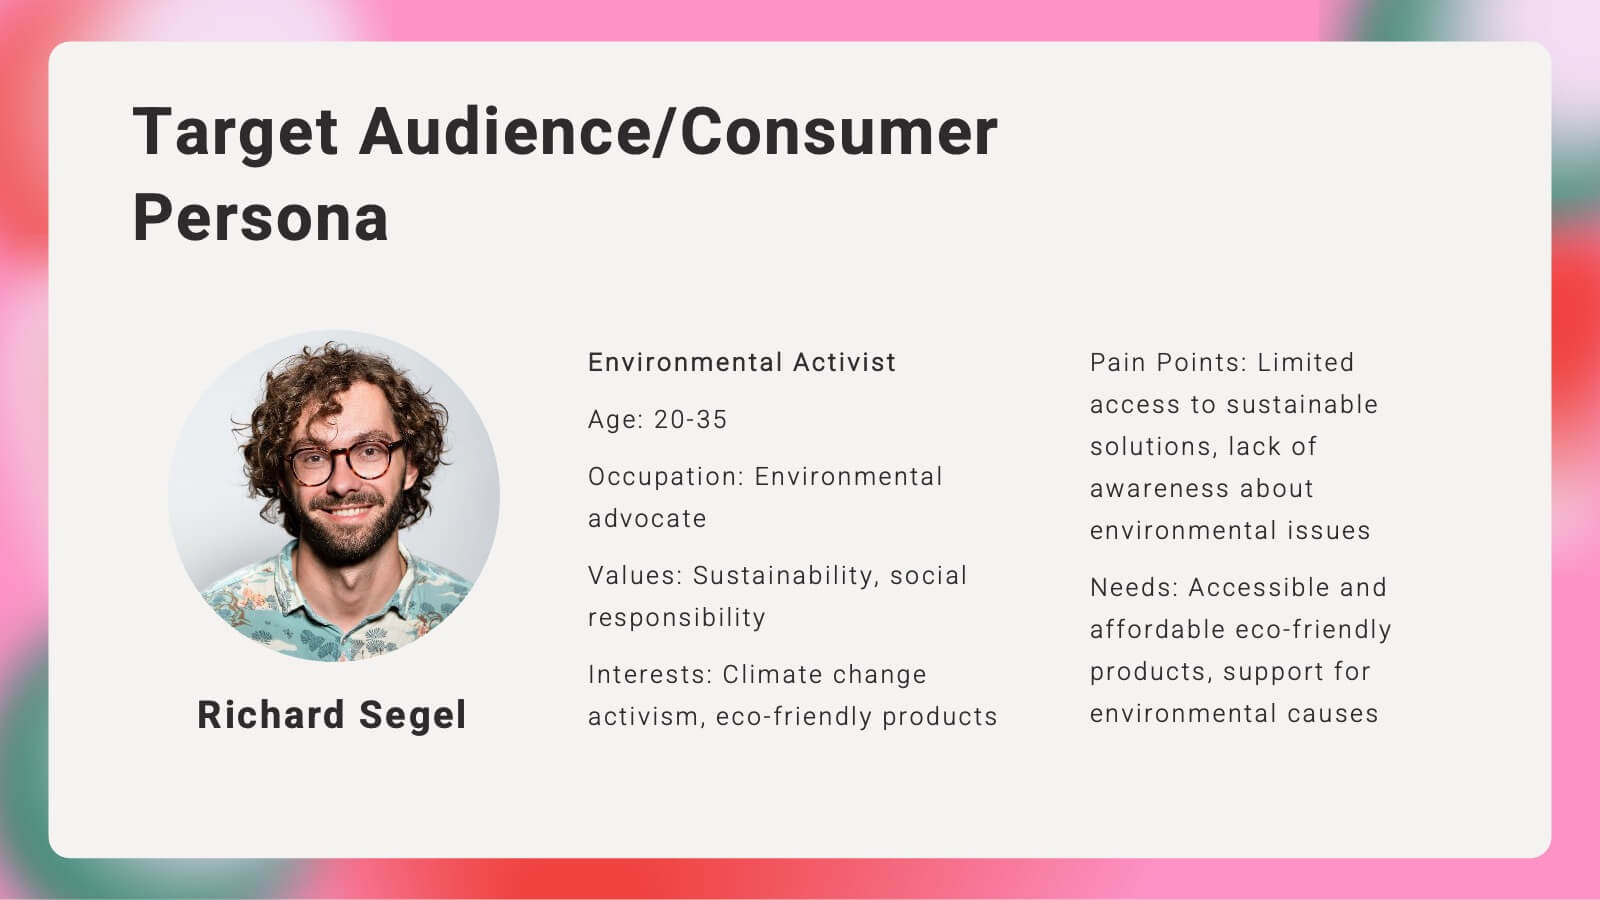
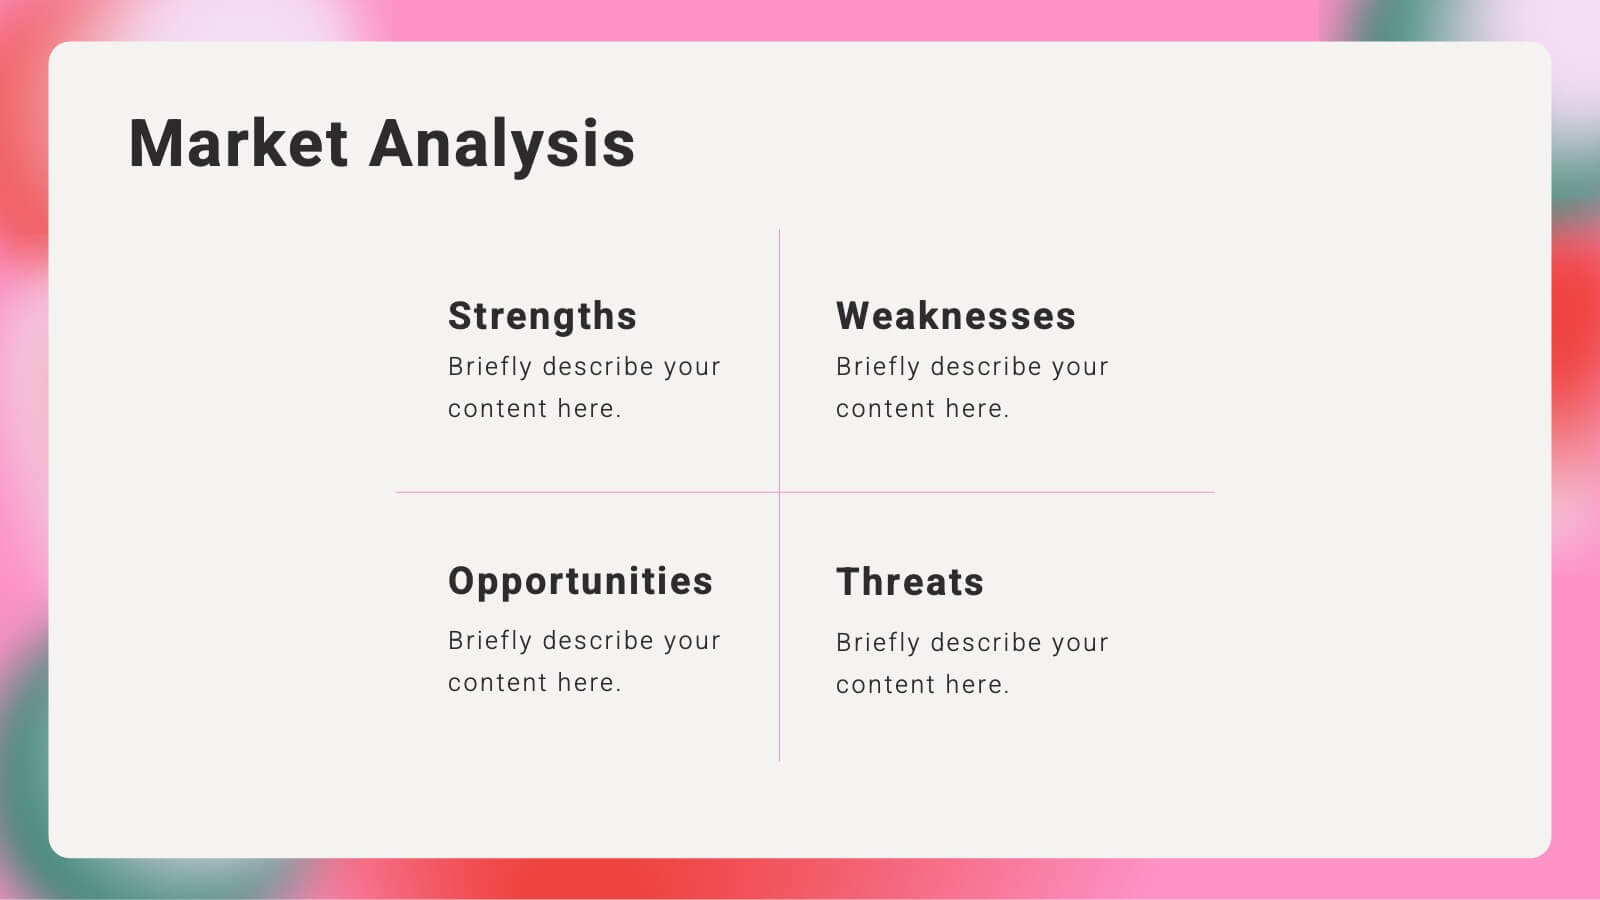
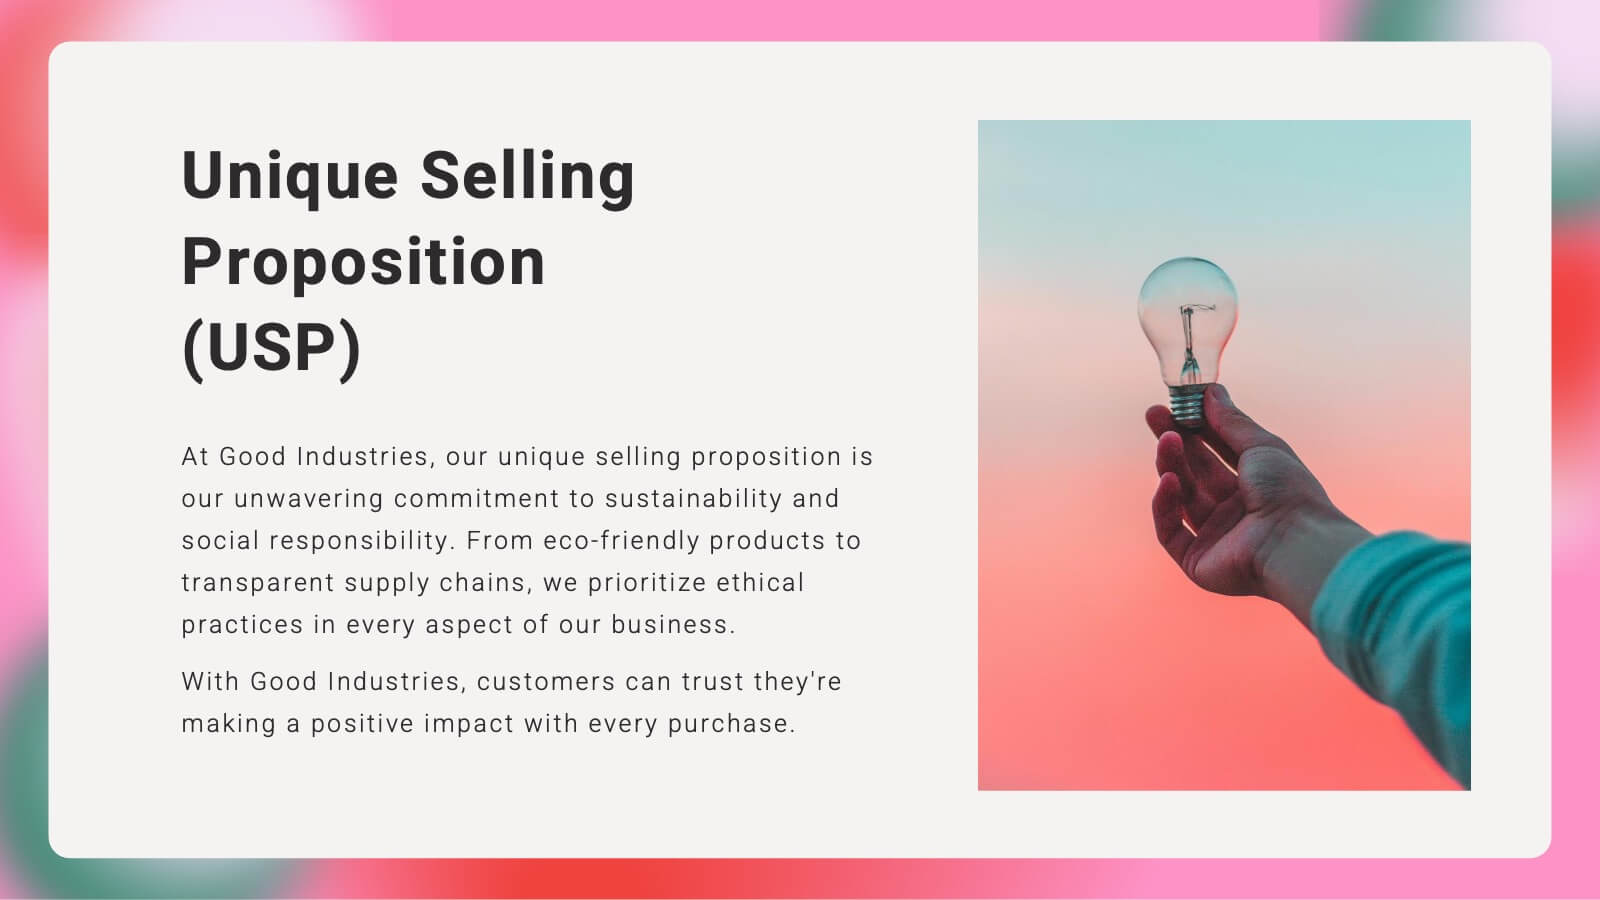
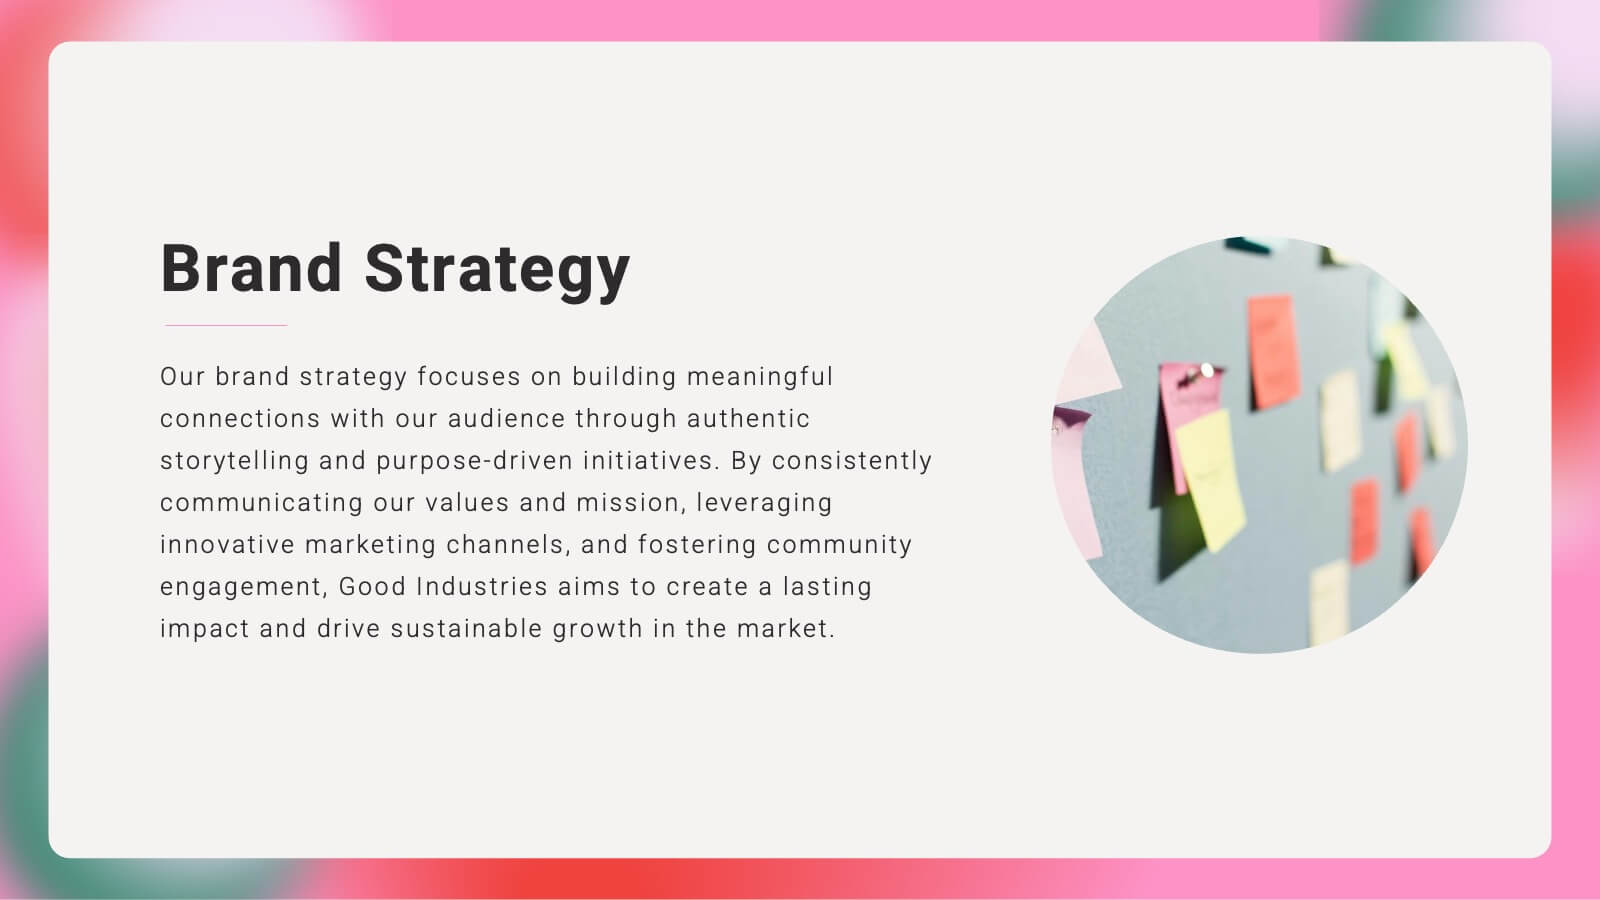
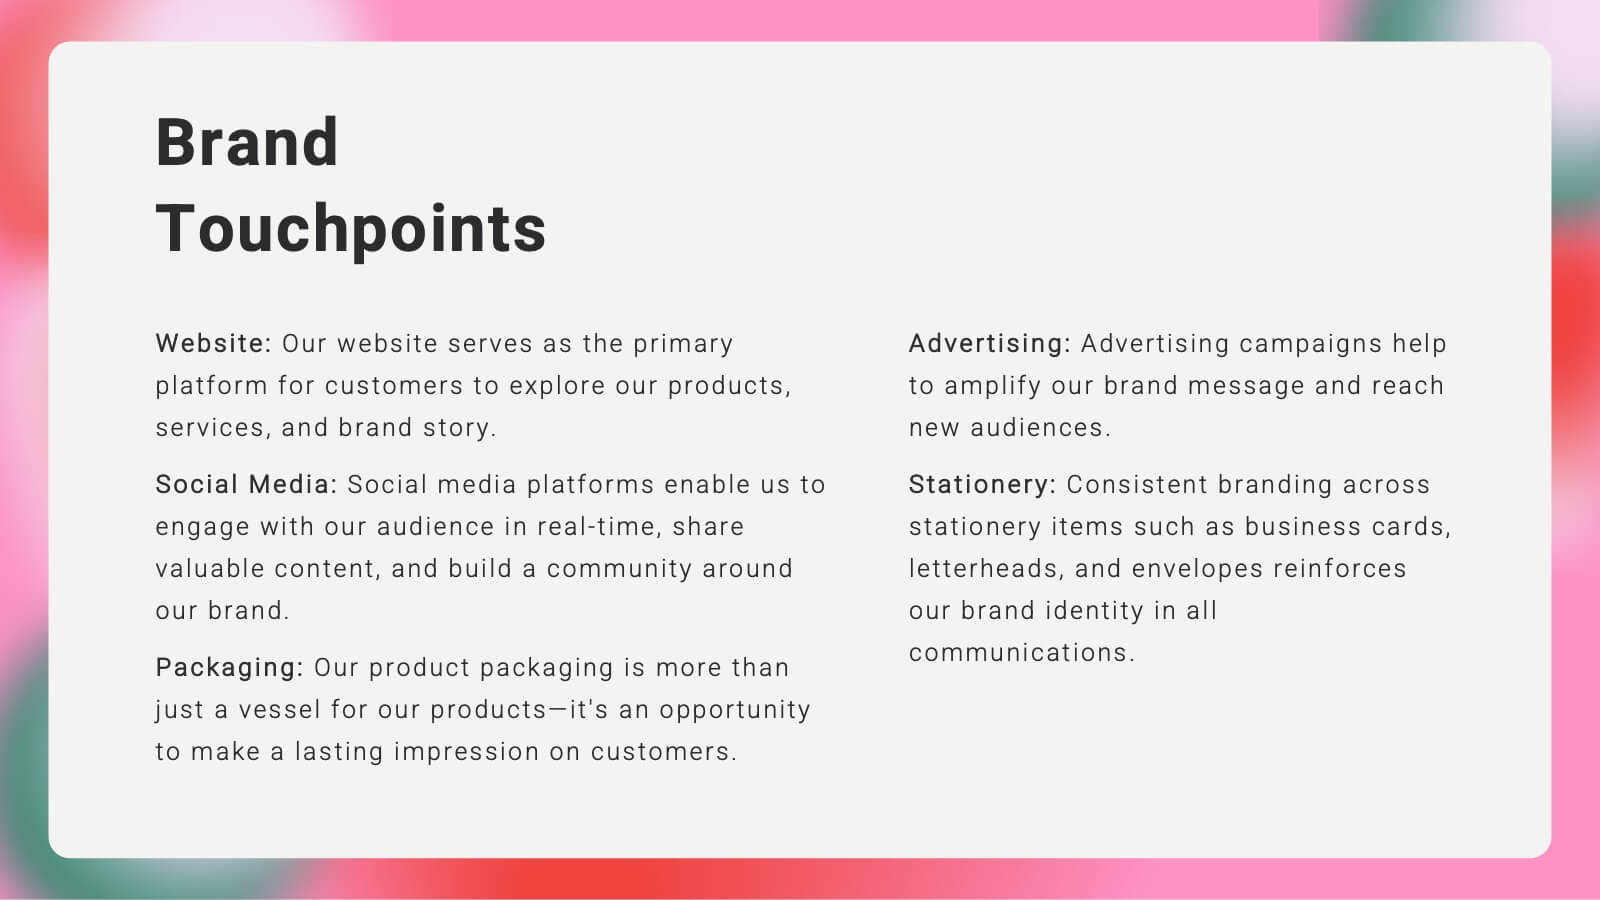
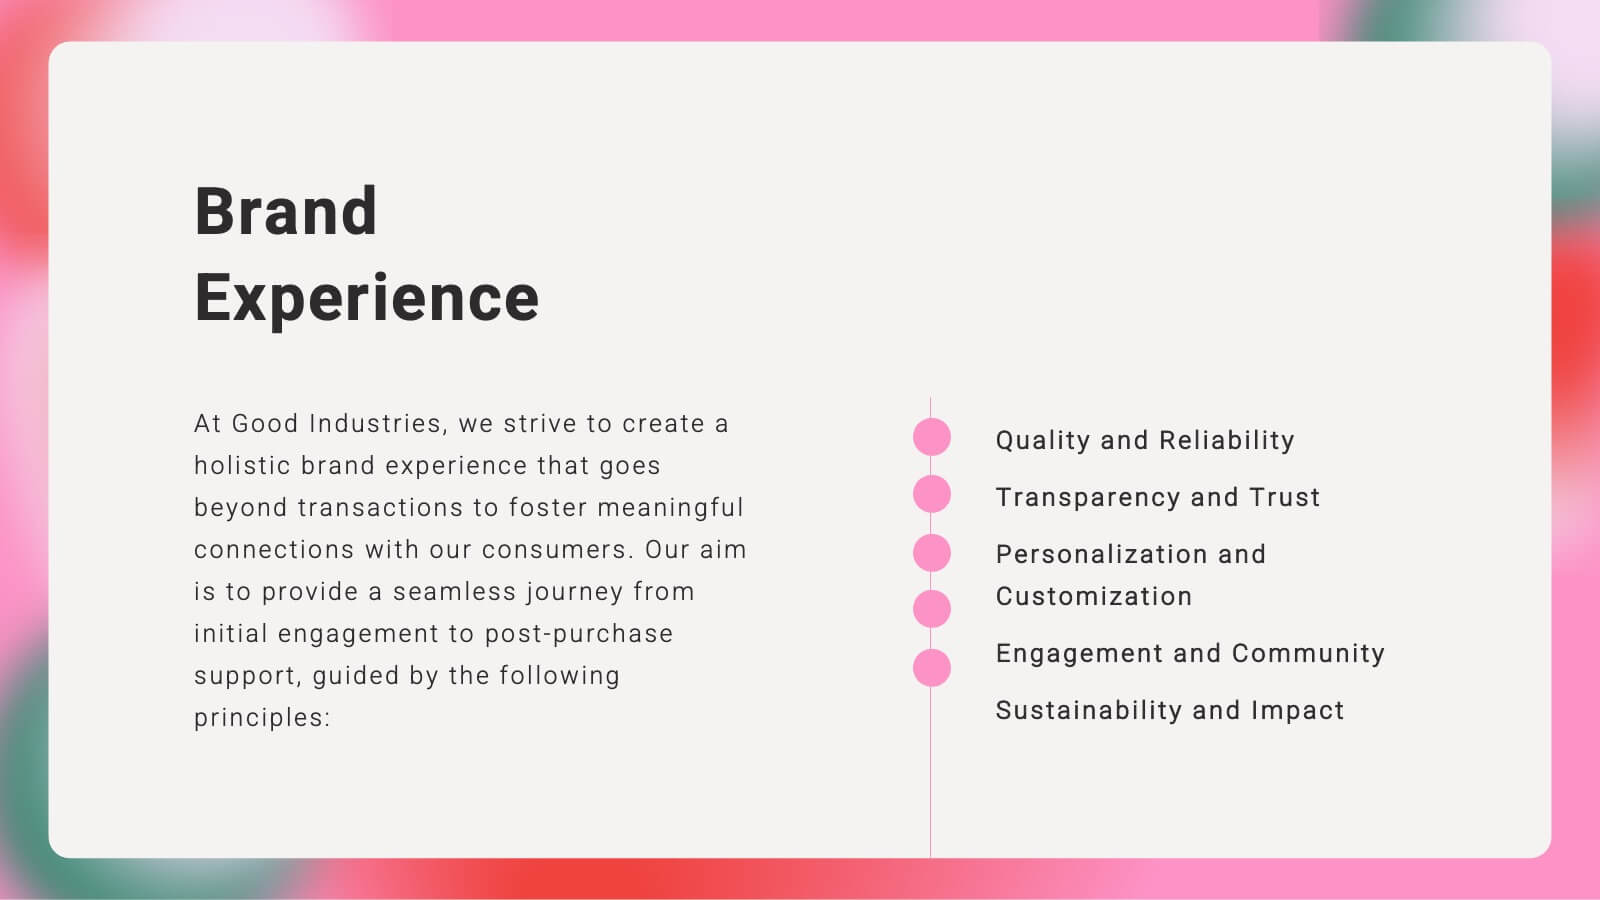
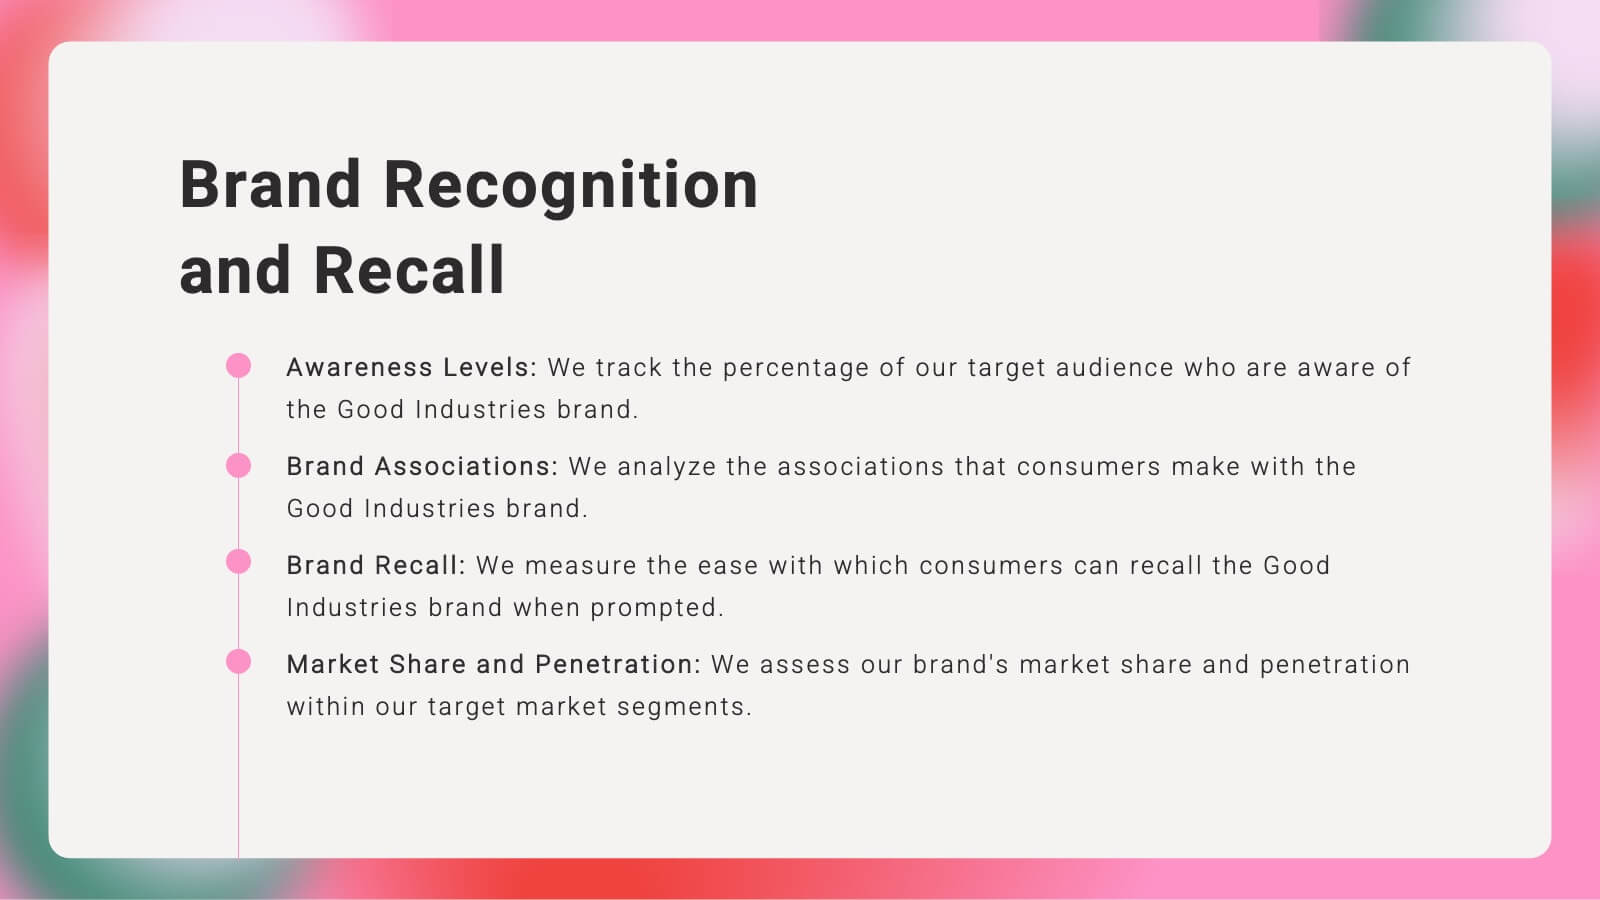
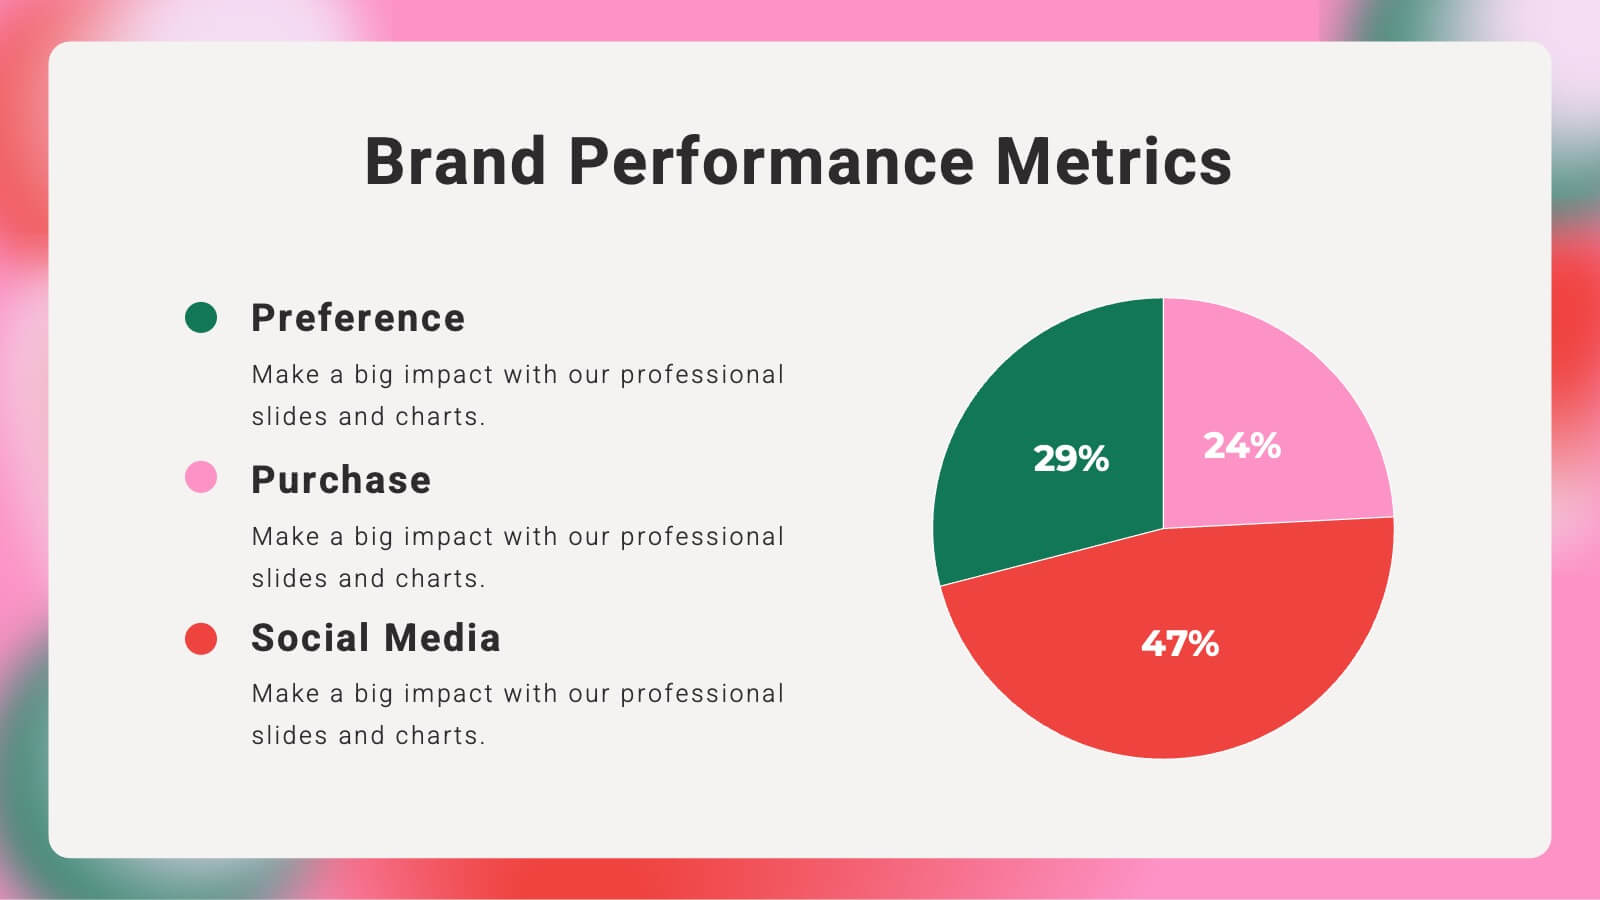
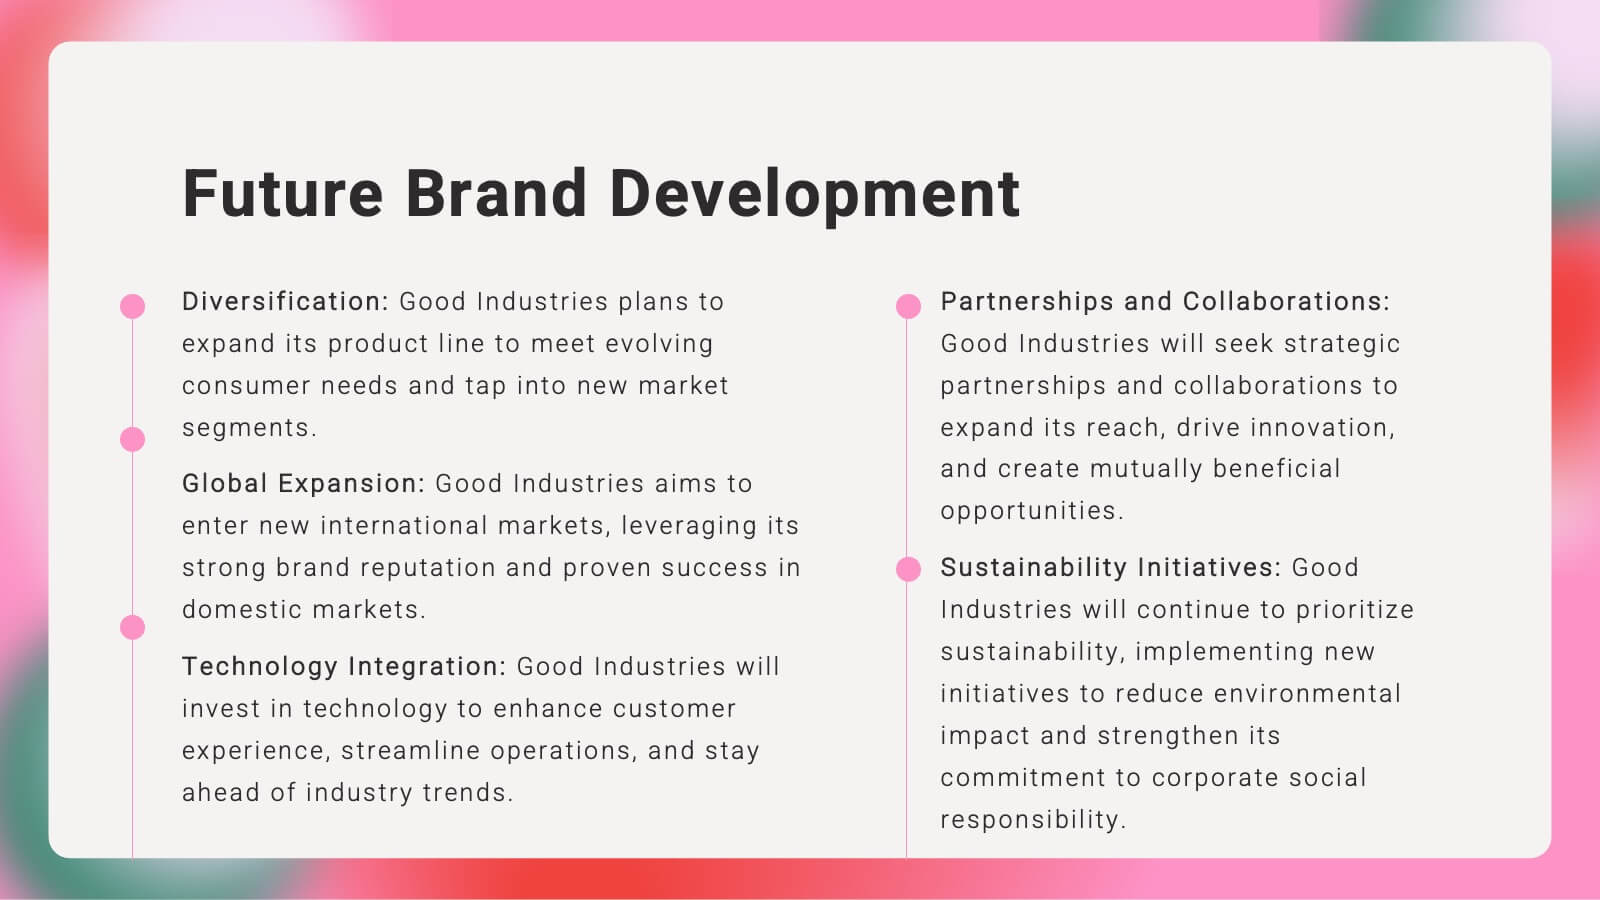
Kaleidoscope Brand Strategy Report Presentation
Craft a compelling narrative for your brand with this vibrant brand strategy presentation template. Designed to cover every facet of brand development, from vision and mission to market analysis and consumer personas, this template is an essential tool for businesses looking to establish a strong brand identity. It incorporates visually engaging slides that outline brand voice, values, and touchpoints, facilitating a thorough understanding of strategic branding. Compatible with platforms like PowerPoint, Google Slides, and Keynote, it is accessible across various devices, making it perfect for collaborative planning and presentations.


5 diapositivas
North America Business Landscape Map Presentation
Explore the business terrain with the "North America Business Landscape Map" template, which delivers a comprehensive visualization of business data across various regions. Designed for strategic presentations, it enables clear communication of market insights and data points, crucial for decision-making. This template is compatible with PowerPoint, Keynote, and Google Slides, enhancing its utility for professionals in diverse fields.


2 diapositivas
Opening Company Profile Introduction Presentation
Make a bold first impression with the Opening Company Profile Introduction Presentation — a sleek, modern design perfect for business overviews, team intros, or brand missions. Featuring clean typography and a purple accent shape that adds personality without distraction, this layout is ideal for concise, professional messaging. Fully editable and compatible with Canva, PowerPoint, Google Slides, and Keynote.


7 diapositivas
Executive Summary Infographic Presentation Template
An Executive Summary is a document that provides an overview of the main points of a larger report. It is often written to share with individuals who may not have time to review the entire report. The executive summary provides a summary that sets out what's in the report, who it is written for, what it covers and why it's important. Use this template to create a powerful summary, which makes it easier to communicate your engagement results and outline your most important points. This template was designed to suggest a number of ways to enhance your executive summary and make it more persuasive.


6 diapositivas
Demographic Transition Infographics
Embark on a journey through the fascinating concept of demographic transition! This infographic opens the door to understanding how societies evolve over time in terms of population growth and age structure. From the early stages of high birth and death rates to the advanced stages of low birth and death rates, we unveil the intricate phases of demographic transition that shape our world. Discover the profound impacts of demographic transition on societies and economies. Learn how changes in population structure affect labor markets, healthcare systems, and social welfare. Understand the opportunities for economic growth and development that can arise from a favorable demographic transition. With this engaging infographic, compatible with PowerPoint, Keynote, and Google Slides, sharing your understanding of demographic transition has never been more accessible. Empower yourself with the knowledge to comprehend and discuss this vital aspect of our world's development. Dive into the complexities of demographic transition and embark on a journey of exploration and enlightenment.


6 diapositivas
Business Growth and Progress Report Presentation
Visualize business success with clarity using this Business Growth and Progress Report template. This puzzle-style infographic illustrates the interconnected steps of development, making it ideal for performance tracking, quarterly reports, and strategic planning. Fully customizable—adjust colors, labels, and data points to align with your business metrics. Compatible with PowerPoint, Keynote, and Google Slides for effortless integration into your presentations.


4 diapositivas
Revenue Growth and Sales Forecast Layout Presentation
Present your key performance indicators with precision using the Revenue Growth and Sales Forecast Layout Presentation. This template features clear bar and donut charts to highlight revenue progression, product performance, and stock availability. Ideal for quarterly business reviews, financial reports, and sales team updates. Fully editable in Canva, PowerPoint, Keynote, and Google Slides.


5 diapositivas
Scalability and Sustainable Growth Model Presentation
Communicate long-term vision with the Scalability and Sustainable Growth Model Presentation. This layered mountain-style design is ideal for visualizing strategic phases, scaling challenges, or sustainable development milestones. Perfect for roadmap pitches, growth models, or financial projections—fully editable in PowerPoint, Keynote, and Google Slides.


7 diapositivas
Buyer Persona Guide Infographic
Elevate your marketing strategy with our Buyer Persona Guide Infographic Template, designed to distill complex customer data into stunning, easy-to-understand visual profiles. This template is a canvas for creativity, allowing marketers to paint detailed portraits of their ideal customers using a mix of vibrant colors, engaging layouts, and succinct text. Craft each persona with care, detailing demographics, preferences, behaviors, and needs, all laid out in an aesthetically pleasing format that makes data pop off the page. Whether you're presenting to stakeholders, guiding your content strategy, or training your sales team, these visuals serve as your roadmap to deeper customer connections. Fully customizable to reflect your brand's unique voice and style, this template adapts seamlessly to your needs, ensuring that every insight into your audience is not just informative but also visually captivating. It's an essential tool for anyone looking to enhance their understanding of their market and refine their approach to meet customer demands.


5 diapositivas
Employee Training Roadmap Presentation
Take your team on a visual journey that maps out success, one milestone at a time. This roadmap presentation is perfect for outlining employee training stages in a clear, engaging way. Each point leads naturally to the next. Fully editable and compatible with PowerPoint, Keynote, and Google Slides for seamless use.


5 diapositivas
Financial Credit Card Management Presentation
Present credit card processes, workflows, or customer engagement steps with this clean, step-by-step infographic layout. Featuring five clearly defined stages, icons, and space for key insights, it’s perfect for visualizing application journeys, fraud prevention, or usage optimization. Great for banks, fintech presentations, or financial coaching. Fully editable in PowerPoint, Keynote, and Google Slides.


22 diapositivas
Athena Creative Design Report Presentation
Showcase your creative projects with this vibrant design report template! Highlight objectives, concept development, prototypes, and design iterations with sleek visuals. Perfect for designers and creative teams. Compatible with PowerPoint, Keynote, and Google Slides.