


Características


¿Tienes alguna pregunta?
Recomendar


5 diapositivas
Purpose-Driven Mission and Values Presentation
Present your organization’s core purpose and guiding principles with this Purpose-Driven Mission and Values presentation. This clean, flag-style layout is perfect for showcasing five key pillars such as integrity, collaboration, or innovation. Easily customizable in Canva, PowerPoint, or Google Slides to align with your brand.

20 diapositivas
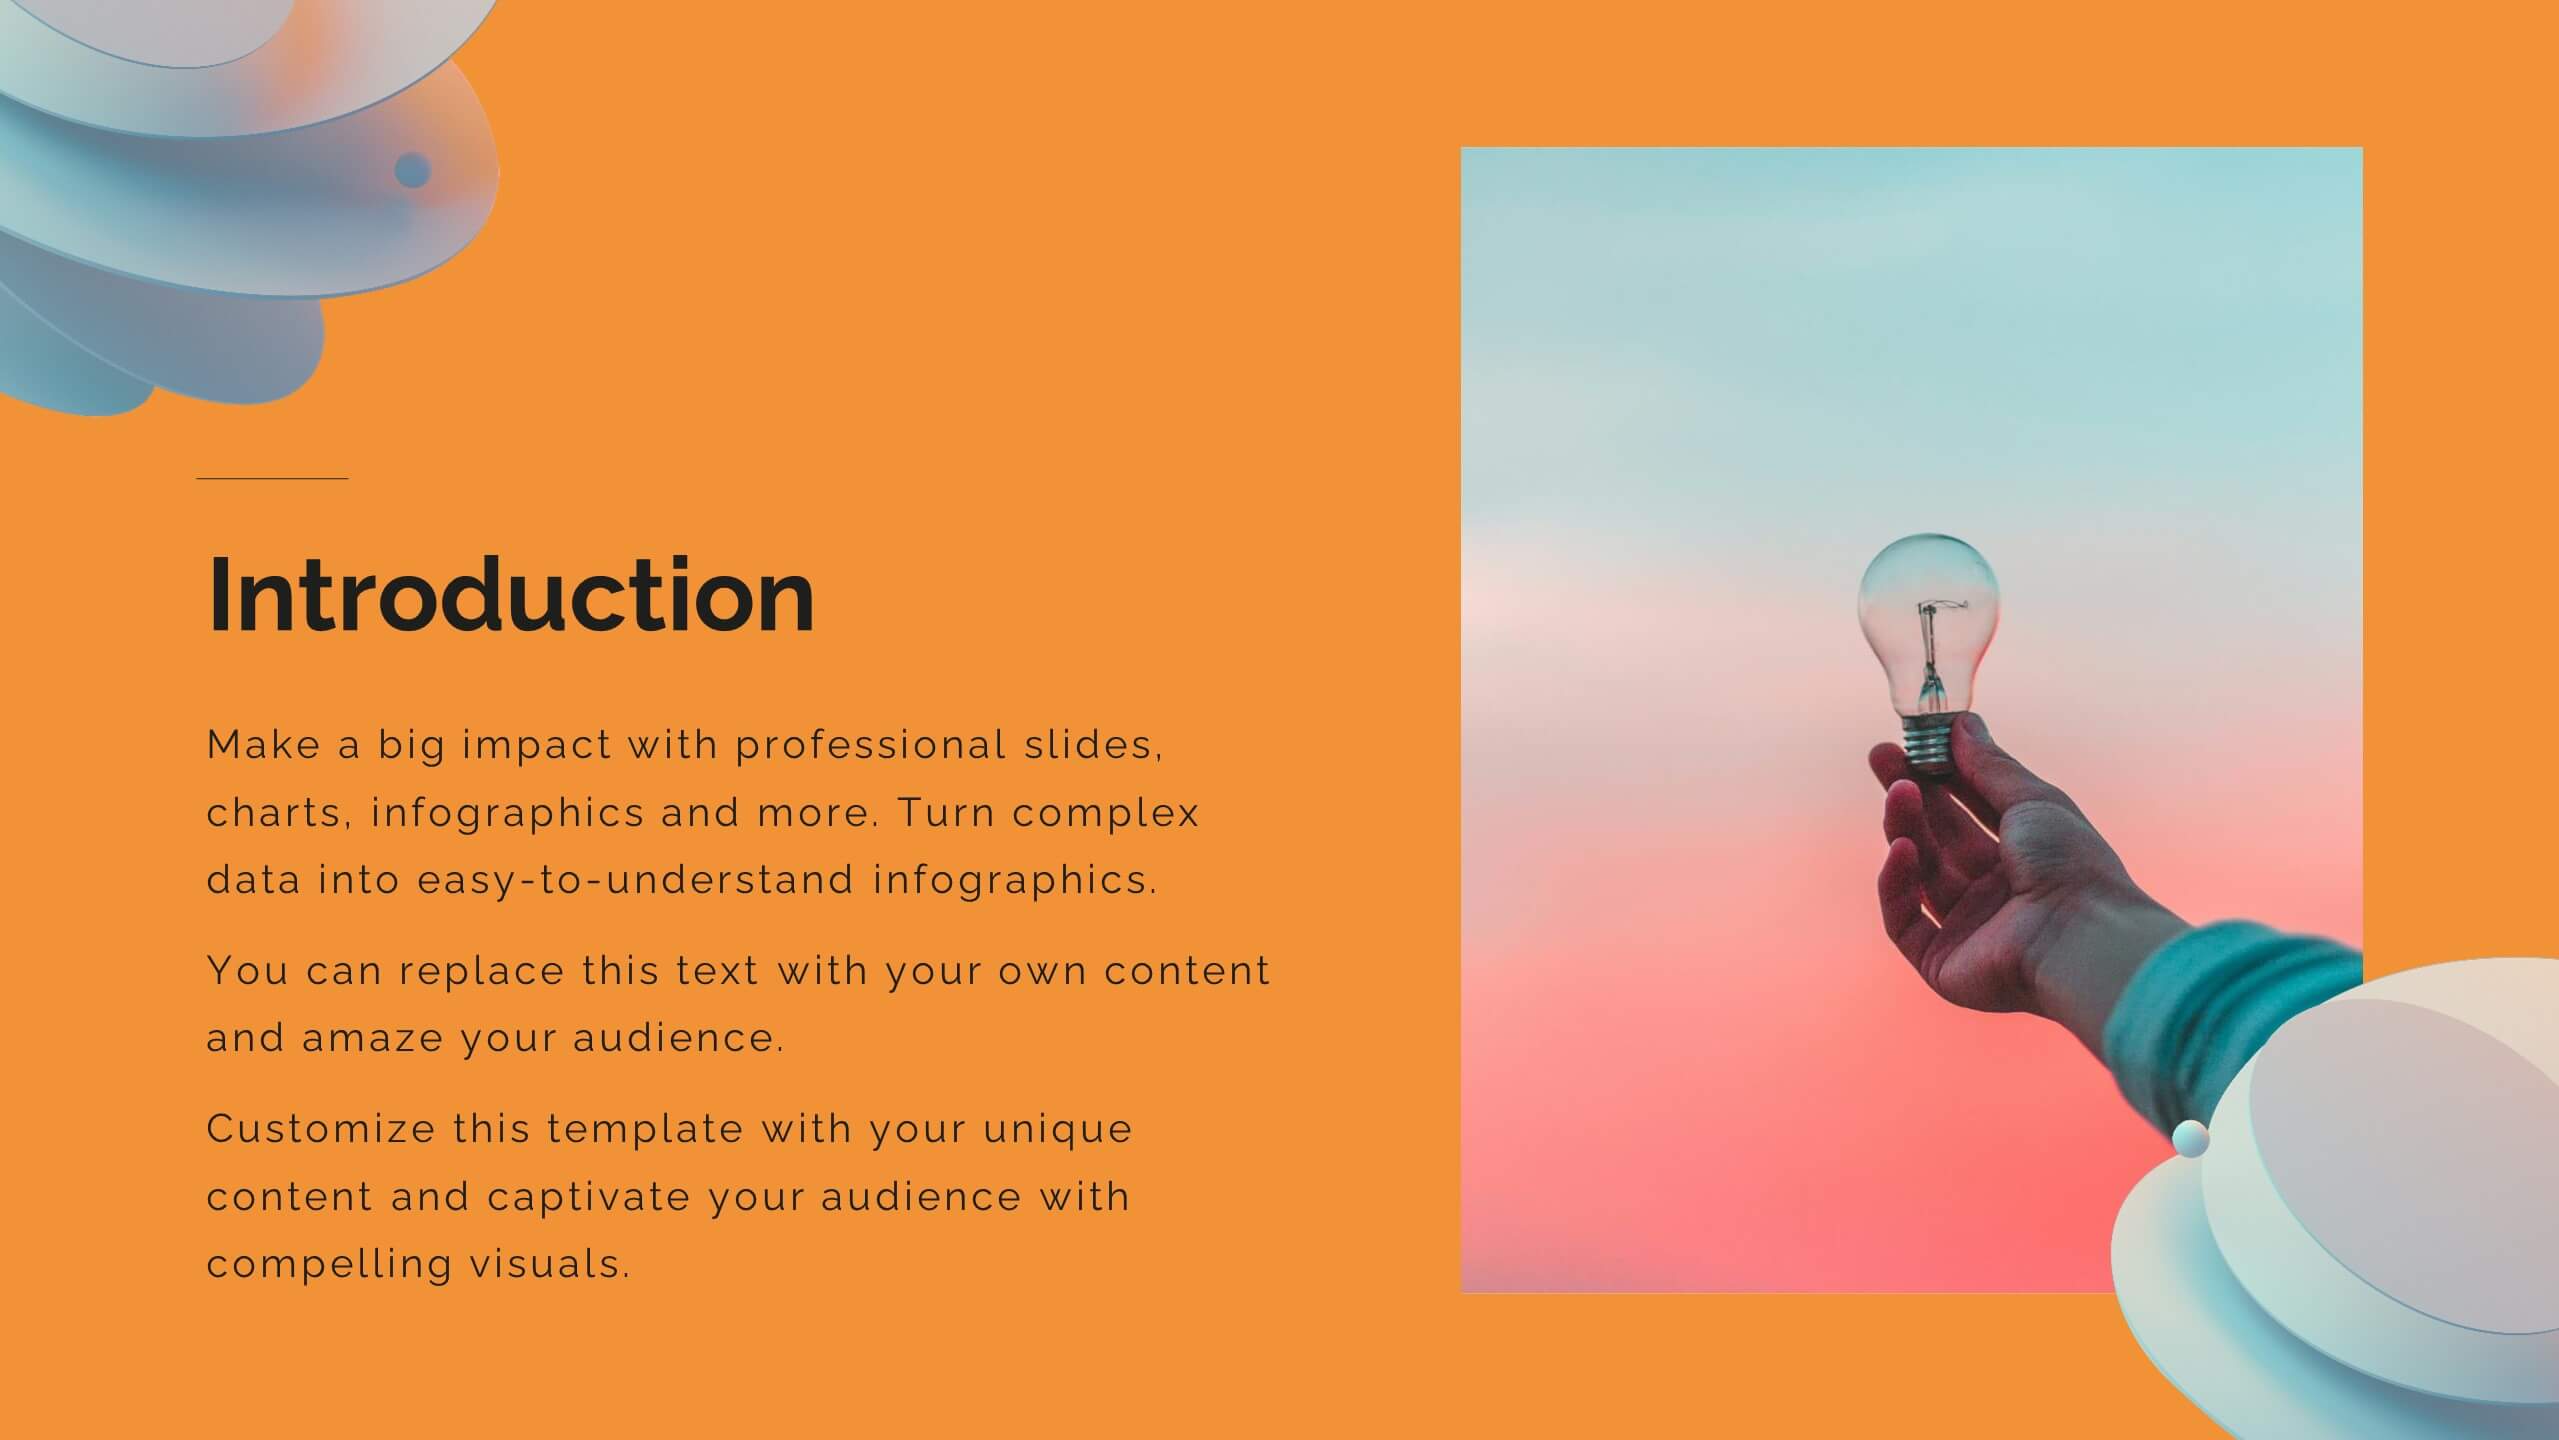
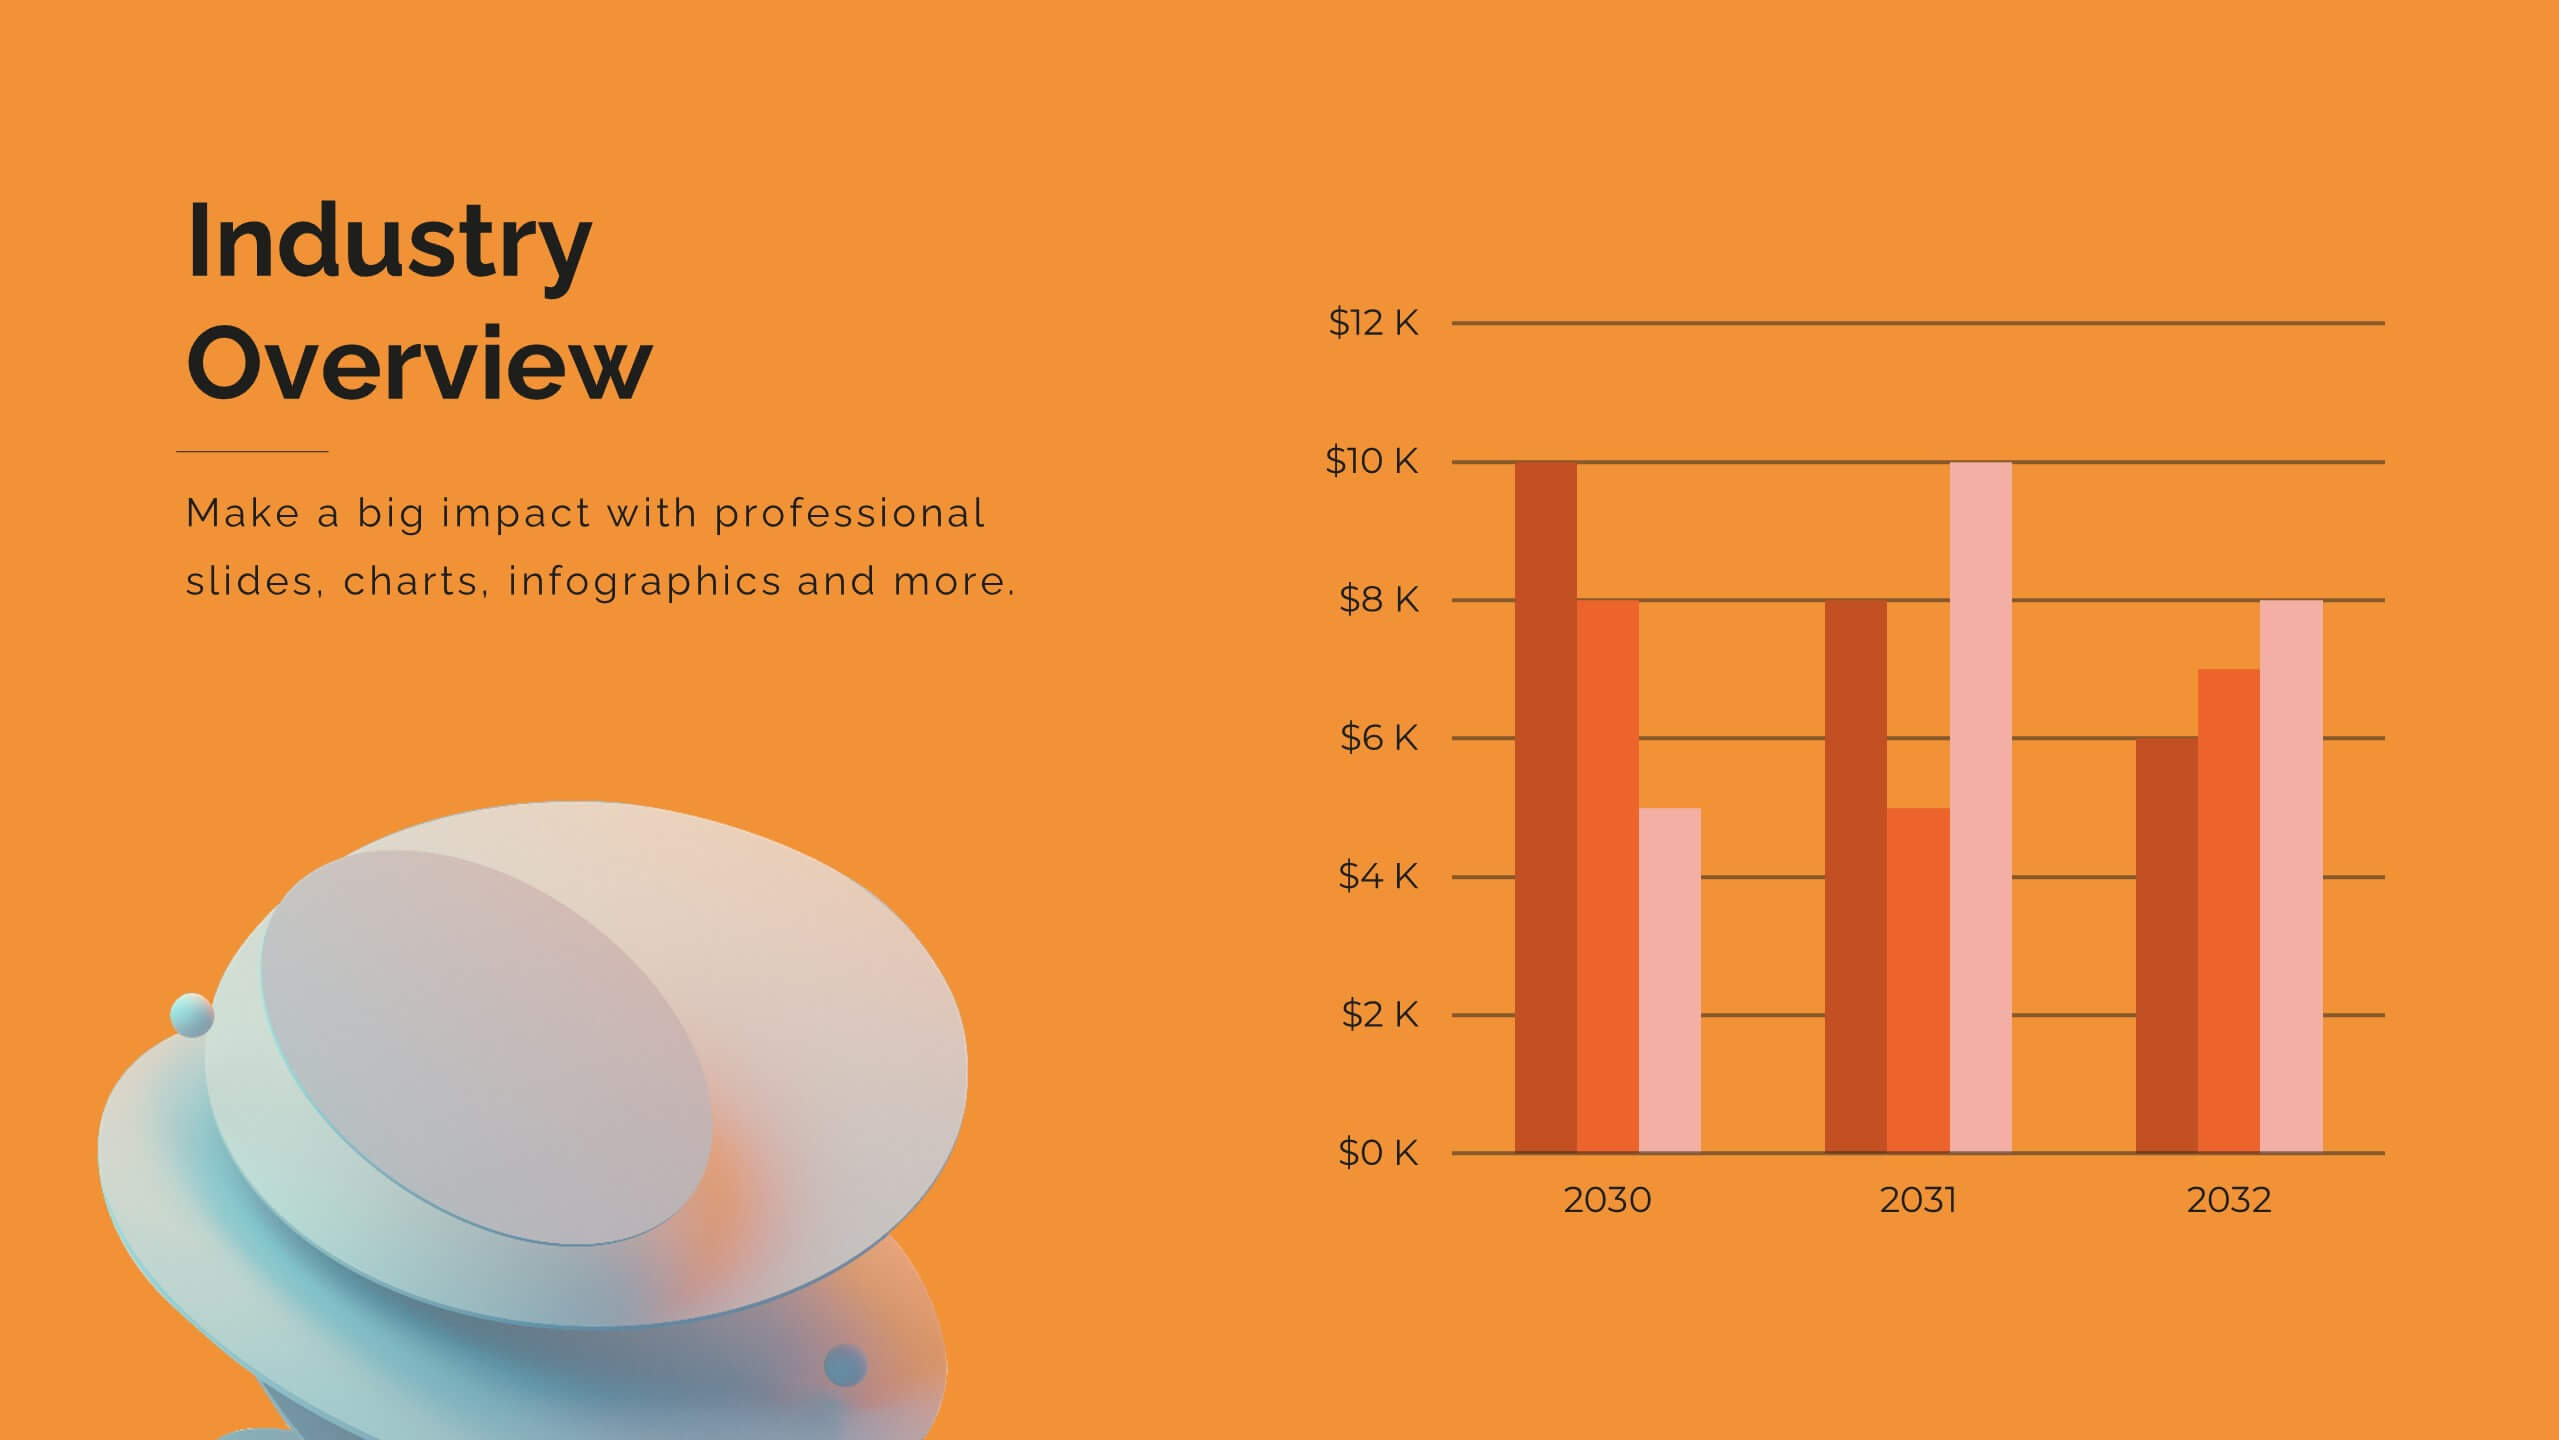
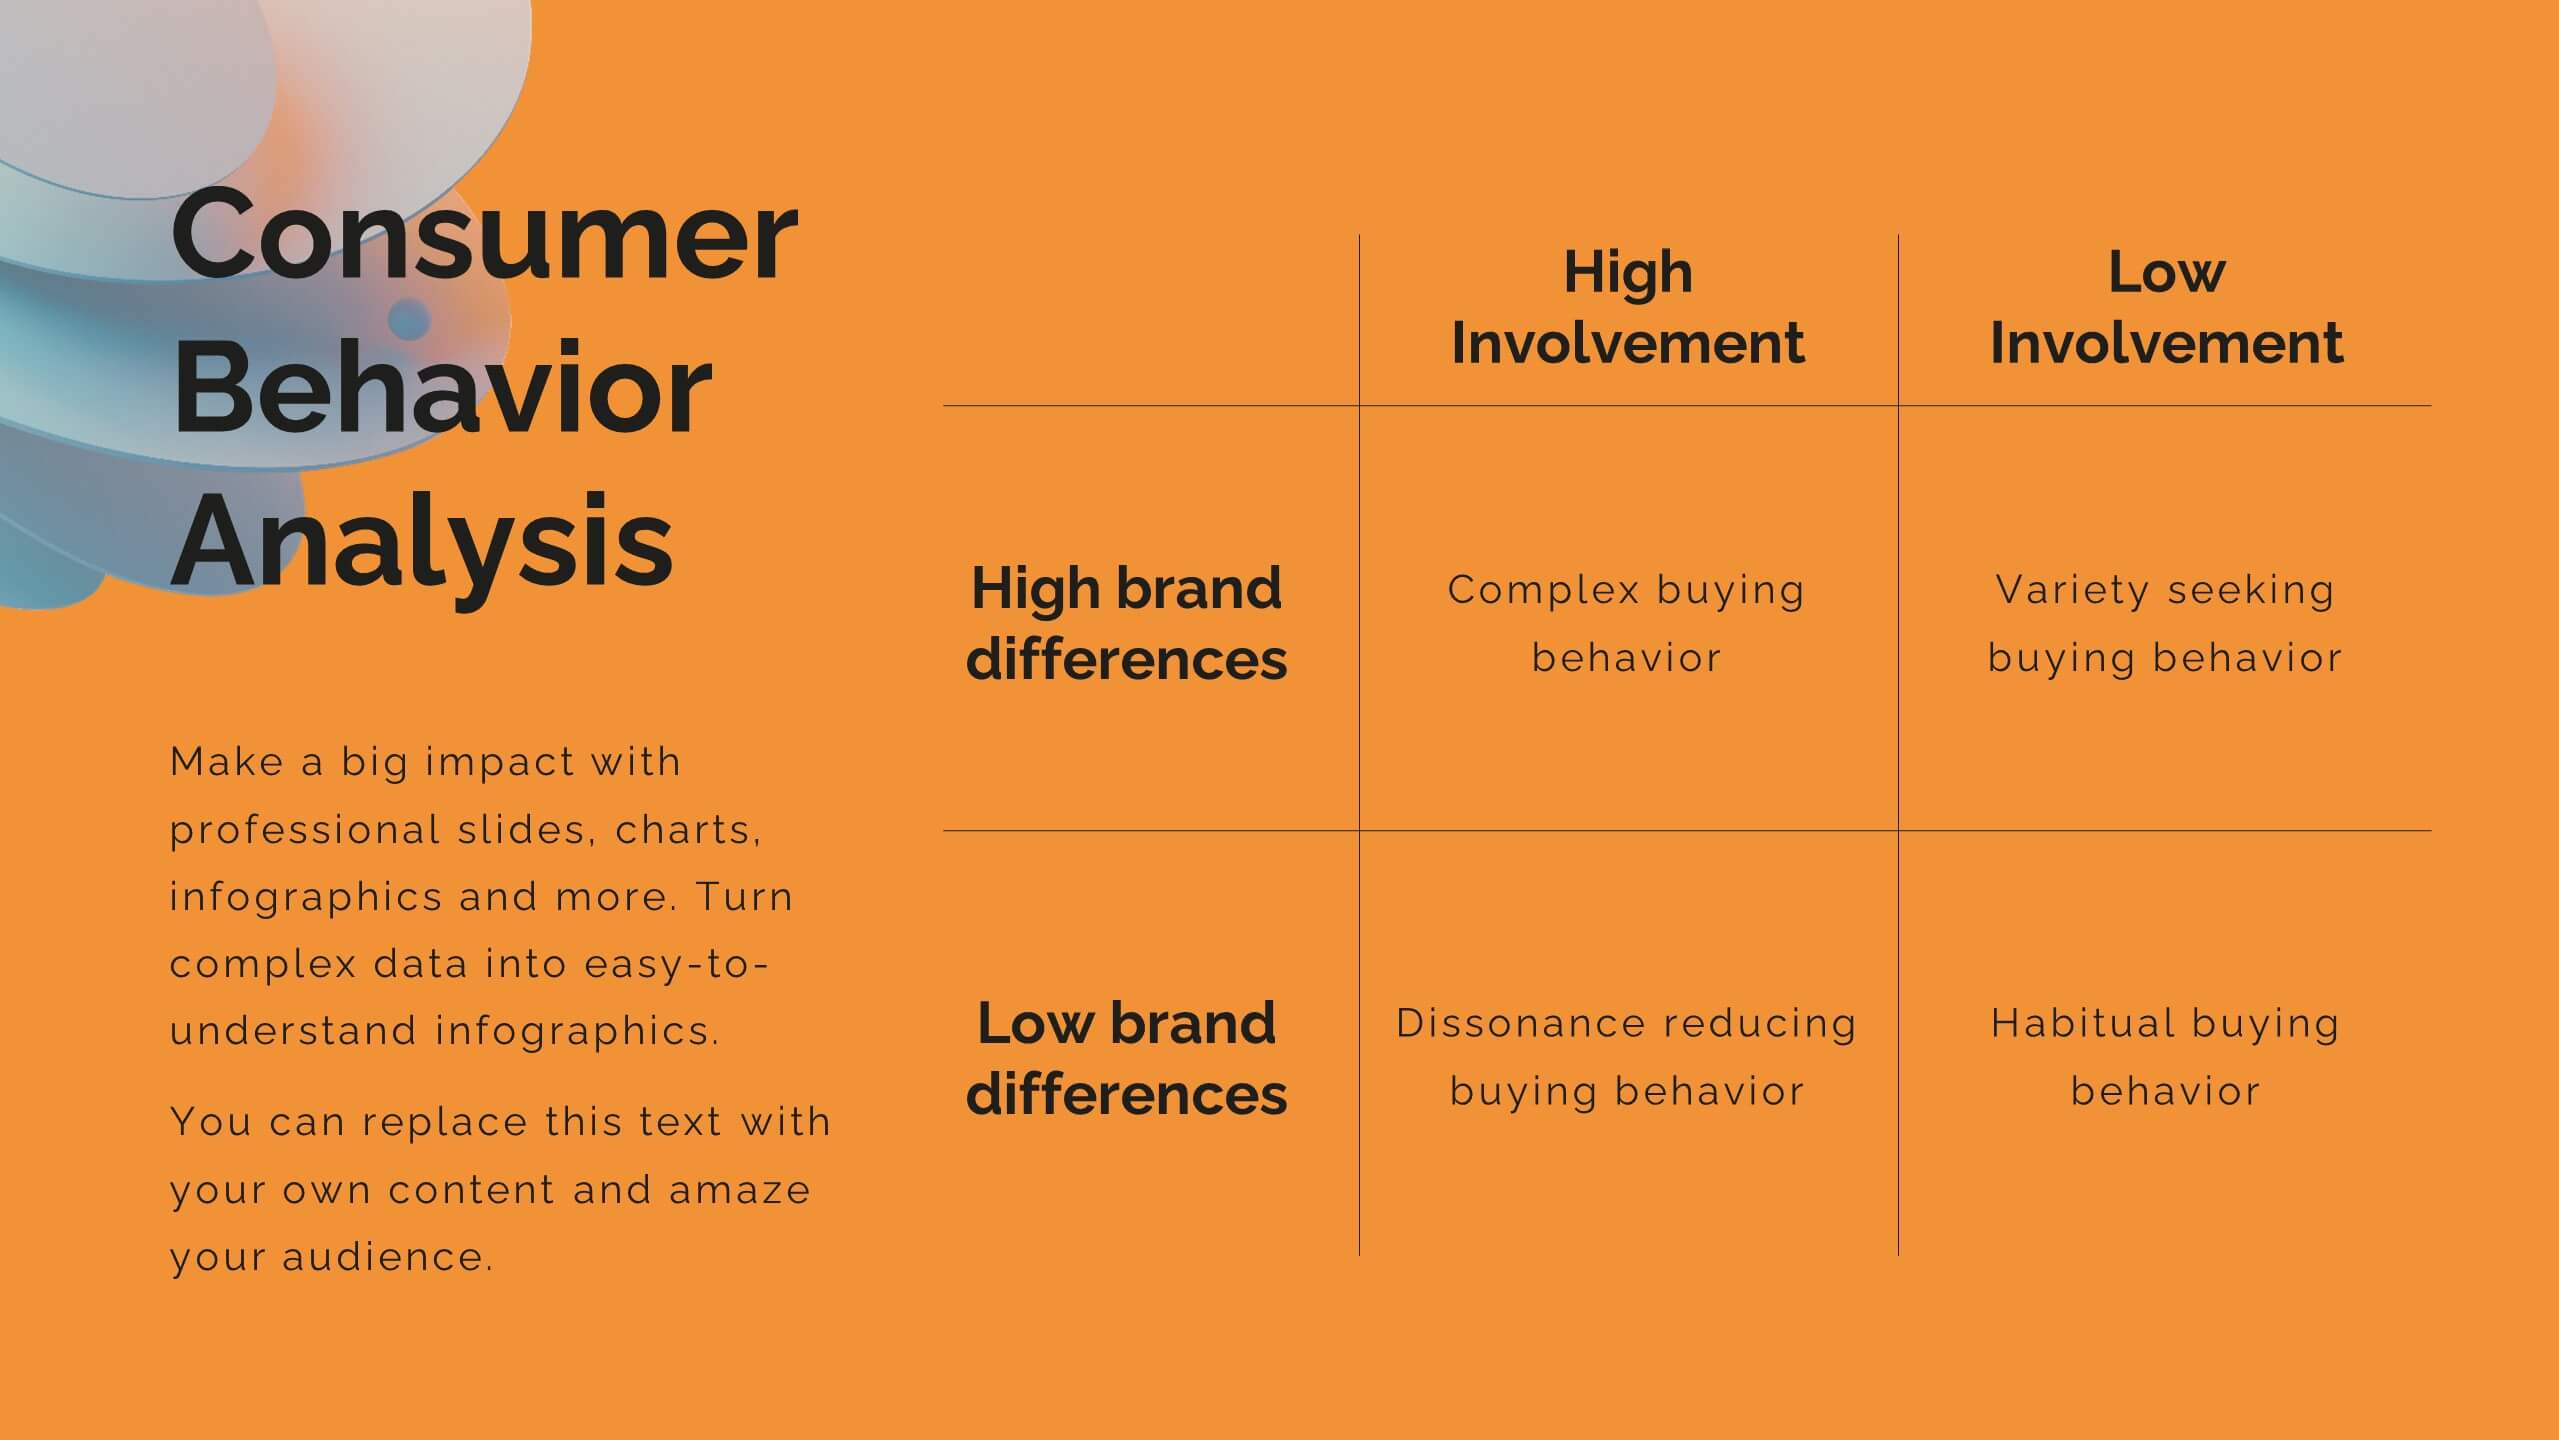
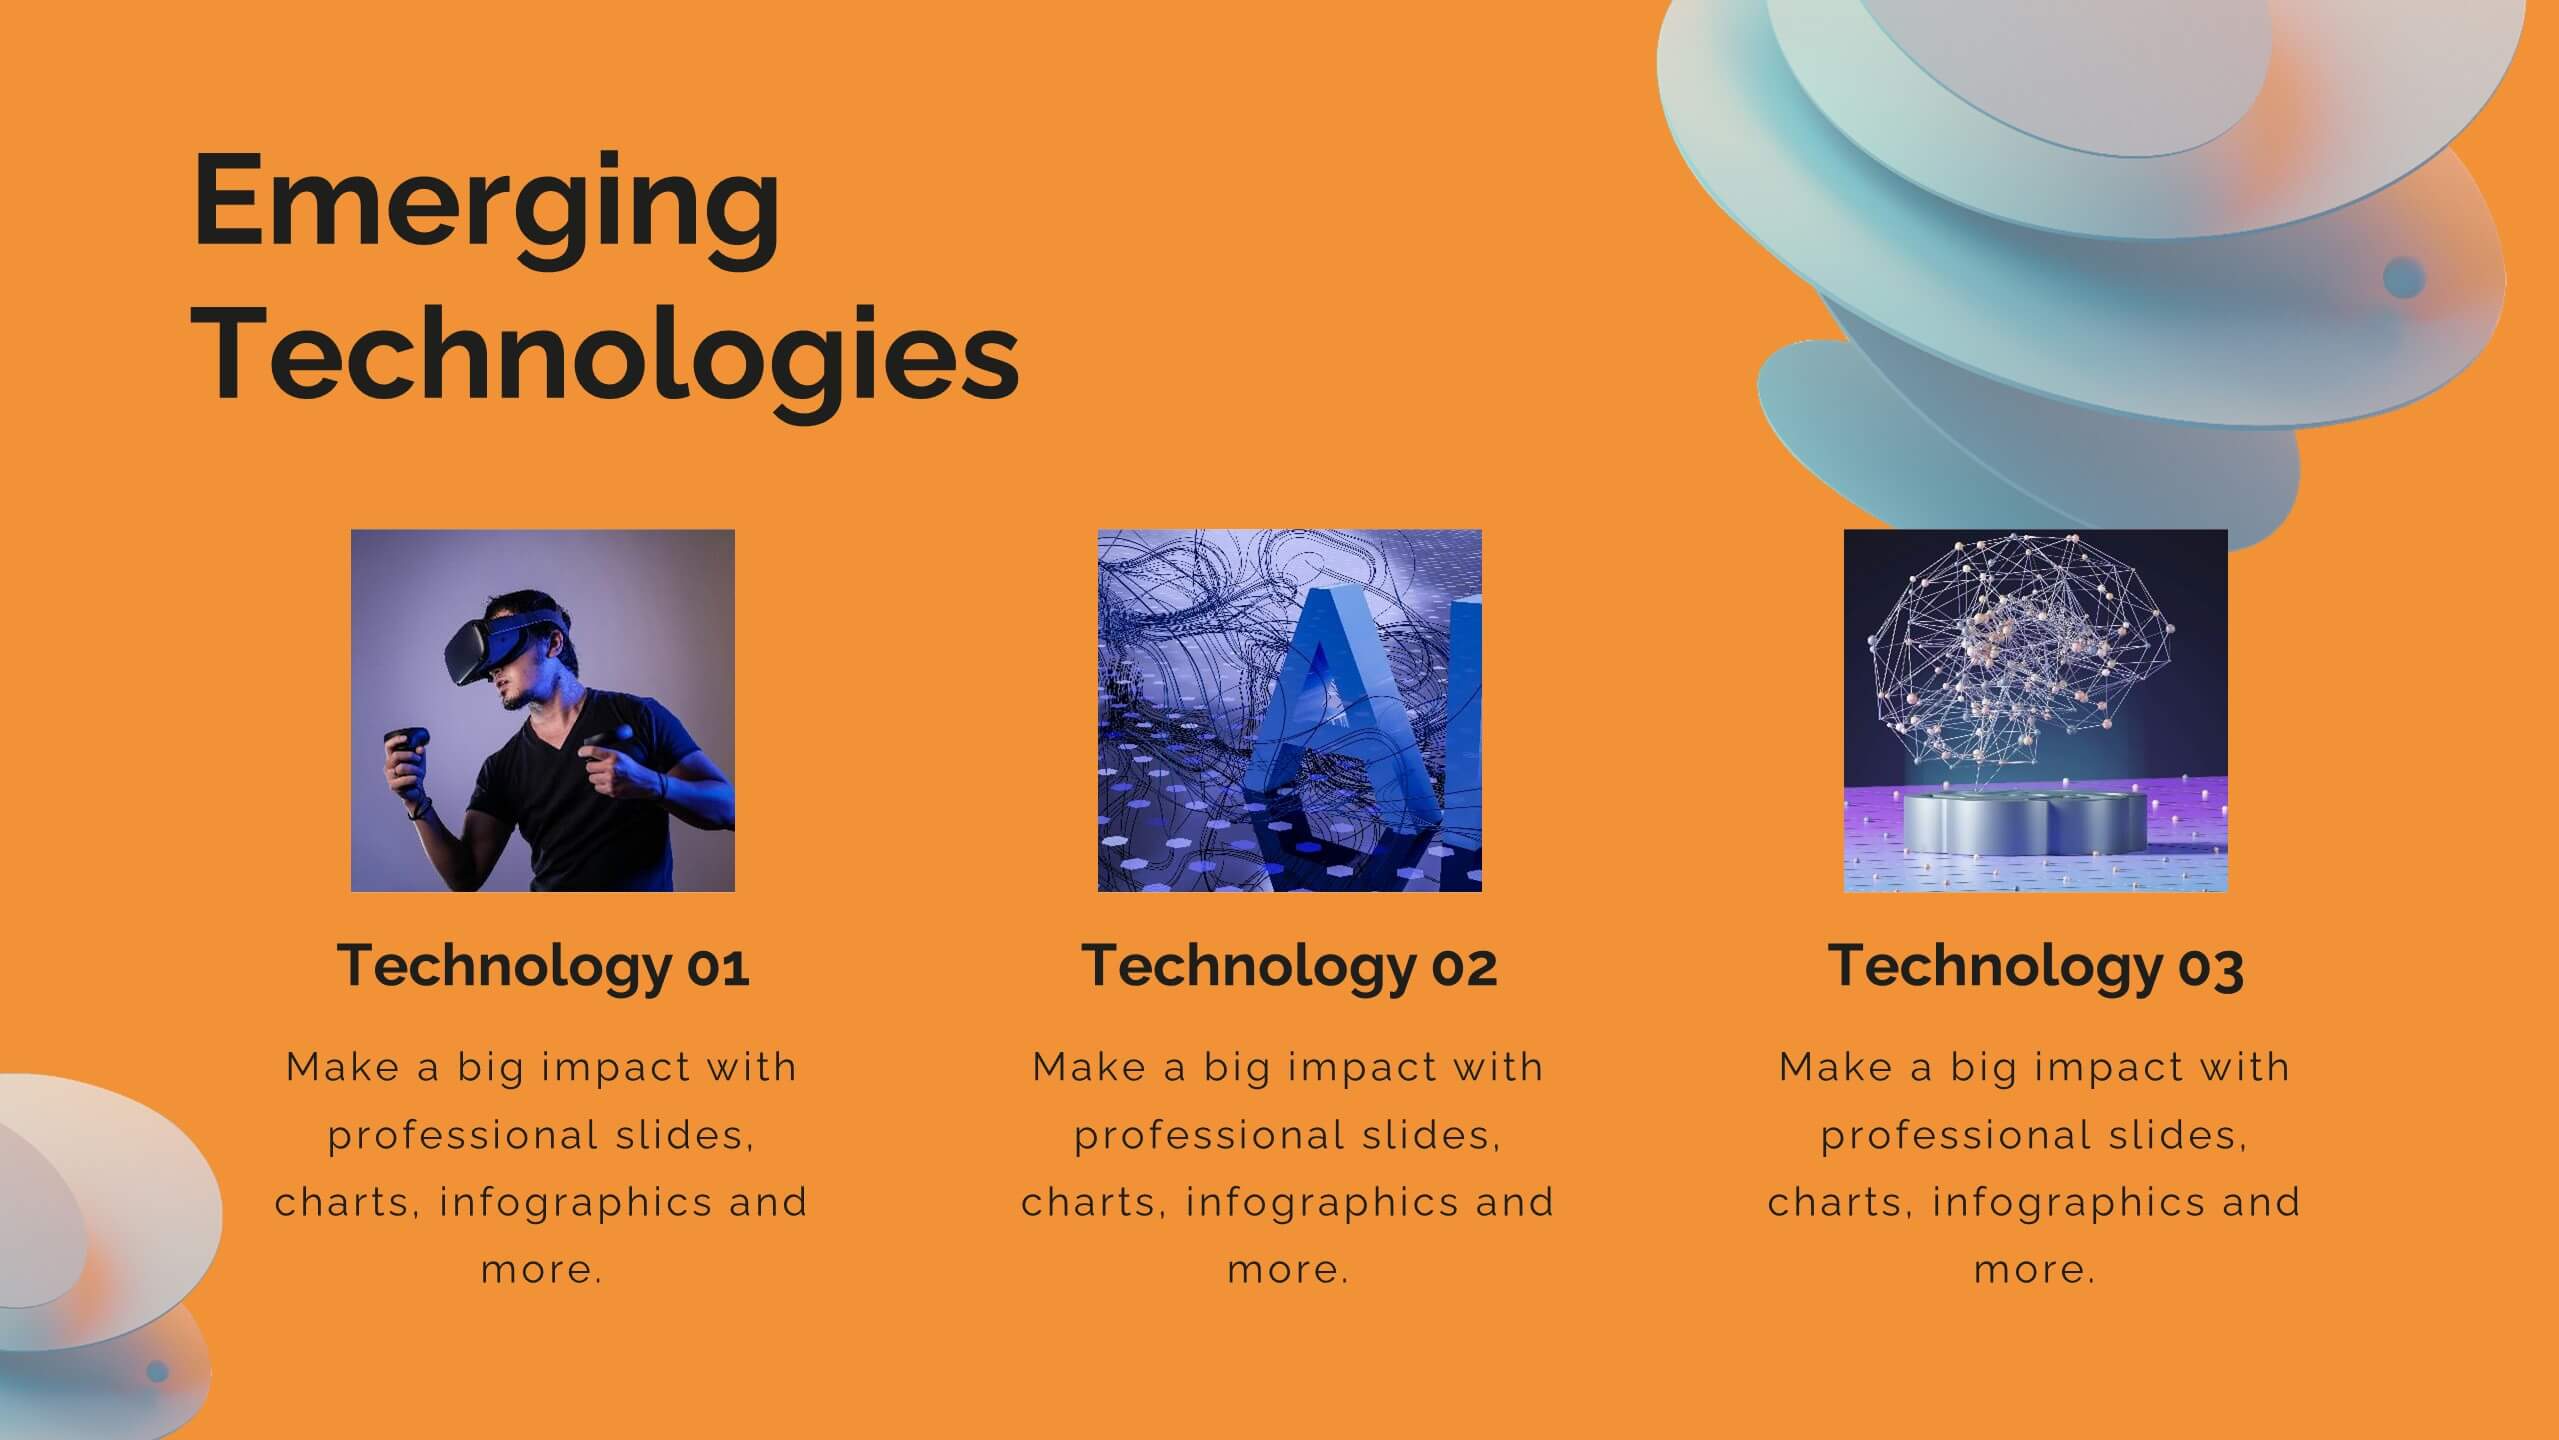
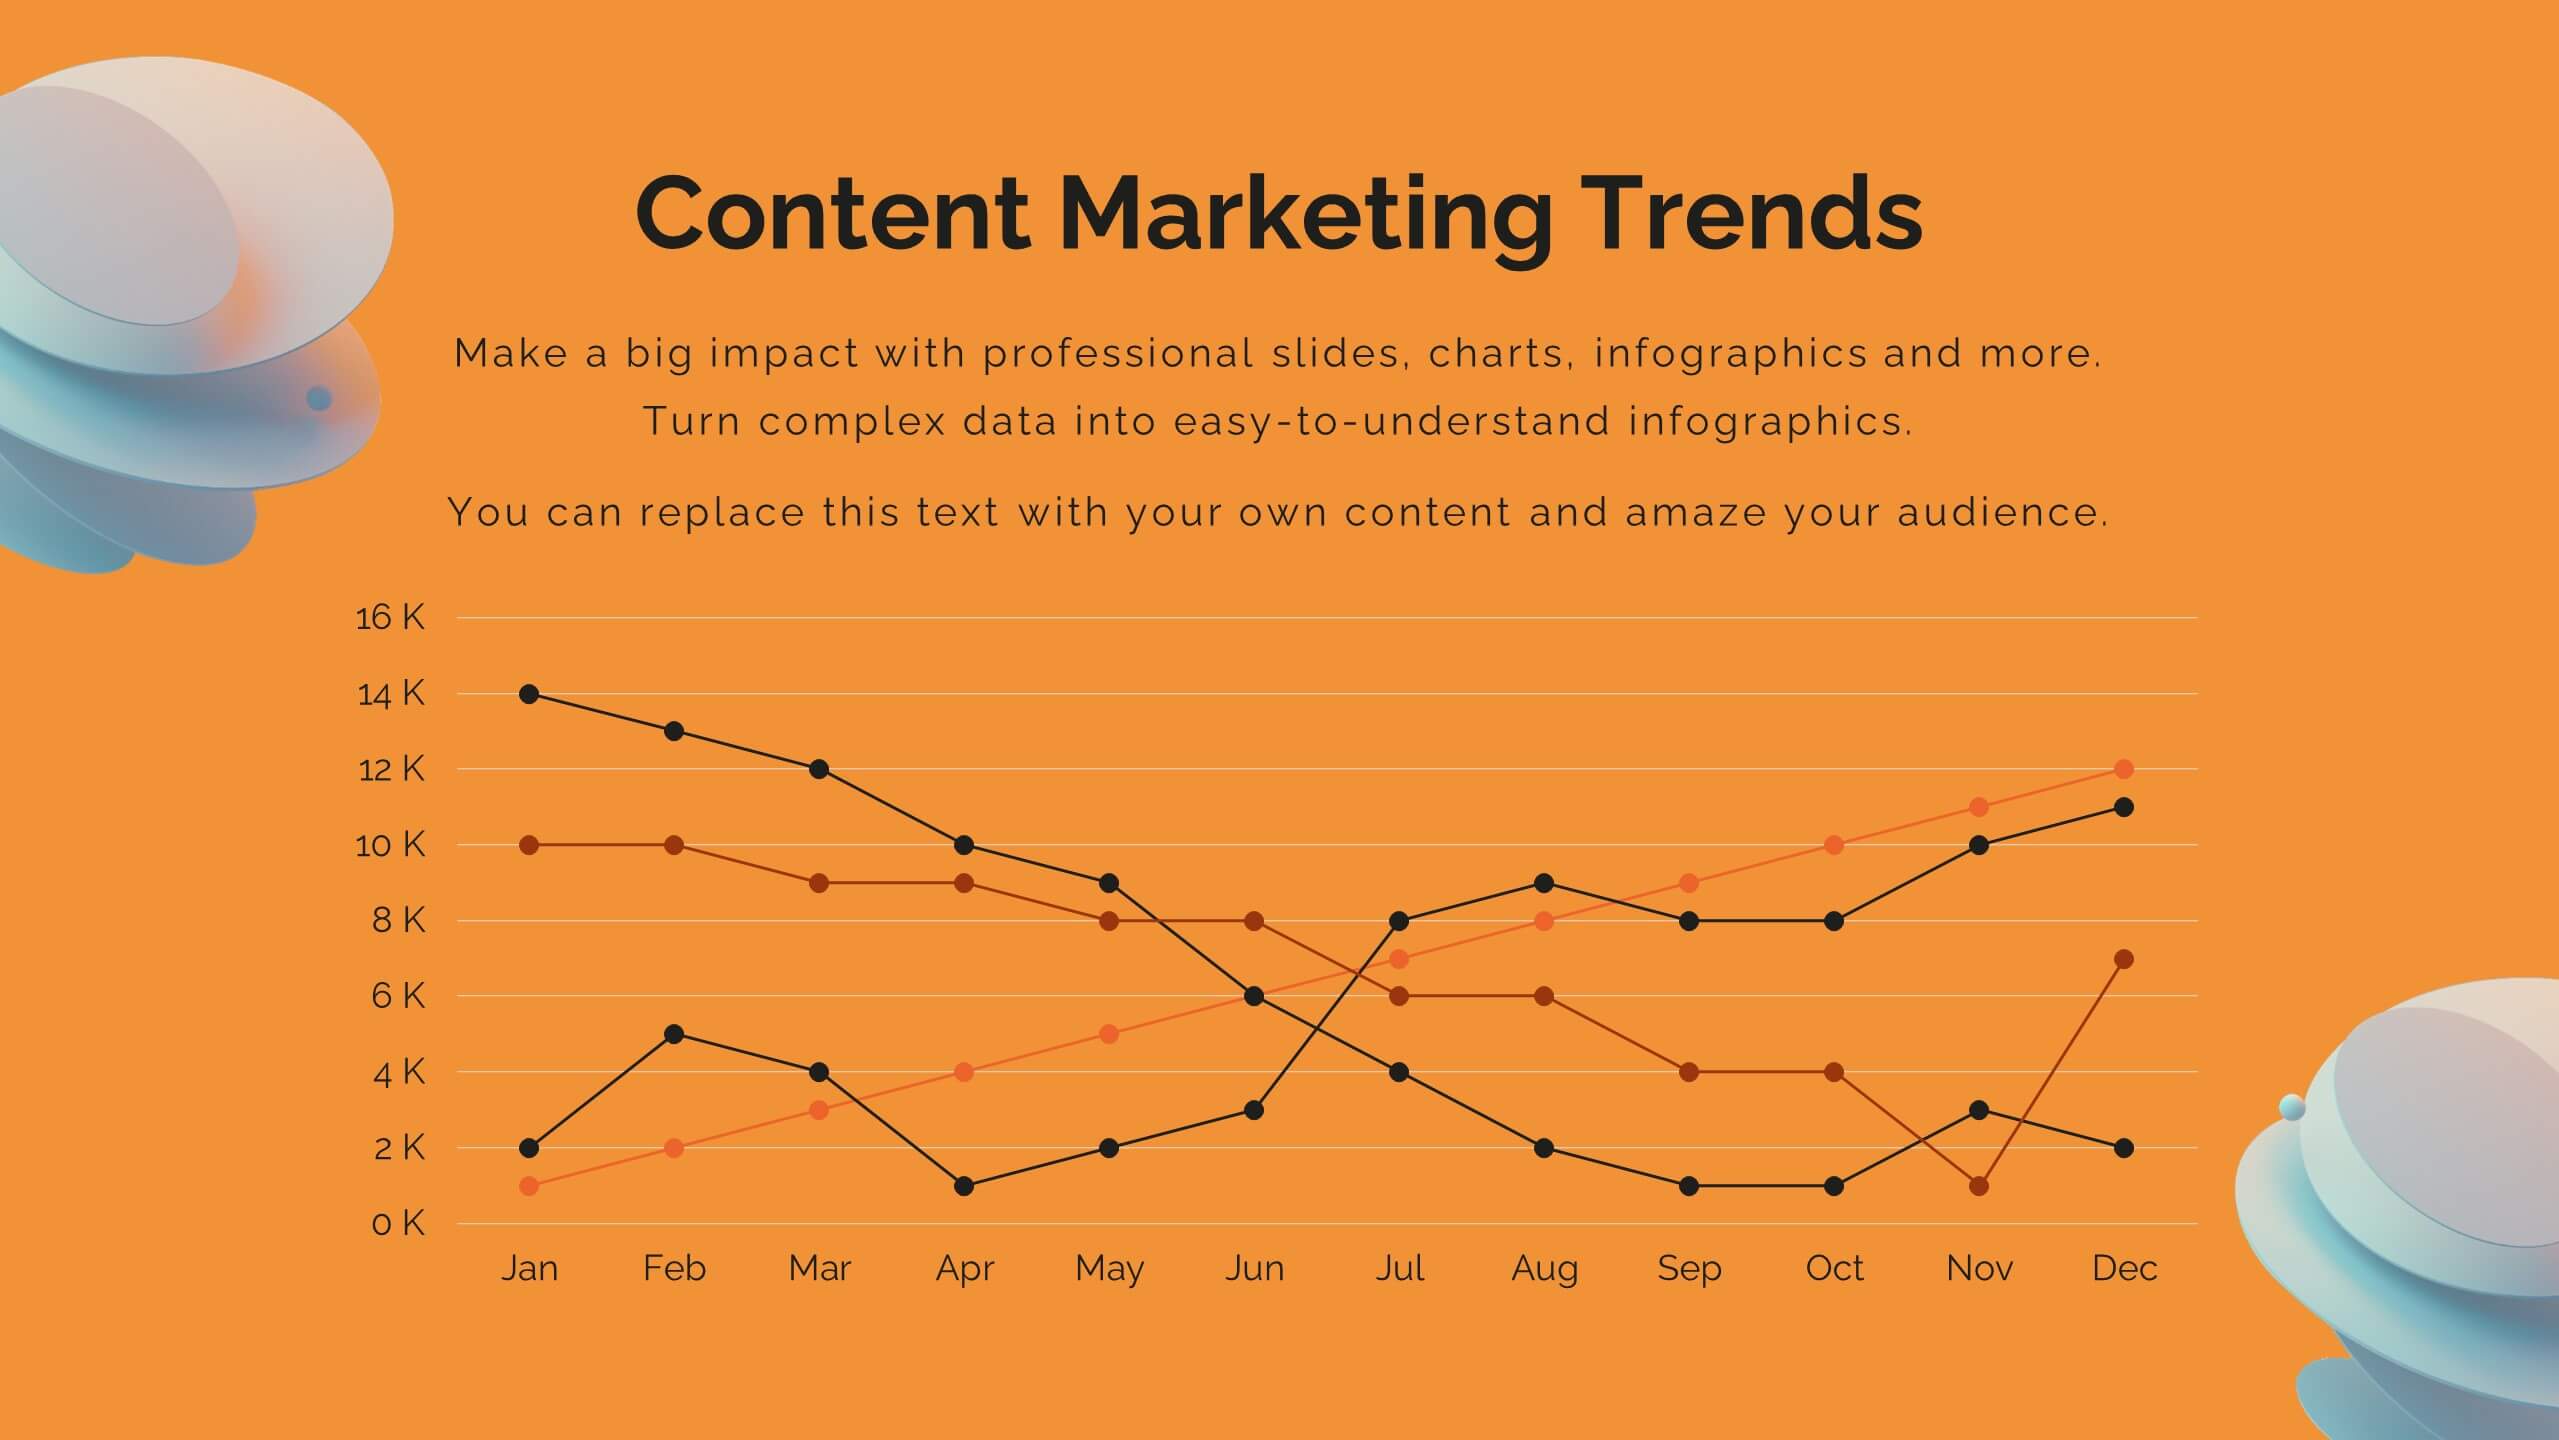
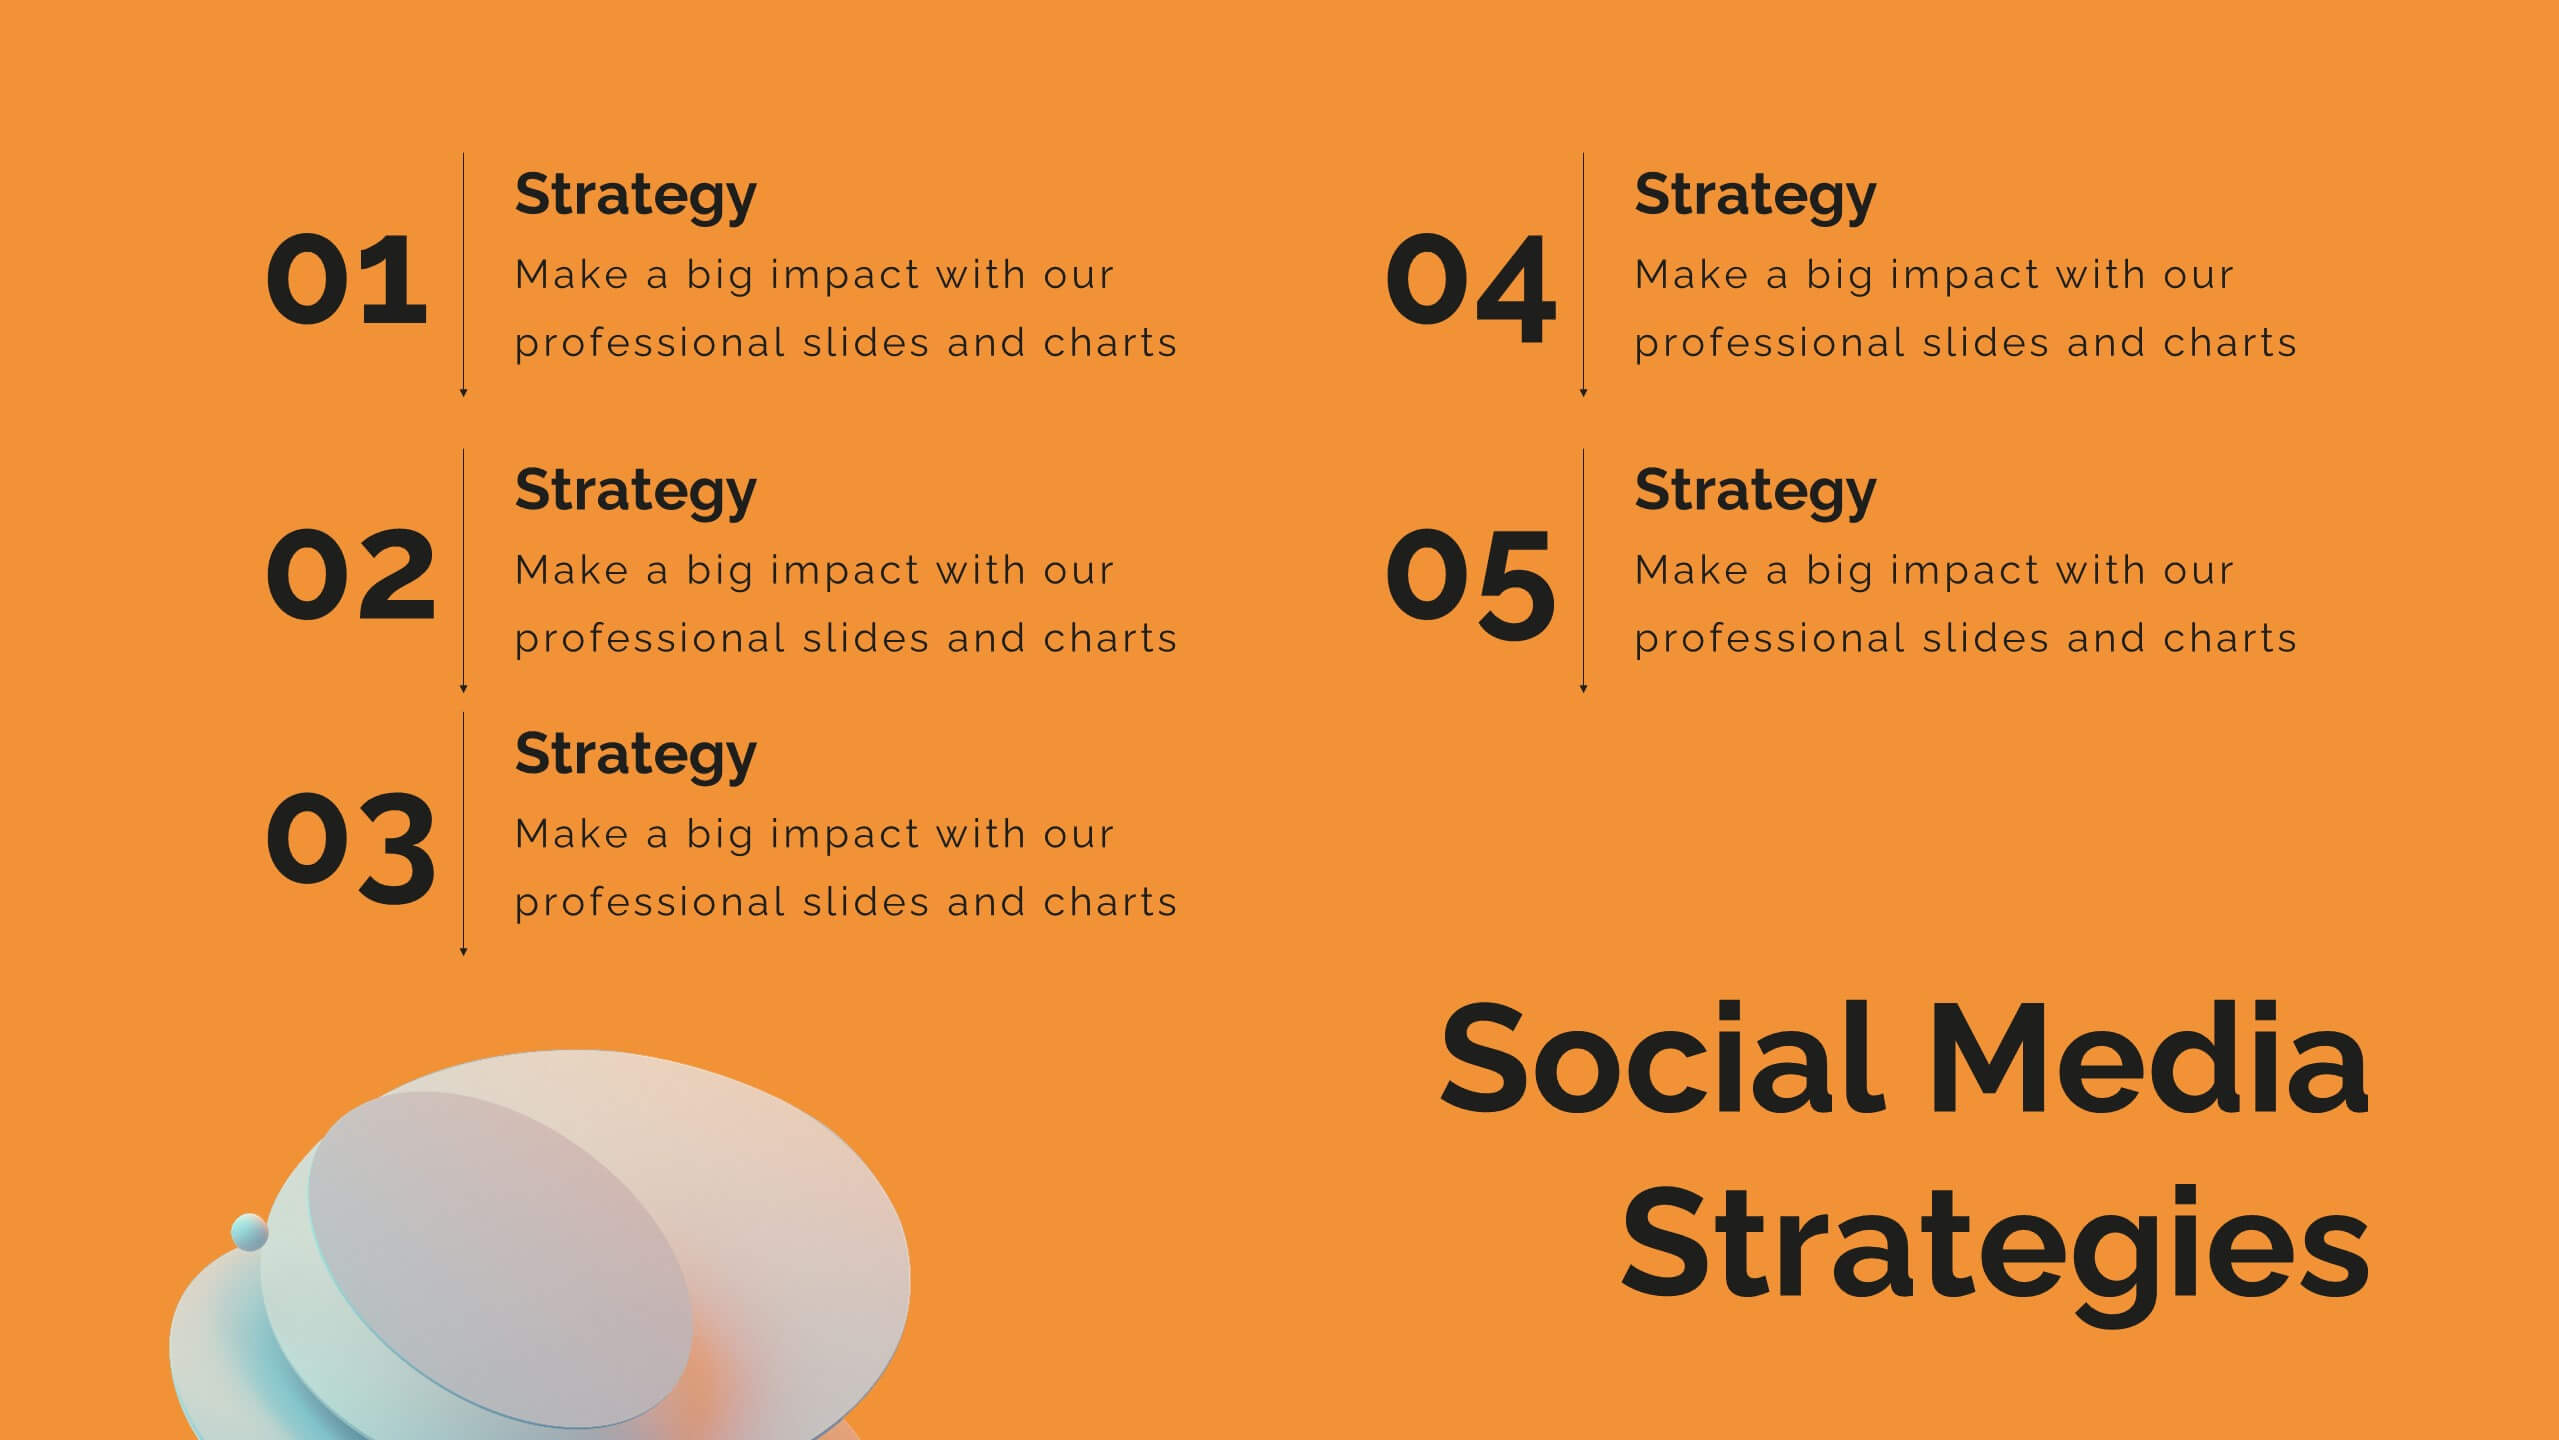
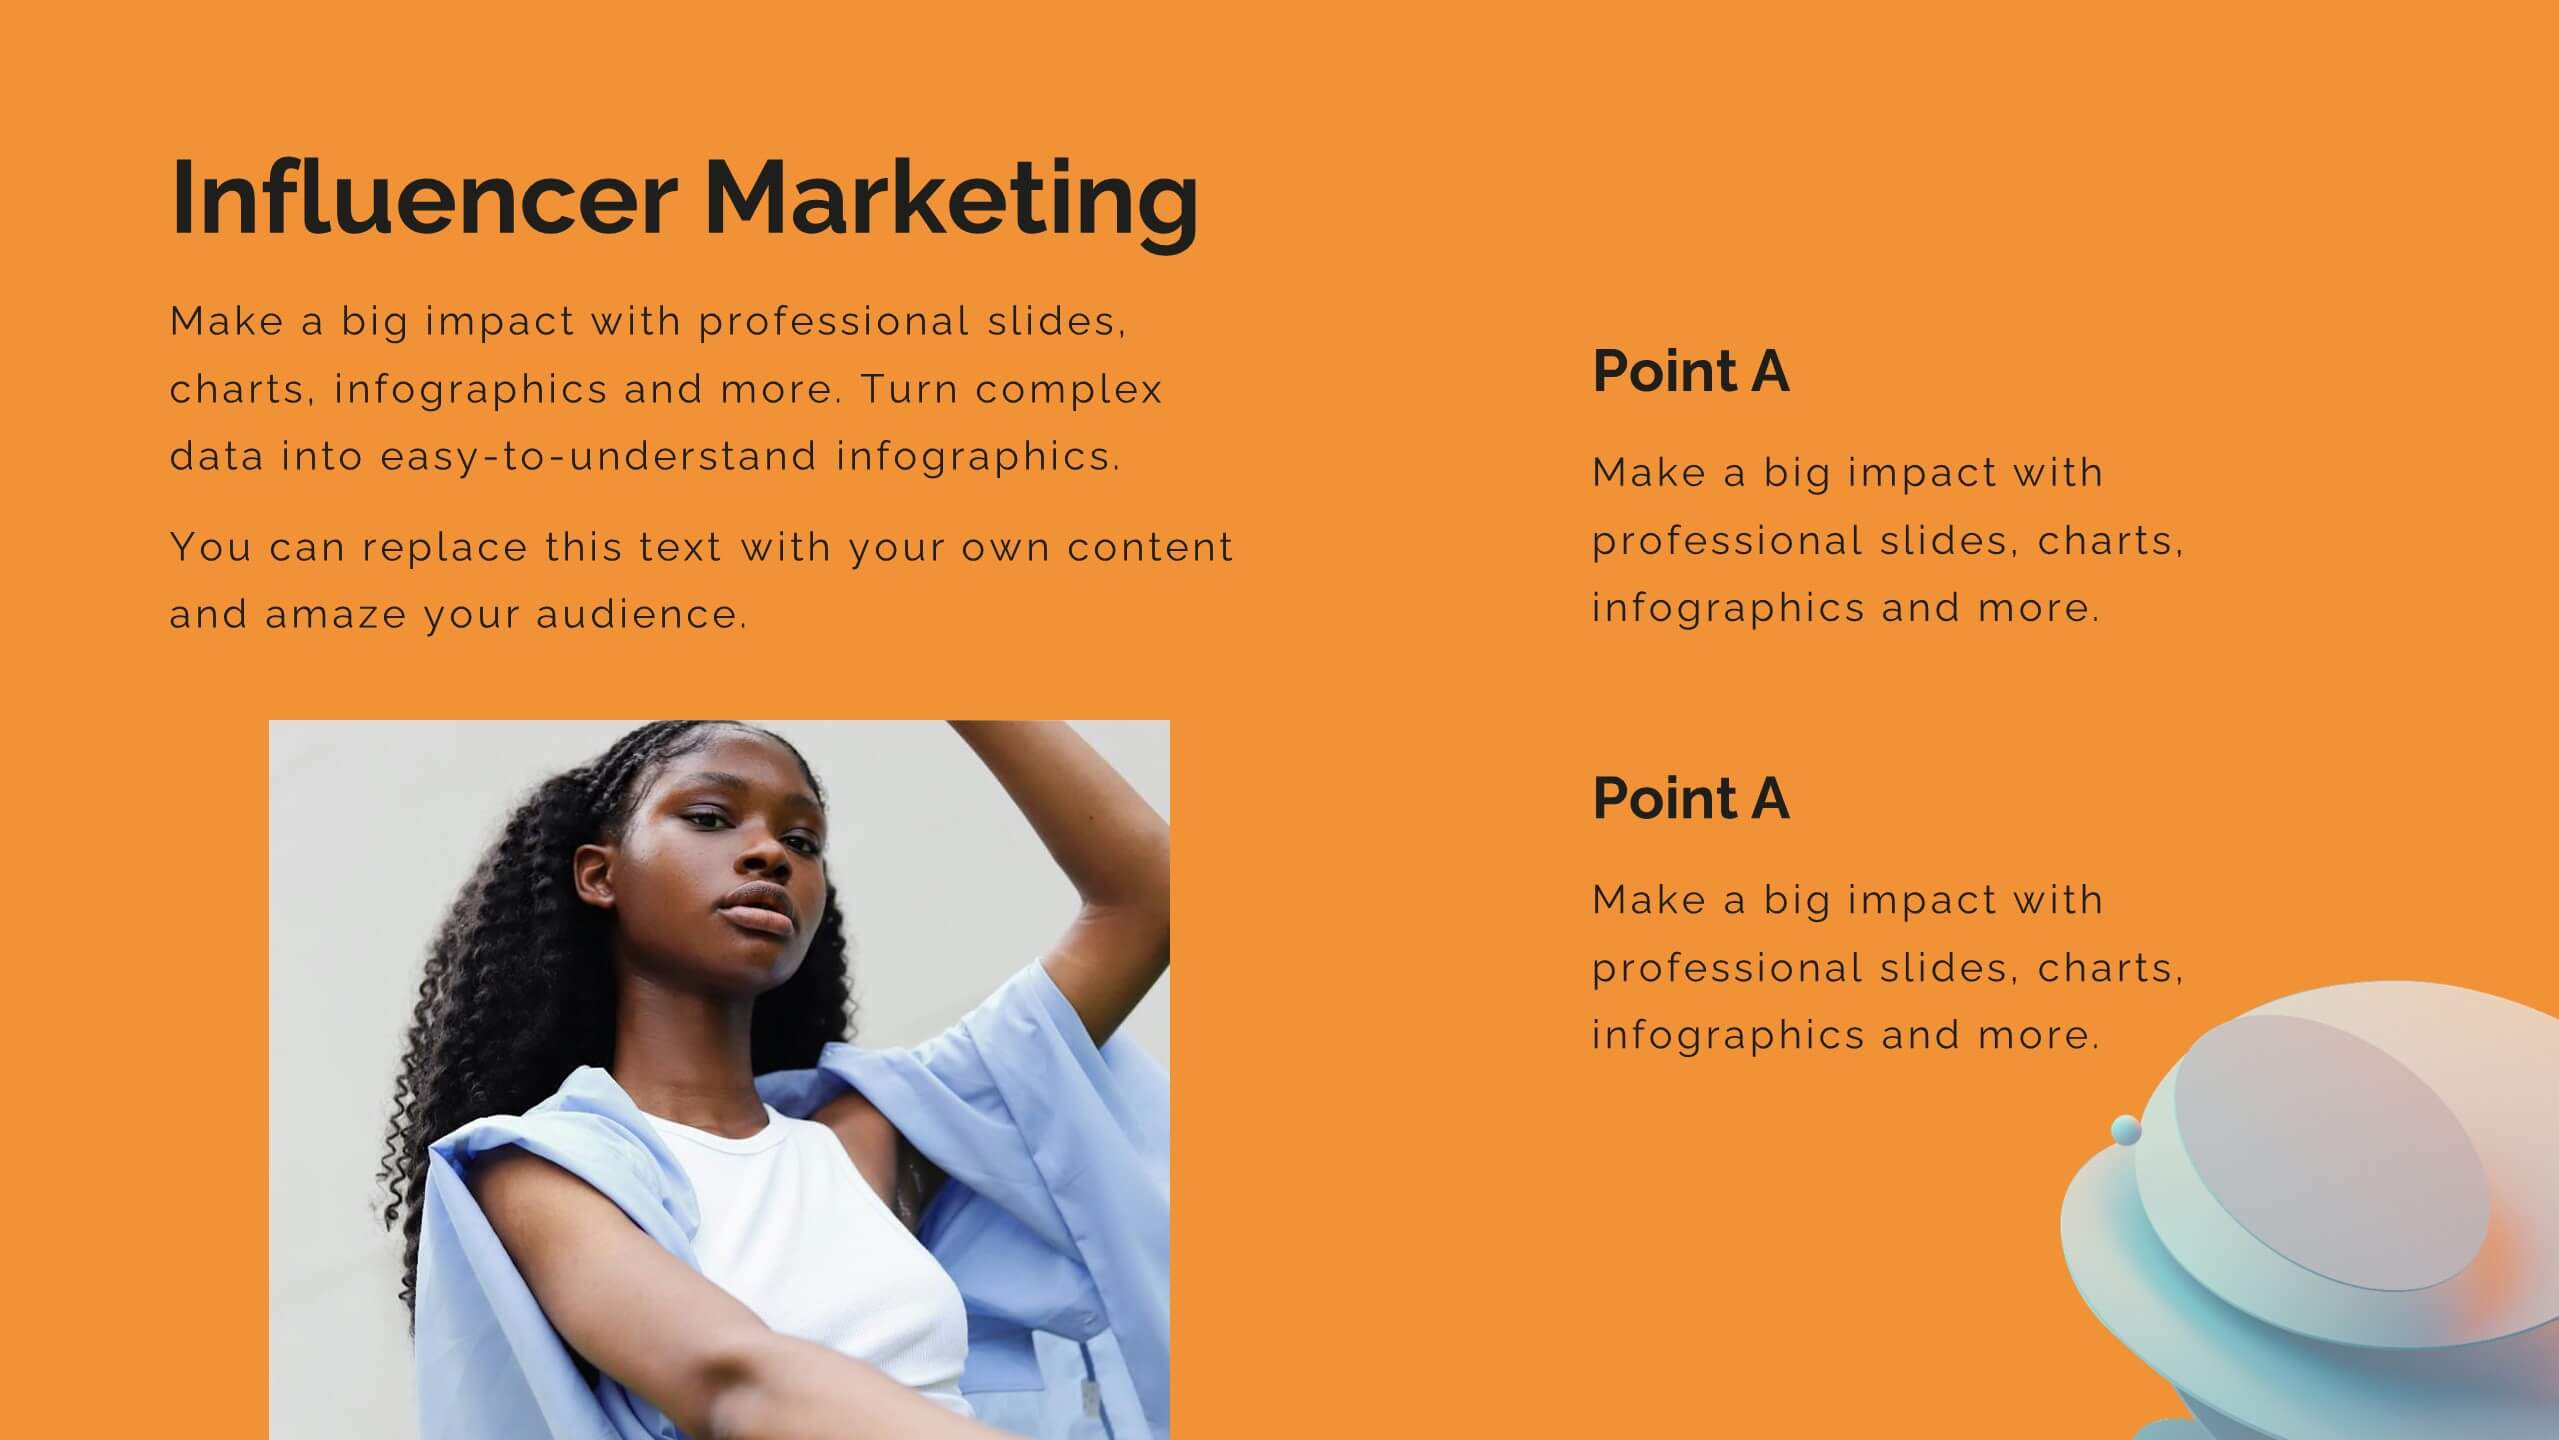
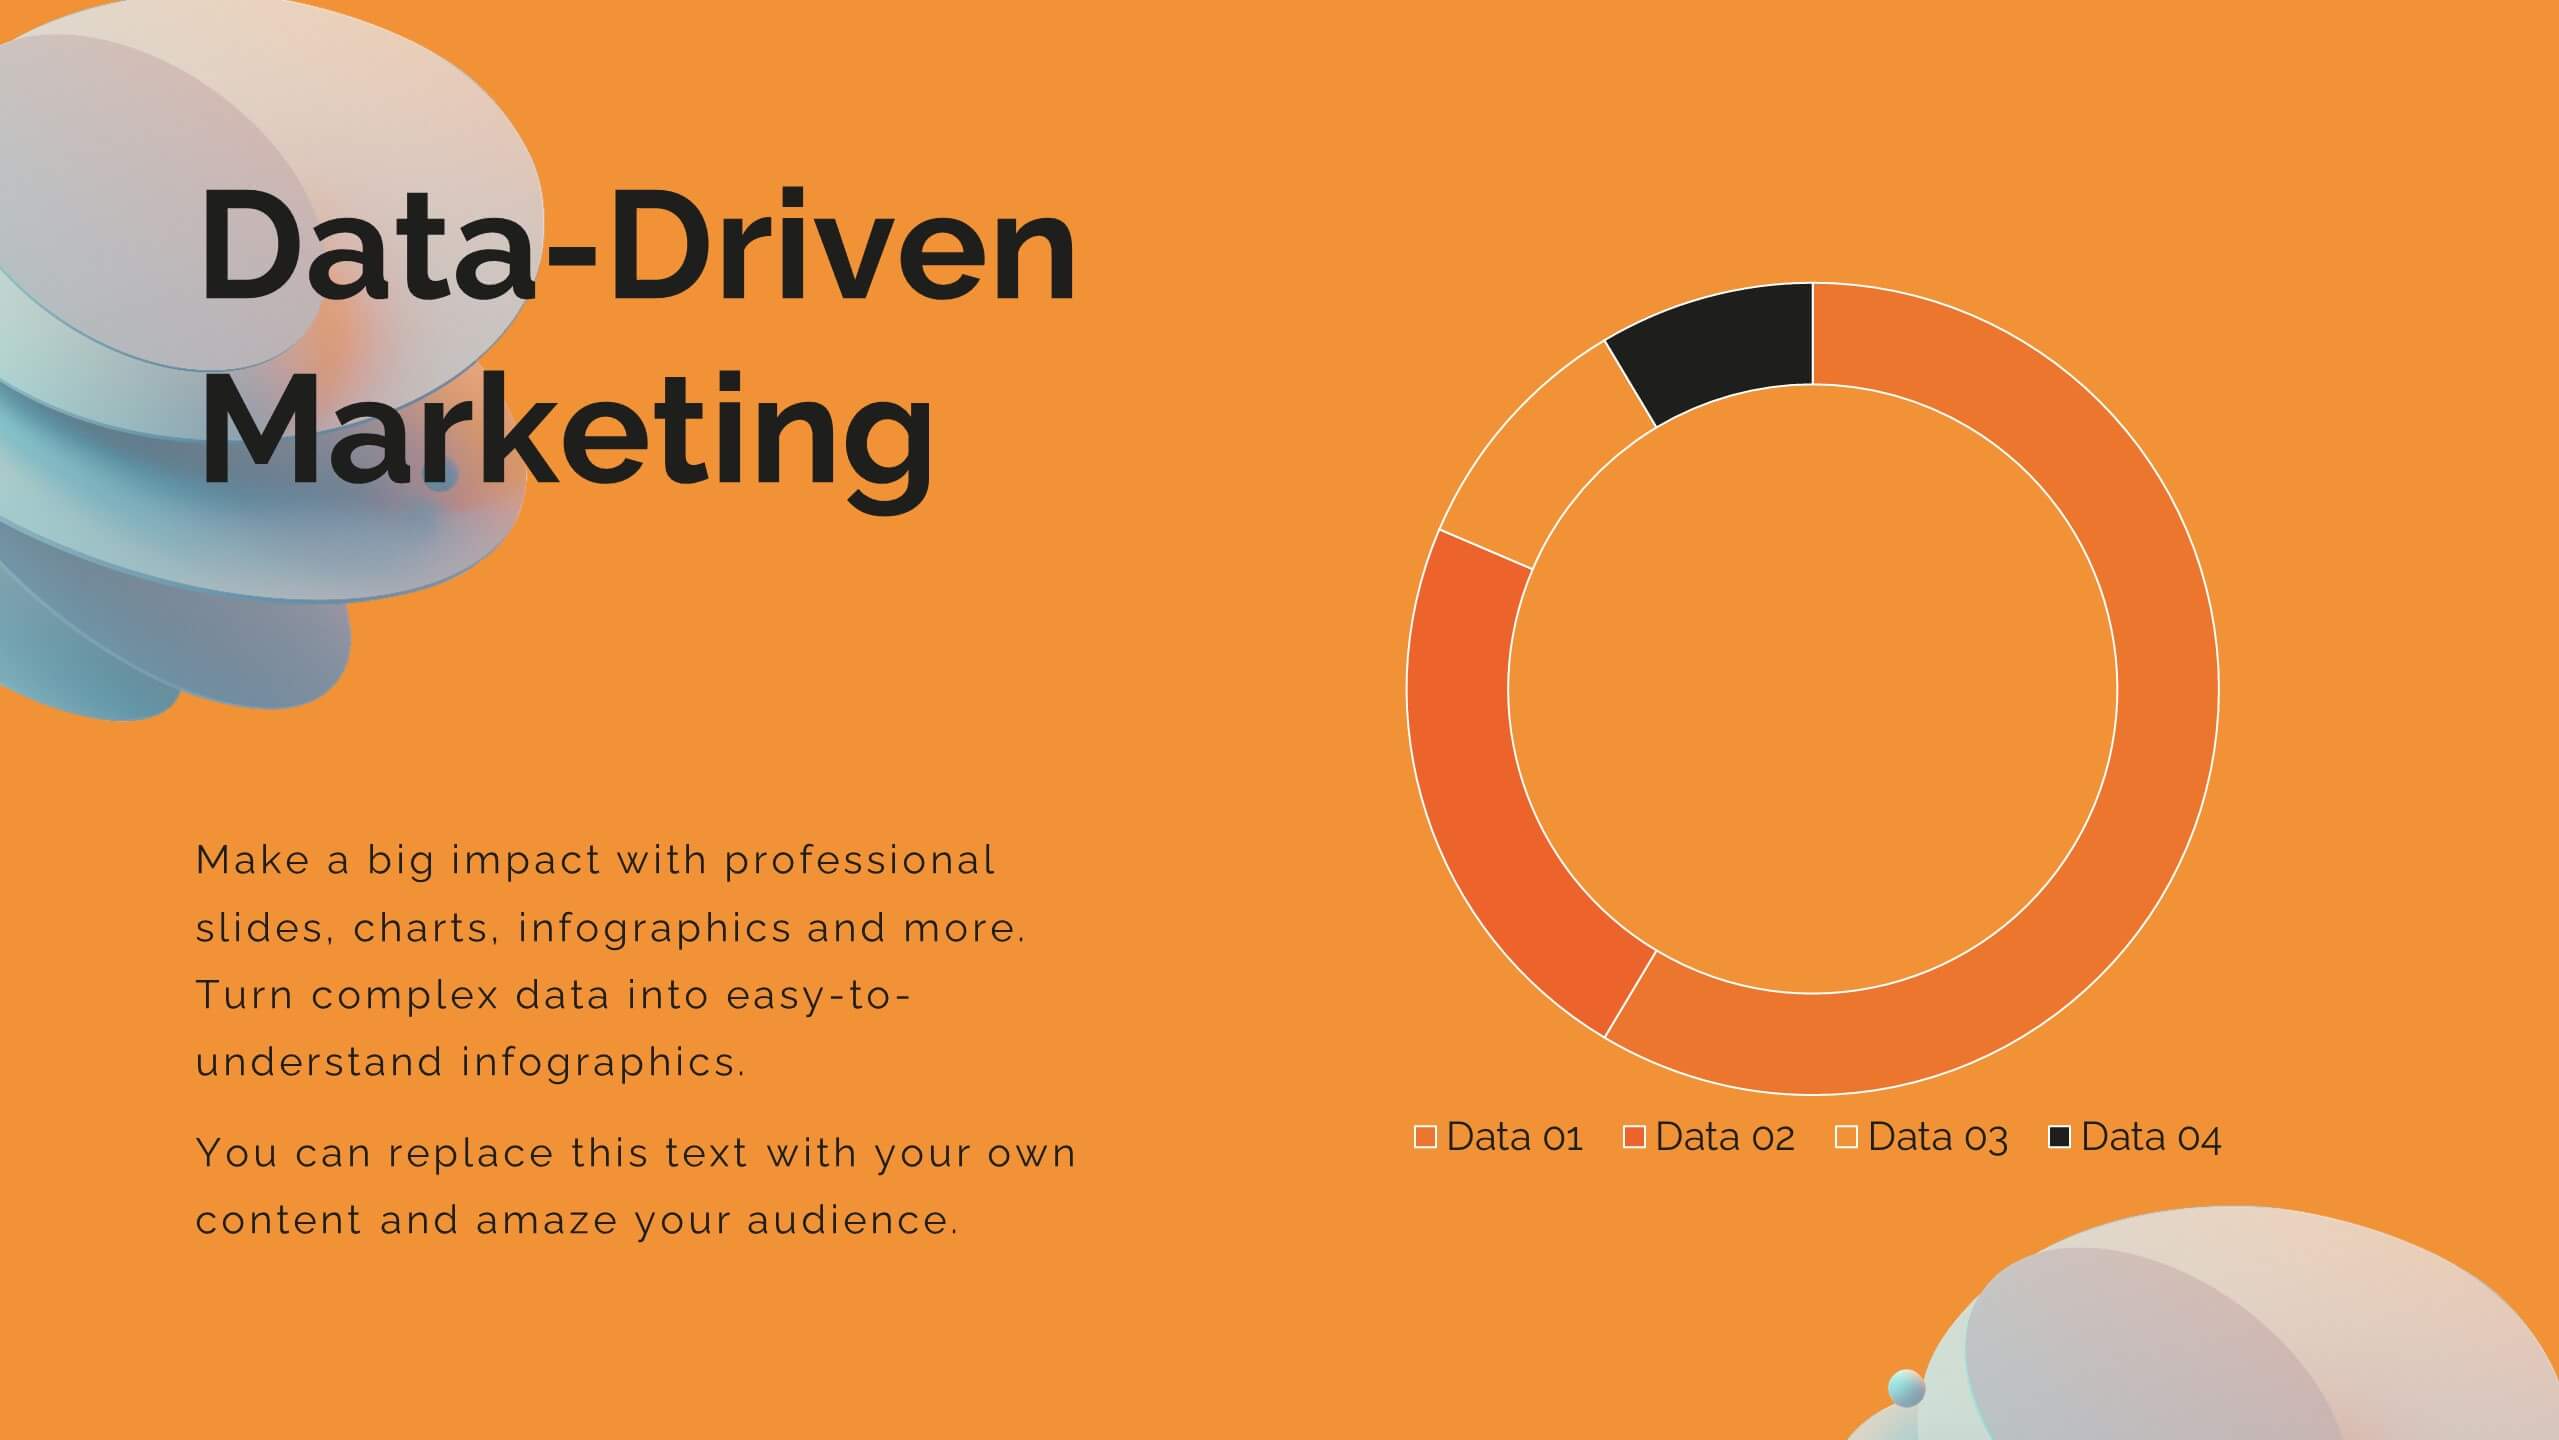
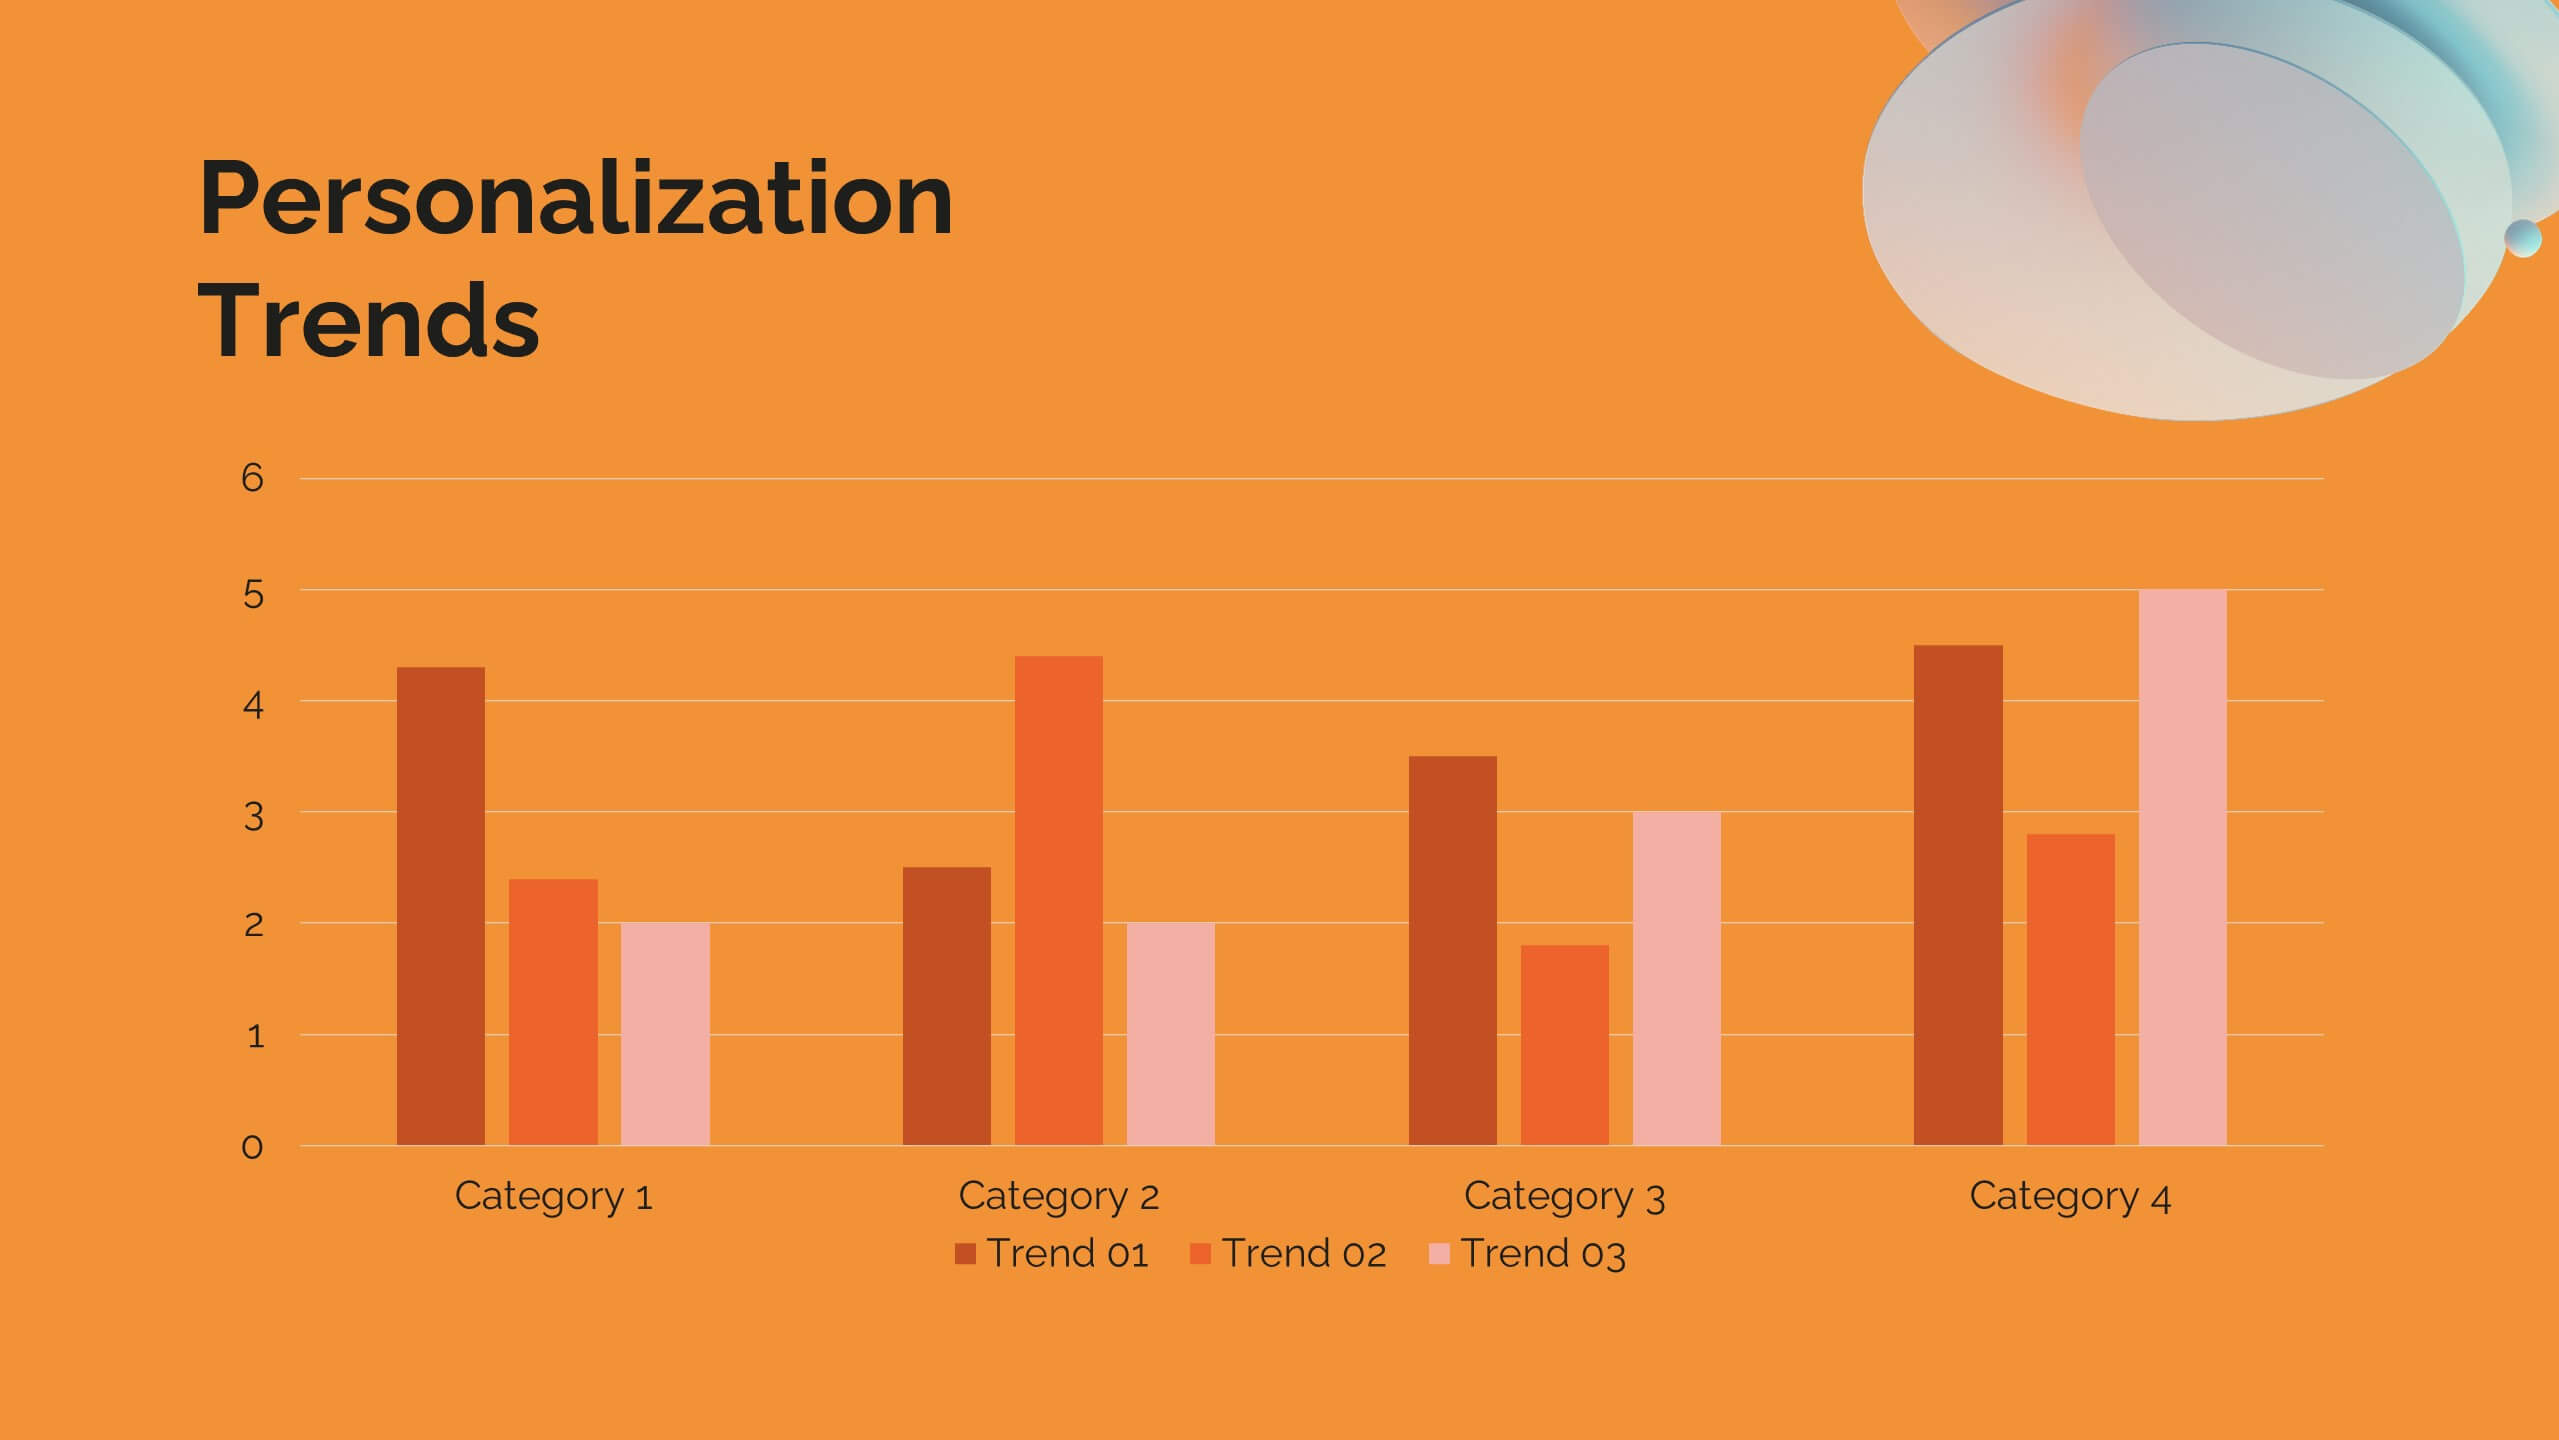
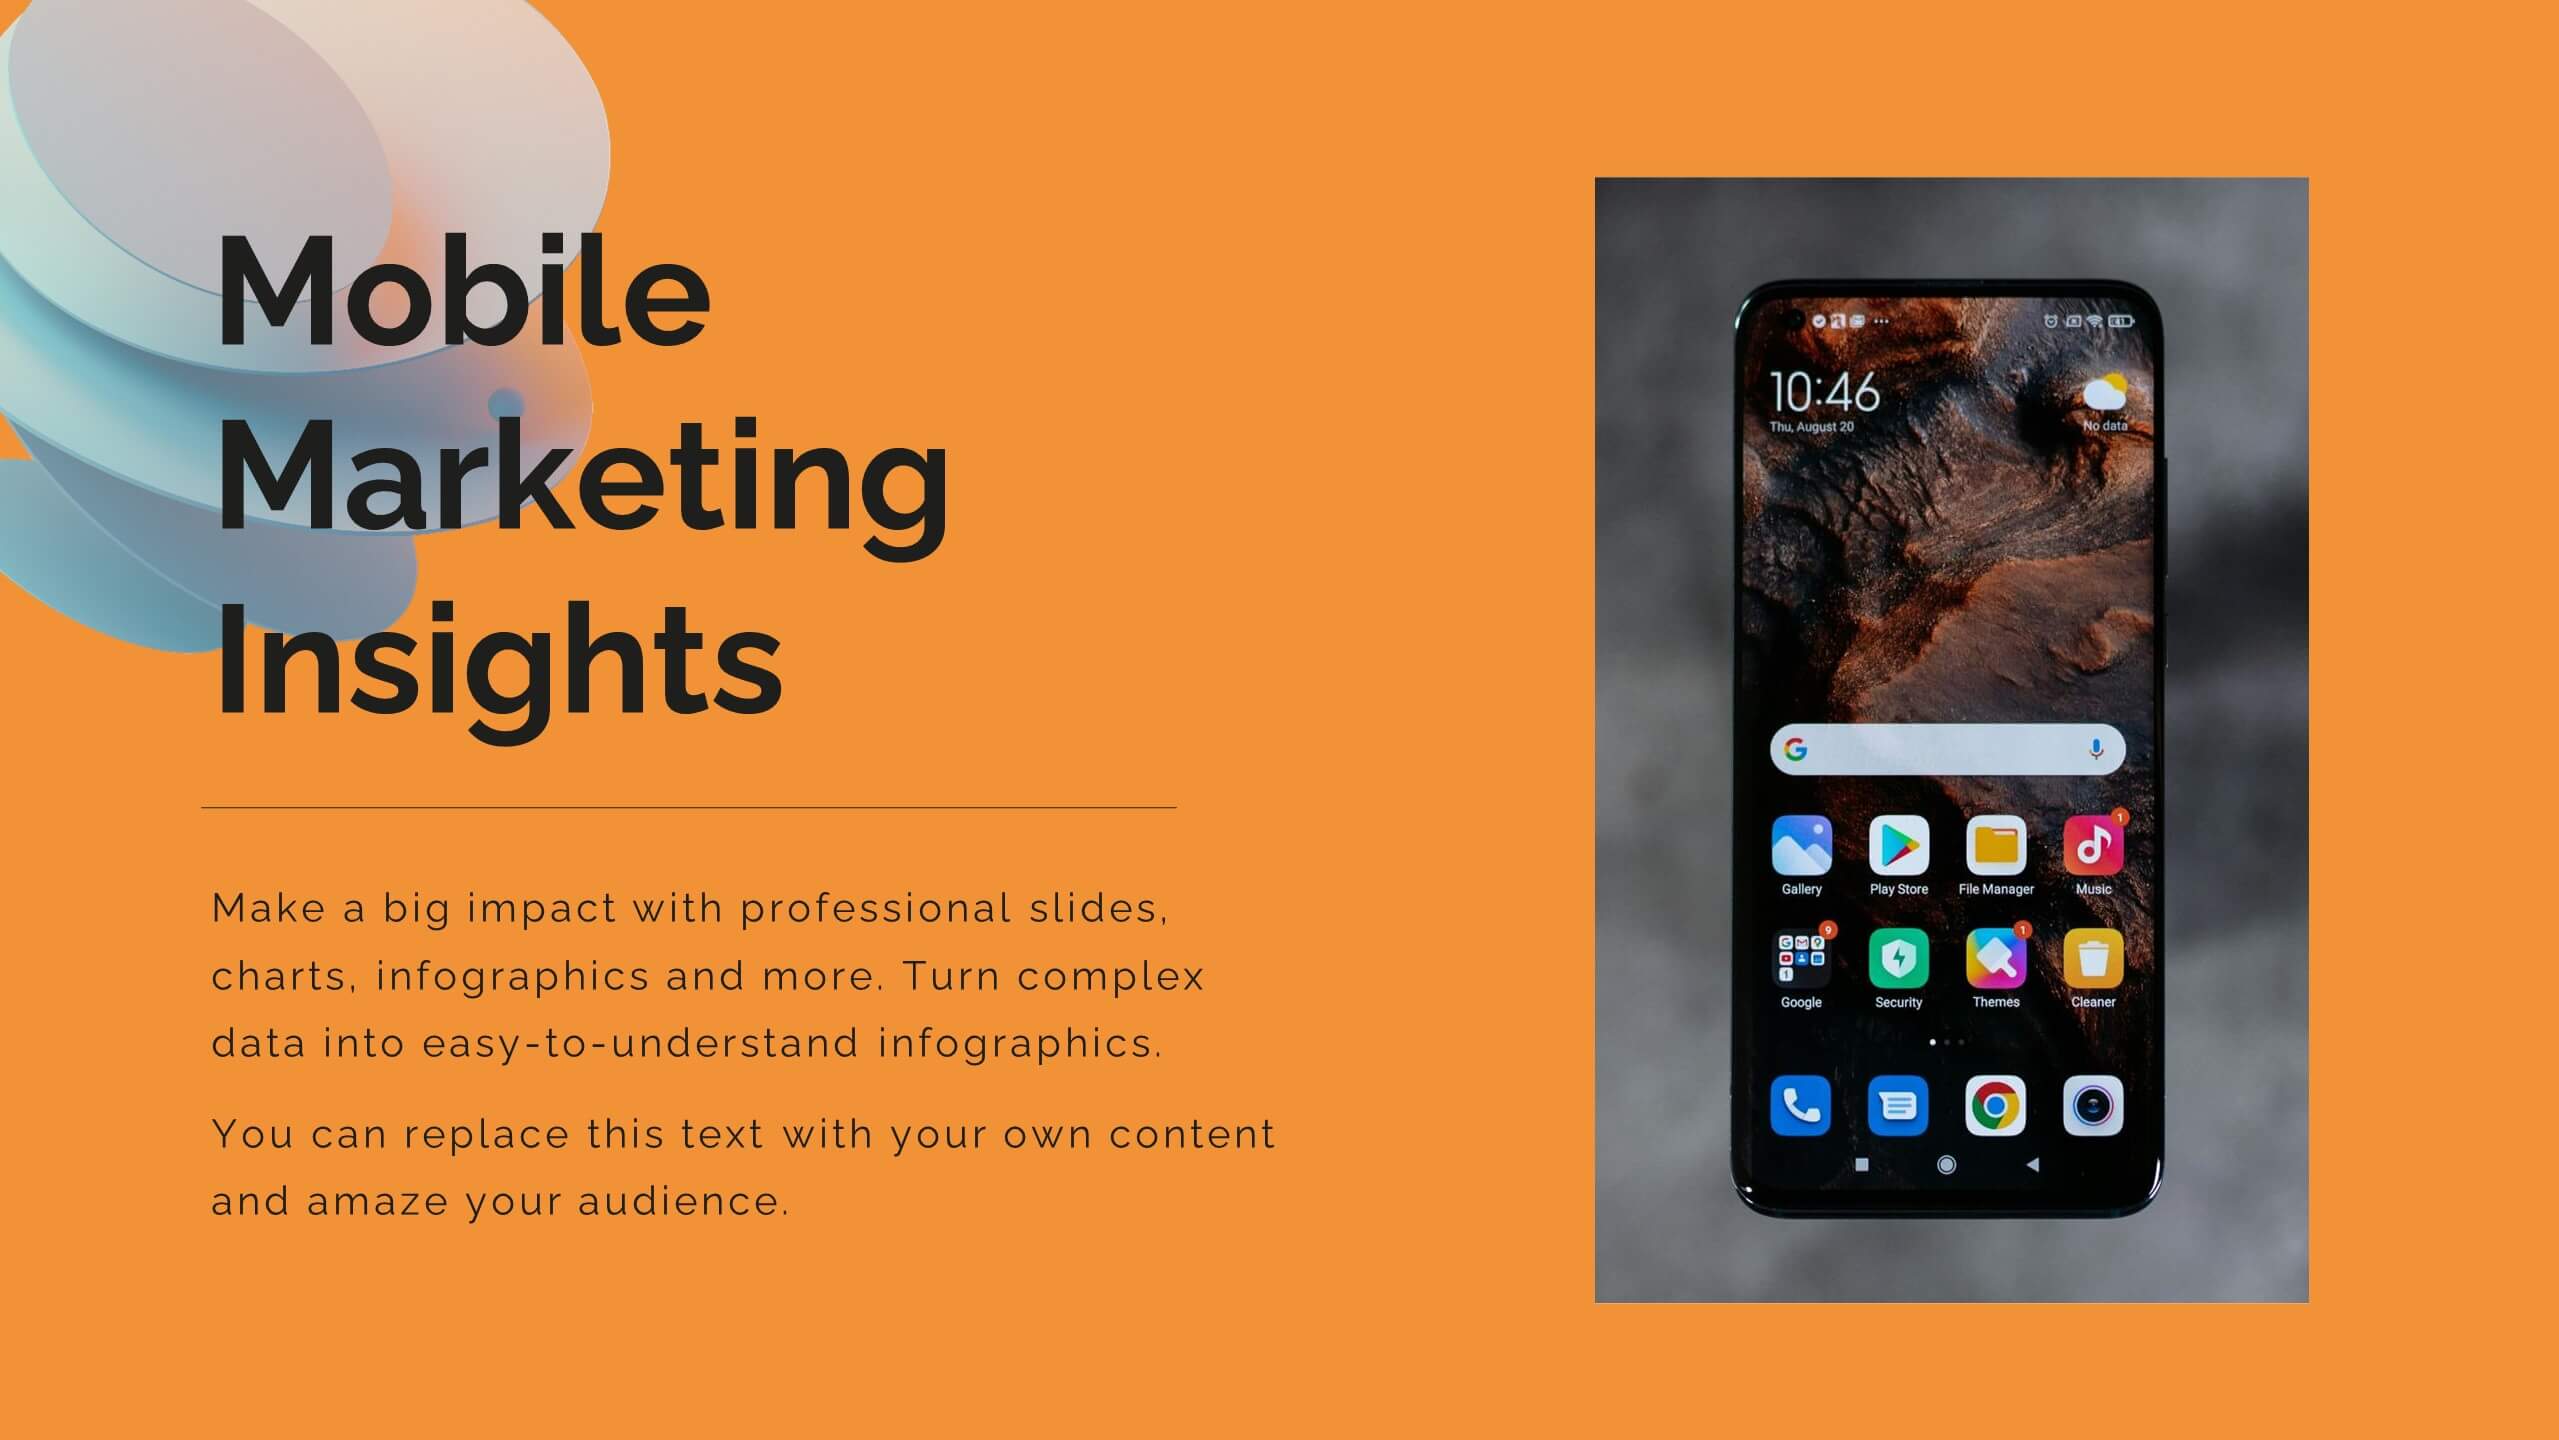
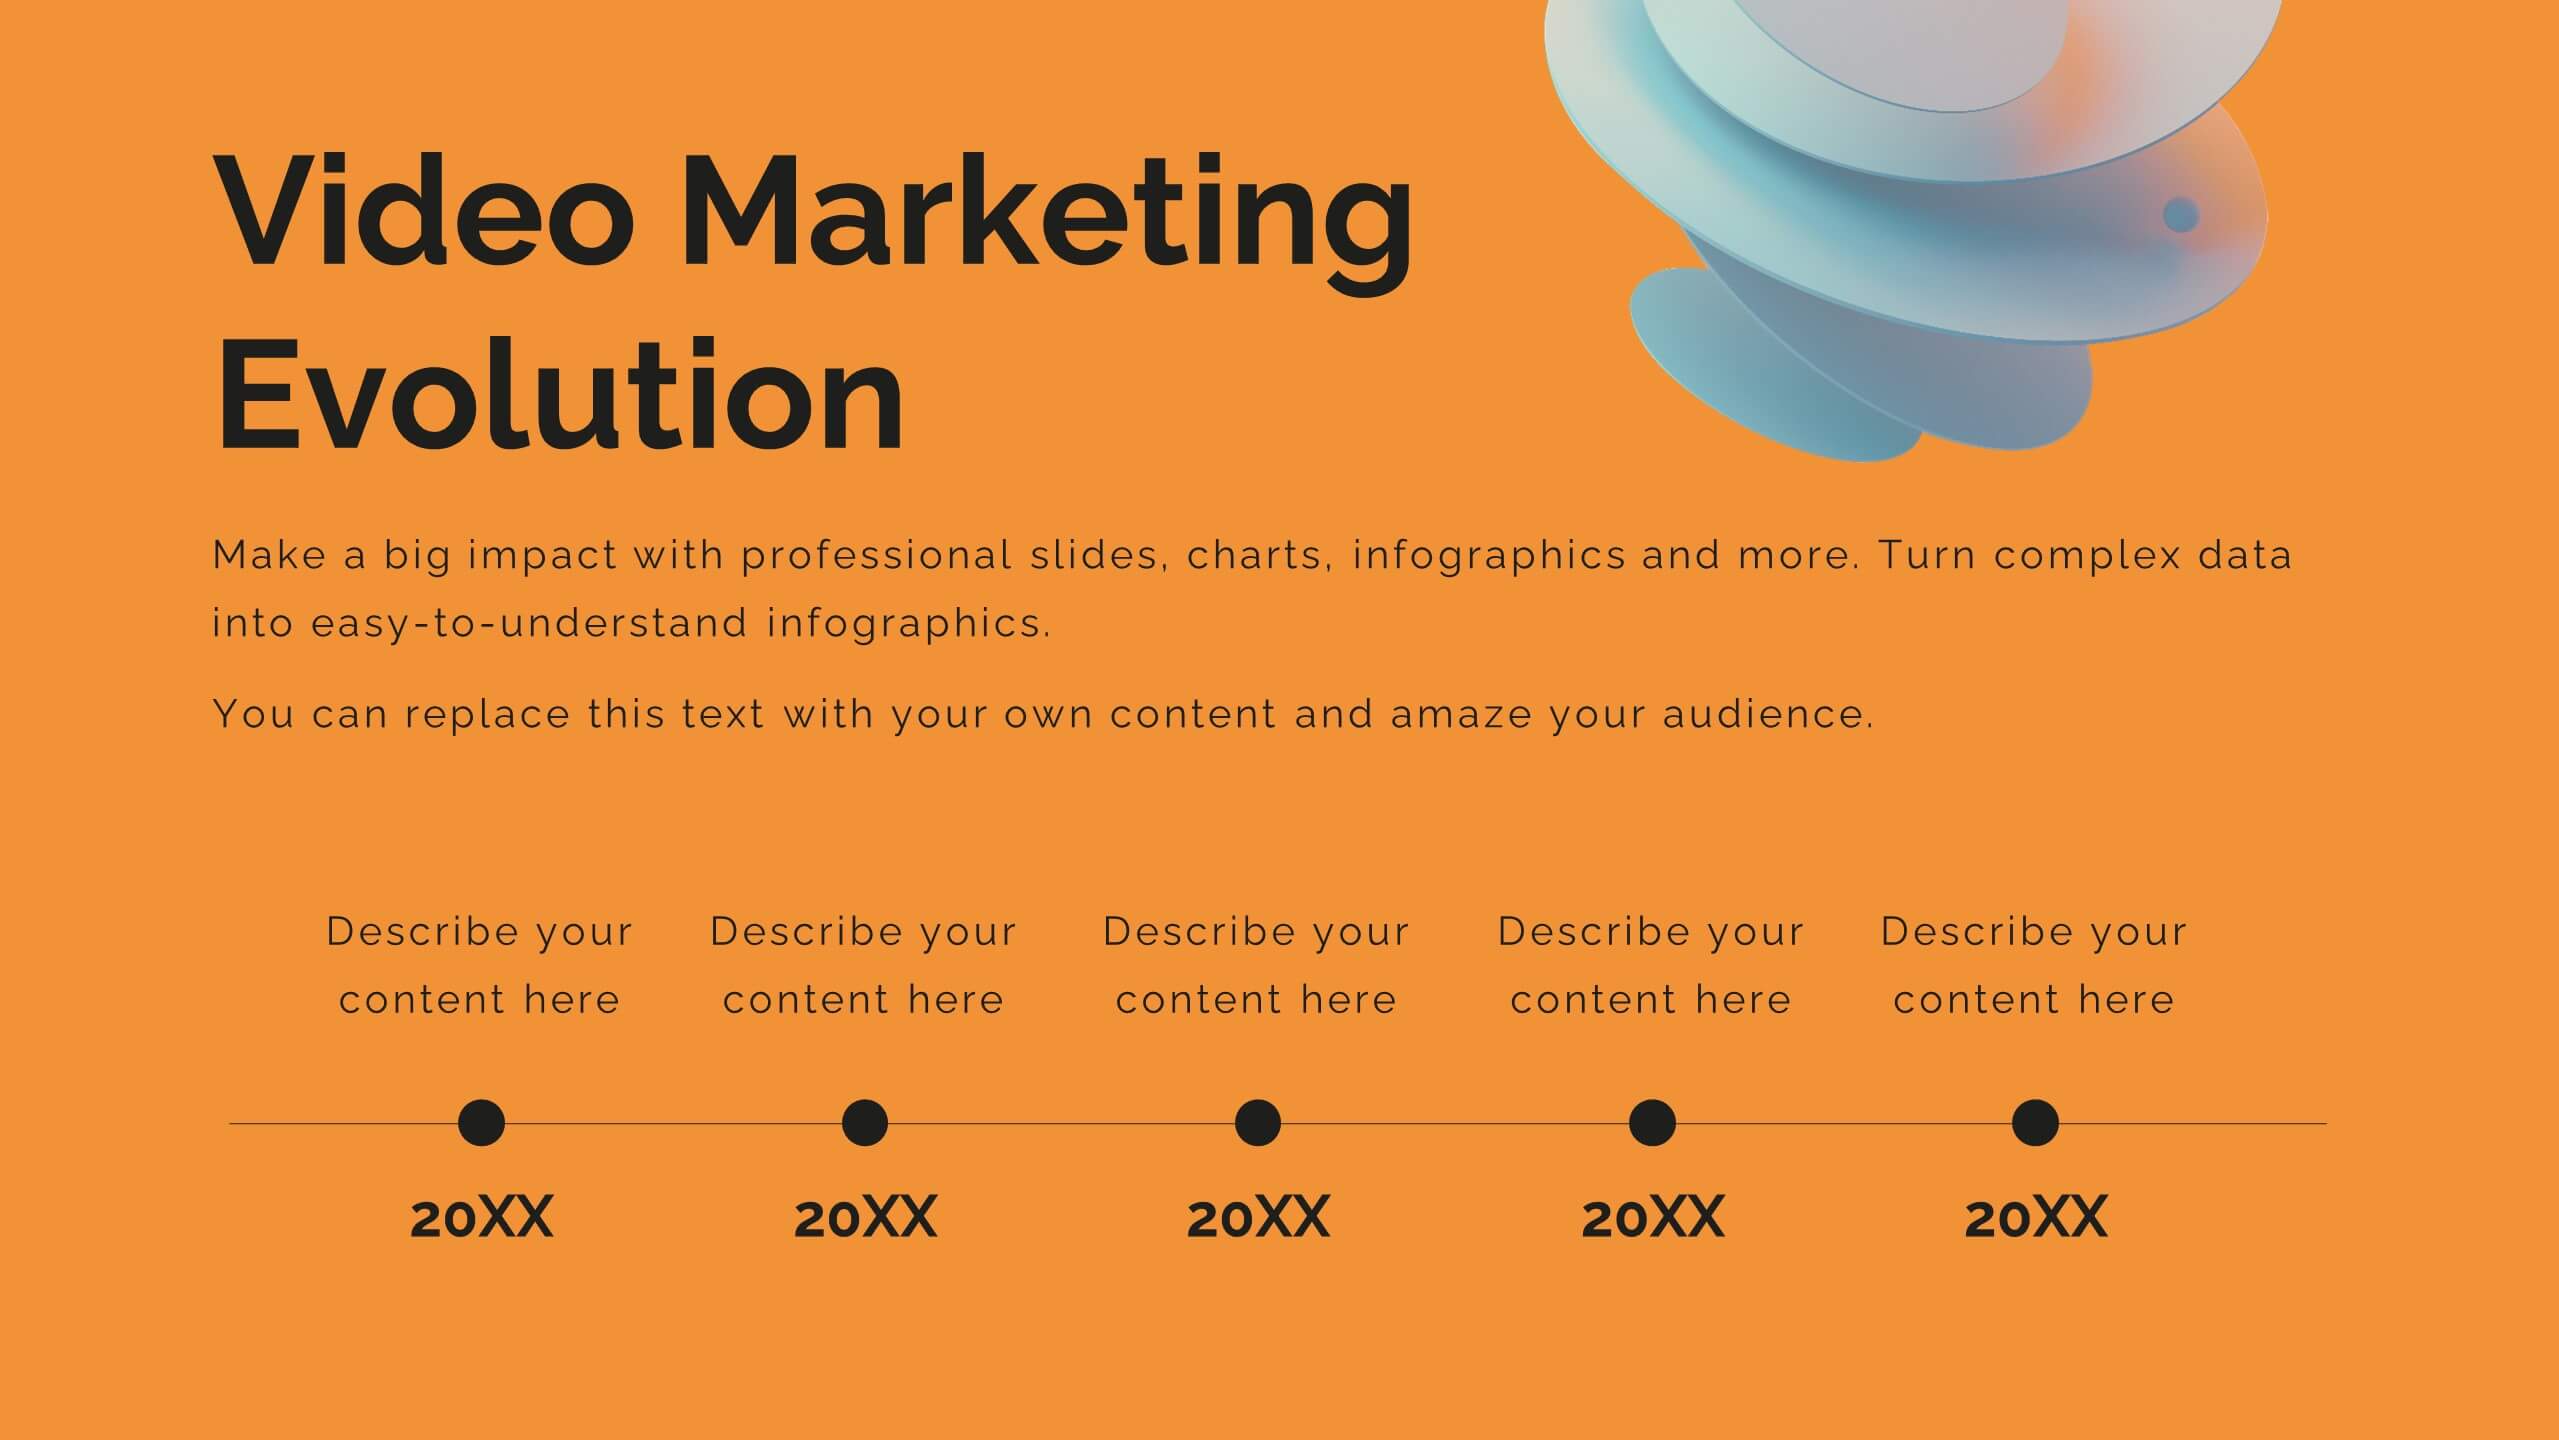
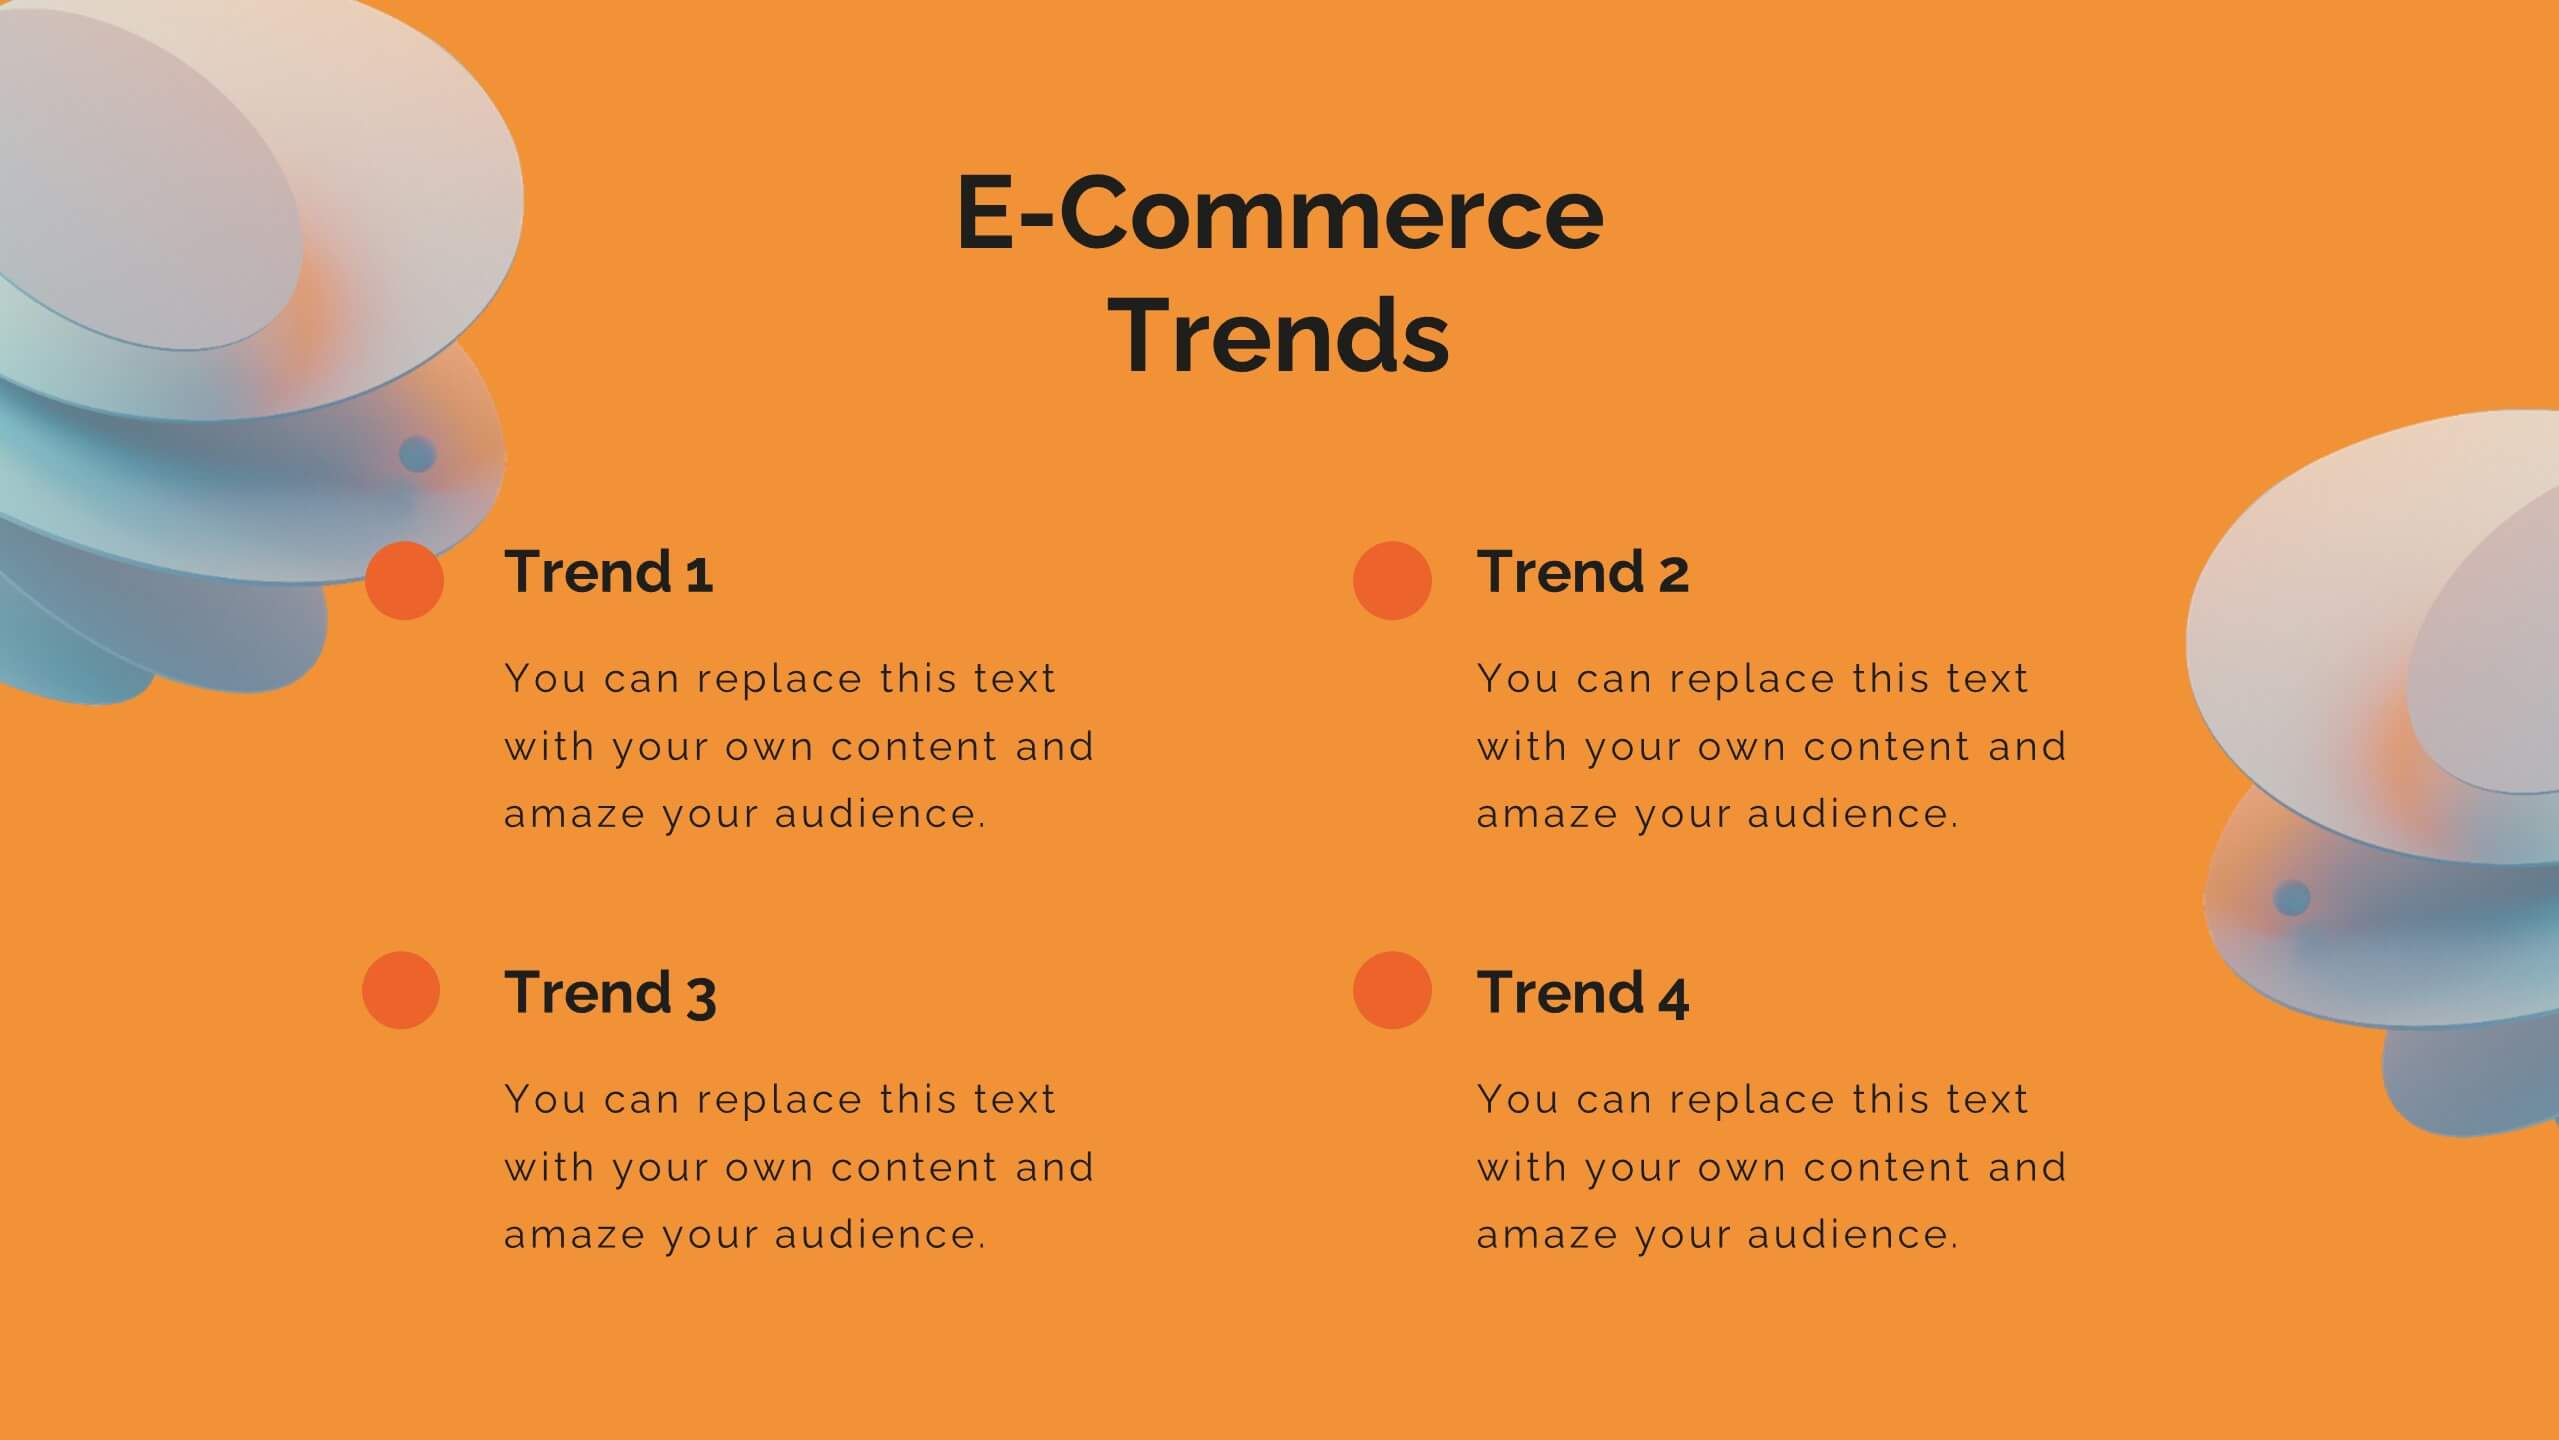
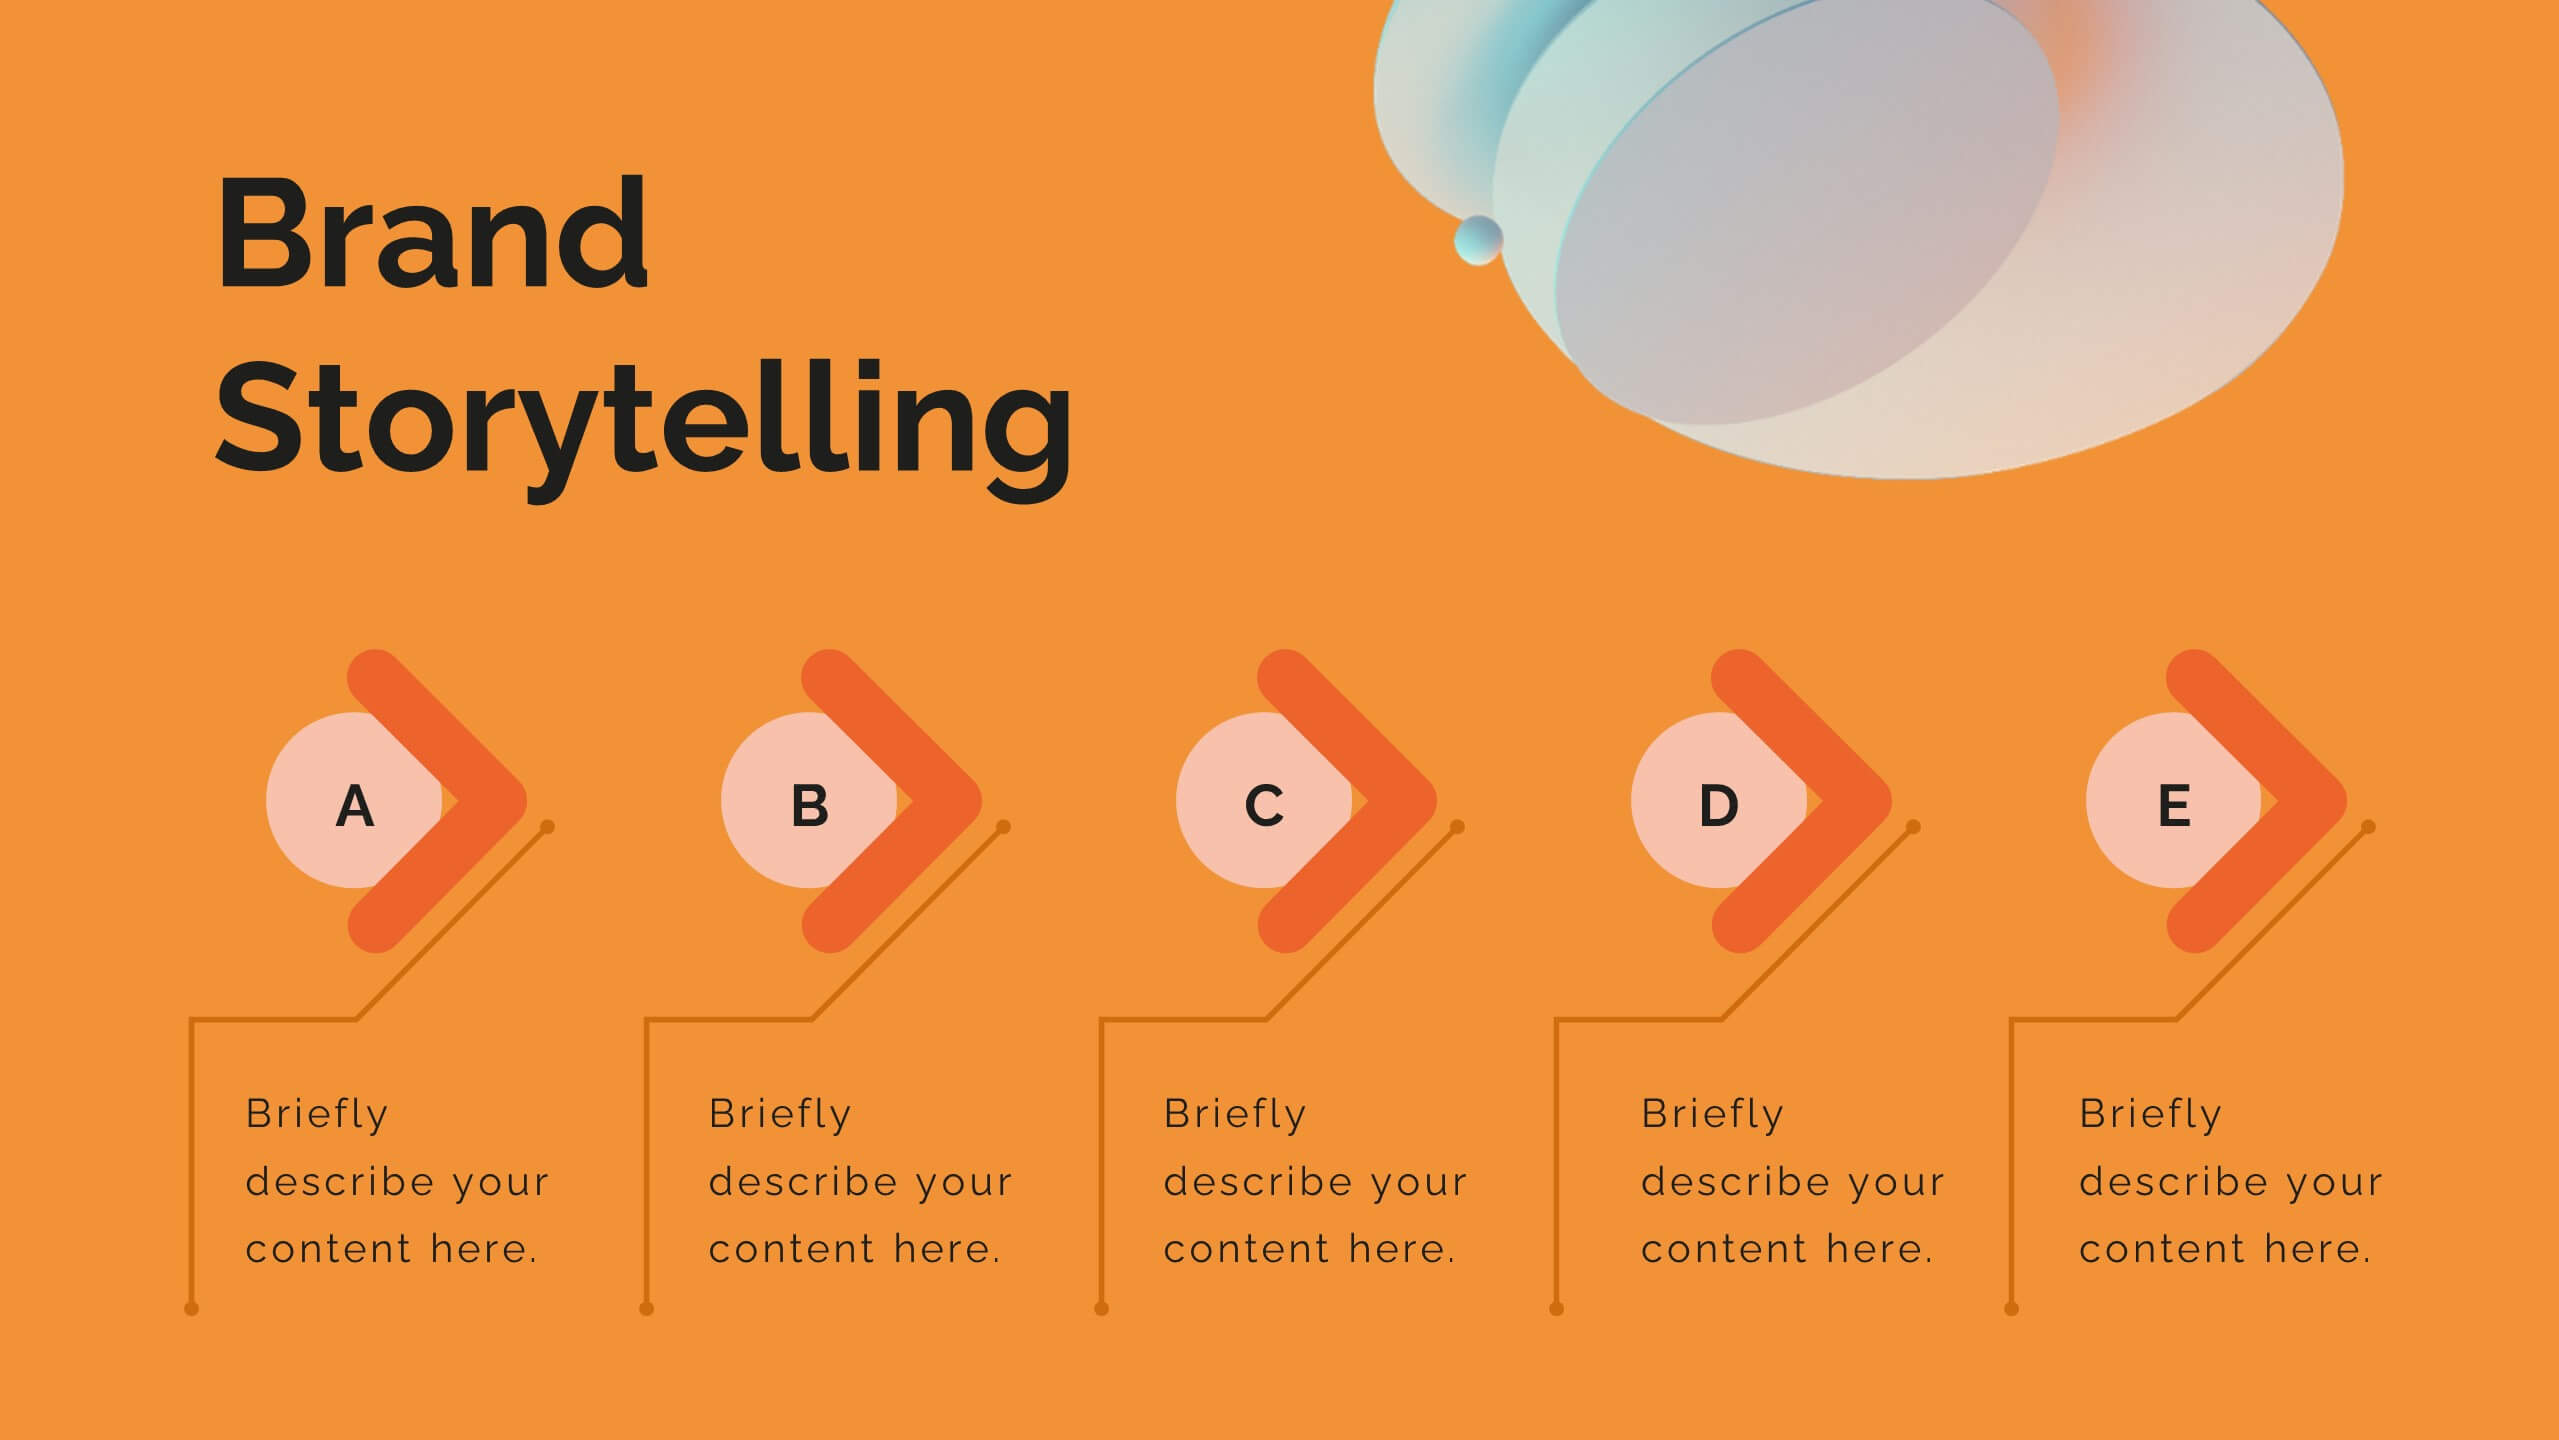
Breeze Content Marketing Pitch Deck Presentation
Elevate your content marketing strategy with this vibrant pitch deck! Perfect for outlining industry trends, consumer behavior, and innovative techniques. Ideal for marketers aiming to impress clients and stakeholders. Compatible with PowerPoint, Keynote, and Google Slides, this template ensures your pitch is engaging, persuasive, and professional. Achieve marketing success today!


6 diapositivas
RAPID Decision Infographic
The RAPID matrix is a decision-making framework used to clarify roles and responsibilities within a project or organization, especially when it comes to decision-making processes. The RAPID acronym stands for Responsible, Accountable, Consulted, Informed, and Decider. This infographic template is a visual tool that helps clarify roles and responsibilities within a project or process. This template is designed to define who is involved in each step of a task, who has decision-making authority, and who needs to be informed or consulted. Compatible with Powerpoint, Keynote, and Google Slides. Apply a color-coding scheme to visually distinguish different roles.


7 diapositivas
Value Chain Analysis Infographic
Streamline your business processes with our Value Chain Analysis Infographic, an essential tool for business analysts, management consultants, and strategic planners. This infographic provides a visual breakdown of the primary and supporting activities that create value for your customers. Our Value Chain Analysis Infographic illustrates how each segment of your business contributes to the overall product or service delivery. It's designed to help you identify opportunities for improvement, cost savings, and competitive advantage. The infographic is customizable, allowing you to detail activities such as inbound logistics, operations, outbound logistics, marketing, sales, and service. This SEO-optimized tool ensures that your strategic analysis is accessible for professionals seeking to enhance operational efficiency and value creation. Employ this infographic to dissect and understand your business operations, fostering informed decision-making and optimizing the value delivered to your customers.


7 diapositivas
Business People Networking Infographic
Networking is the lifeblood of any thriving business. Our business people networking infographic, designed in a pristine white backdrop with striking orange highlights and sophisticated black nuances, encapsulates the essence of professional connections and collaborations. It provides a visual representation of how relationships can foster growth, open opportunities, and catalyze success. Tailored for business leaders, conference organizers, and networking event planners, this template offers a compelling narrative of networking's power. Fully optimized, it's compatible with leading presentation platforms: PowerPoint, Keynote, and Google Slides.


5 diapositivas
Project Status Update and Timeline Presentation
Keep your team aligned with this clean, easy-to-read status update template. Featuring progress bars, monthly Gantt chart visuals, and icons for each task, it’s perfect for tracking milestones, team updates, and project phases. Fully editable in PowerPoint, Keynote, and Google Slides.


23 diapositivas
Flash Cannon Corporate Strategy Report Presentation
Get ready to elevate your business presentations with the Flash Canvas Corporate Strategy Report template! This bold and modern template is designed to command attention with its striking black and blue color scheme, perfect for delivering high-impact reports. Whether you're outlining strategic initiatives, showcasing performance metrics, or discussing team updates, this template ensures your content is not only informative but also visually compelling. The clean and structured layout guides your audience through every key point, making complex information easy to digest. Each slide is tailored to present challenges, solutions, collaboration opportunities, and more, in a way that is both professional and engaging. Ideal for corporate environments, board meetings, or any setting where you need to communicate strategy effectively. Fully compatible with PowerPoint, Keynote, and Google Slides, this template is your go-to for delivering presentations that leave a lasting impression.


5 diapositivas
Business Threat Risk Assessment Strategy Presentation
Visualize your risk factors clearly with the Business Threat Risk Assessment Strategy Presentation. This X-shaped quadrant layout helps you outline and evaluate four key risk areas at a glance—ideal for threat mapping, vulnerability assessment, or contingency planning. Fully editable in Canva, PowerPoint, Keynote, and Google Slides.


10 diapositivas
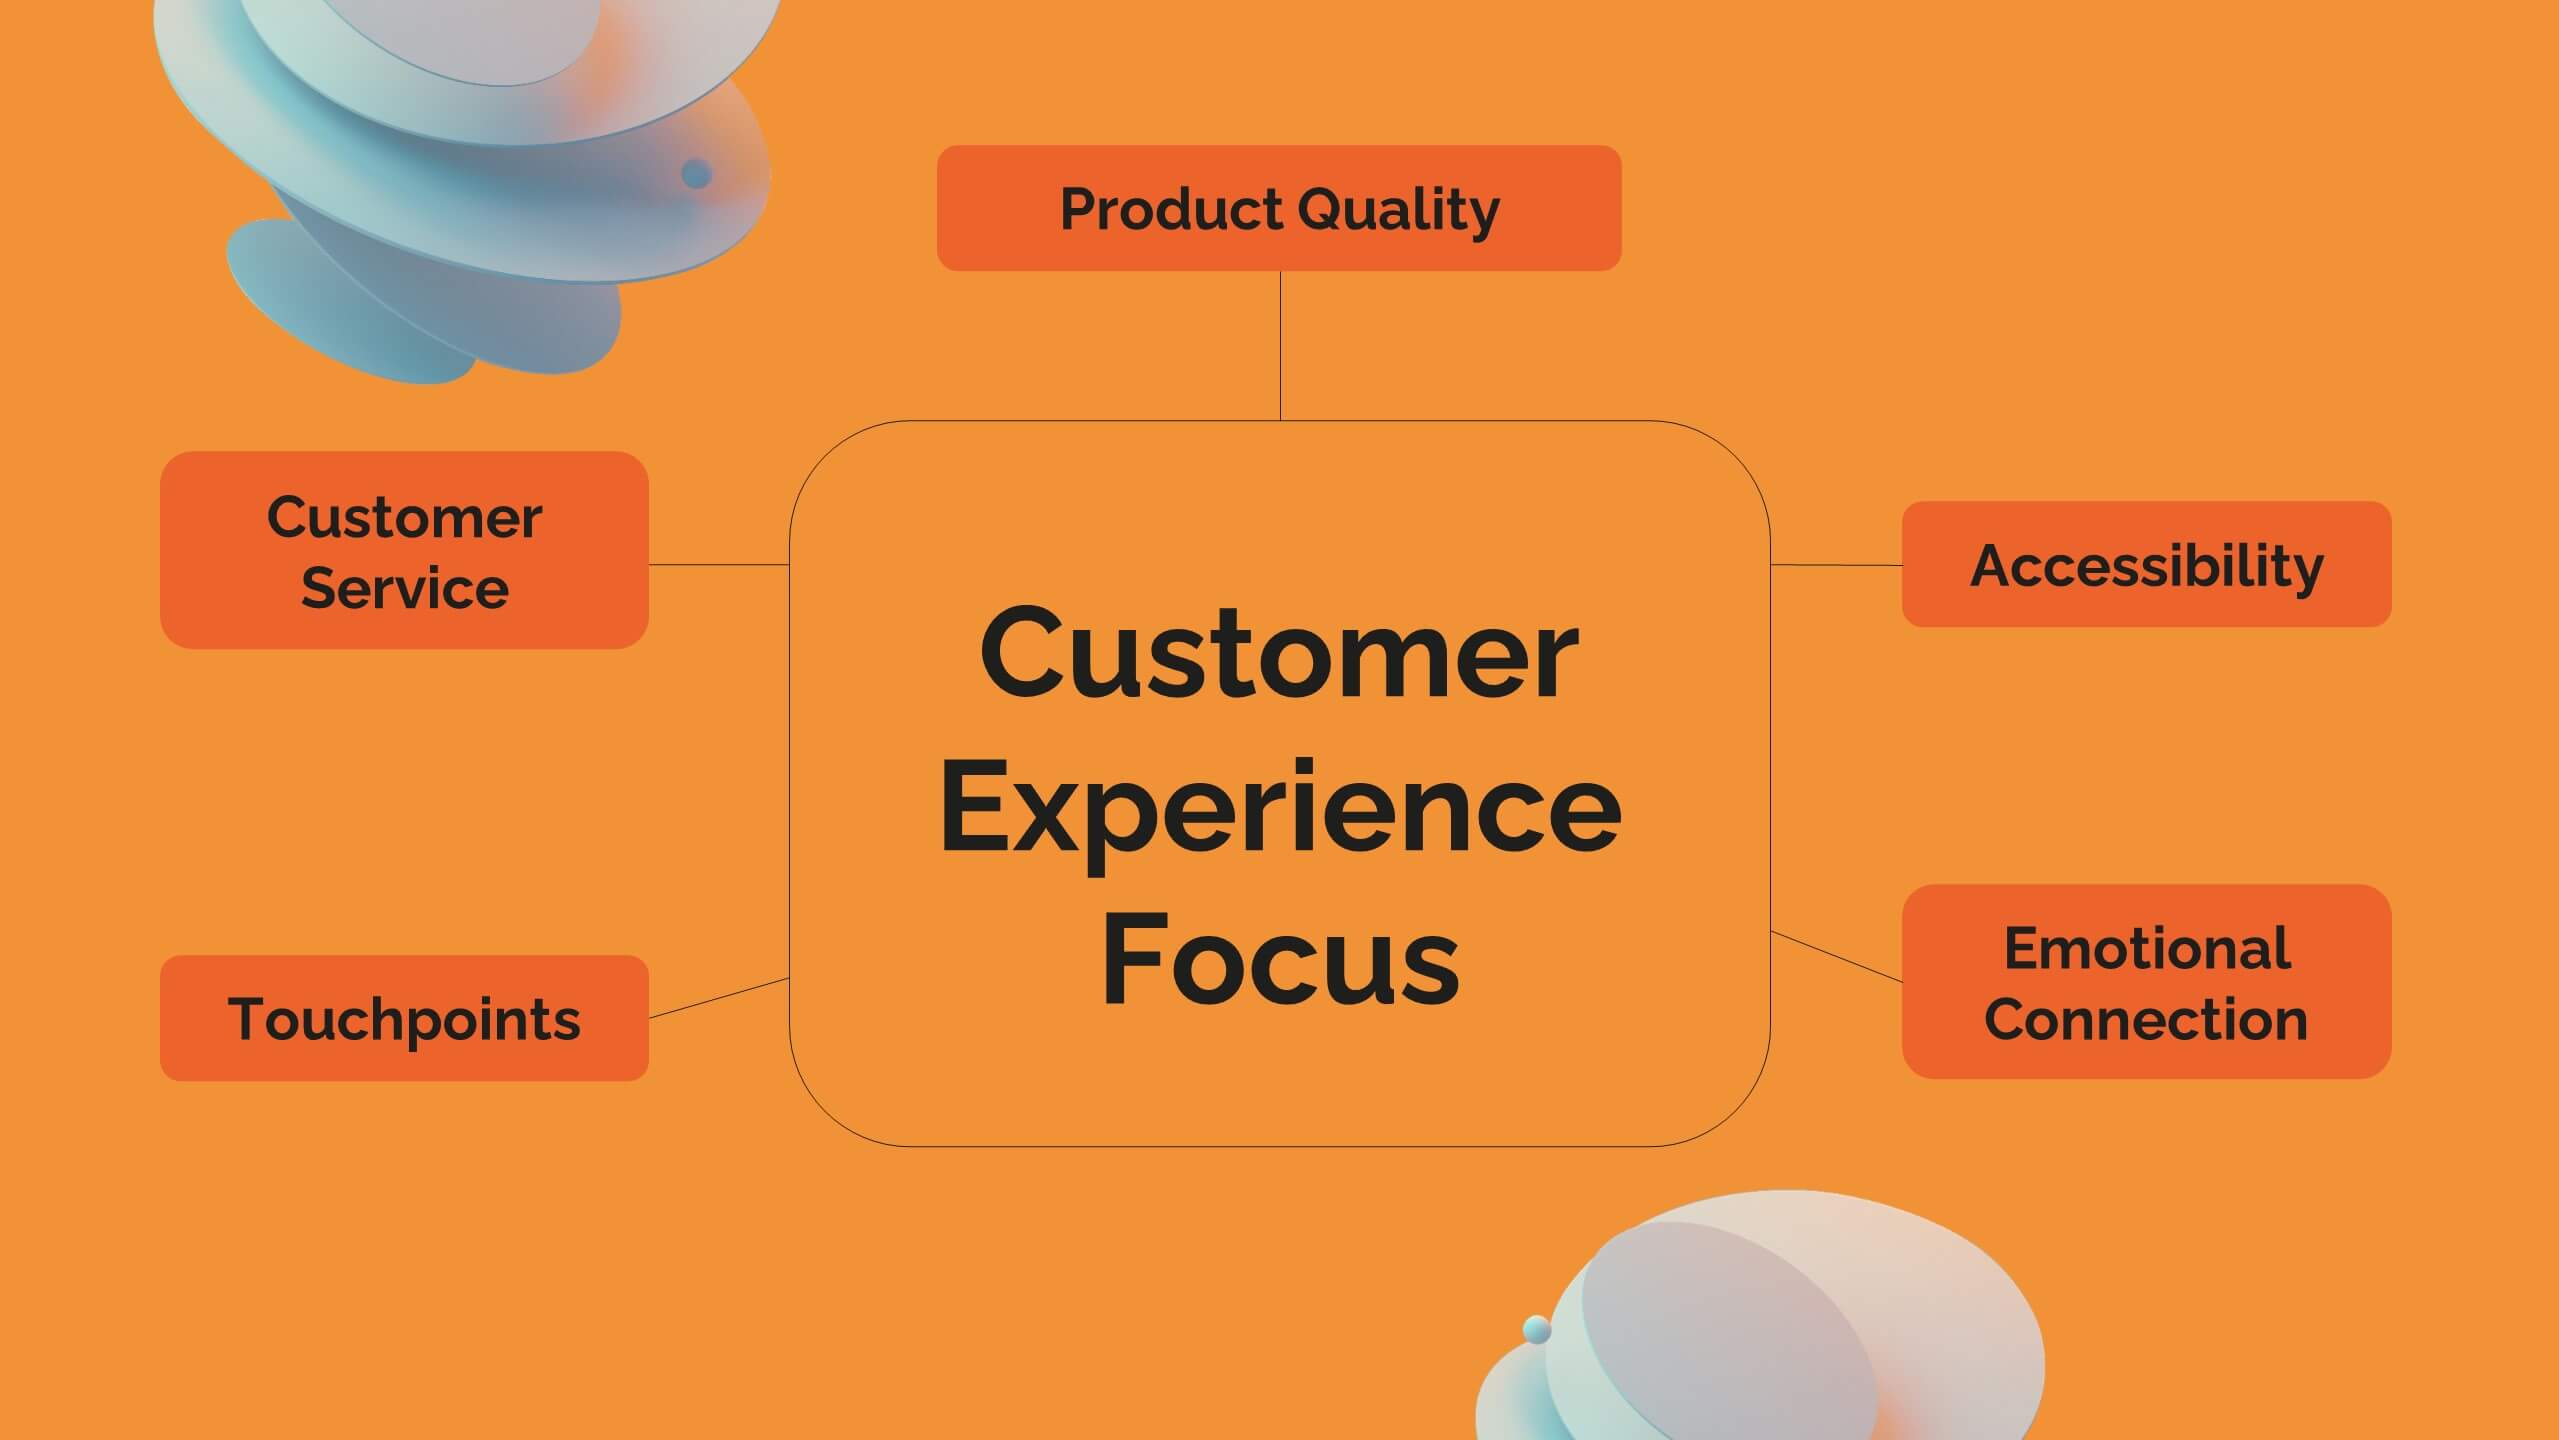
Concentric Circles Business Model Presentation
Visualize Your Business Strategy with Clarity using this Concentric Circles Business Model Presentation template. This design helps you illustrate core business concepts, hierarchical structures, and strategic layers in a simple yet engaging format. Ideal for business planning, process optimization, and strategic growth presentations, this template makes complex relationships clear and easy to understand. Fully editable and available for PowerPoint, Keynote, and Google Slides.


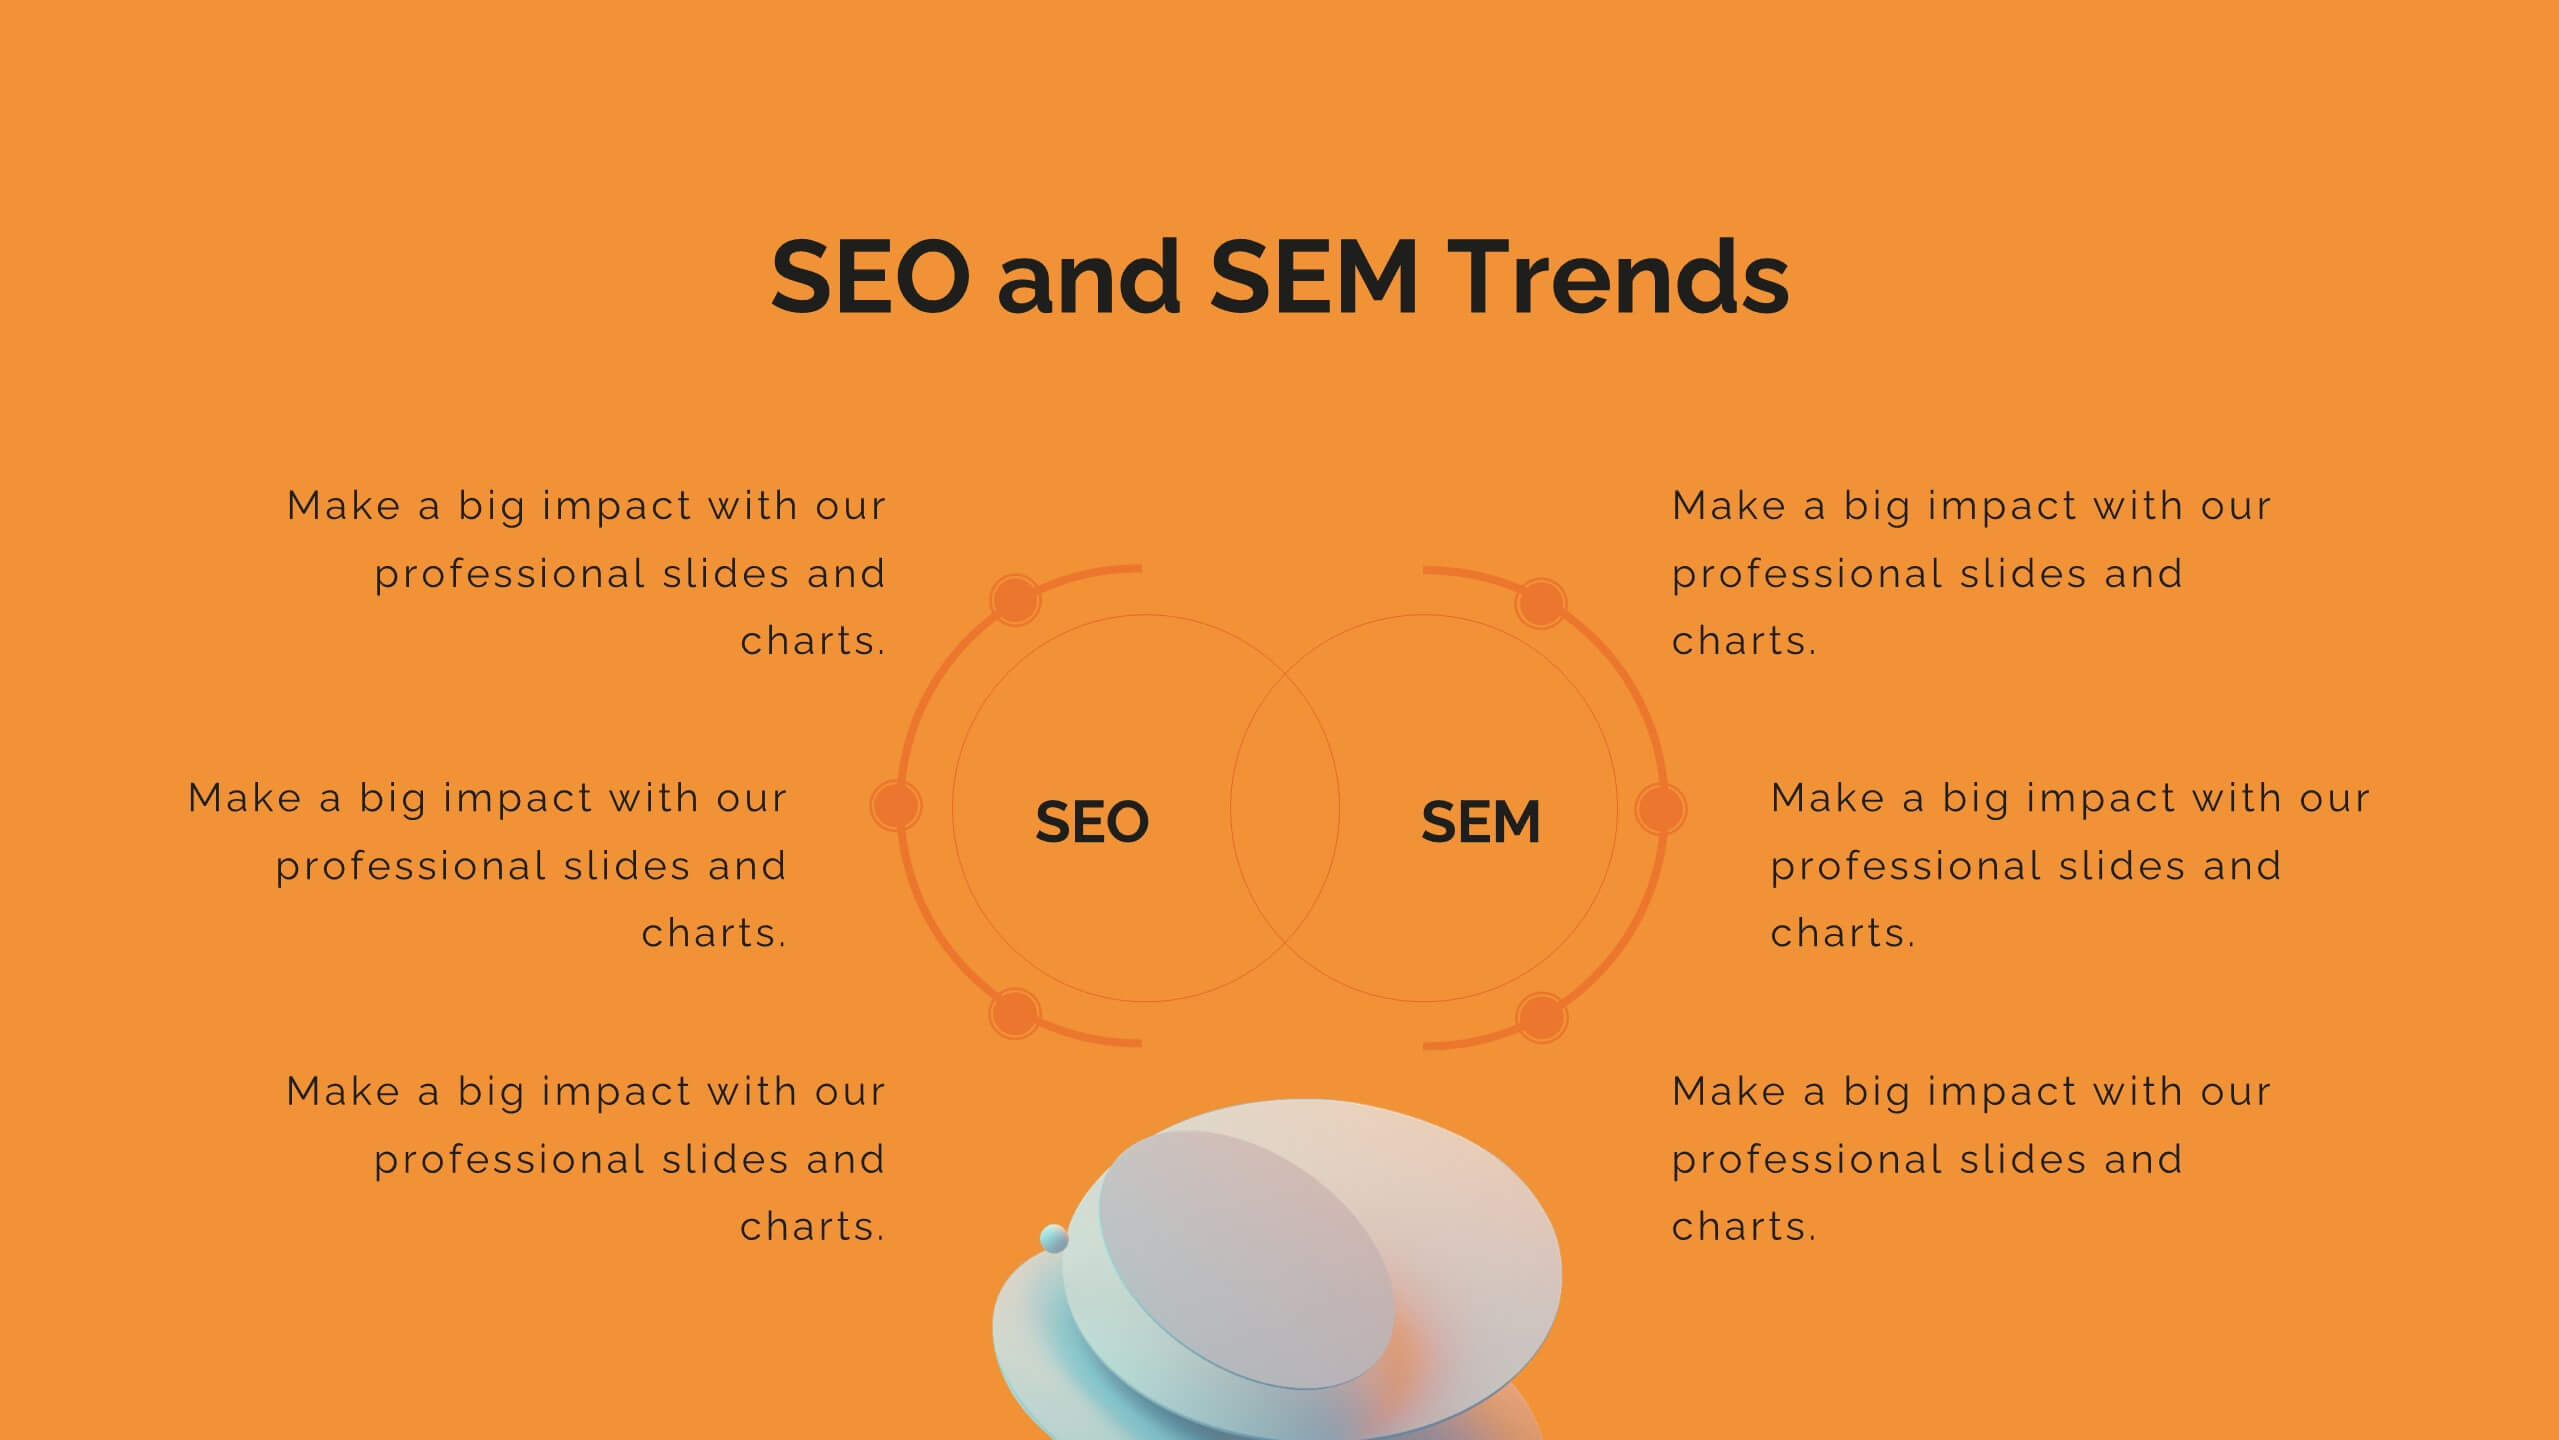
7 diapositivas
Butterfly Visualization Layout Presentation
Bring balance and clarity to your data storytelling with a sleek, symmetrical design that connects ideas seamlessly. This presentation is ideal for visualizing comparisons, workflows, or interconnected topics in a clean and engaging format. Fully customizable and compatible with PowerPoint, Keynote, and Google Slides.


10 diapositivas
Projects Completion Checklist Presentation
Keep every milestone visible and celebrate progress with a clean, structured layout designed to track project achievements. This presentation helps teams communicate goals, timelines, and completed tasks clearly and professionally. Fully customizable and compatible with PowerPoint, Keynote, and Google Slides for seamless editing and polished project reporting.


20 diapositivas
Solstice Research Proposal Presentation
This sleek research proposal template is crafted to impress! Highlighting sections like research methodology, literature review, key findings, and recommendations, it’s designed for in-depth presentations with a modern touch. Perfect for academic, business, or technical reports, this template is fully compatible with PowerPoint, Keynote, and Google Slides. Ideal for delivering insights with style!


15 diapositivas
Business Plan Infographic Presentation
Businesses are important components of a healthy economy and society. They create jobs, drive innovation, encourage entrepreneurship, and contribute to the well-being of society. With this template you can create a clear and effective business Infographic for your pitches, or projects. The design is made to enhance your message and inspire your audience. This template can be used for presenting any business information whether it be data, statistics, facts etc. It is compatible with Powerpoint, keynote and google slides so all the elements are editable, and can be changed to fit your needs.


26 diapositivas
Fitness Company Profile Dark Presentation
Dive into the pulsating realm of fitness, where every sweat drop carves the path to chiseled abs. Imbued in shades of black with electrifying neon accents, our template captures the dark, motivating ambiance of late-night gym sessions. Featuring dynamic graphics, empowering icons, and inspiring image placeholders, it's a testament to determination and grit. Flawlessly curated for Powerpoint, Keynote, or Google Slides. The ultimate asset for fitness trainers, gym enthusiasts, health bloggers, or anyone aiming to inspire a journey towards physical excellence. Push your limits; let every rep ignite your passion.


7 diapositivas
Six Sigma Methodology Infographic Presentation Template
Our Six Sigma Methodology template is a great way to start any project. This can be used as a guideline to create the foundations of the Six Sigma model and allow you to think about how to approach your project in terms of how it will be analyzed, making it easier for people working on the same projects to analyze their own results and make sure they are all aligned with the core principles of Six Sigma. With our Six Sigma Methodology template, you can easily organize and manage your entire process. Using this template will save you time and allow you to get more work done in less time.
5 diapositivas
Workflow Arrow Infographic Presentation
Highlight each step of your process with clarity using the Workflow Arrow Infographic Presentation. This slide set features bold horizontal arrows that guide the viewer from one stage to the next, making it perfect for visualizing timelines, processes, or sequences. Each arrow is numbered and color-coded for easy reference, with accompanying text areas to elaborate on each step. Fully editable in PowerPoint, Keynote, and Google Slide.


26 diapositivas
Emery Presentation Template
Ready to make an impression? Style and professionalism are all wrapped up in Emery. New businesses and startups will find it useful - from real estate to travel agencies and everything in-between. Emery is a bold, colorful minimalistic aesthetic template. It's easy to customize, clean and bold template for you to use for your company website. It's flexible and makes an easy quick start. Fill in your details with our easy to edit text, pictures, timelines, charts and we'll set you up for success. Use this fantastic template to promote your business or project and create the perfect document.