


Características


¿Tienes alguna pregunta?
Recomendar


6 diapositivas
Basic Numbers Infographic
This Basic Numbers Infographic is a visual representation of numerical data or information using simple graphical elements. This infographic template is a straightforward way to convey statistics, facts, or comparisons to your audience in a clear and engaging manner. The infographic includes a clean and uncluttered design while effectively presenting the numerical information. The visual elements enhance understanding and make the infographic visually appealing to your audience. The icons, symbols, and simple illustrations enhance the appeal of the infographic. Compatible with Powerpoint, Keynote, and Google Slides.


7 diapositivas
Business Pricing Table Slides Infographic
Streamline your product offerings with our Business Pricing Infographic, designed to clearly present pricing tiers and package options. This infographic is essential for sales teams, marketing professionals, and business owners to communicate value propositions to potential customers. Our Business Pricing Infographic allows for a clean, comparative view of different pricing plans, showcasing features, benefits, and cost-effectiveness at a glance. It includes customizable sections for various packages, making it easy to distinguish between basic, standard, and premium options. With this tool, you can highlight key differences and unique selling points of each package, aiding customers in making informed purchasing decisions. This SEO-friendly infographic is crafted to attract and educate potential buyers, providing them with transparent pricing information. Adopt this infographic in your marketing materials to facilitate a straightforward shopping experience, helping customers choose the right product that fits their needs and budget.


2 diapositivas
Mission Statement Slide Layout Presentation
Spark inspiration from the very first slide with a clean, modern layout that brings your core purpose to life. This presentation helps you communicate vision, values, and organizational direction in a clear, engaging format that resonates with any audience. Fully compatible with PowerPoint, Keynote, and Google Slides.


6 diapositivas
Business Process Checklist Overview Presentation
Simplify your workflow presentations with the Business Process Checklist Overview Presentation. This circular layout is ideal for outlining five sequential or cyclical steps in a business process, featuring icon-labeled checkpoints and editable titles. Each step is visually marked with subtle checkmarks, making it perfect for status tracking, task progression, or implementation plans. Clean, professional, and fully customizable in PowerPoint, Keynote, and Google Slides.


5 diapositivas
Business Opportunity in Europe Map Presentation
Identify key growth areas across Europe with this clean, data-driven presentation. Highlight business potential using country-based color coding and progress indicators. Perfect for market analysis, investment pitches, or strategic expansion reports. Fully editable and compatible with PowerPoint, Keynote, and Google Slides for effortless customization and professional presentation delivery.


22 diapositivas
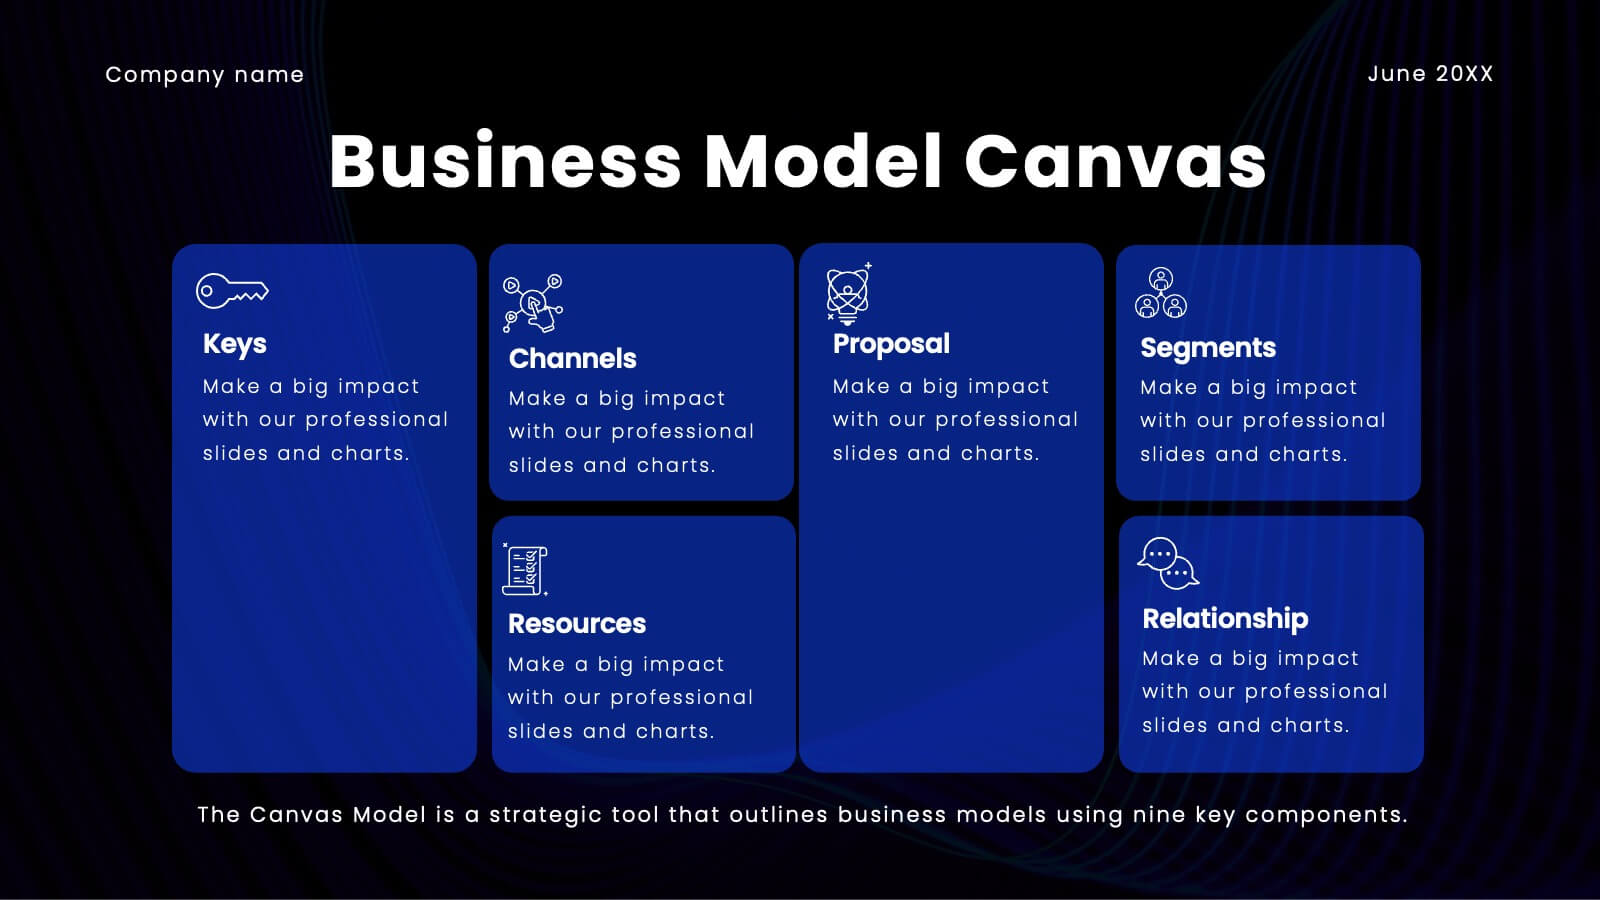
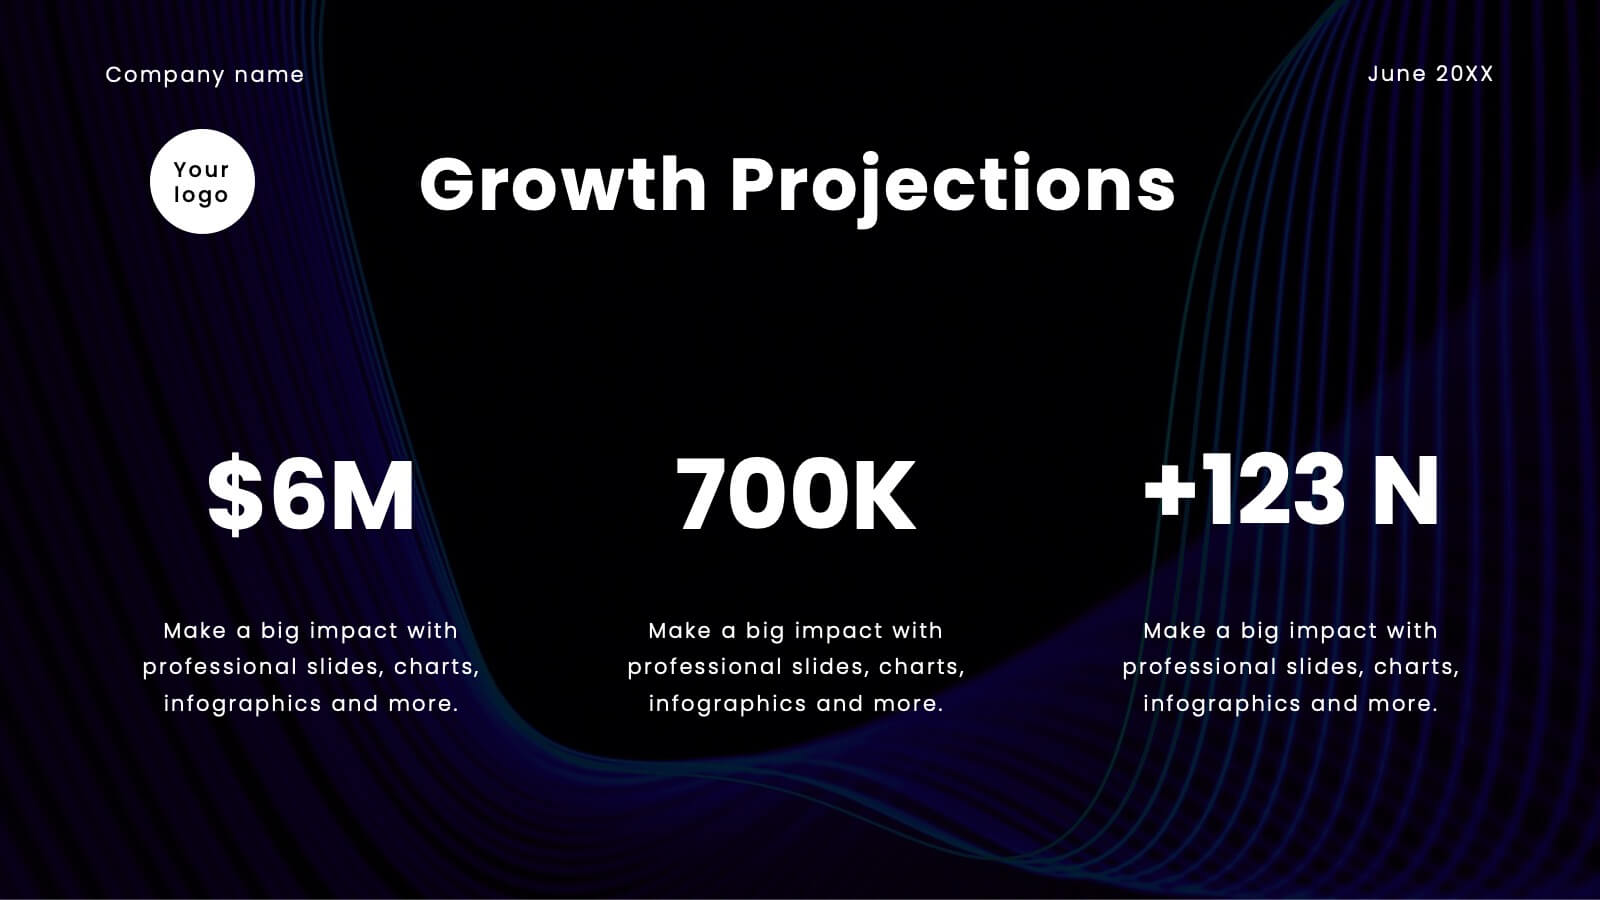
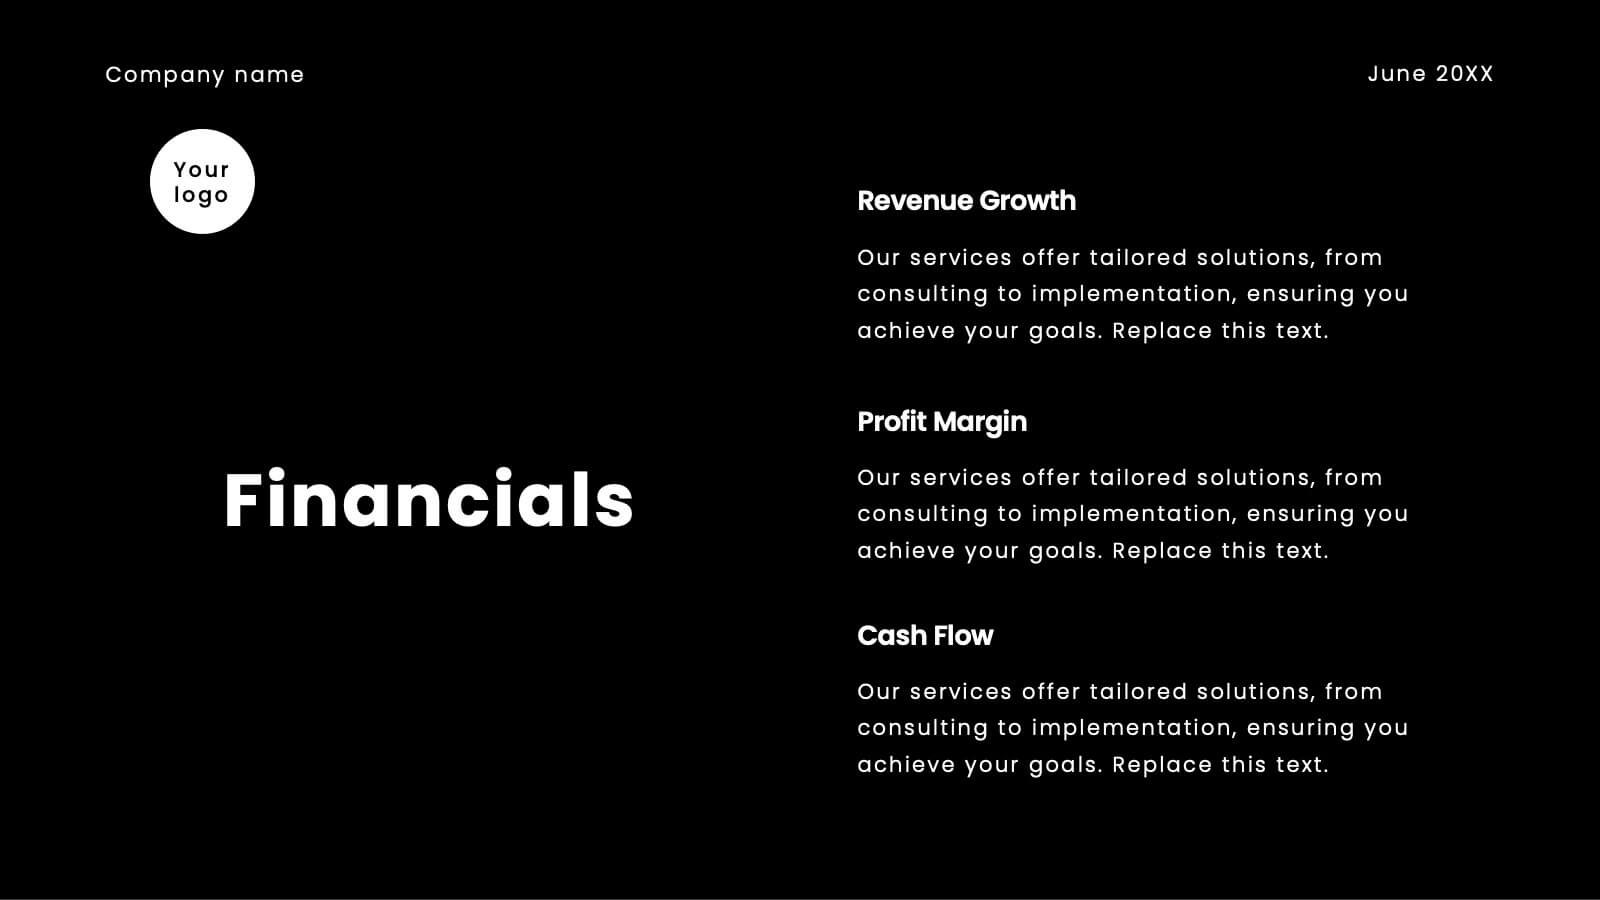
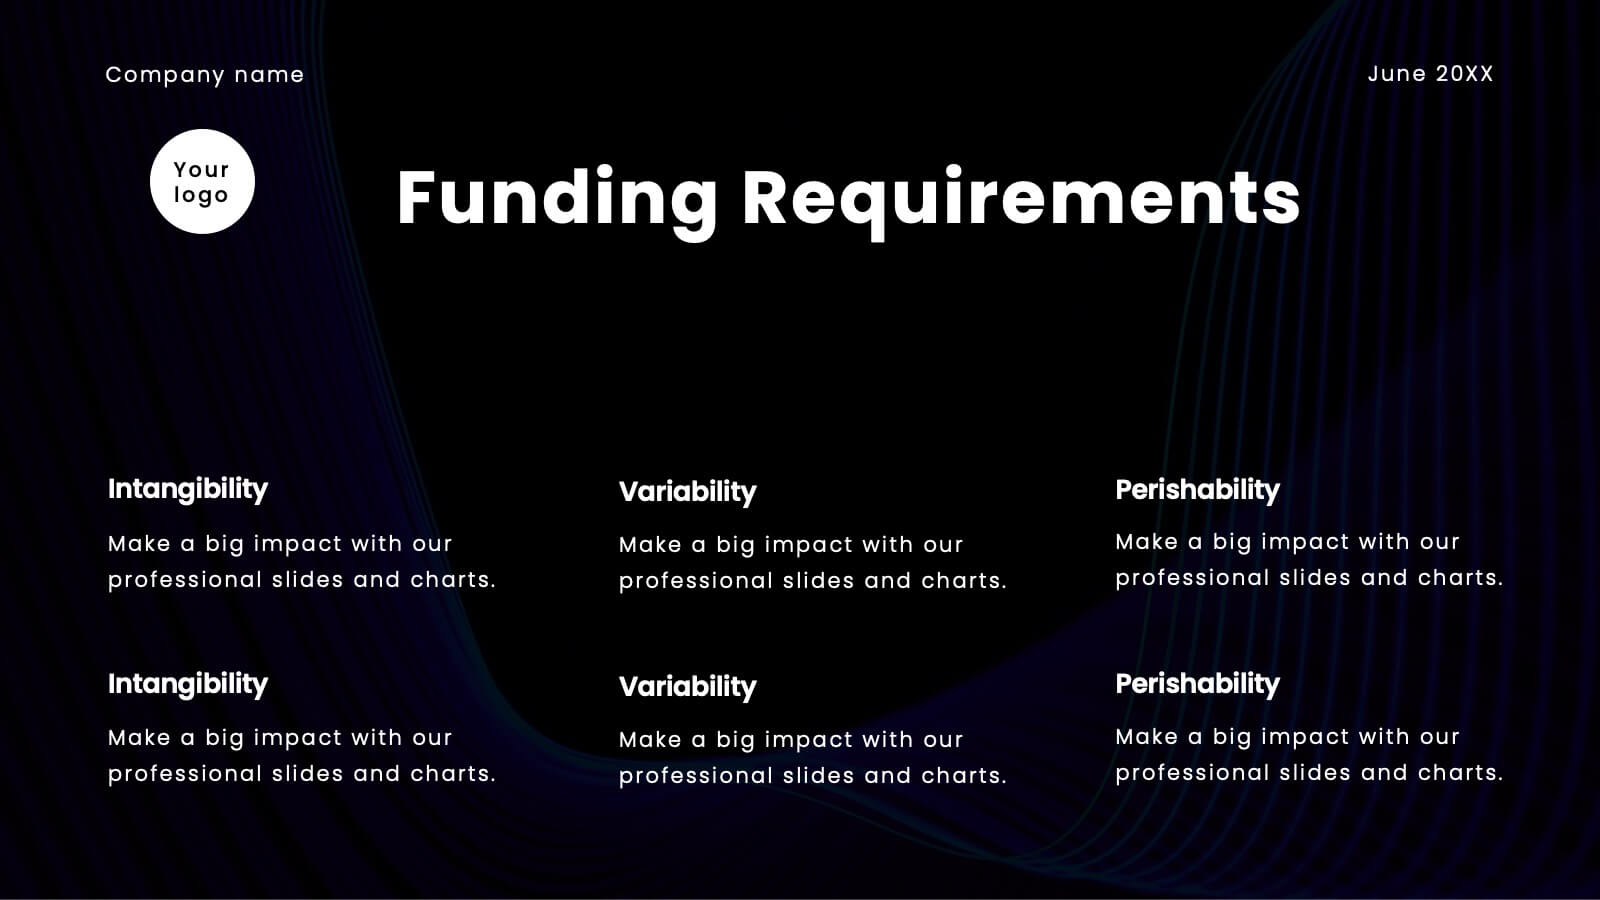
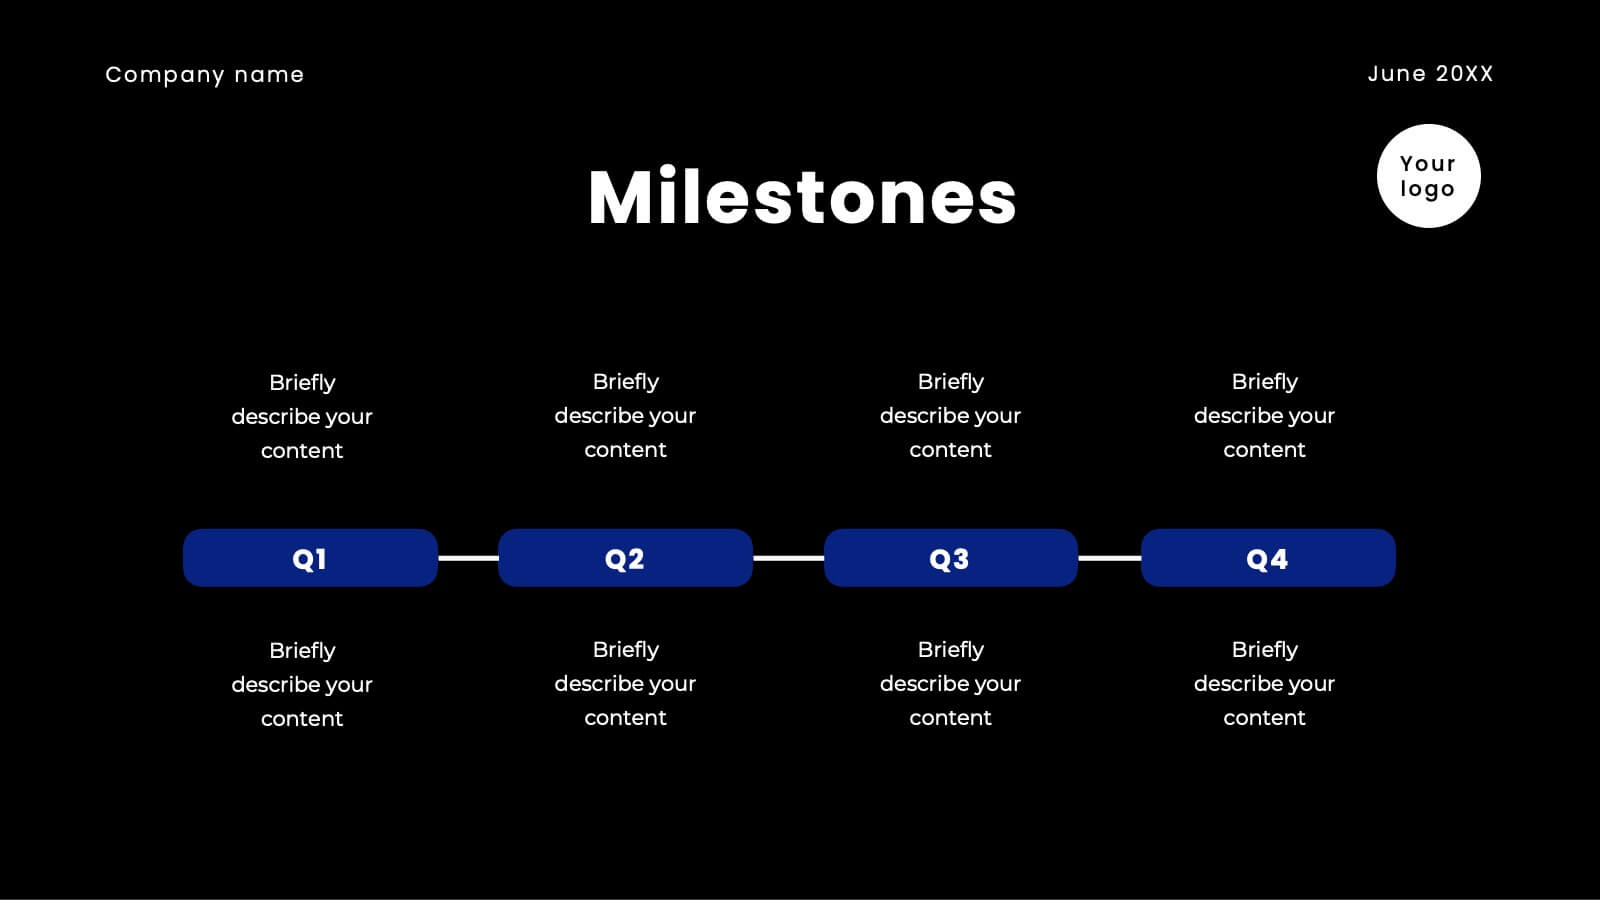
Jolt Business Idea Pitch Deck Presentation
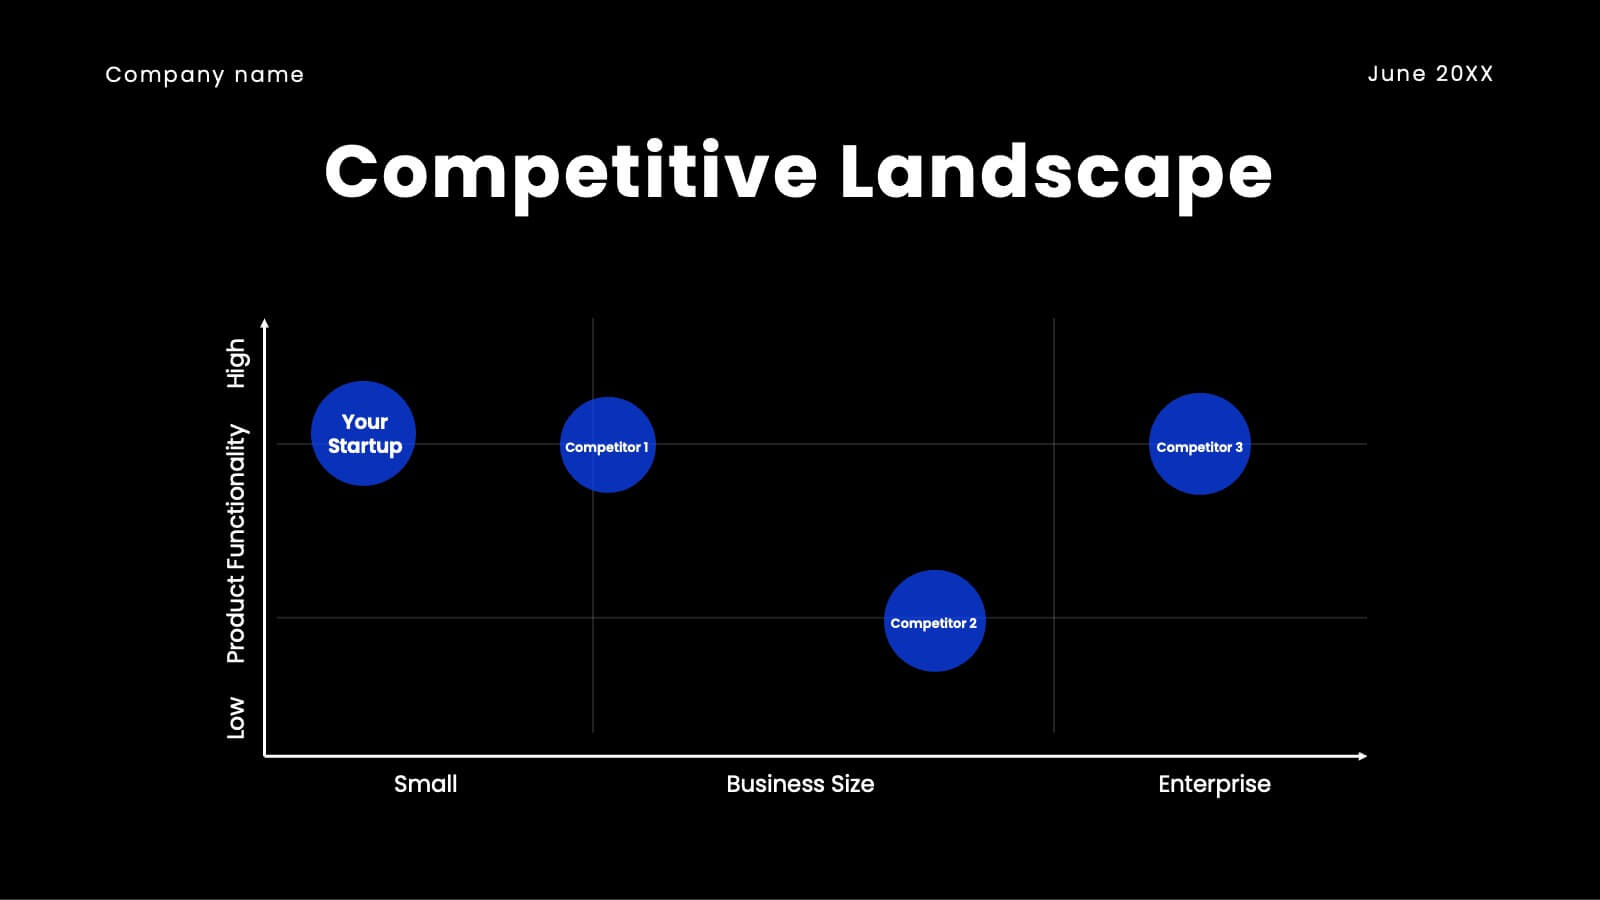
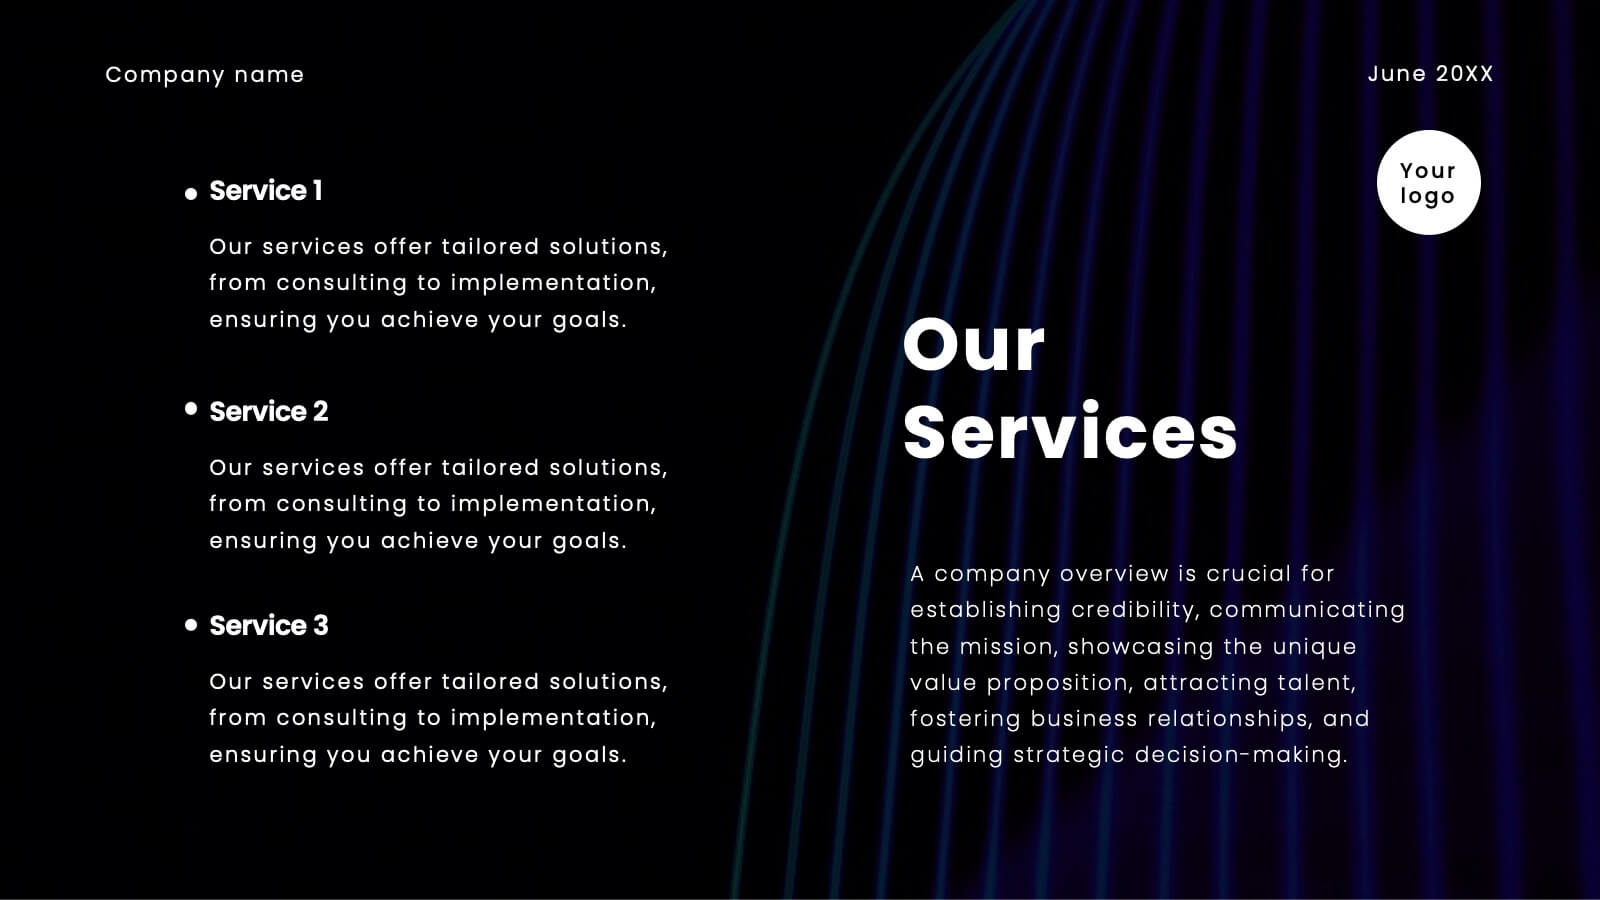
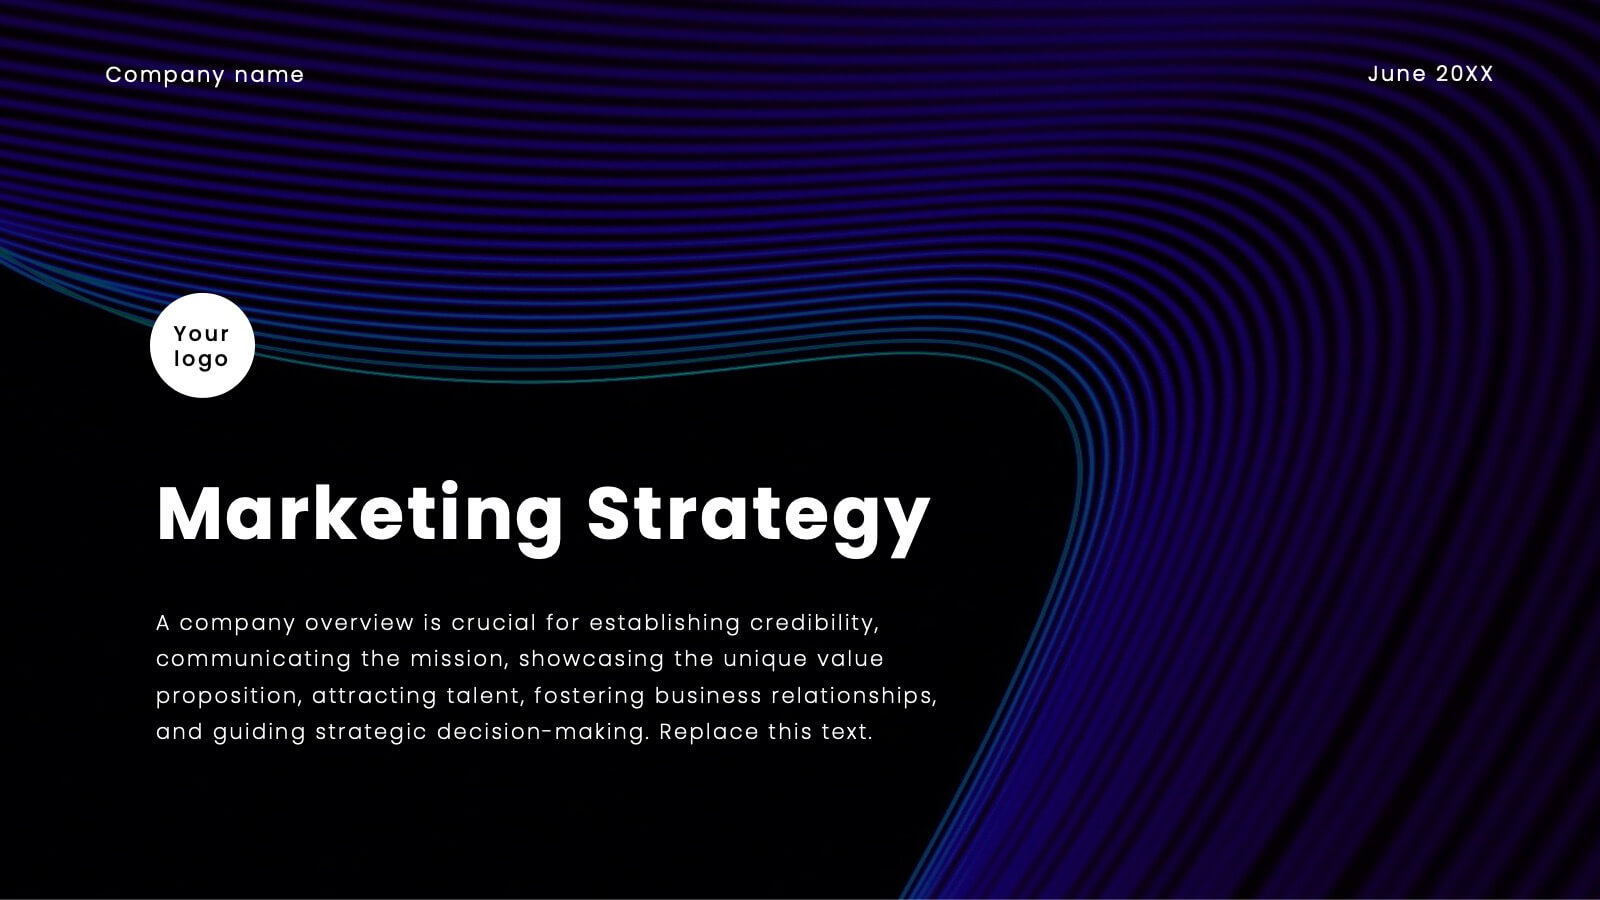
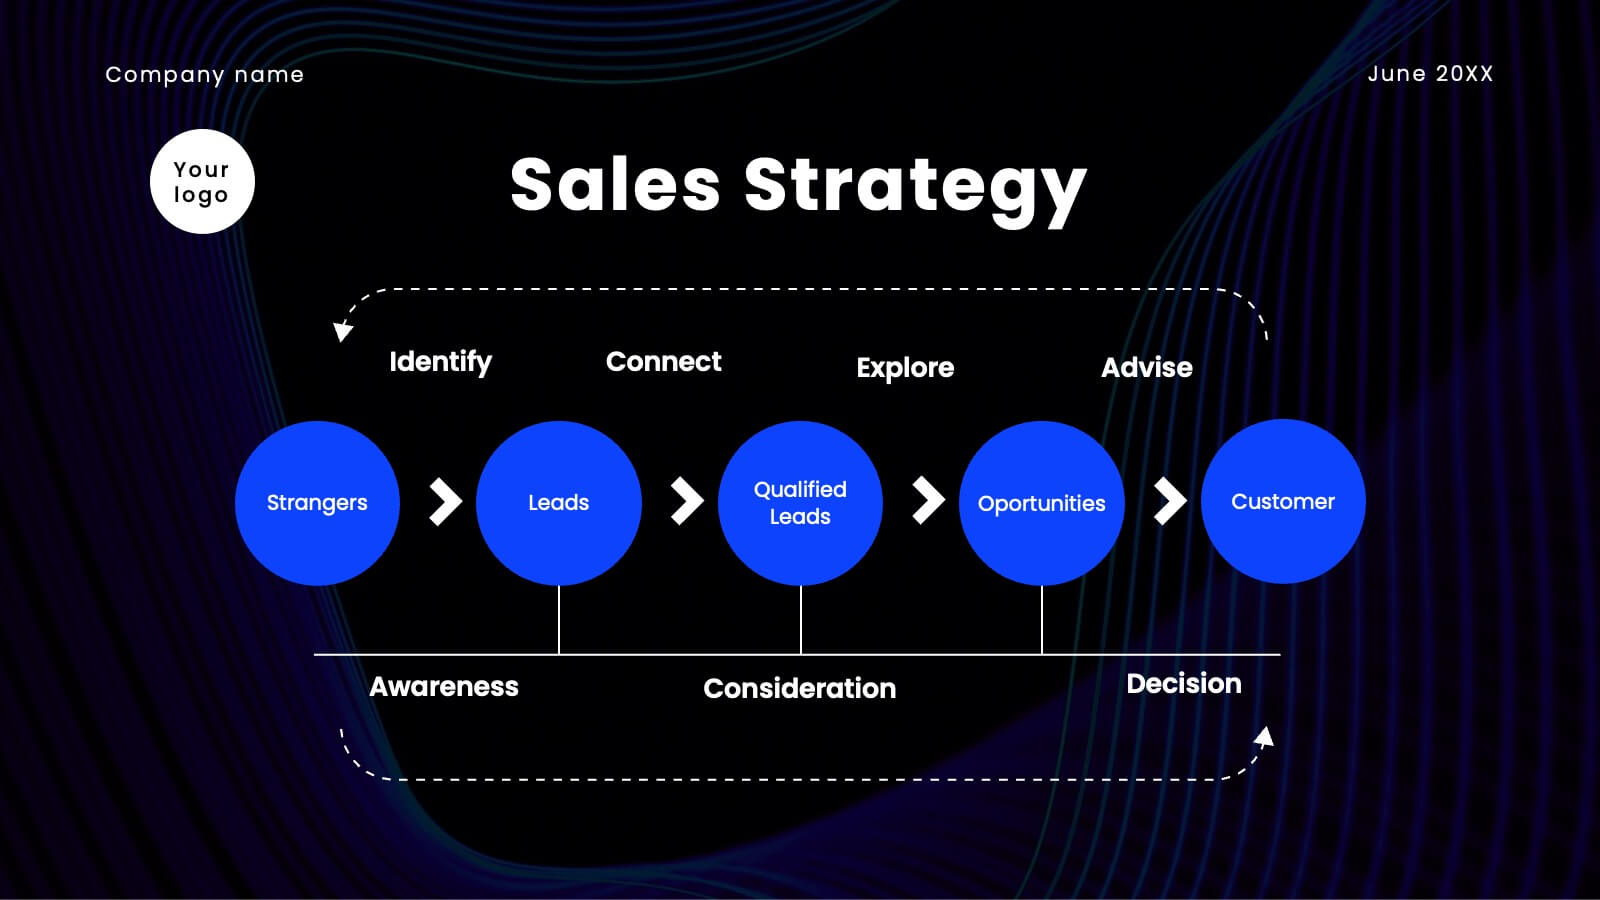
Prepare to electrify your audience with a pitch deck that’s nothing short of spectacular! This high-impact template is designed to captivate, engage, and persuade your stakeholders with every slide. It’s more than just a presentation; it’s your gateway to showcasing your company’s unique value proposition, innovative solutions, and future growth potential in a way that’s visually stunning and incredibly compelling. From the moment you unveil your company overview to the final slide on financials and funding requirements, this template ensures your pitch is memorable, powerful, and impossible to ignore. The sleek, modern design highlights your strategic vision, competitive advantages, and market opportunities, making a bold statement that you’re ready to lead the future. Compatible with PowerPoint, Keynote, and Google Slides, this pitch deck template is your ultimate tool for turning heads and securing buy-in from investors, partners, and clients alike!


43 diapositivas
UX UI Structure Presentation
Dive into UX with this comprehensive, elegant presentation template tailored for detailed case studies and user research. Perfect for mapping user journeys, creating personas, and showcasing design principles, this template ensures your UX insights are clearly communicated. Its sleek design enhances readability and engagement. Compatible with PowerPoint, Keynote, and Google Slides, it's ideal for any platform.


6 diapositivas
STEM Education and Discovery Presentation
Showcase your STEM insights with this vibrant puzzle-piece infographic. Each piece highlights a key point in science, technology, engineering, or math—perfect for lesson plans, research summaries, or discovery processes. Fully customizable in PowerPoint, Keynote, and Google Slides, making it ideal for educators, researchers, or curriculum developers.


7 diapositivas
Flow Chart Diagram Presentation
Flow charts are important because they provide a visual representation of a process or system, which helps to simplify complex information and make it easier to understand. Our Infographic flow charts are easy to use because they combine visual elements such as icons, and colors with concise text, making complex information more digestible and memorable. These highly adaptable flow charts are ideal due to their complete customizability, allowing for universal utilization to cater to the unique requirements of any individual. Do not waste any more precious time and get started right away.
9 diapositivas
Arrow Security Infographic
Introducing our new "Arrow Security Infographic", this is a visually engaging and informative presentation template that focuses on various aspects of arrow infographics. This template can be used to provide an overview of different security measures, techniques, and technologies that can be implemented to enhance safety and protect against potential threats. This is designed with a variety of arrow infographics that can help help individuals and organizations understand the importance of security and make informed decisions to safeguard their assets and interests. Compatible with Powerpoint, Keynote, and Google Slides.


7 diapositivas
Sustainability Business Management Infographic Presentation
Sustainability Management presents information related to sustainable business practices and management strategies. The goal of this template is to help you create a balance between environmental factors to ensure long-term success for a business or organization. This infographic can cover a variety of topics, including sustainable supply chain management, energy, resource efficiency, and waste reduction. This template has different layouts including diagrams and graphs. It also includes icons, symbols, and color-coding to make the information more accessible and easier to understand.


6 diapositivas
Concentric Circles Study Infographic
Concentric circles are a set of circles with the same center point but different radii (plural of radius). This Infographic provides visual insights into the concept of concentric circles, their properties, and applications. These circles are arranged in such a way that one circle is surrounded by another, forming a pattern that resembles a target or a bullseye. This illustrates various concepts, making the infographic a versatile and engaging geometric pattern. Fully customizable and compatible with Powerpoint, Keynote, and Google Slides. Design an organized layout that guides the viewer's eye through the infographic.


8 diapositivas
Business Strategy Planning Presentation
Strategize with Impact using this Business Strategy Planning Presentation template. This slide provides a visually compelling roadmap to outline key business strategies, objectives, and growth plans in an easy-to-follow format. Perfect for corporate meetings, executive briefings, and business planning sessions, this template ensures your business vision is communicated clearly and effectively. Fully editable and available for PowerPoint, Keynote, and Google Slides for seamless customization.


7 diapositivas
Environment United States Map Infographic
An Environment United States Map refers to a map that displays various environmental aspects or features across the United States. This template is a powerful tool for visualizing sustainability initiatives and environmental data across the diverse landscapes of the United States. With a combination of insightful graphics, this template enables you to present a compelling narrative about the nation's environmental efforts. This Infographic is a call to action to protect and preserve our planet, highlighting the efforts that are shaping a more sustainable and harmonious coexistence with nature.


4 diapositivas
Financial Overview Slide Presentation
Kick off your presentation with a clean, modern visual that makes financial insights easy to grasp at a glance. This slide helps you summarize key metrics, compare performance areas, and highlight important business trends in a simple, structured layout. Fully compatible with PowerPoint, Keynote, and Google Slides.


6 diapositivas
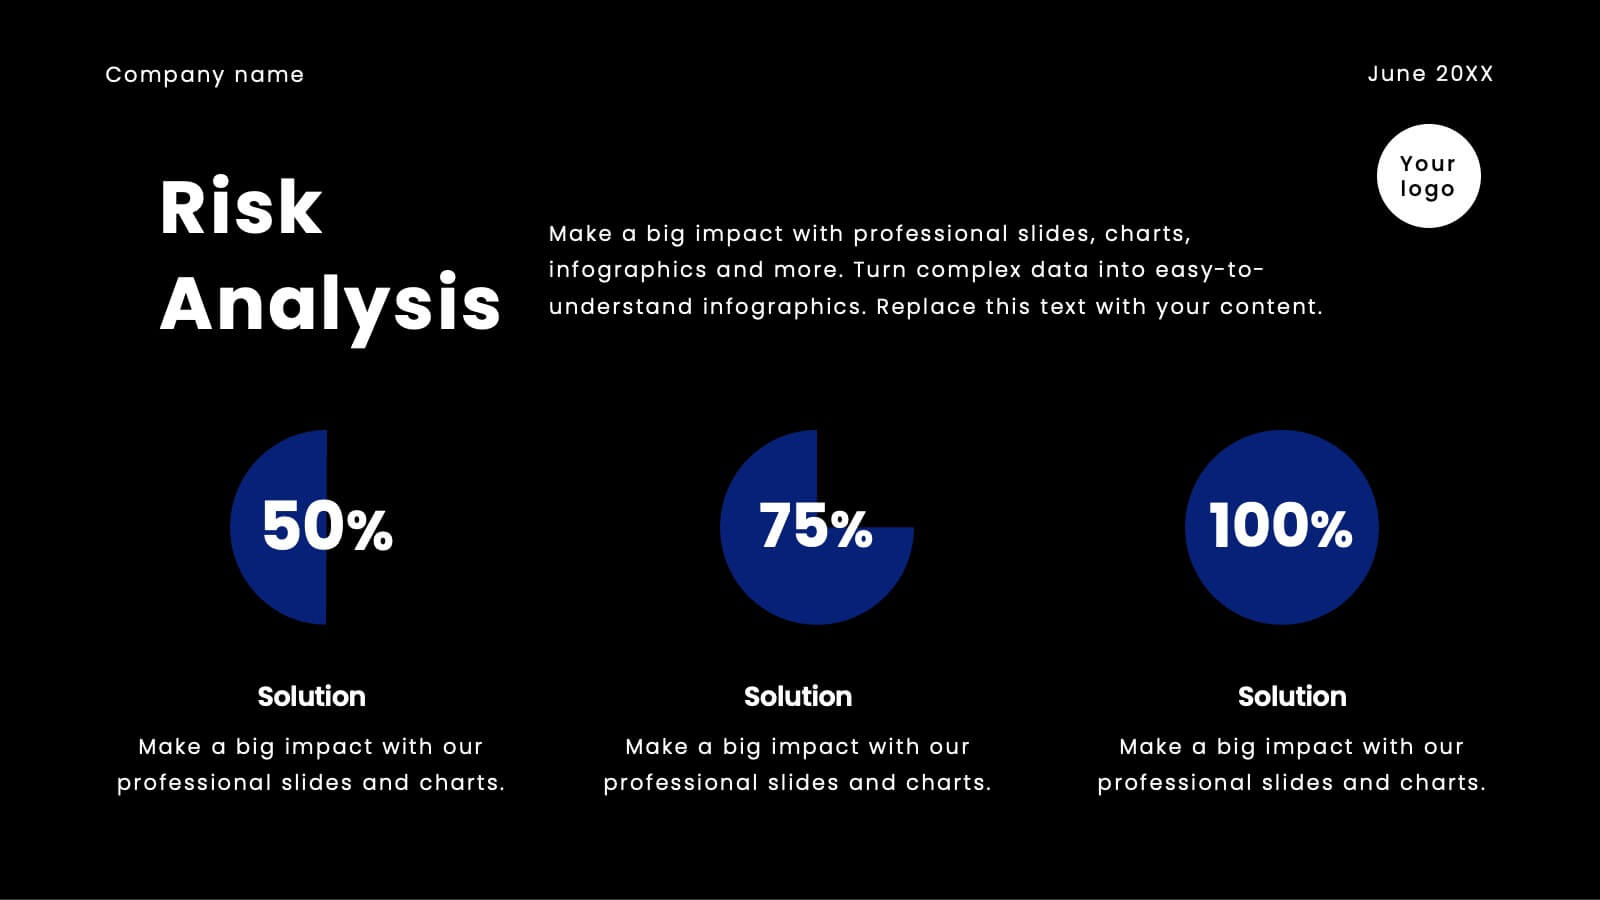
Data-Driven Decision Making with Numbers Presentation
Turn insights into action with this segmented visual template, perfect for showcasing analytics, KPIs, or data-backed strategies. The semi-pie layout organizes information into six labeled sections, making it easy to interpret at a glance. Great for business reports, research summaries, or executive dashboards. Fully editable in PowerPoint, Keynote, and Google Slides.


6 diapositivas
Population Pyramid Infographic
A population pyramid, also known as an age-gender pyramid, is a graphical representation of the distribution of a population by age and gender. This infographic is a visually captivating presentation designed to illustrate the age and gender distribution of a population. It provides an easy-to-understand representation of the population structure, allowing viewers to grasp demographic patterns at a glance. Present your population data and demographic trends with this template. This enables viewers to grasp demographic patterns quickly and facilitates the key insights about a population's composition and changes over time.