


Características


¿Tienes alguna pregunta?
Recomendar


7 diapositivas
Ecology Infographic Presentation Template
An Ecology Infographic is a visual representation of information and data related to ecology and the environment. This template is designed in the form of charts, graphs, diagrams, illustrations, and other elements, and is made to make complex information about the environment and ecology easier to understand and more engaging. The goal of this ecology infographic template is to provide clear, concise, and visually appealing information about various environmental issues, such as climate change, pollution, habitat destruction, and other topics related to the health of our planet.


5 diapositivas
Small Business Plan Presentation
The "Small Business Plan Presentation" template is designed to visually articulate the essential elements of a business strategy effectively. This infographic employs 3D block graphics in varied colors to denote different sections of a business plan, such as market analysis, operations, marketing strategies, and financial projections. Each block is labeled clearly, facilitating an easy understanding and discussion of each business aspect. Ideal for entrepreneurs and small business owners, this template aids in presenting complex information in a straightforward, organized format during meetings with stakeholders or potential investors, ensuring key points are communicated clearly and professionally.


4 diapositivas
Case Analysis for Executive Decision Making Presentation
Guide stakeholders through data-driven insights with the Case Analysis for Executive Decision Making Presentation. This layout uses a clear upward progression with labeled steps to showcase milestones, challenges, or strategic outcomes—perfect for leadership meetings or high-level reviews. Fully customizable in PowerPoint, Keynote, and Google Slides.


6 diapositivas
Target Audience Demographics Presentation
The "Target Audience Demographics" presentation employs an innovative spiral chart design to display key demographic data in an engaging and easy-to-understand format. Each segment of the spiral represents a different demographic characteristic with percentages clearly marked, enabling quick insights into audience composition. This design is well-suited for marketing presentations or any scenario where understanding audience segments is crucial. The placeholders are conveniently set up to add specific details or insights, making the template not only visually appealing but also highly functional for strategic planning and audience analysis.


22 diapositivas
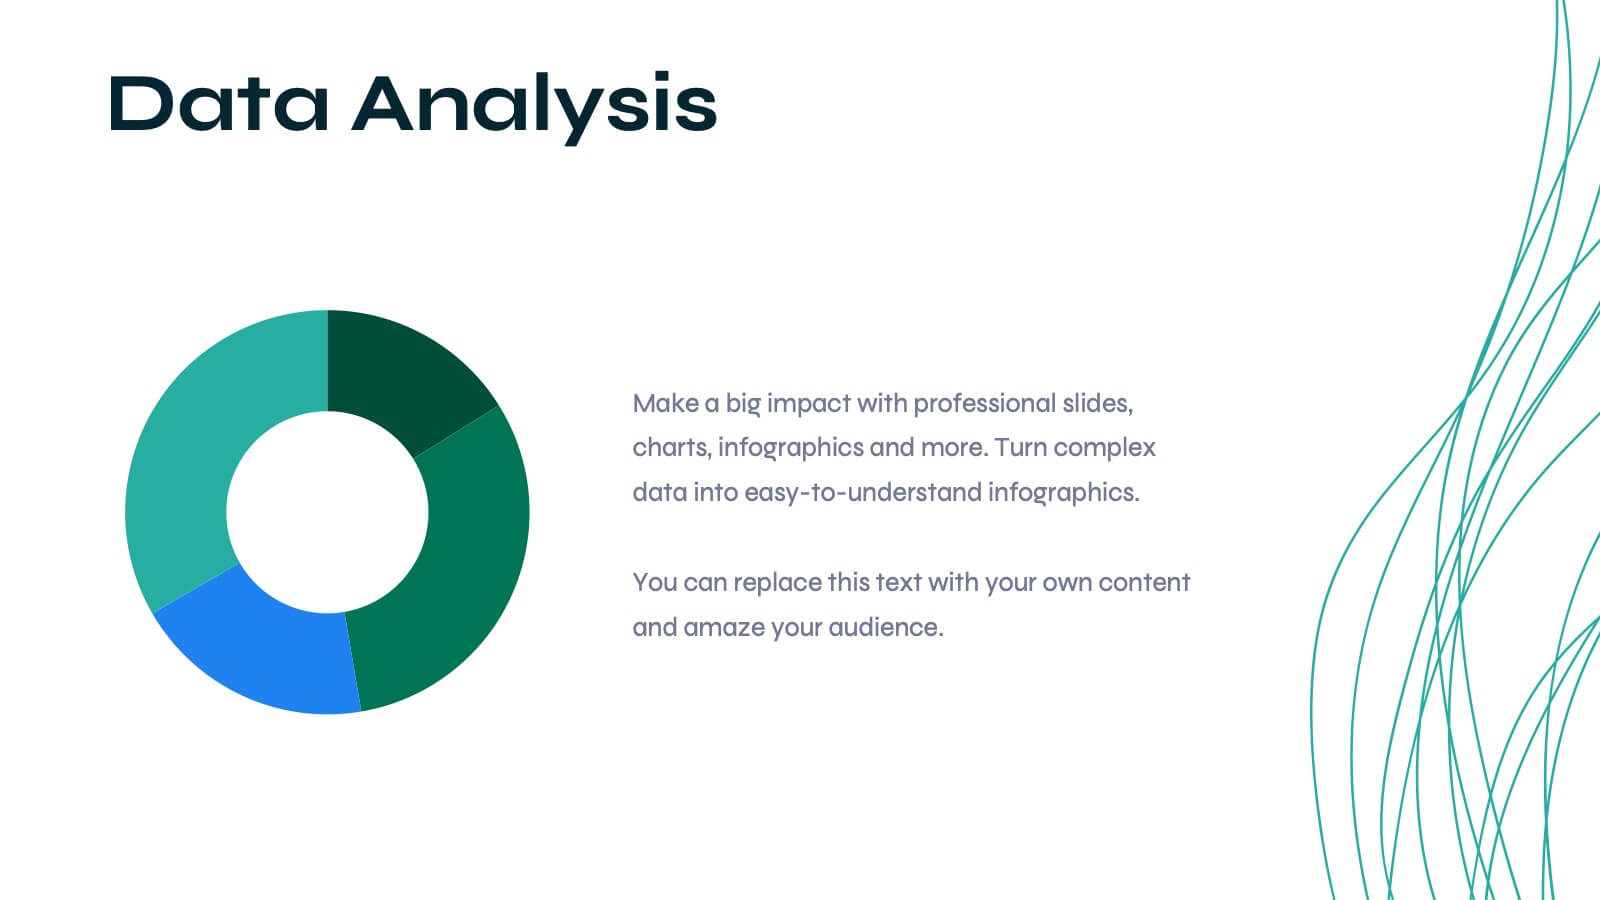
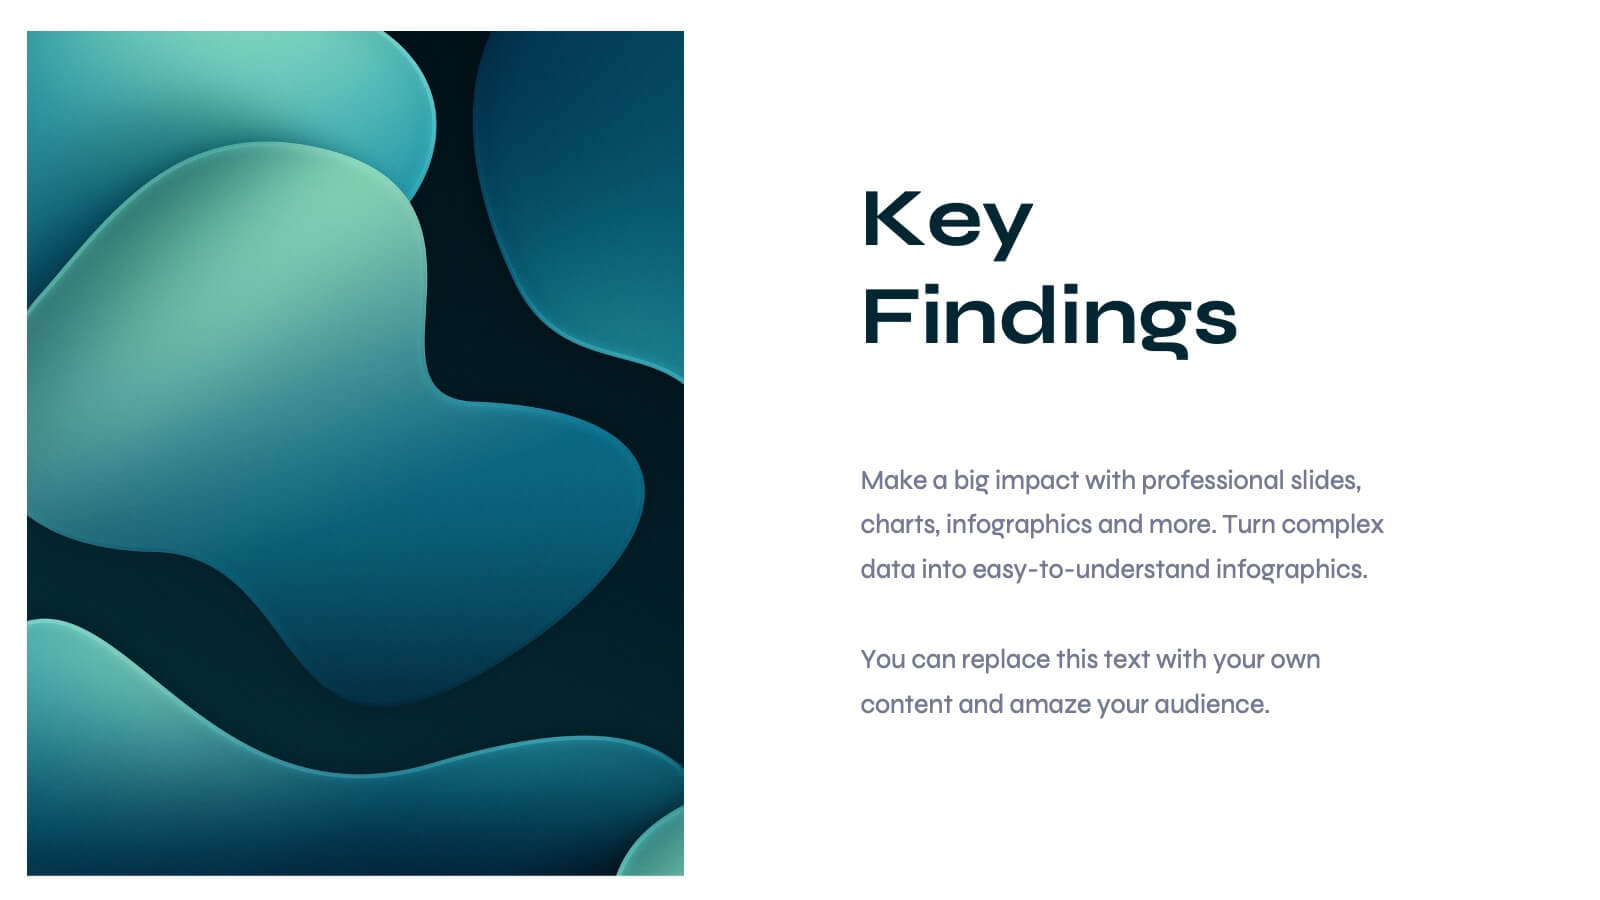
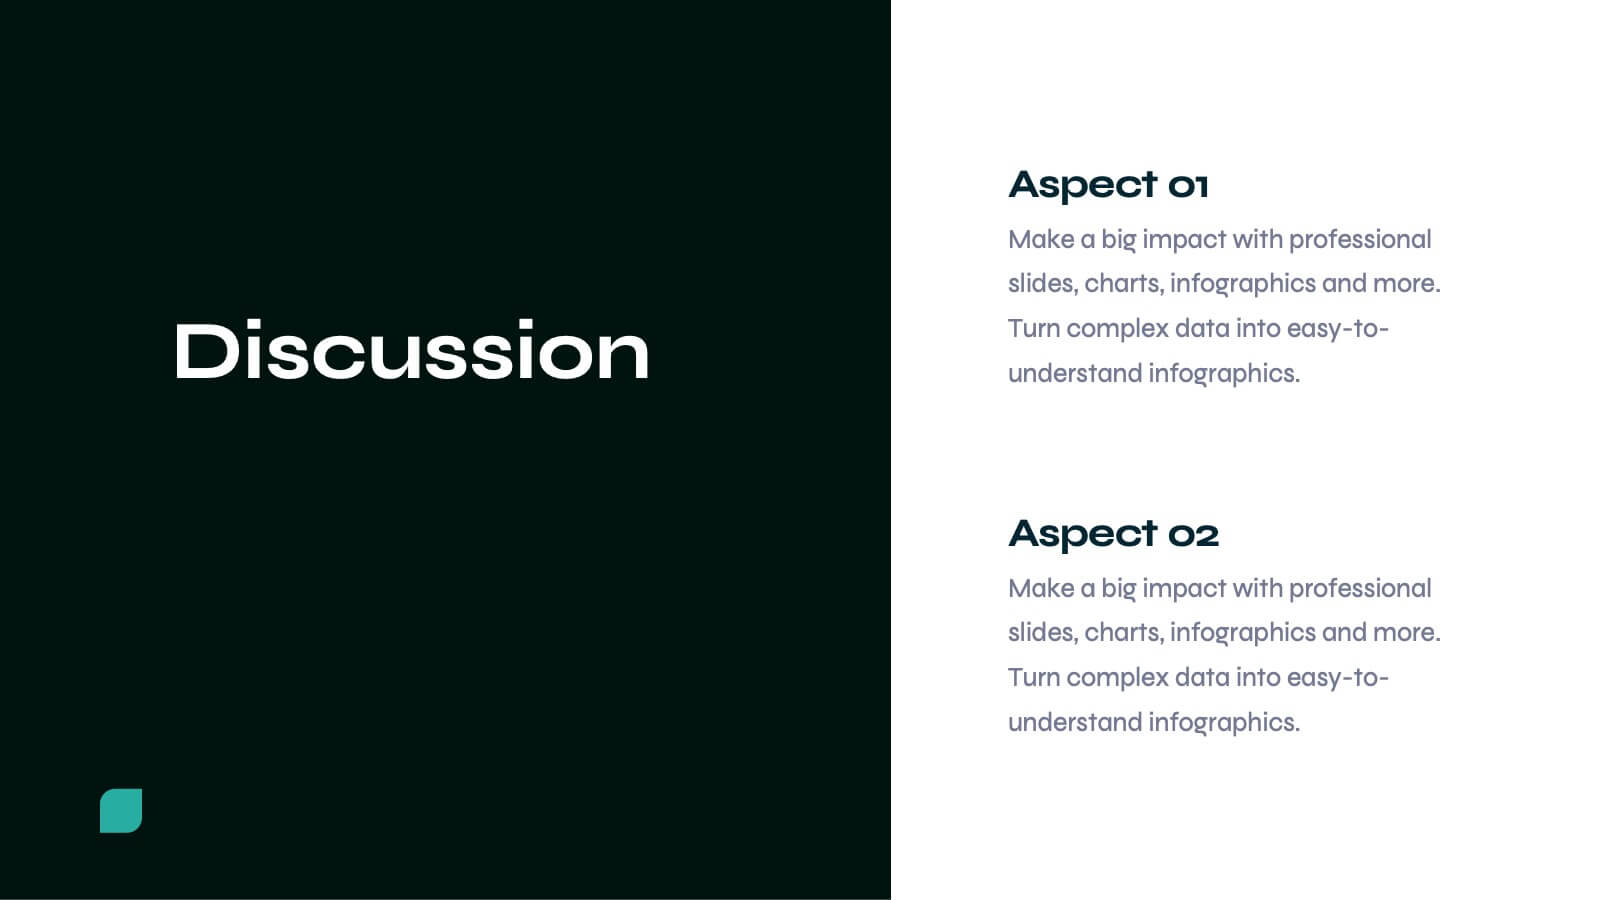
Lucidia Market Research Presentation
Deliver insightful market research findings with this modern and structured template. It covers key areas such as data analysis, consumer insights, research methodologies, and future directions. Ideal for presenting to stakeholders or clients. Fully customizable for PowerPoint, Keynote, and Google Slides.


6 diapositivas
Risk Management Strategies Infographic
Risk management is the process of identifying, assessing, prioritizing, and mitigating risks in order to minimize their impact on an organization's objectives and projects. This infographic template is designed to convey important information about identifying, assessing, and mitigating risks in various contexts. The icons and symbols are added to represent different stages of risk management, such as identification, assessment, mitigation, and monitoring. This Infographic can effectively communicate the importance of risk management and provide insights into the strategies used to mitigate potential risks in various contexts.


6 diapositivas
Orientation Plan for New Employees Presentation
Welcome your new team members with confidence using a visually clear, step-based layout that streamlines the introduction process. This presentation helps HR leaders outline company values, roles, and expectations with ease and professionalism. Fully compatible with PowerPoint, Keynote, and Google Slides for effortless editing and presentation across any platform.


4 diapositivas
ABC Learning Slide Deck Presentation
Kickstart your ideas with a playful, rocket-shaped layout that turns simple ABC steps into a clear, engaging story. This presentation helps break down processes, lessons, or concepts in a way that feels intuitive and dynamic. Fully customizable and compatible with PowerPoint, Keynote, and Google Slides.


5 diapositivas
Sports Legends Infographics
Sport Legends play a significant role in inspiring and motivating aspiring athletes to achieve their goals. These Infographics can provide an educational and visually appealing way to showcase the accomplishments and achievements of some of the greatest athletes in history. These infographics can highlight specific individuals, teams, or eras, and can include statistics, records, awards, and other notable accomplishments. All the design elements are customizable and can include illustrations of the athletes, logos or team colors, and text boxes to highlight statistics and provide additional information.


18 diapositivas
Pinnacle Academic Research Report Presentation
Present your academic research with style and precision using this comprehensive template. It covers everything from research objectives to key findings and recommendations. Perfect for making your data clear and engaging. Compatible with PowerPoint, Keynote, and Google Slides, it ensures your research is presented professionally and effectively.


5 diapositivas
Insurance Risk Management Presentation
Make complex risk strategies easy to understand with this clean and professional presentation design. Perfect for explaining insurance coverage, threat assessment, or business protection plans, it blends clear visuals with modern design elements. Fully editable and compatible with PowerPoint, Keynote, and Google Slides for effortless customization and presentation.


21 diapositivas
Alchemos UX Case Study Presentation
Showcase your UX process with clarity and impact using this sleek case study presentation. Covering key aspects like user research, interaction design, prototyping, and responsive design, this template helps you tell a compelling design story. Fully customizable and compatible with PowerPoint, Keynote, and Google Slides for a seamless presentation experience.


8 diapositivas
Product Development and Innovation
Break down your product journey with this modern step-by-step infographic. Ideal for startups, product managers, and innovation teams, this slide illustrates four stages—perfect for visualizing design thinking, MVP rollouts, or feature planning. Easily editable in PowerPoint, Keynote, and Google Slides.


7 diapositivas
Tree Diagrams Infographics Presentation Template
Tree diagrams are visual diagrams of different outcomes that can result when you take a certain action. They can be used to depict the various possible outcomes of an event or problem, helping you understand your options and choose the best one for a given purpose. They can be used to show statistical probabilities, or general issues that result in many possible ways of moving forward. Use this template to create your own tree diagram, as a new business planning tool to develop goals and objectives. This tree diagram template can help you visualize any project, large or small.


10 diapositivas
Work Schedule and Task Management Presentation
Enhance your project management with the Work Schedule and Task Management template, expertly designed to organize and visualize tasks efficiently, ensuring productivity and clarity in your workflow. It features distinct icons and color-coded stages to delineate project phases, ideal for tracking progress and ensuring team alignment. This versatile template is compatible with PowerPoint, Keynote, and Google Slides, allowing for seamless integration into any presentation workflow.


6 diapositivas
Digital Education and E-Learning Trends Presentation
Present modern educational insights with clarity using this well-structured slide focused on digital learning trends. Featuring an icon-based circular layout around a graduate figure and six editable titles, it's ideal for showcasing online learning strategies, tech tools, and training programs. Designed to keep your content concise and visually engaging, this layout is perfect for educators, institutions, and e-learning professionals. Fully customizable in PowerPoint, Keynote, and Google Slides.


8 diapositivas
Health and Safety Training
Create impactful safety briefings with this visual slide designed around a caution-sign layout. Perfect for outlining training modules, compliance steps, or workplace hazard procedures, it presents four key points using icons and color-coded elements. Fully customizable in PowerPoint, Keynote, and Google Slides.