


Características


¿Tienes alguna pregunta?
Recomendar


4 diapositivas
Leadership Training Framework Presentation
Inspire growth and guide your team toward success with this clear and modern presentation layout. Designed to illustrate leadership principles, development stages, and coaching strategies, it helps communicate training goals with professionalism and ease. Fully customizable and compatible with PowerPoint, Keynote, and Google Slides for seamless use across platforms.


10 diapositivas
National Distribution Network in the US Presentation
Present your logistics strategy with clarity using the National Distribution Network in the US Presentation. This slide visually maps out your key distribution hubs across the country, pairing each location with a numbered label and space for insights or logistics data. Ideal for supply chain overviews, retail operations, or partner briefings. Fully editable in Canva, PowerPoint, and Google Slides.


6 diapositivas
IT Security Policy Presentation
A bold, clean layout brings your message to life with clarity and confidence. This presentation helps you outline essential guidelines, communicate security expectations, and explain key protective measures in a way your audience can easily follow. Designed for professionalism and simplicity, it works seamlessly in PowerPoint, Keynote, and Google Slides.


5 diapositivas
End-to-End Process Flow Framework Presentation
Visualize your operations from start to finish with the End-to-End Process Flow Framework Presentation. This clean, arrow-based layout is perfect for outlining workflows, project stages, or business processes step by step. Fully customizable in Canva, PowerPoint, and Google Slides to suit any team or strategic need.


10 diapositivas
Cloud Computing IT Architecture
Showcase your cloud infrastructure with this layered circular diagram designed to highlight core services, storage, and computing components. Ideal for IT teams, SaaS providers, or tech consultants, these slides simplify complex cloud systems into 5 customizable sections. Fully editable in PowerPoint, Keynote, and Google Slides.


4 diapositivas
Problem Tracing with Fishbone Diagram Presentation
Identify root causes clearly with the Problem Tracing with Fishbone Diagram Presentation. This template features a horizontal, fish-shaped layout with six categories represented in vertical columns, helping you trace issues back to their source. Ideal for quality control, brainstorming, and strategic reviews. Fully editable in PowerPoint, Keynote, and Google Slides.


5 diapositivas
Business Goals Roadmap Presentation
Bring your long-term vision to life with a clear, structured roadmap that highlights each milestone in your business journey. This presentation helps you outline key objectives, track progress, and communicate strategic priorities with ease. Ideal for planning, strategy, and growth discussions. Fully compatible with PowerPoint, Keynote, and Google Slides.


5 diapositivas
Colorful Circular Flow Chart Presentation
Bring your ideas full circle with a vibrant, energetic flow that instantly grabs attention and makes complex processes feel effortless to follow. This presentation is perfect for illustrating cycles, workflows, or interconnected stages in a clear, dynamic way. Fully compatible with PowerPoint, Keynote, and Google Slides.


10 diapositivas
Human Resources Process Diagram
The "Human Resources Process Diagram" presentation template is designed to streamline the visualization of the HR process from analysis to evaluation. This template allows for a detailed display of the stages involved in HR processes, such as analyzing, designing, developing, implementing, and evaluating, making it ideal for training sessions, strategic HR presentations, and management meetings. The circular flow of the diagram emphasizes the continuous and interconnected nature of HR activities, facilitating better understanding and communication of complex processes. Each segment is color-coded for easy identification and reference, enhancing both the aesthetic appeal and the functionality of the presentation.


10 diapositivas
Logistics and Procurement Supply Chain
Streamline your supply chain narrative with this clean, visual timeline layout. Perfect for operations managers, logistics planners, or procurement leads, this slide breaks down each stage of the supply chain process with color-coded segments and intuitive icons. Fully editable in PowerPoint, Keynote, and Google Slides.


7 diapositivas
Relationship Connectivity Infographic
The Relationship Connectivity Infographic provides a structured visualization to represent the interconnectedness of various elements within a system or project. This graphic organizes components into a cohesive layout that highlights how each part is related to and impacts the others. Ideal for demonstrating the complex synergy between different departments, phases of a project, or any scenario requiring a clear display of relationships, this infographic serves as an essential tool for planners, educators, and managers. It is designed to be user-friendly and is compatible with a range of platforms, including PowerPoint, Google Slides, and Keynote, making it easily customizable.


10 diapositivas
Financial Money Management Strategies Presentation
Break down your key financial strategies with this clear, wheel-style diagram. Perfect for outlining budgeting principles, savings goals, or investment methods, each segment includes space for titles and concise text. Ideal for financial advisors, consultants, or internal team planning. Fully customizable in PowerPoint, Keynote, and Google Slides.


4 diapositivas
Sales and Reach Across Asia Map Presentation
Visualize your company’s market presence with the Sales and Reach Across Asia Map Presentation. Featuring clean markers, color-coded regions, and icon-labeled highlights, this template helps you clearly showcase key sales zones, distribution channels, or growth markets across Asia. Perfect for business reviews, expansion pitches, and performance updates. Fully editable in PowerPoint, Keynote, Google Slides, and Canva.


21 diapositivas
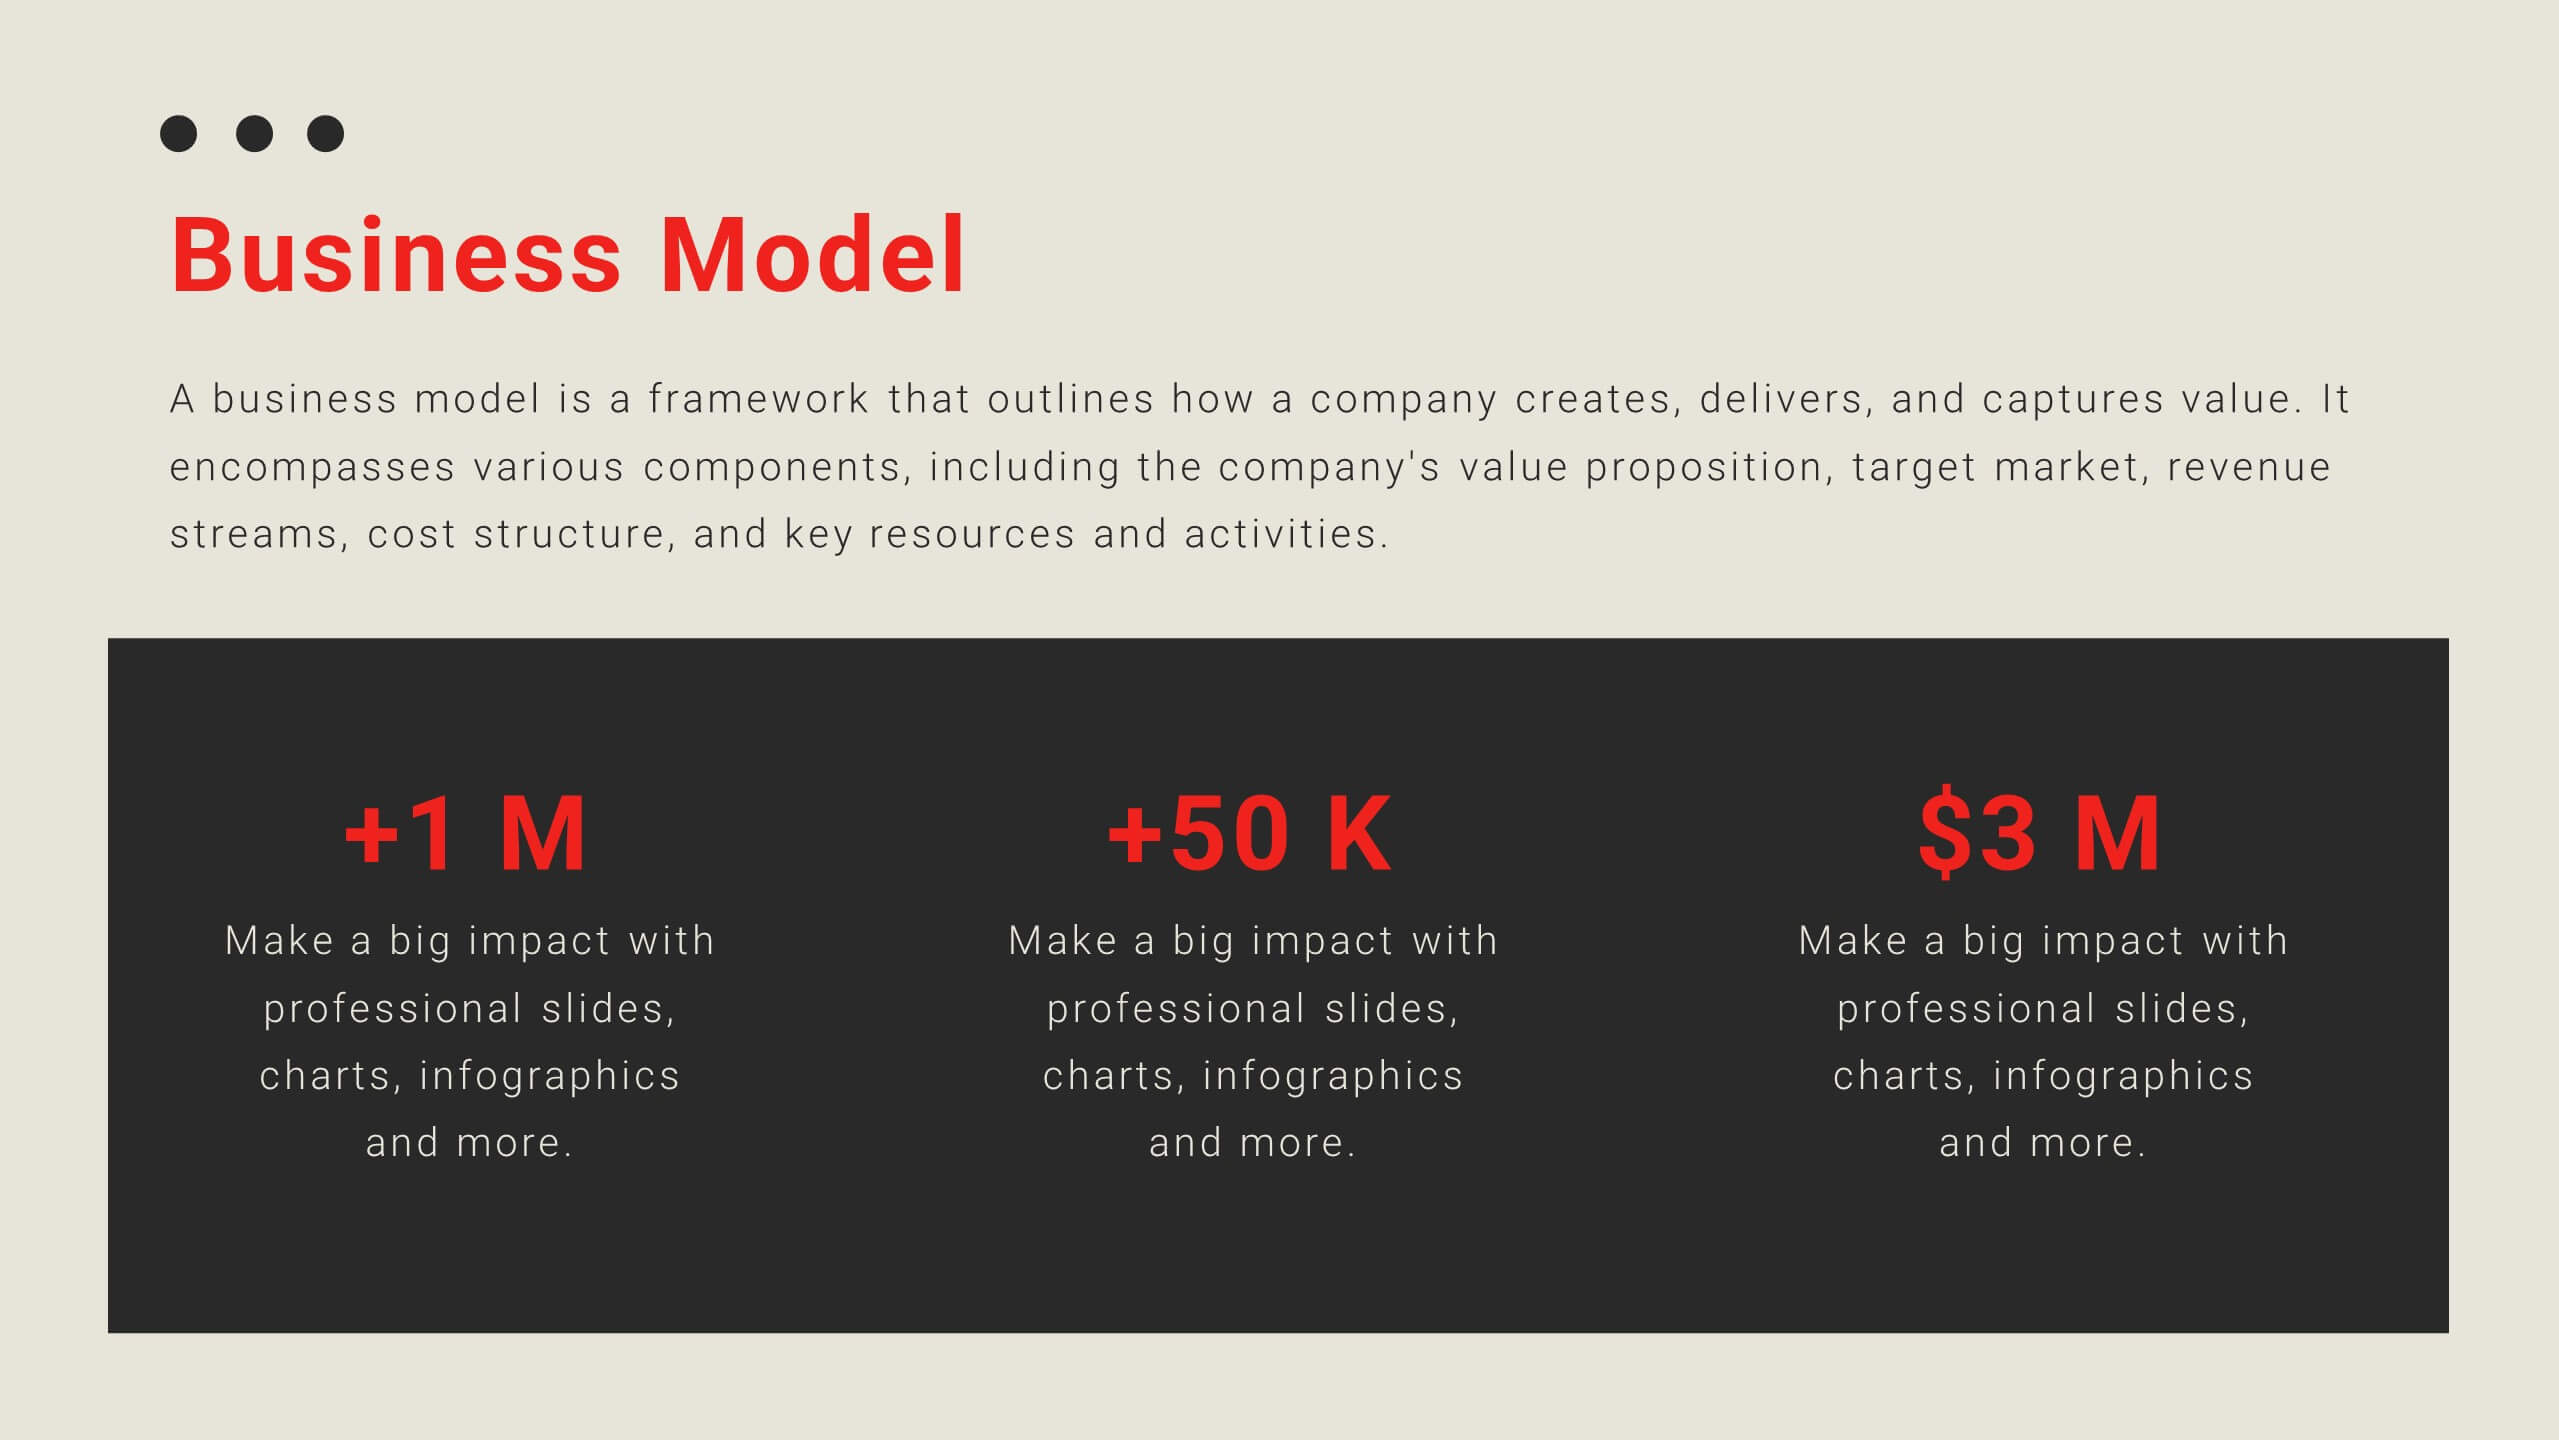
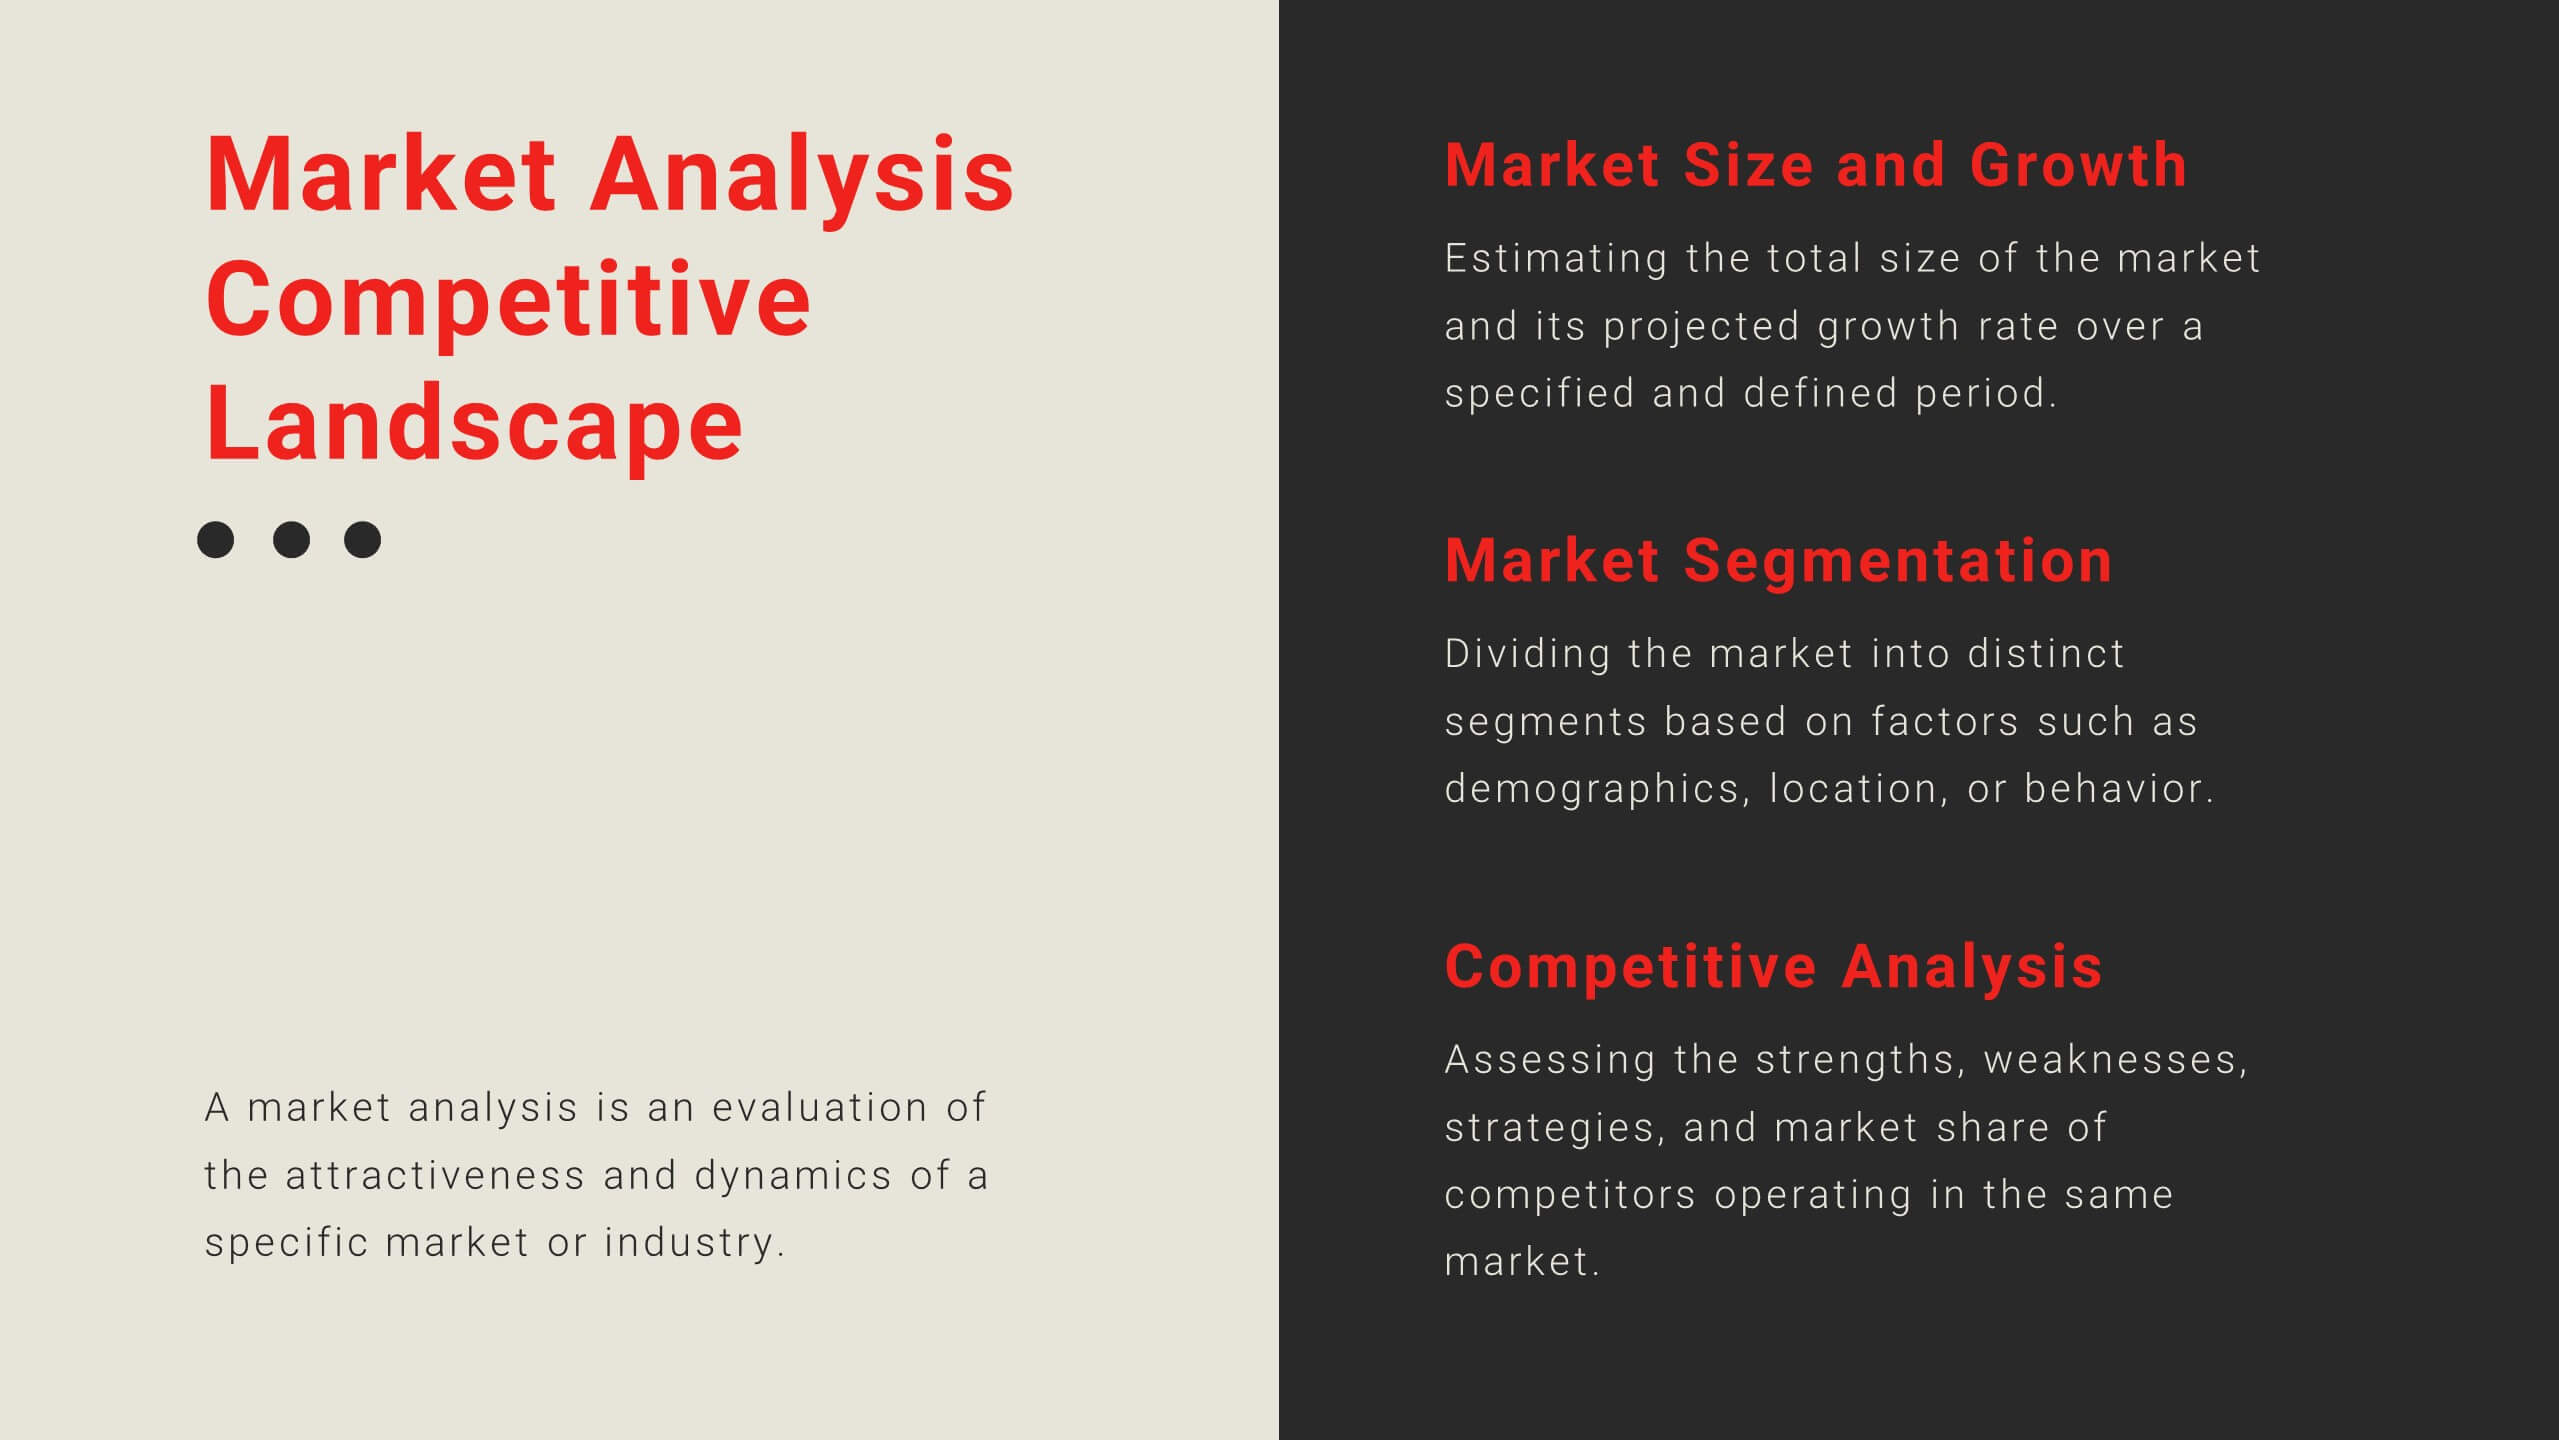
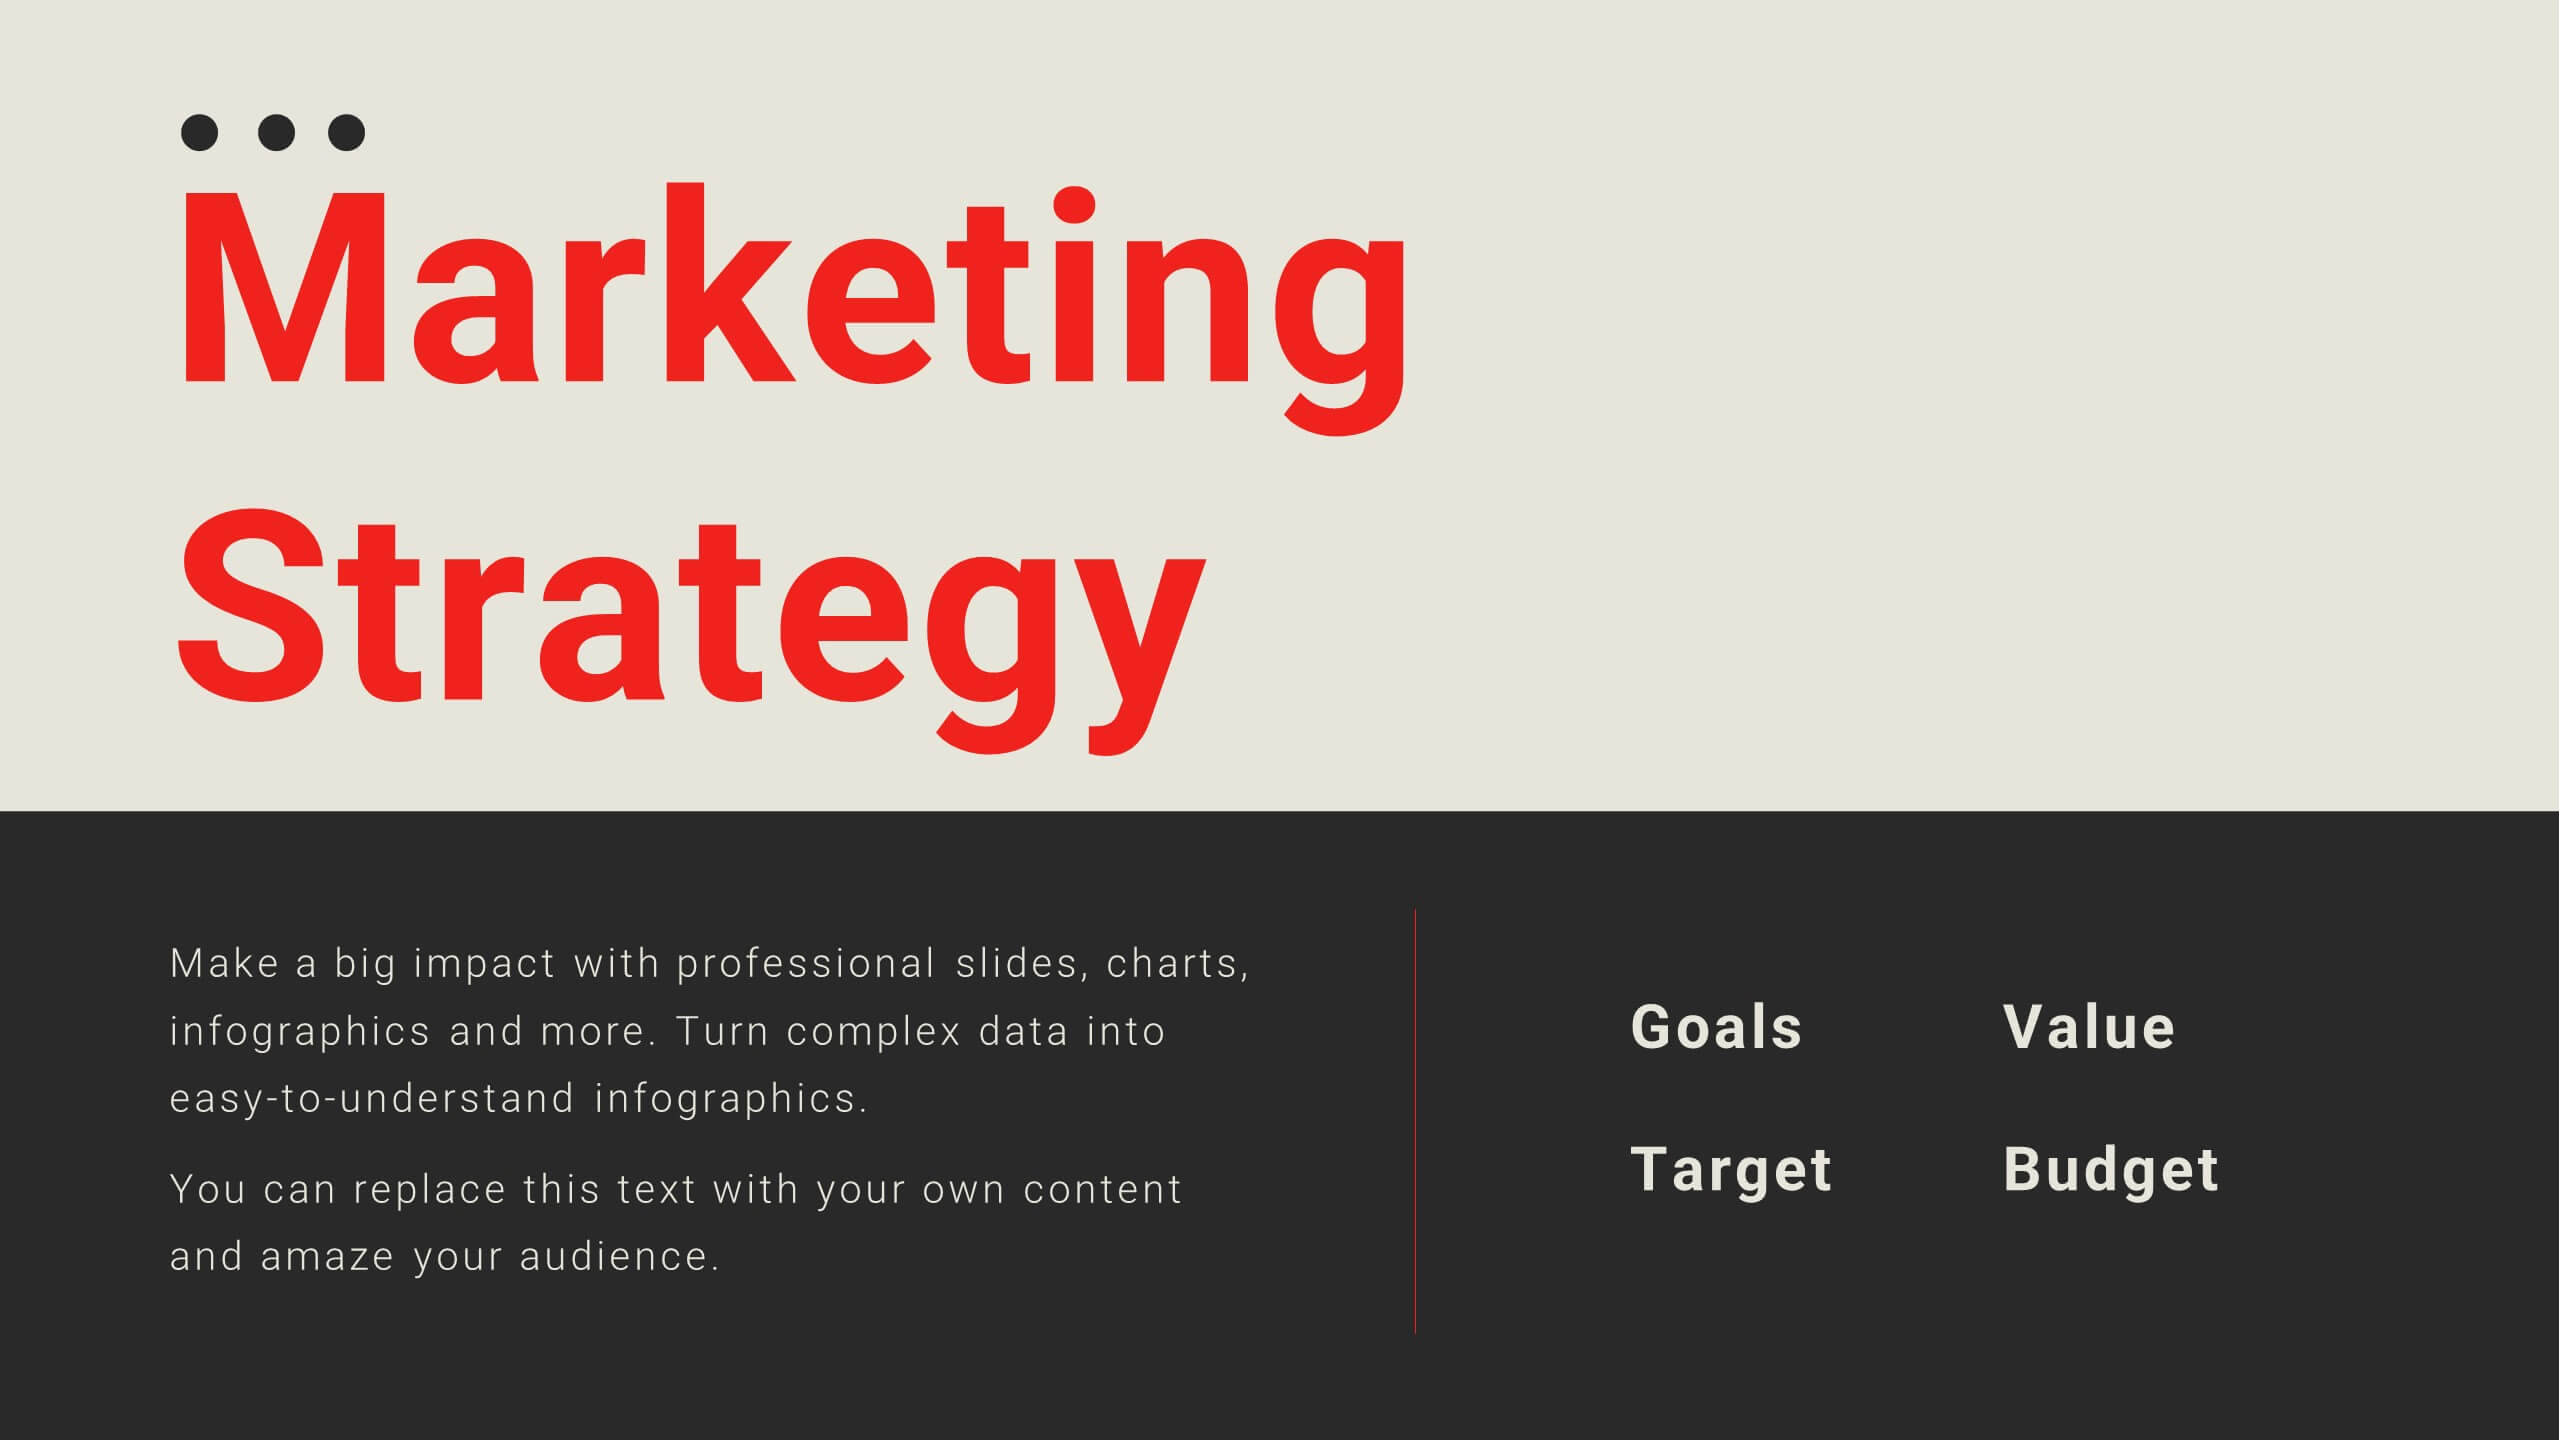
Velocity Startup Growth Plan Presentation
Accelerate your startup's growth with this dynamic plan template! Perfect for outlining your mission, vision, business model, and marketing strategy. Ideal for entrepreneurs aiming to secure funding and drive success. Compatible with PowerPoint, Keynote, and Google Slides, this template ensures your growth plan is clear, professional, and compelling. Achieve your startup goals today!


6 diapositivas
Environmental Services Infographic
The environment refers to the natural world and the surroundings in which living organisms exist. This infographic template highlights various aspects of environmental services and their importance in promoting sustainability and protecting the environment. The infographic utilizes visually appealing graphics, icons, and illustrations related to the environment, nature, and sustainability. These visuals capture viewers' attention and make the information more engaging. This infographic is designed to educate viewers on the different types of environmental services and their impact on environmental conservation and resource management.


2 diapositivas
Website UI Mockup Device Display Presentation
Showcase your website's interface with the Website UI Mockup Device Display slide. This professional and modern layout features a desktop screen to elegantly present your web design, user interface, or digital product. Perfect for designers, developers, and marketing presentations. Fully editable and compatible with PowerPoint, Keynote, and Google Slides.


7 diapositivas
Aviation School Infographic Presentation
If you're in search of striking visuals for your upcoming aviation school presentation, we've got just the solution for you. Our expertly crafted infographic template is designed to captivate and engage your audience, ensuring that your message is conveyed with maximum impact. Our template covers a diverse range of aviation topics, including airport and runway security. This guarantees that your information is presented in a clear, concise, and visually compelling manner. With our aviation infographic template, you'll be able to deliver an outstanding presentation that resonates with your audience and leaves a lasting impression.