


Características


¿Tienes alguna pregunta?
Recomendar


6 diapositivas
Environmental Scanning with PESTEL Model Presentation
Spot risks and opportunities early with the Environmental Scanning with PESTEL Model Presentation. Visually break down Political, Economic, Social, Technological, Environmental, and Legal factors using a modern, tree-style layout. Ideal for business forecasting, competitive analysis, or market entry reports. Easily customizable in PowerPoint, Canva, and Google Slides.


5 diapositivas
Agribusiness Market Strategy Overview
Showcase your market plan with the Agribusiness Market Strategy Overview Presentation. This engaging slide uses fresh produce illustrations to symbolize market growth, distribution, and agricultural planning. Perfect for farm business proposals, supply chain discussions, or food sector reports. Fully customizable and works seamlessly in PowerPoint, Keynote, and Google Slides.
7 diapositivas
Arrow Infographic Presentation Template
Arrow Infographics are a great tool to visualize changes, positioning and processes. You can use the arrows to show the direction of your startup or to explain the stages of a business plan. Present your strategies, stages, and plans in a clear & concise way. Use this arrow Infographic template to present complex topics. Arrows are great for highlighting the progress of a project and its relationship with other projects. Use this template to visualize the process of a business strategy. This Arrow Infographic Template gives you all the essentials you need when it comes to creating your own.


23 diapositivas
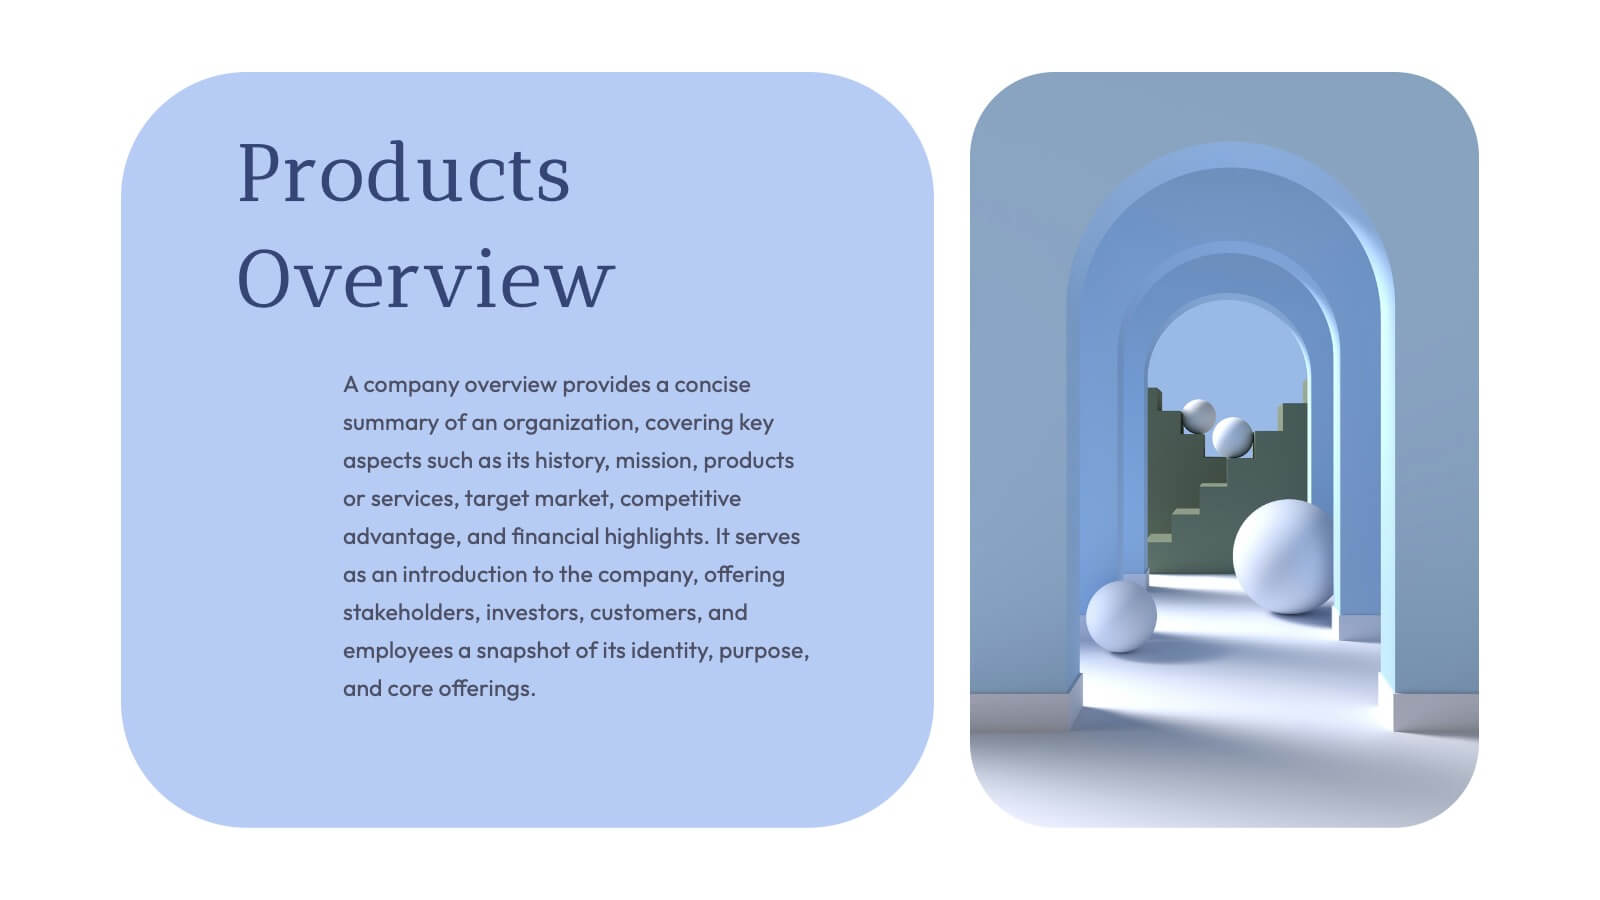
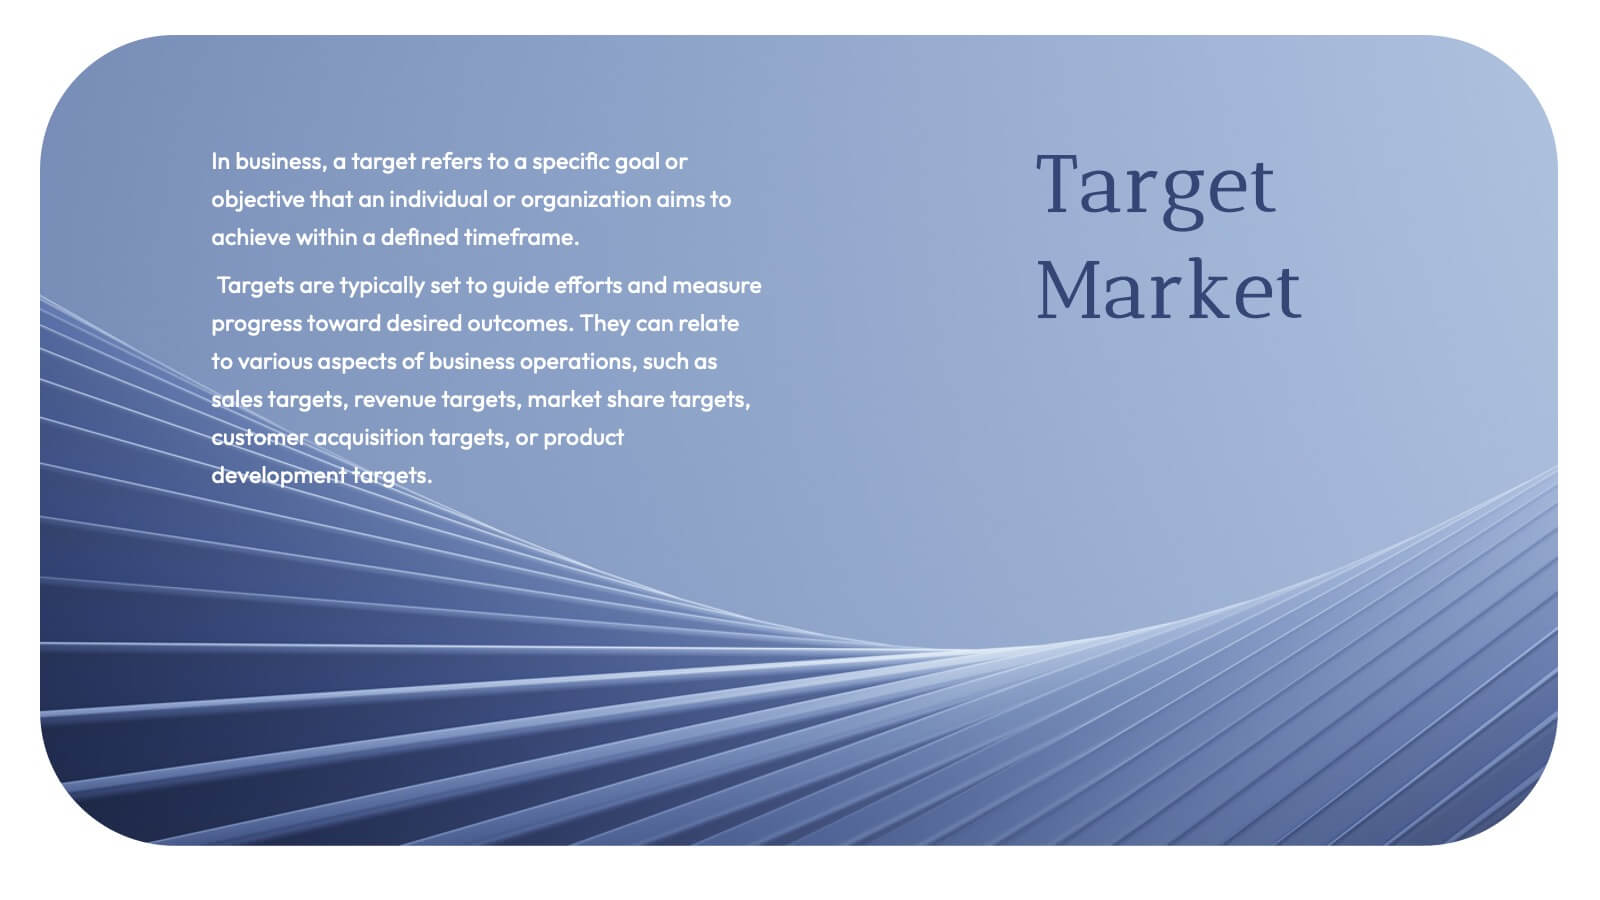
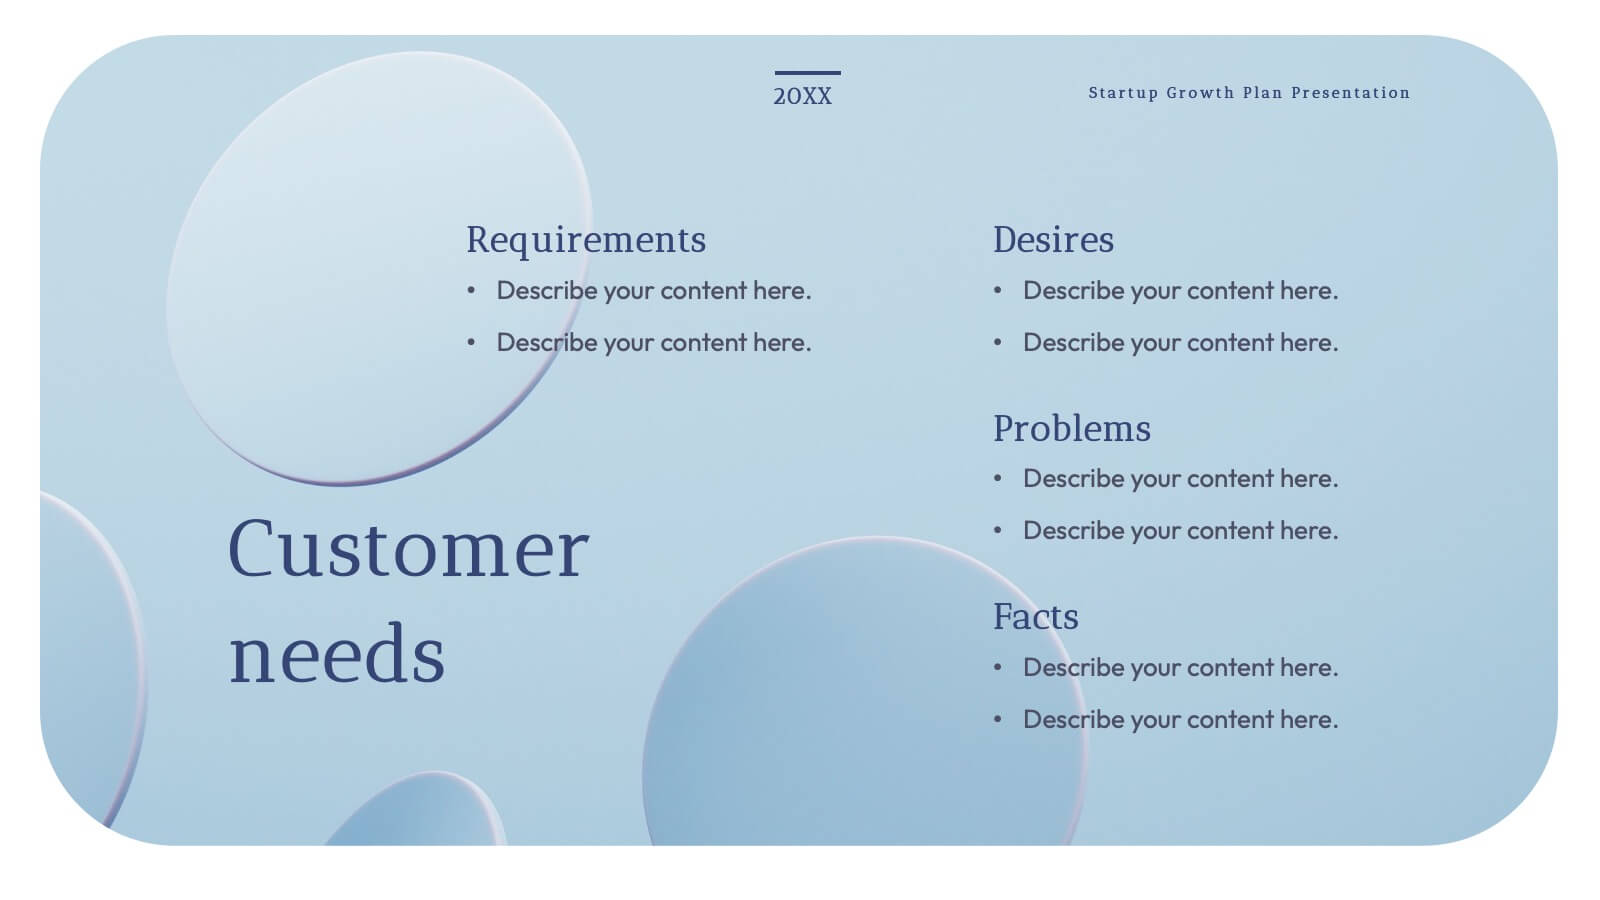
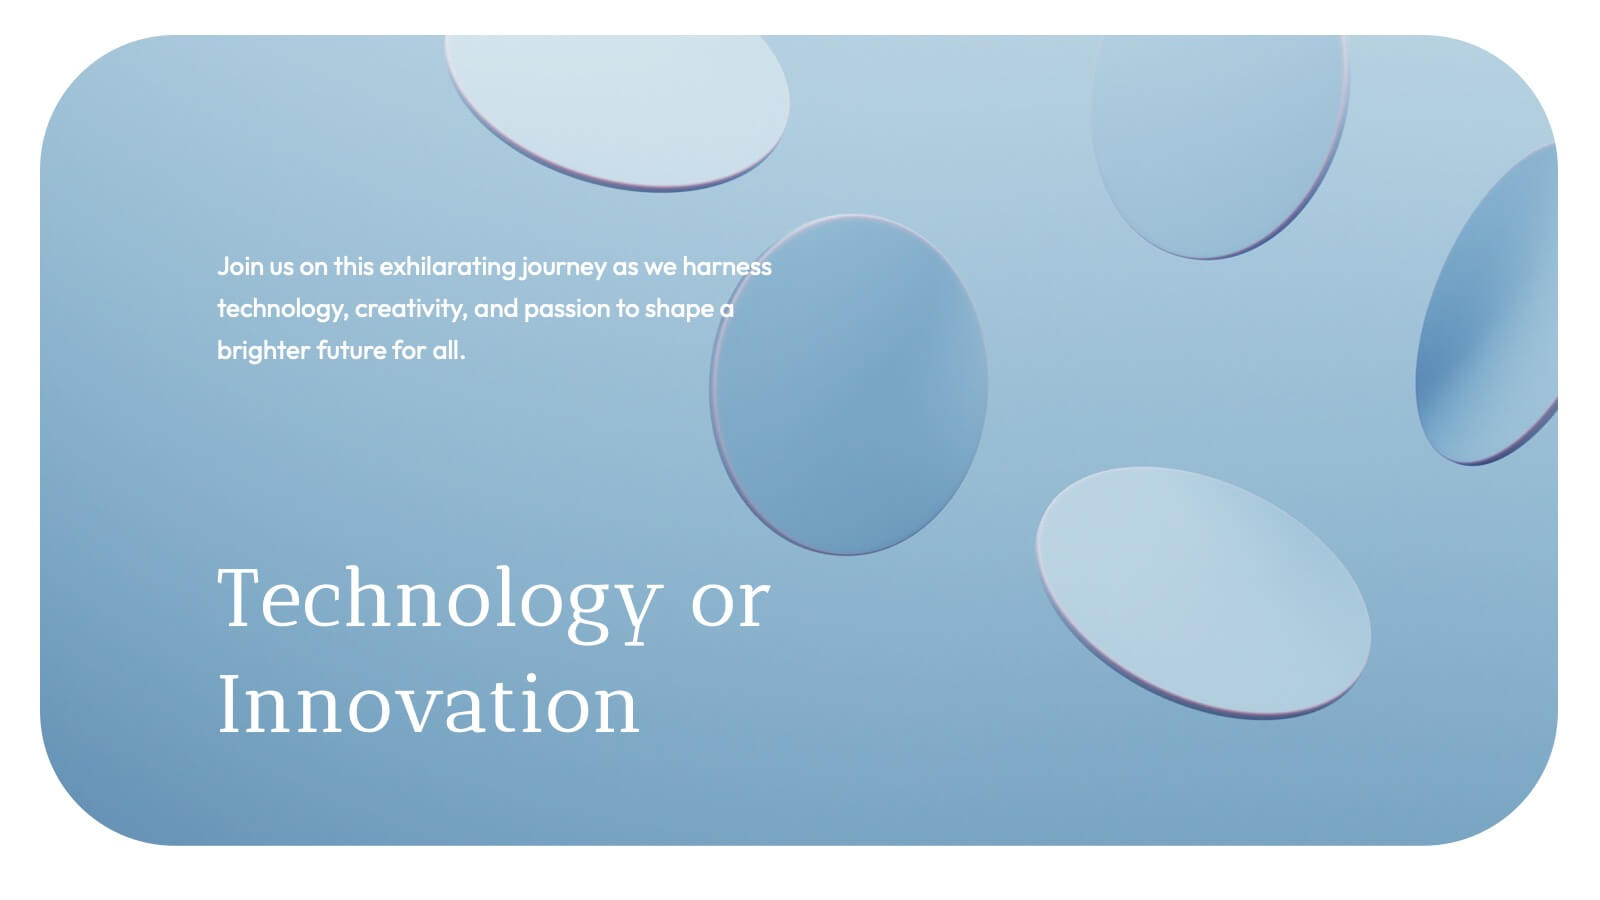
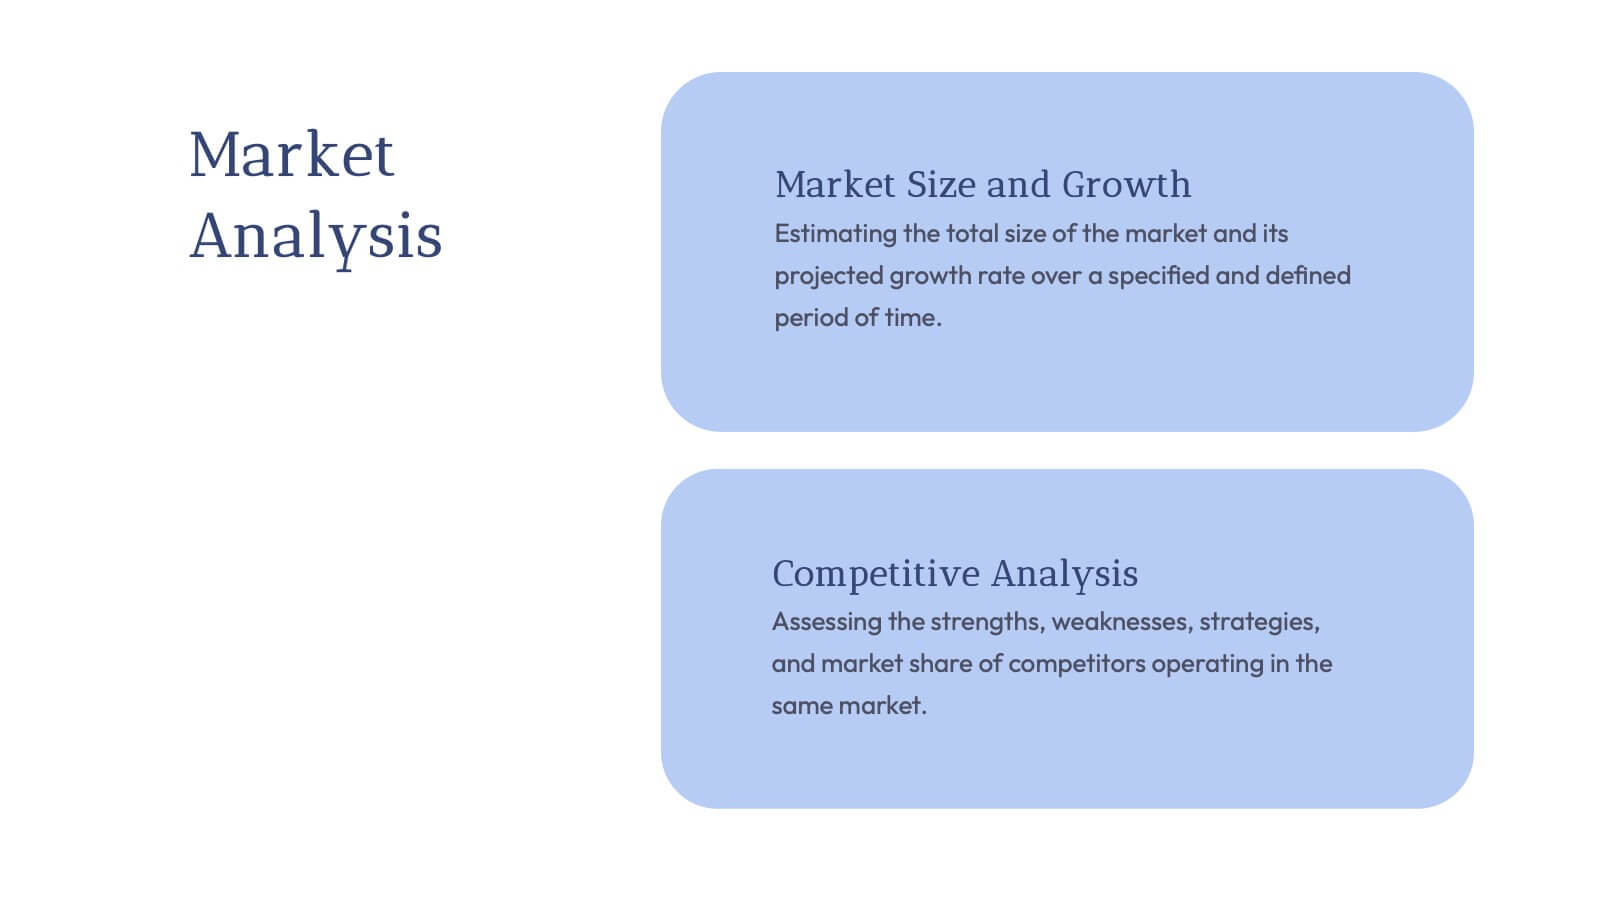
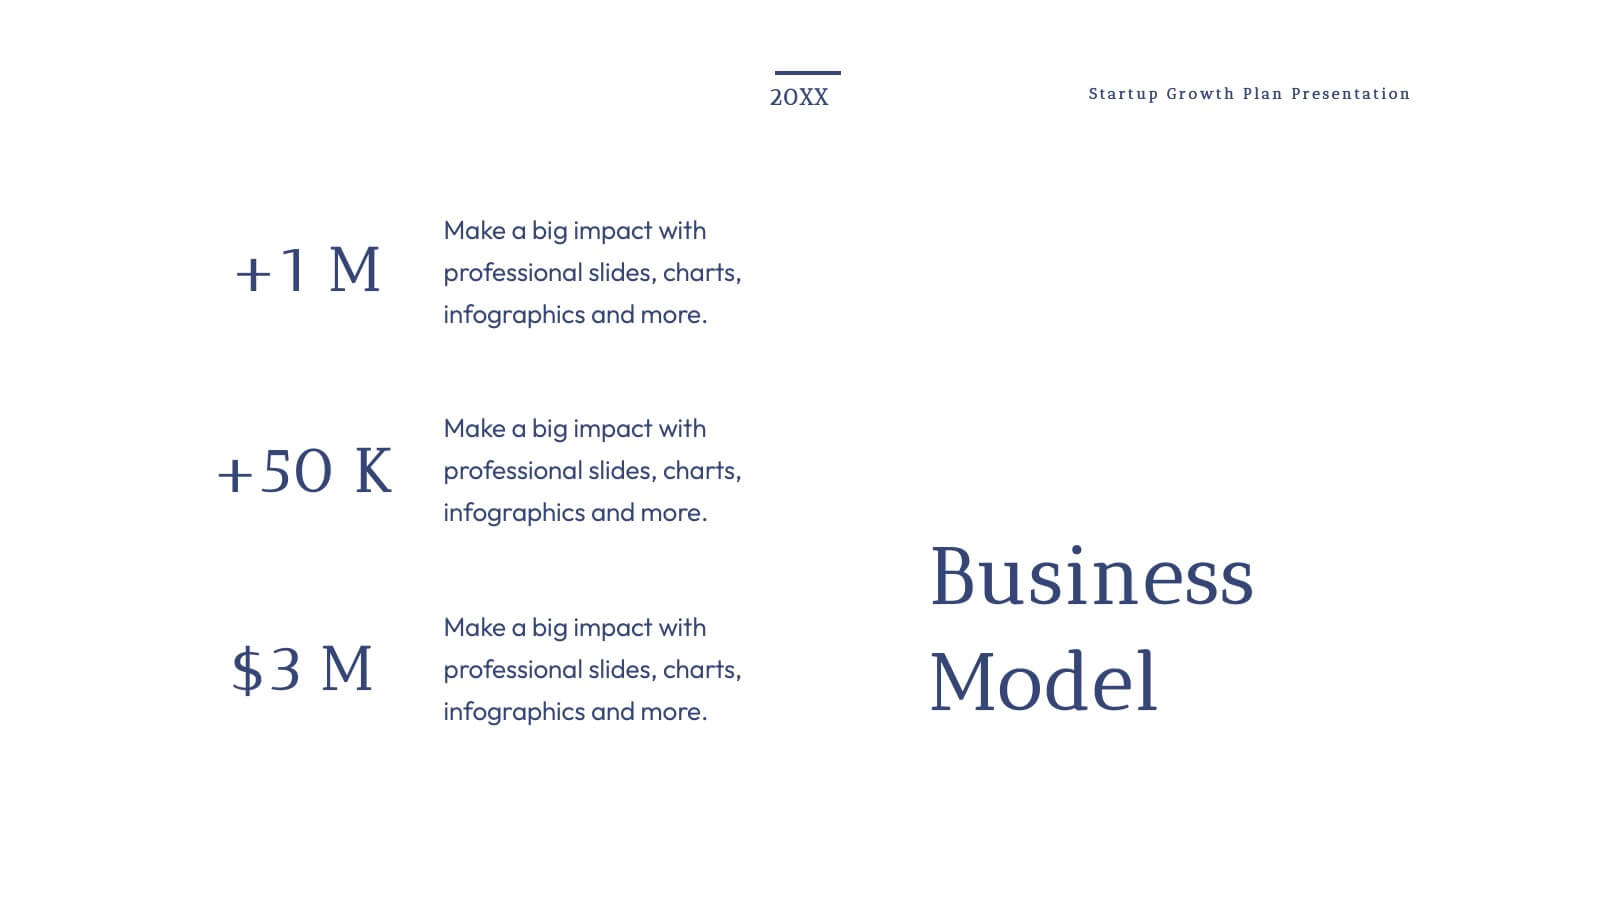
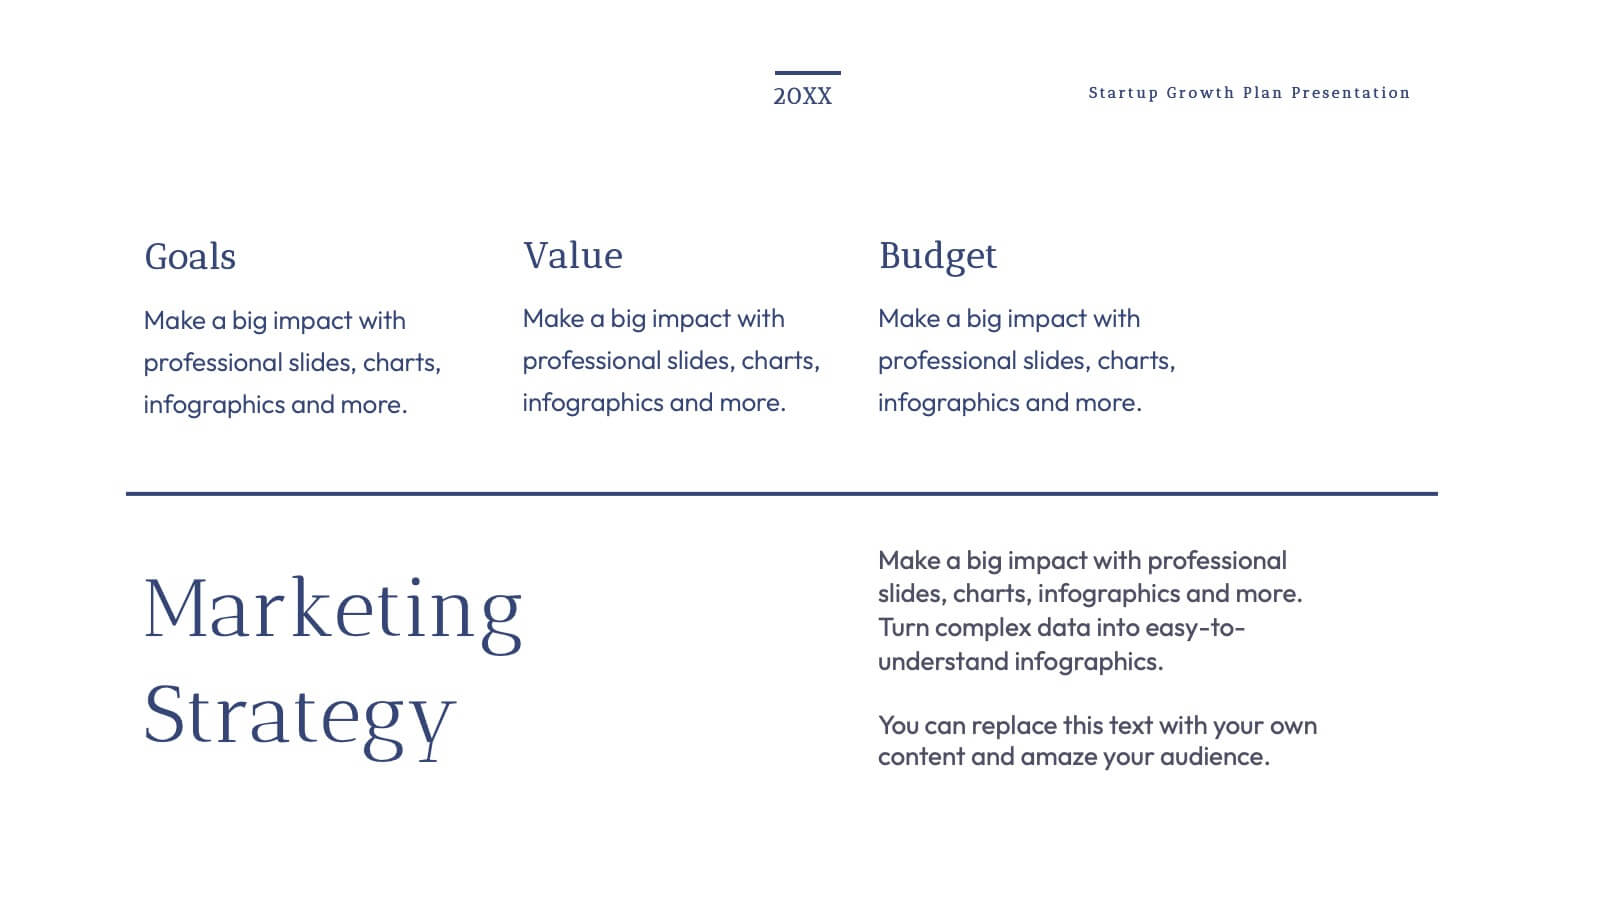
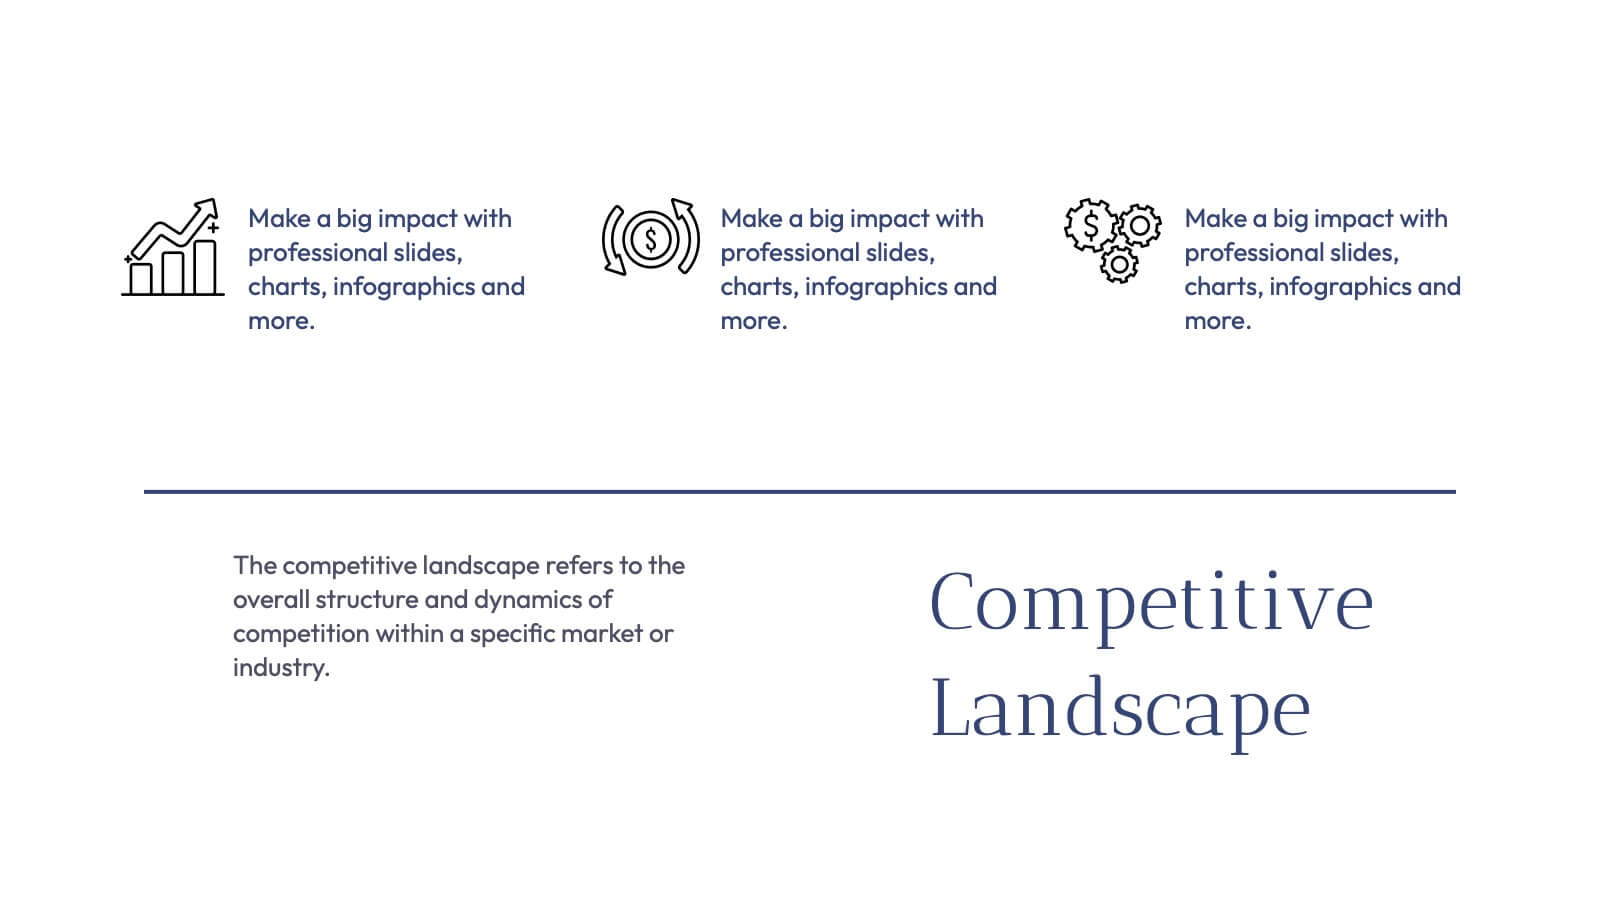
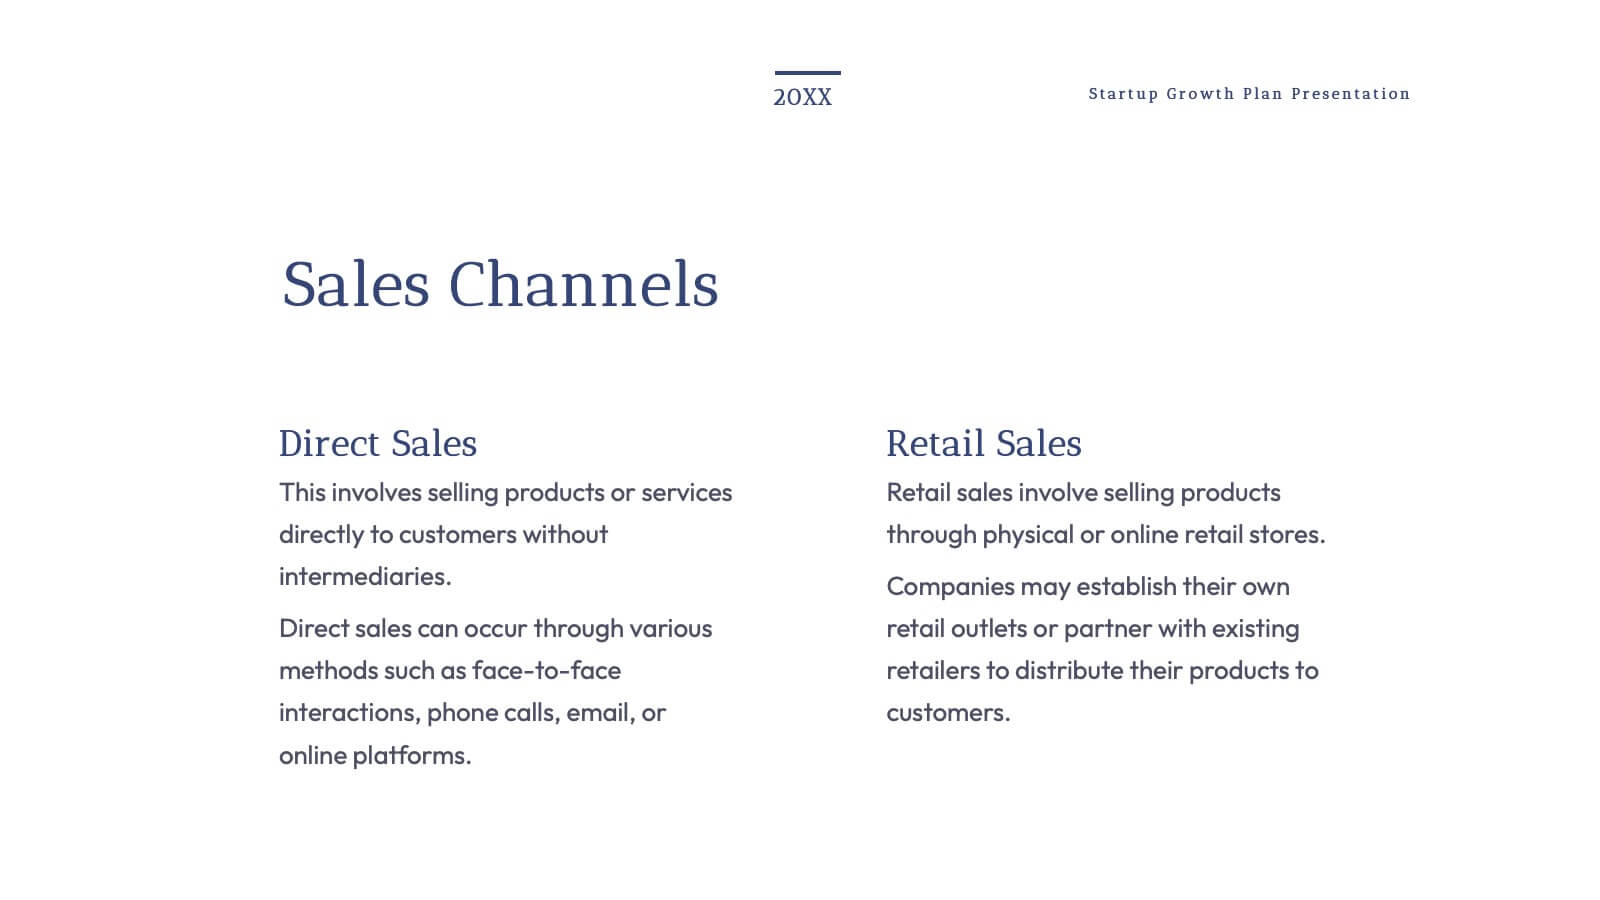
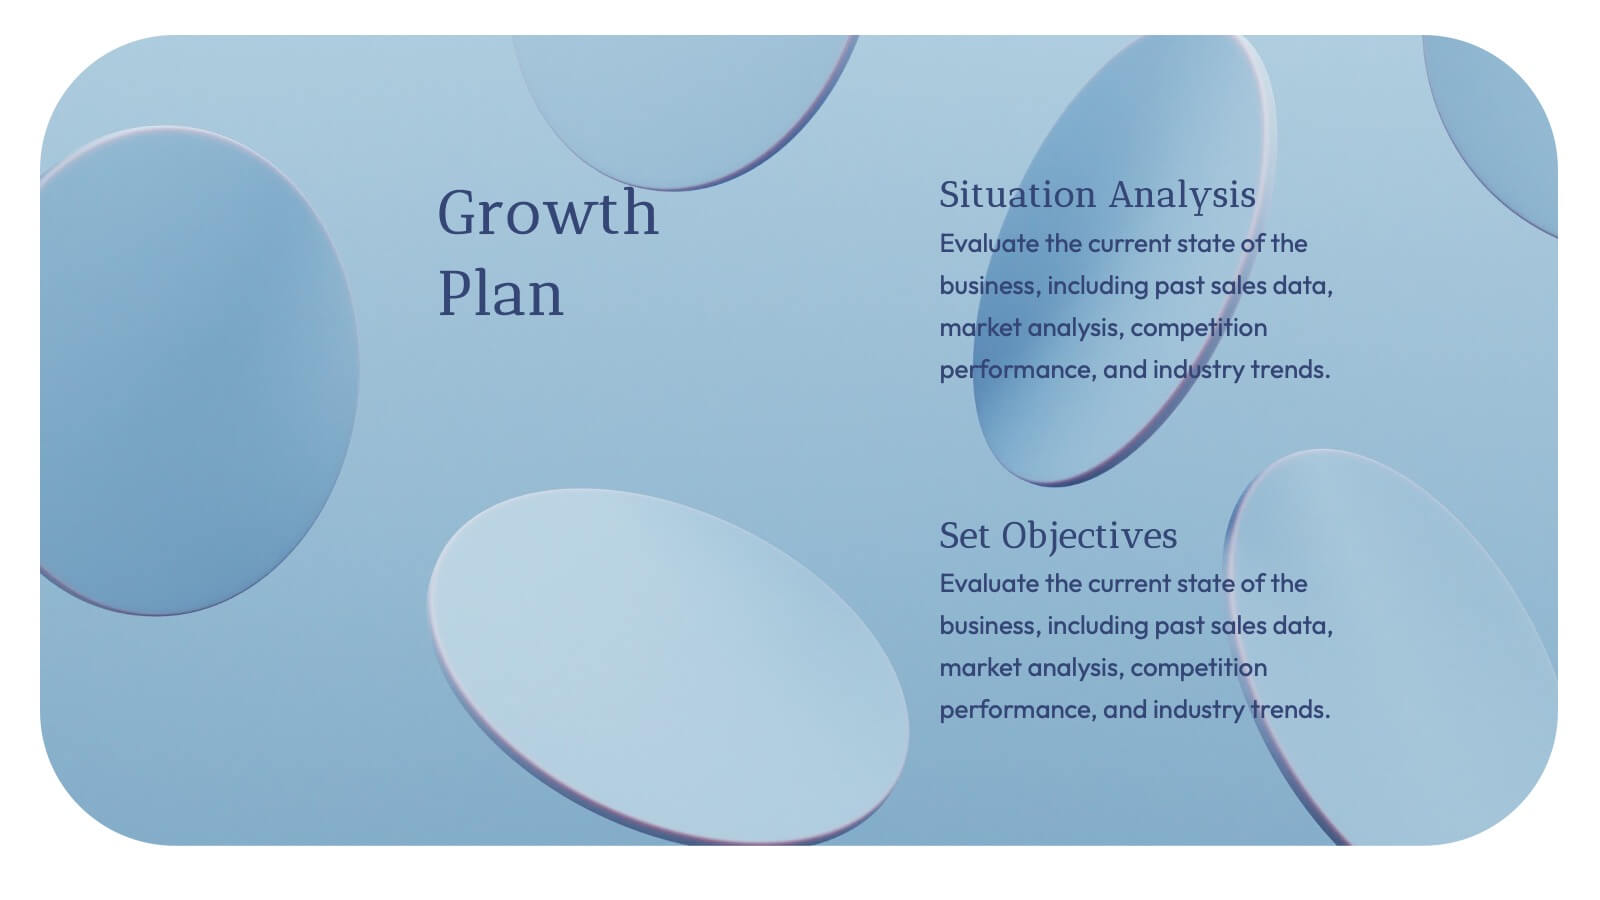
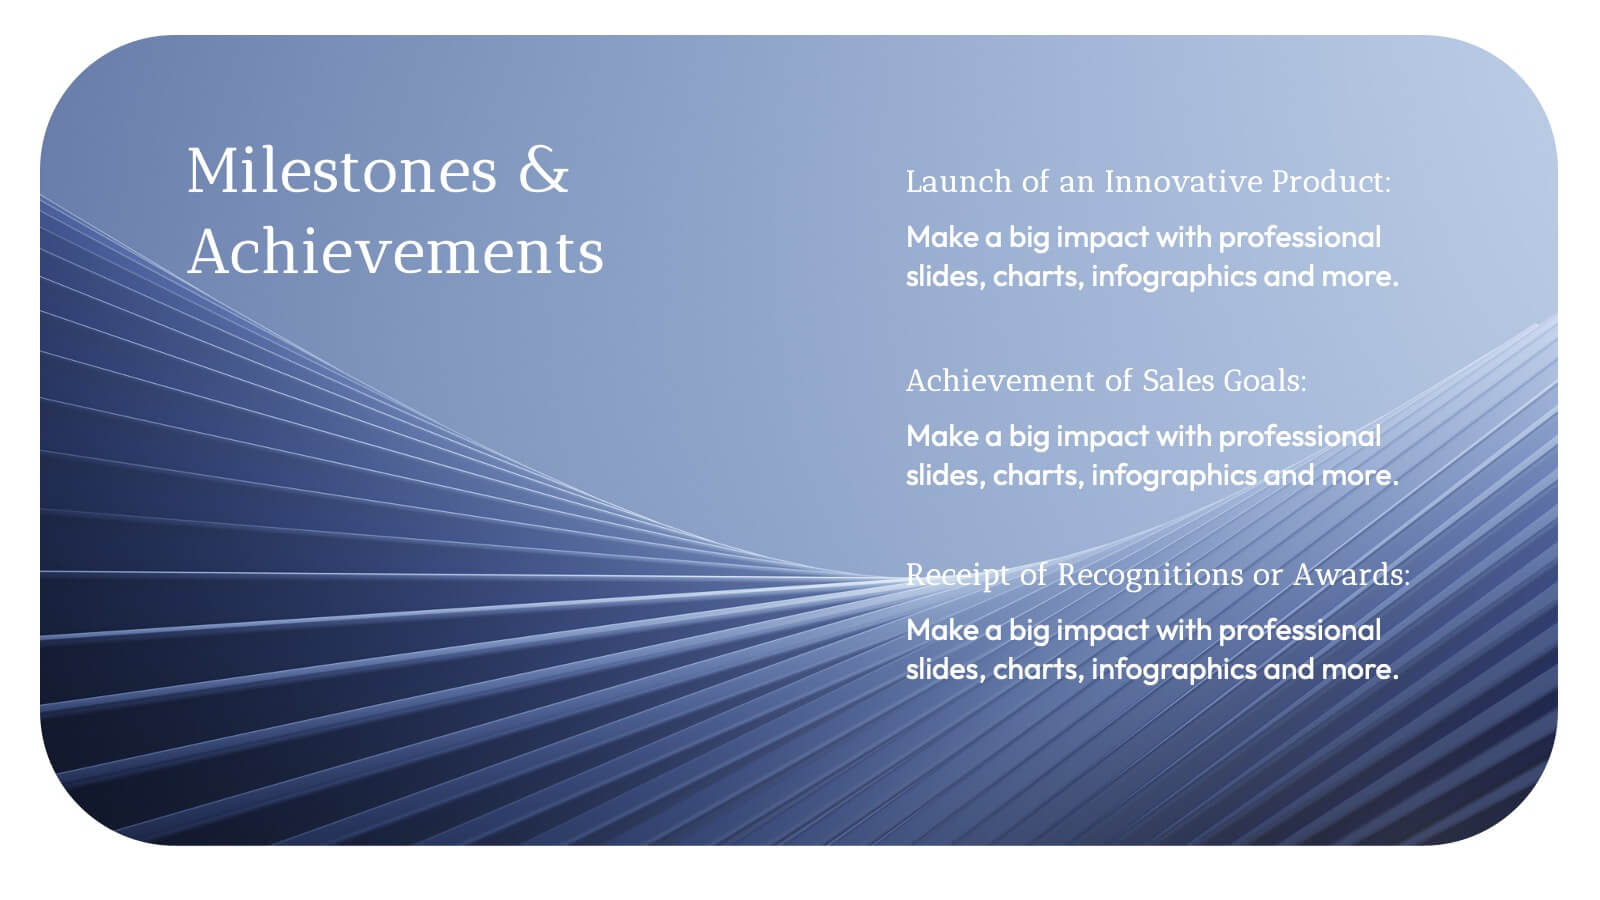
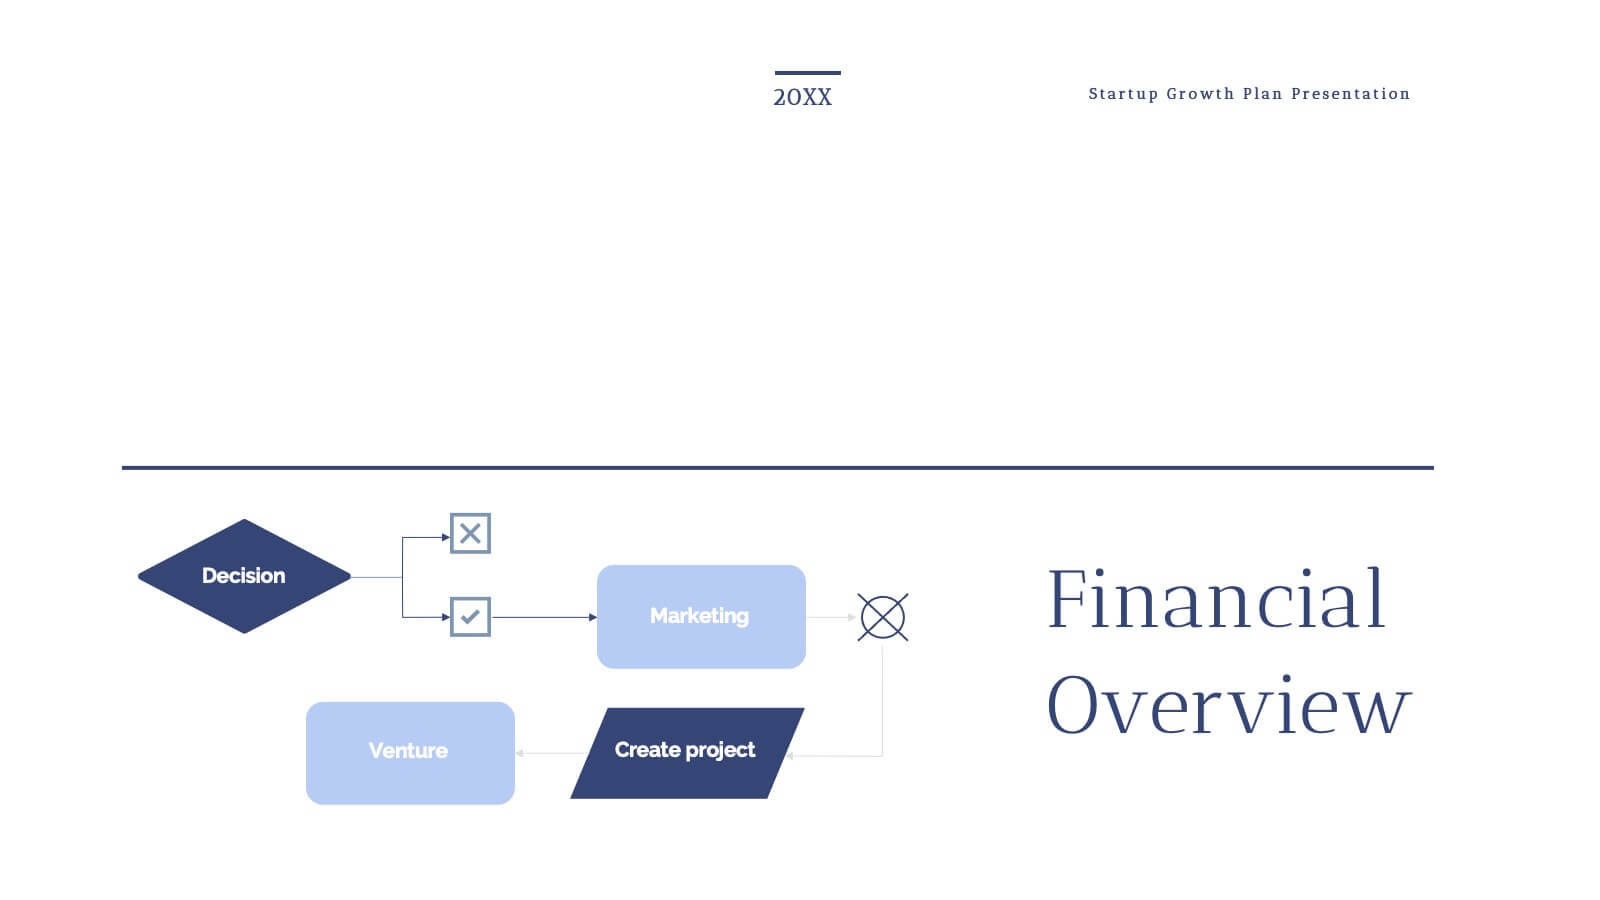
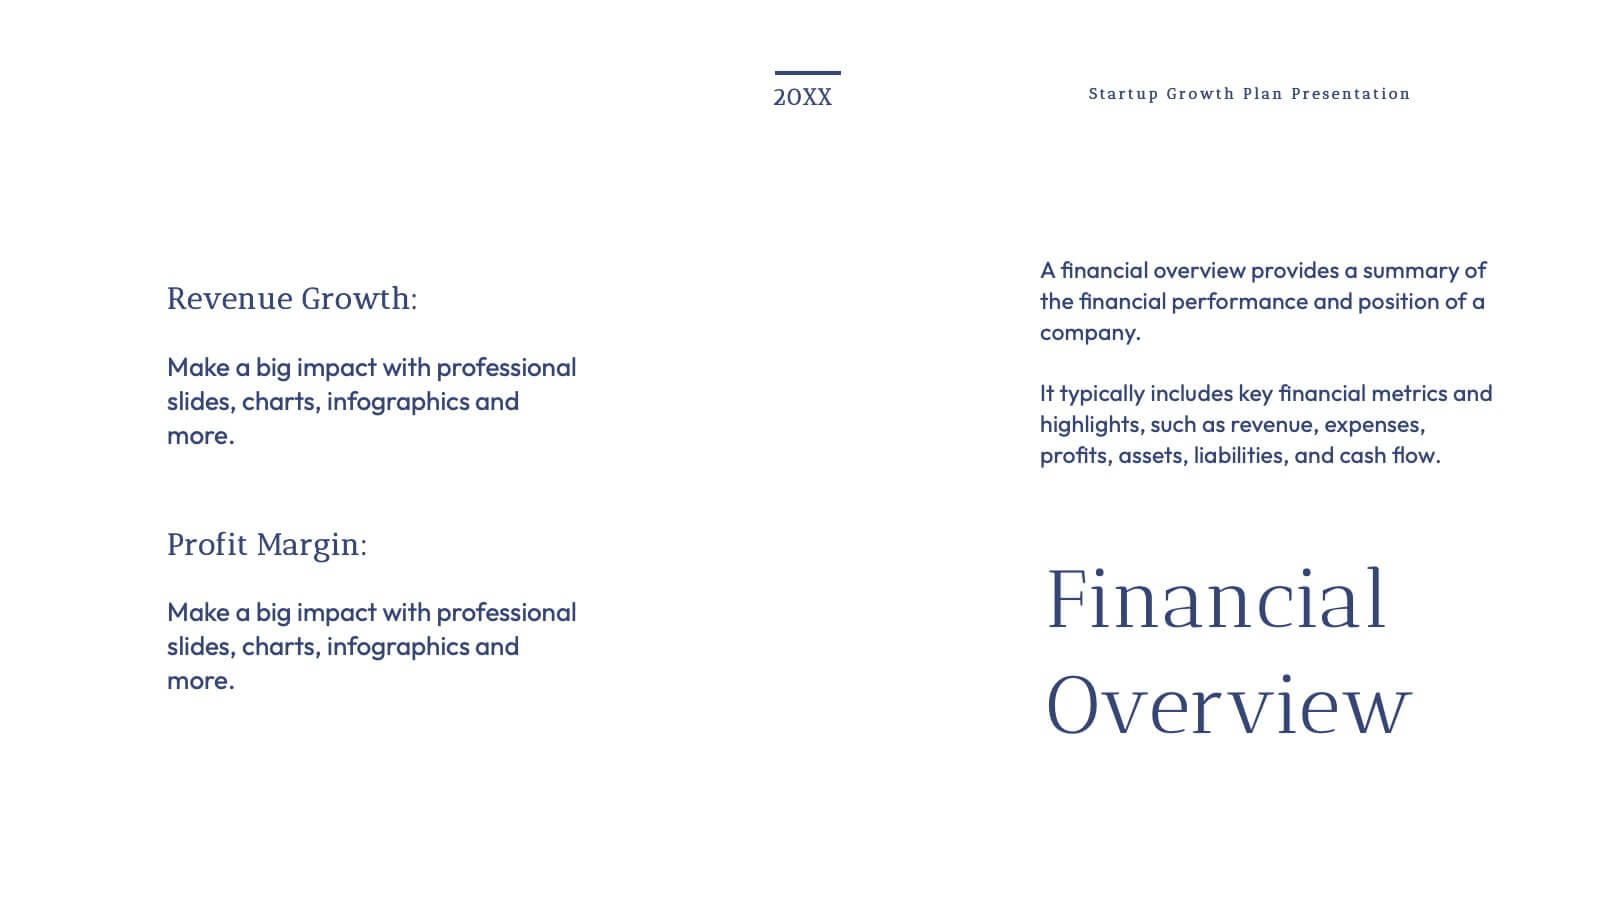
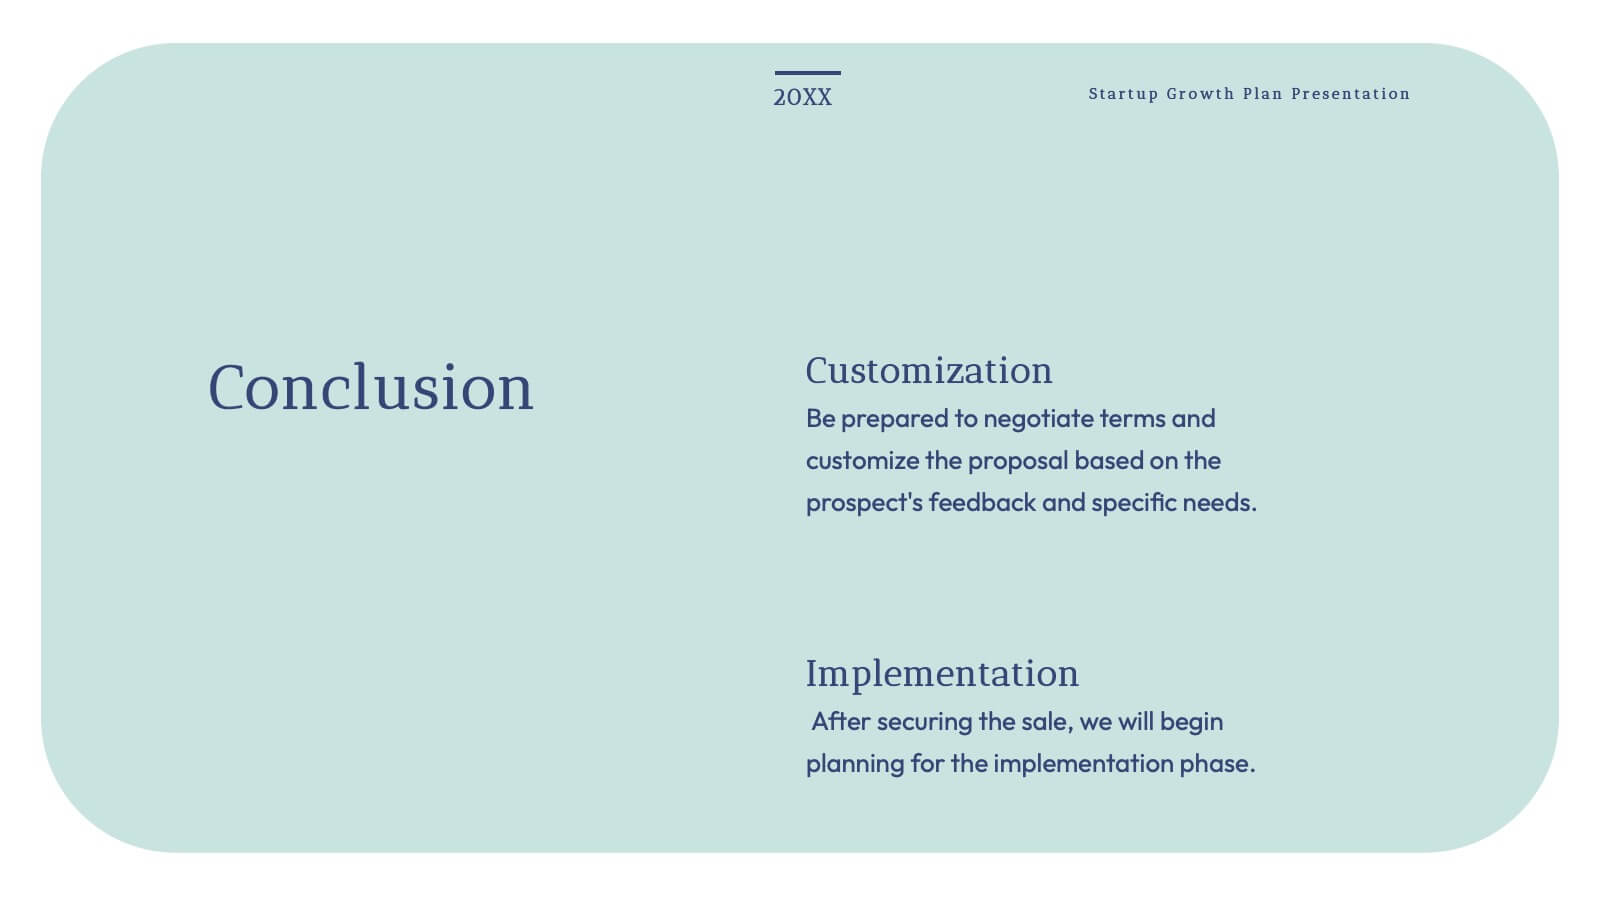
Grecian Startup Growth Plan Presentation
Elevate your pitch with this stunning Grecian-inspired presentation template, perfect for outlining your startup's growth plan! Showcase your business strategy, revenue projections, and scaling opportunities with a clean, elegant design that grabs attention. Impress investors and stakeholders with every slide. Compatible with PowerPoint, Keynote, and Google Slides for seamless customization.


5 diapositivas
Healthcare Industry Report
Deliver key medical insights with this modern, stethoscope-themed slide. Ideal for showcasing health metrics, clinical data, or medical updates, the layout includes four sections with health icons and clear callouts for easy readability. Fully customizable in PowerPoint, Keynote, and Google Slides.


5 diapositivas
Vegan Guide Infographics
A Vegan Guide is a comprehensive resource that provides information about a plant-based diet that excludes all animal products, including meat, dairy, eggs, and honey. These Vegan Guide Infographics are visual representations of information related to the vegan lifestyle. Cover a wide range of topics, including the benefits of veganism, how to transition to a vegan diet, common misconceptions about veganism, ethical and environmental considerations, and the nutritional requirements of a vegan diet. This can be used by individuals who are interested in adopting a vegan lifestyle, and educators who want to provide information about veganism to their clients and students.


4 diapositivas
Workforce Skills Gap Analysis
Spot the gap. Bridge the skills. This Workforce Skills Gap Analysis slide helps visualize the journey from your team’s current capabilities to their desired performance level, with a clear action plan in between. Fully editable and works seamlessly in PowerPoint, Keynote, and Google Slides.


6 diapositivas
Remote Work Productivity Presentation
The "Remote Work Productivity" presentation template features a clean and modern design, ideal for showcasing strategies and statistics related to remote work efficiency. Each slide allows for the display of key data points and statistics, supported by visual elements like percentage indicators and progress bars that enhance the presentation’s readability and impact. This template is perfect for businesses looking to improve remote operations or present data-driven insights into remote work performance, making it easier for viewers to grasp the effectiveness of remote work policies and tools.


5 diapositivas
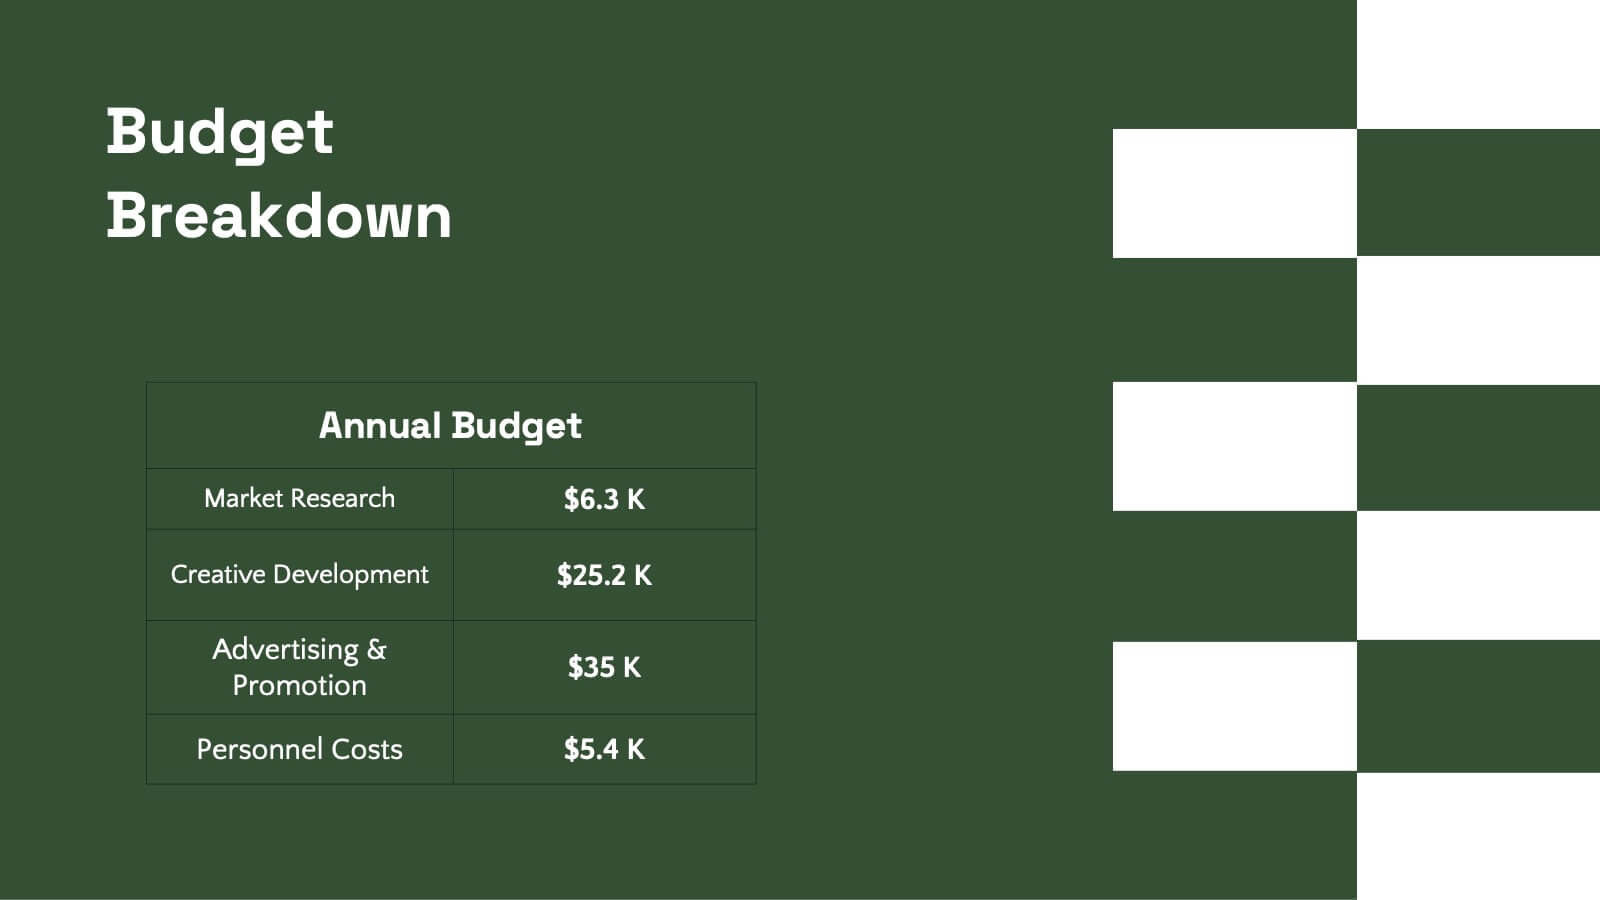
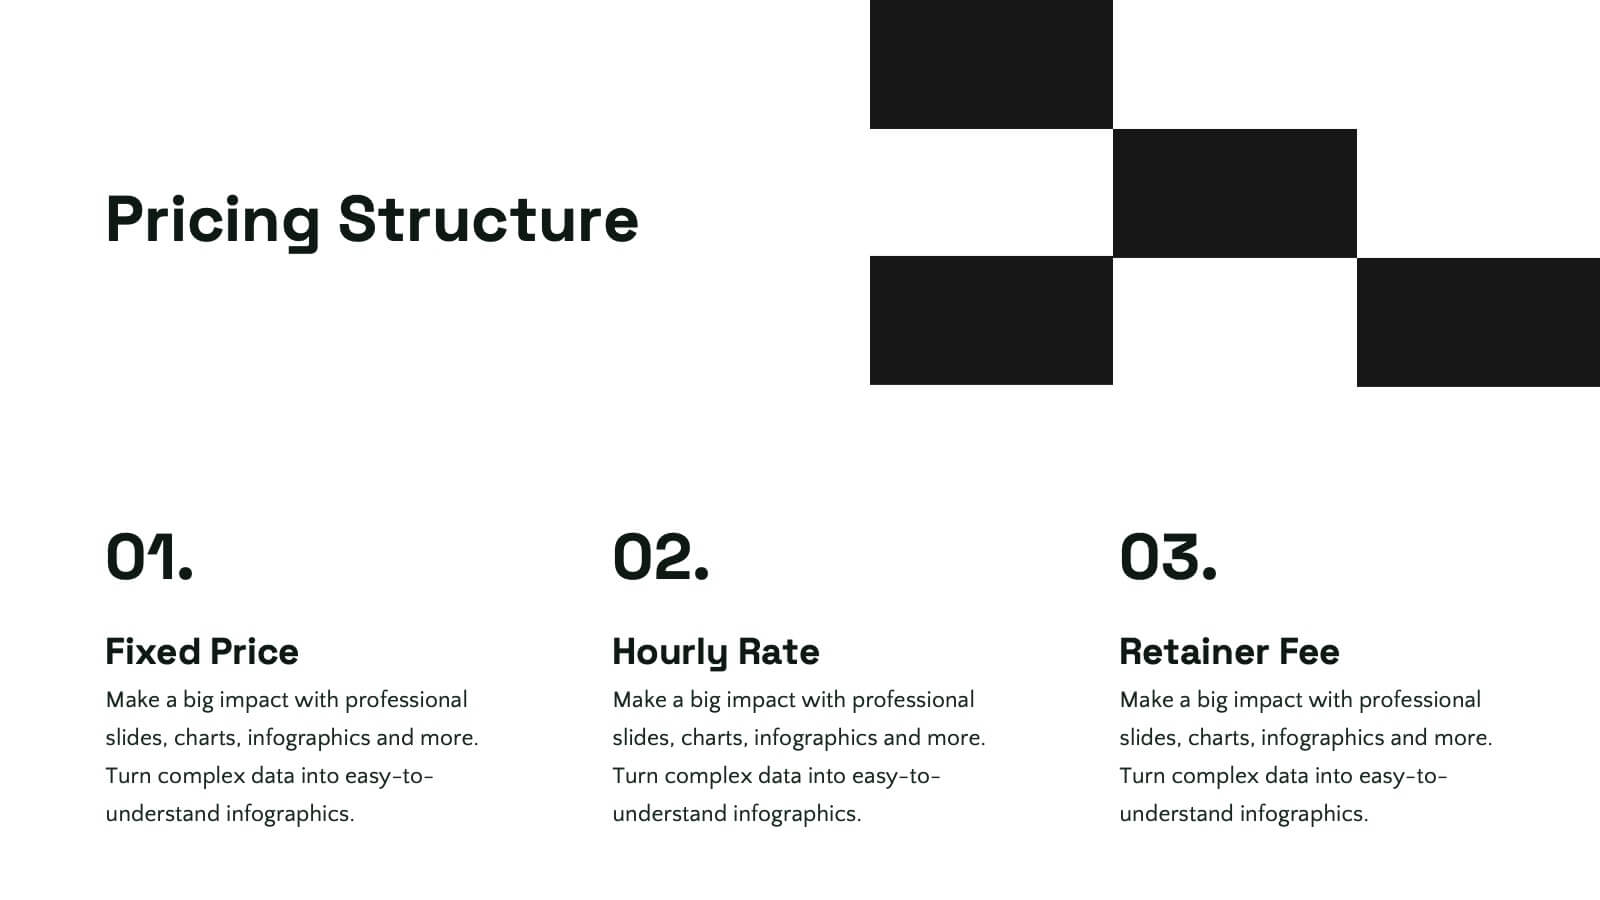
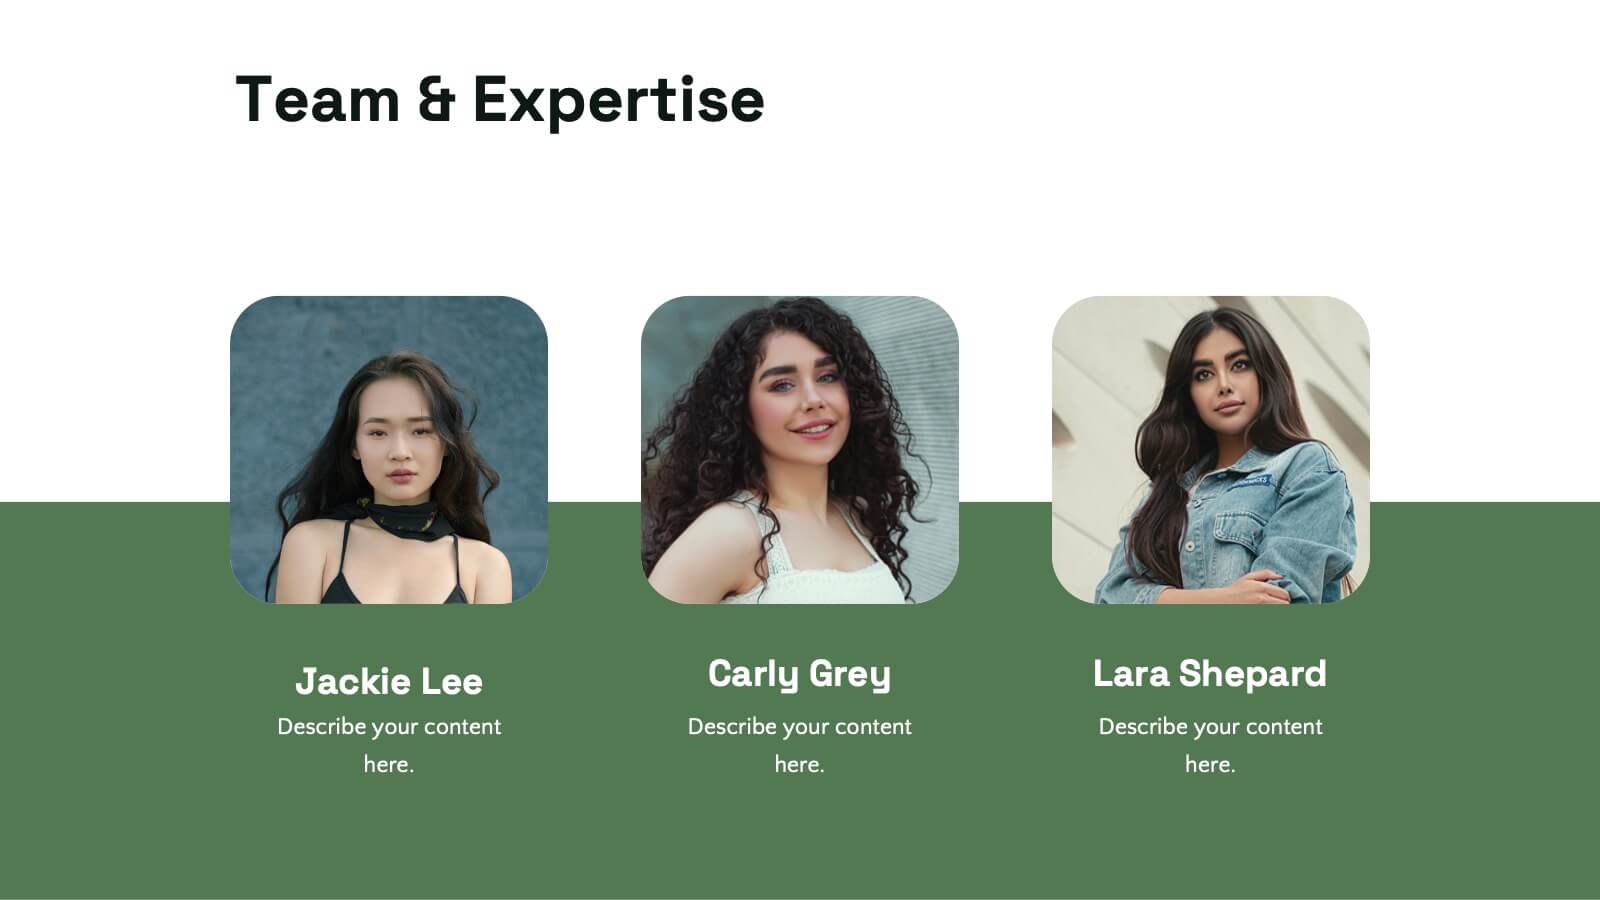
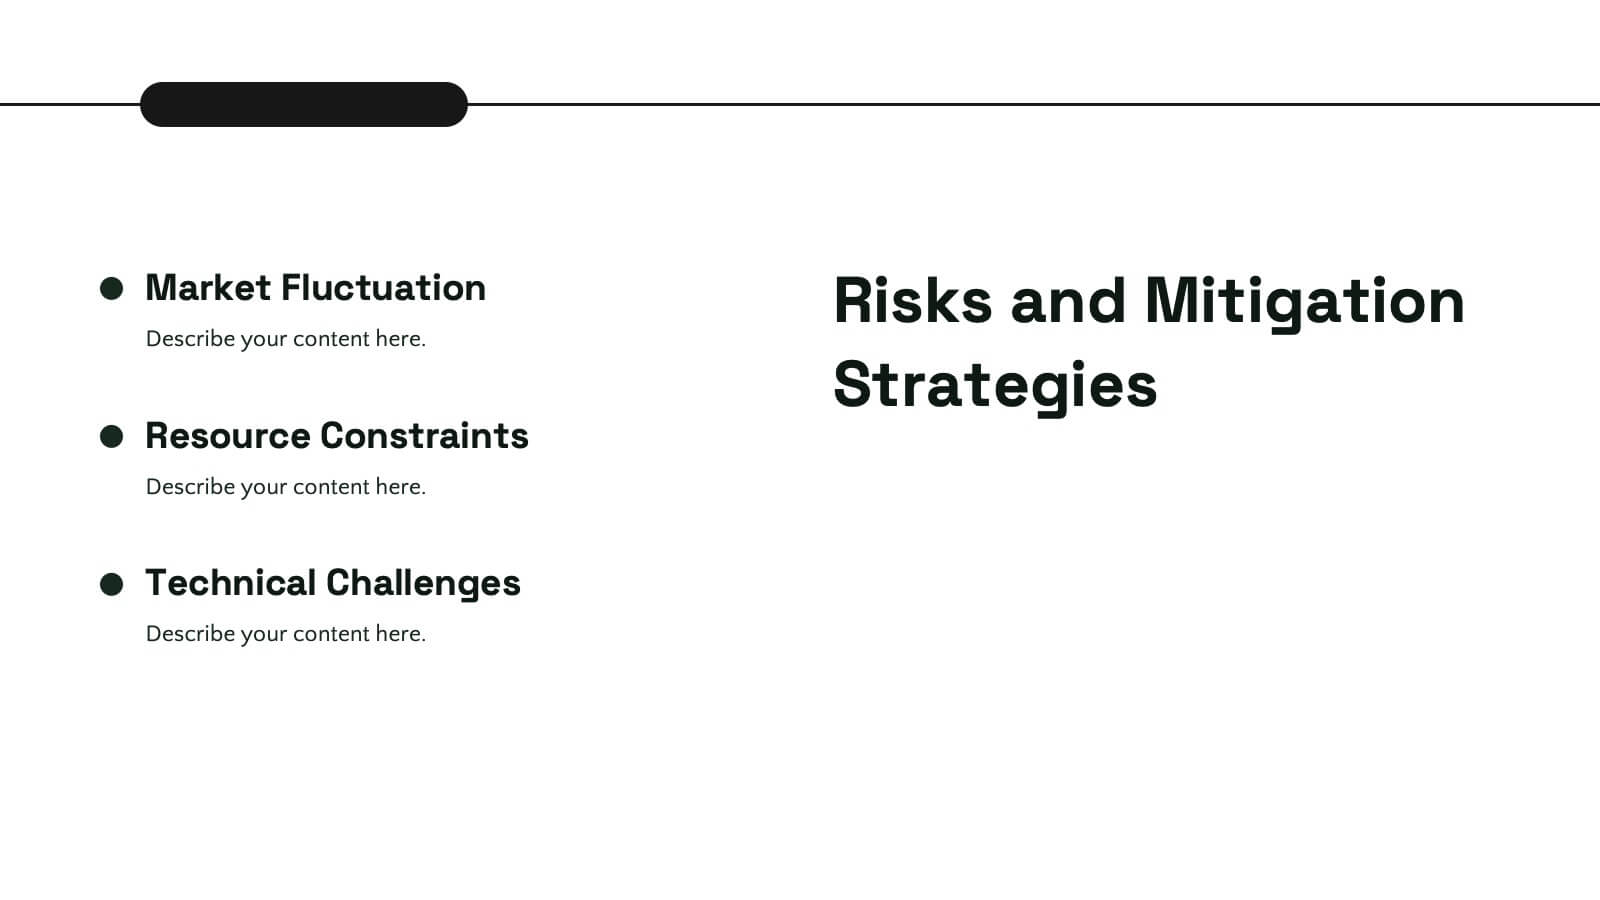
Business Annual Report Summary Presentation
Clear, Concise, and Impactful! The Business Annual Report Summary Presentation template helps you present key performance indicators, financial metrics, and company growth in a professional and visually engaging way. Fully customizable and compatible with PowerPoint, Keynote, and Google Slides, it’s ideal for executives and analysts aiming for a compelling data-driven presentation.


4 diapositivas
Task and Role Allocation Matrix
Clarify team responsibilities with this modern Task and Role Allocation Matrix. Easily visualize who is Responsible, Accountable, Contributing, and Informed for each task. Ideal for team leaders, HR planners, and project coordinators. Fully customizable in PowerPoint, Keynote, and Google Slides.


6 diapositivas
Project Cycle Infographics
The "Project Cycle" infographic template is a meticulously designed resource, ideal for project managers, team leaders, and business analysts. This template facilitates a clear and comprehensive presentation of the various stages involved in a project, from initiation to completion. This template encompasses essential elements of the project cycle, including project initiation, planning, execution, monitoring, and closure. The structured design ensures each phase is distinctly represented, allowing for detailed exploration of timelines, resource allocation, and milestone achievements. This makes it an excellent tool for project planning meetings, stakeholder briefings, and team workshops. The design is professional and methodical, featuring a color scheme that is both engaging and indicative of progression and clarity. This not only enhances the visual appeal of the presentation but also aids in effectively communicating the sequential and cyclical nature of project management. Whether it's used in corporate boardrooms or educational settings, this template guarantees that your project cycle is presented in a detailed, visually compelling, and easily understandable manner.


7 diapositivas
Survey Results Infographic Presentation Template
Your survey results are the most important part of the research process. Now you can present your findings to colleagues and clients in a professional and impactful way with this survey results template. This infographic design allows you to organize your results with ease. Designed to help you easily transform your survey results into an eye-catching, professional presentation. It includes everything a successful presentation needs with standard shapes and text boxes that are easy to customize. This is a great starter template for anyone looking to create an impressive report in minutes.


21 diapositivas
Design Creative Concept Presentation
Enhance your creative presentations with this Creative Concept template. It features slides for objectives, color palettes, typography options, and prototyping steps. Ideal for designers and creative teams, this template supports PowerPoint, Keynote, and Google Slides, facilitating a comprehensive and engaging presentation of creative projects.


8 diapositivas
Sustainable Operation & Ethical Practice Presentation
Illustrate your ethical initiatives and operational sustainability with this water drop flow diagram. Ideal for outlining four key actions or principles, it features a faucet visual and icon-based content drops. Fully customizable in PowerPoint, Keynote, and Google Slides—perfect for ESG reporting, CSR updates, and eco-conscious business presentations.


6 diapositivas
Business Growth with TAM SAM SOM Framework
Fuel your next big idea with a clear, structured breakdown of market potential. This easy-to-follow visual helps explain the TAM, SAM, and SOM layers of business growth—ideal for investors, strategy teams, or product managers. Fully editable in PowerPoint, Keynote, and Google Slides for fast, seamless presentation design.
19 diapositivas
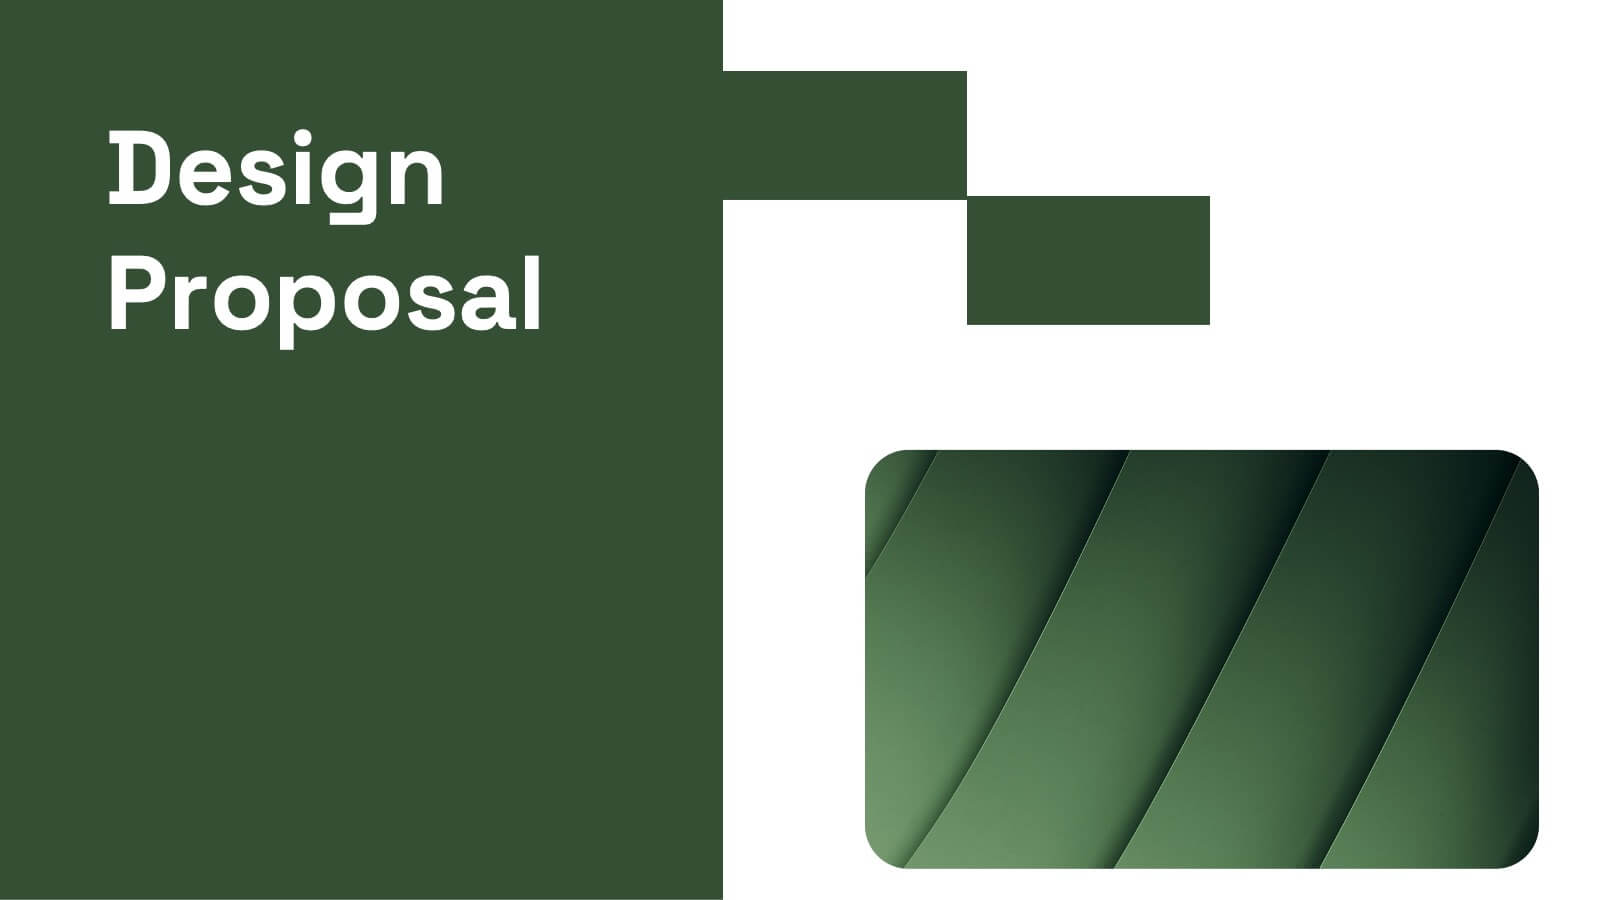
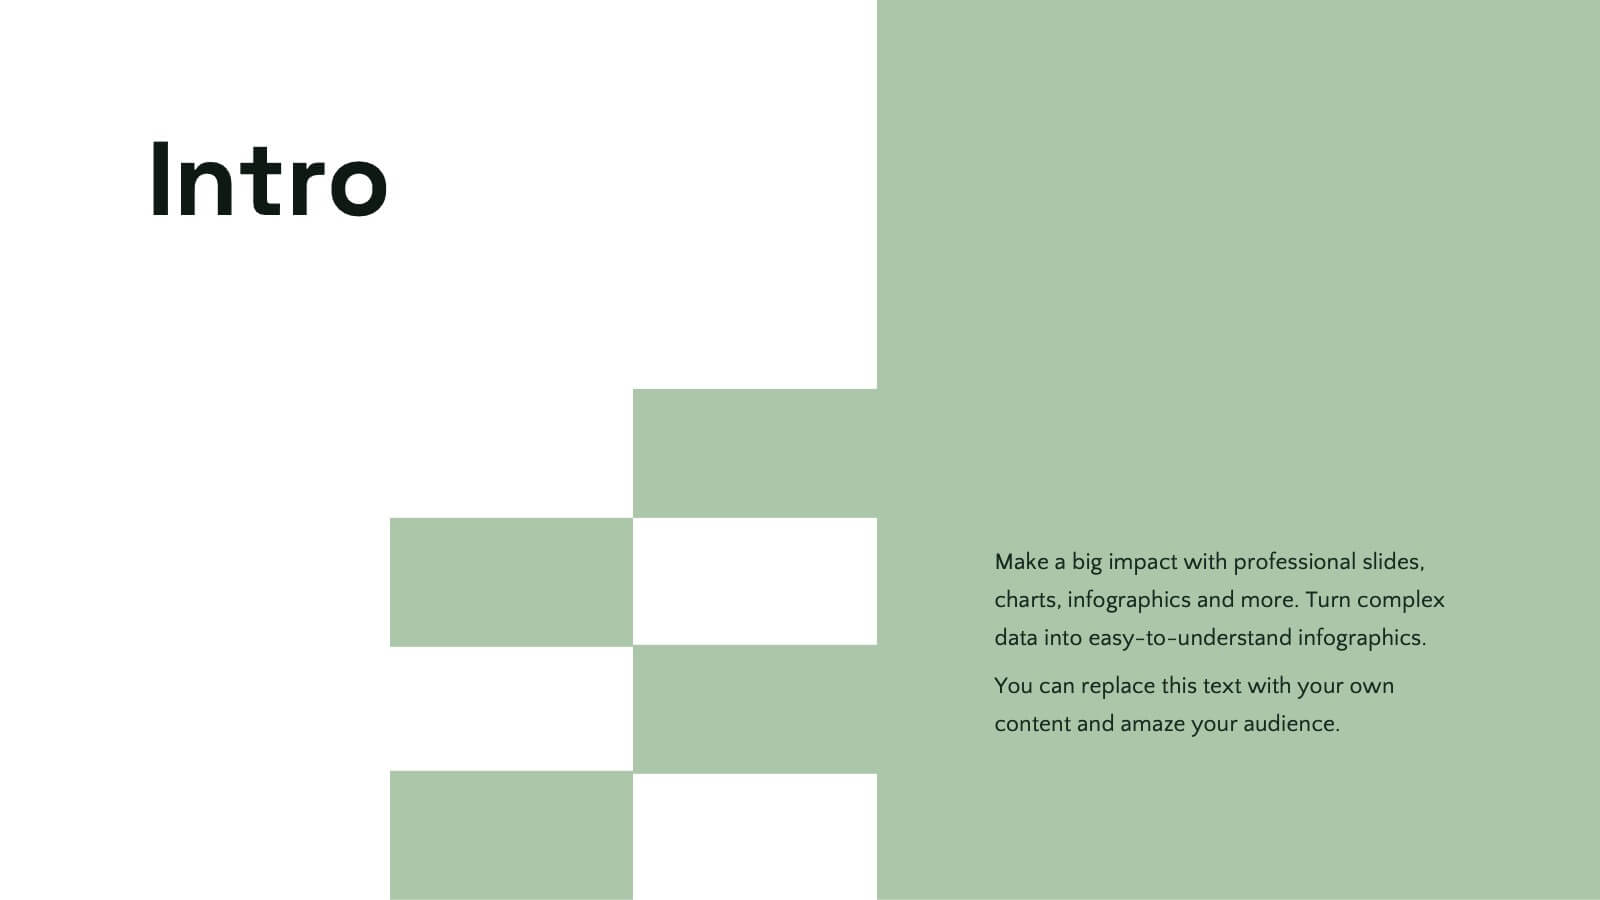
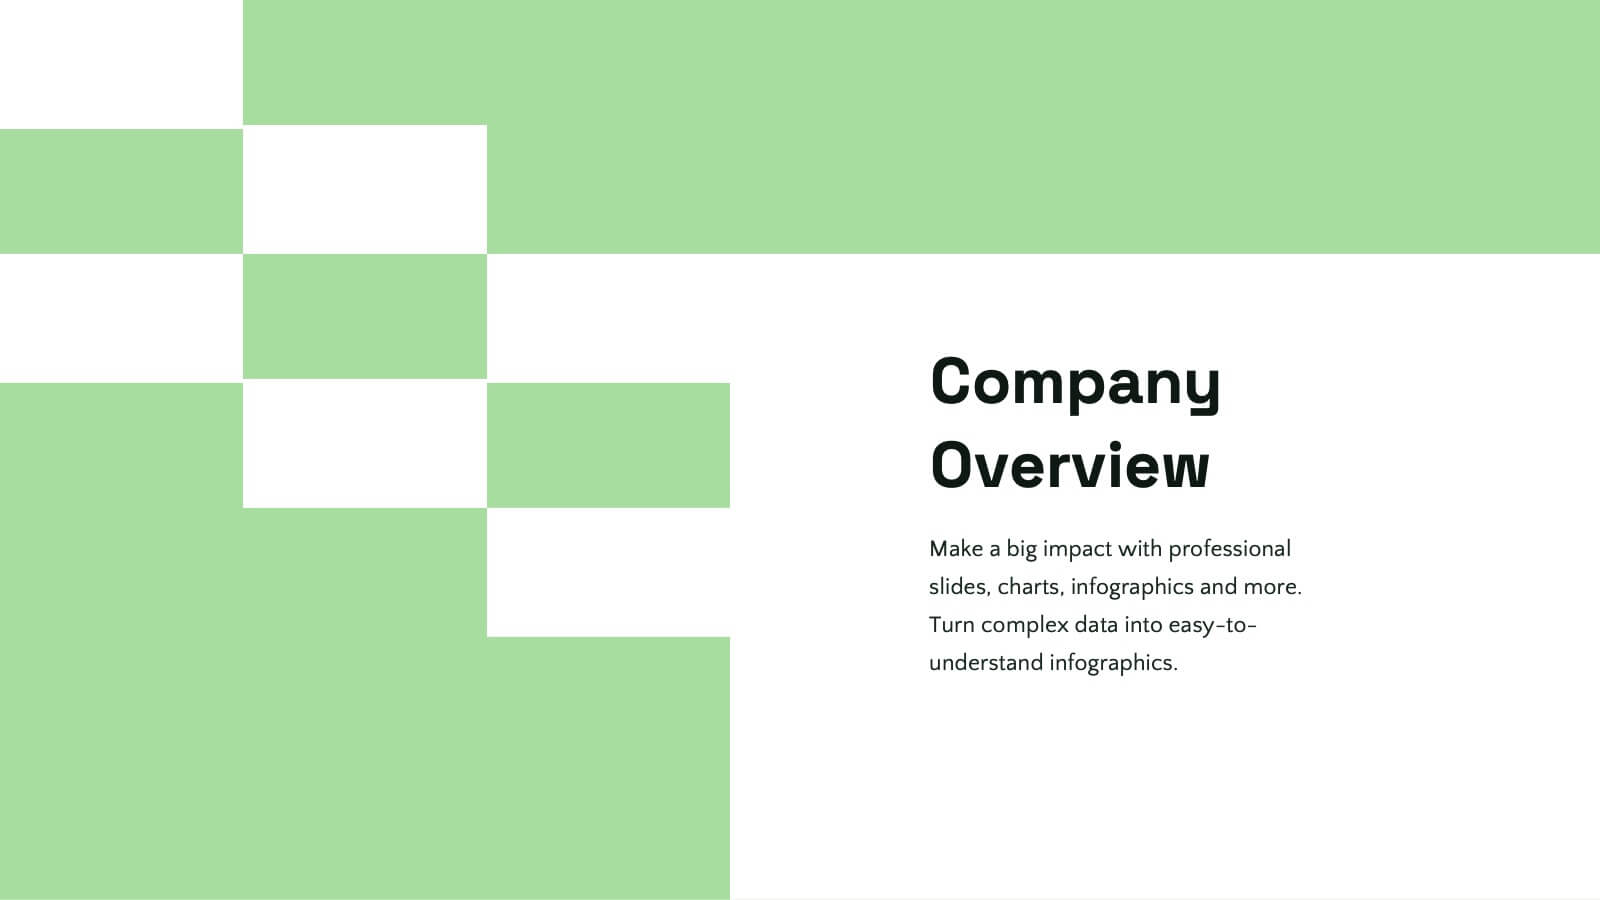
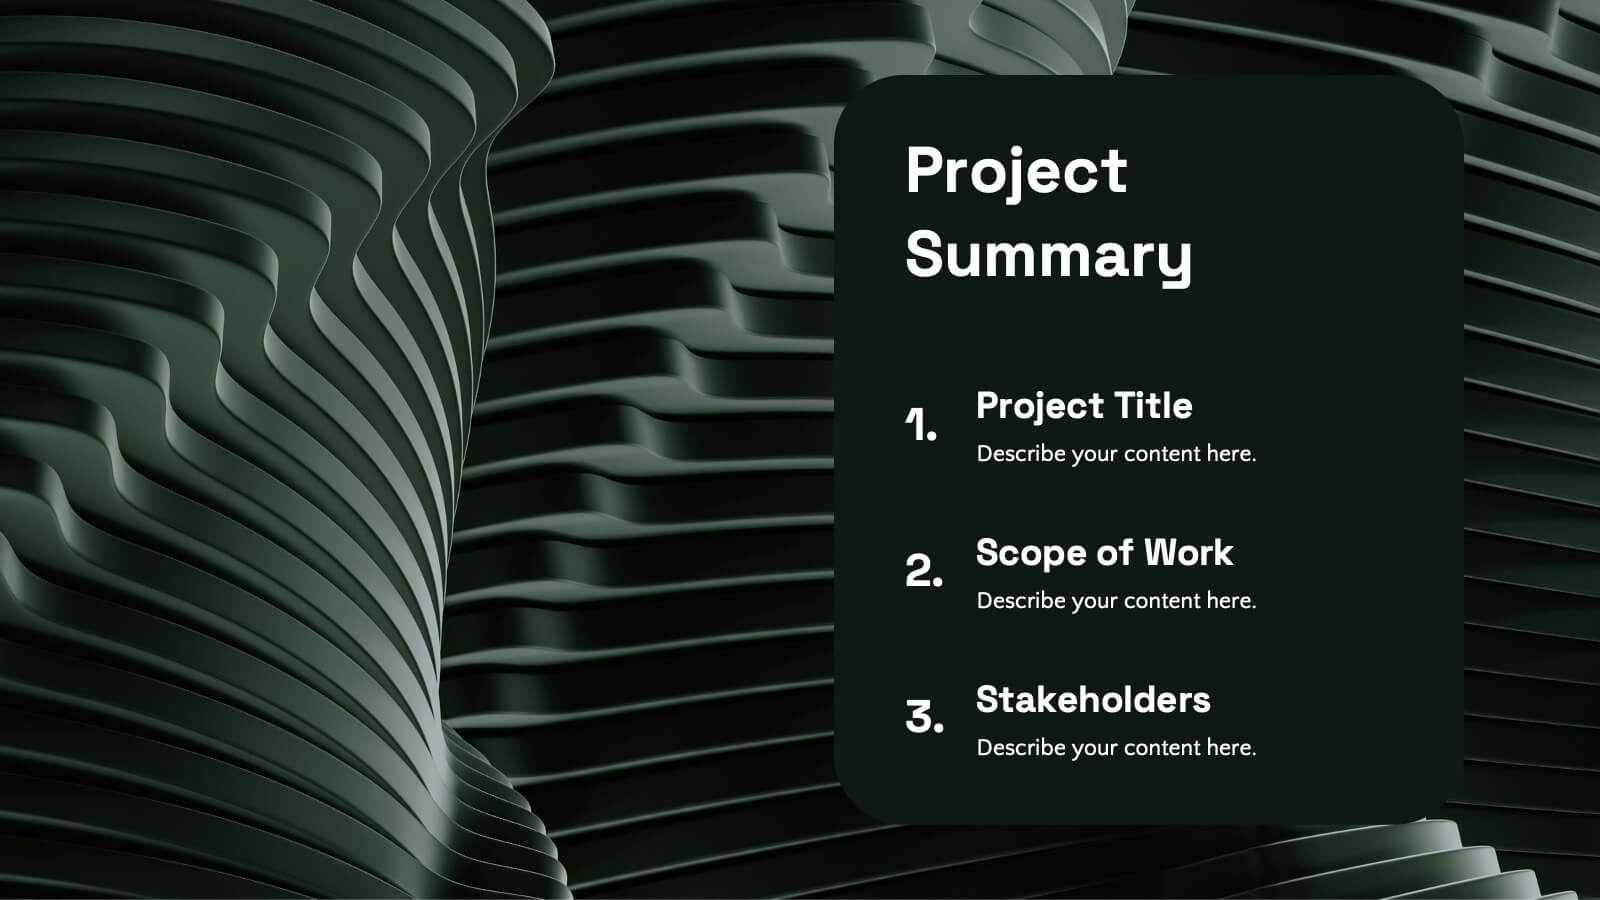
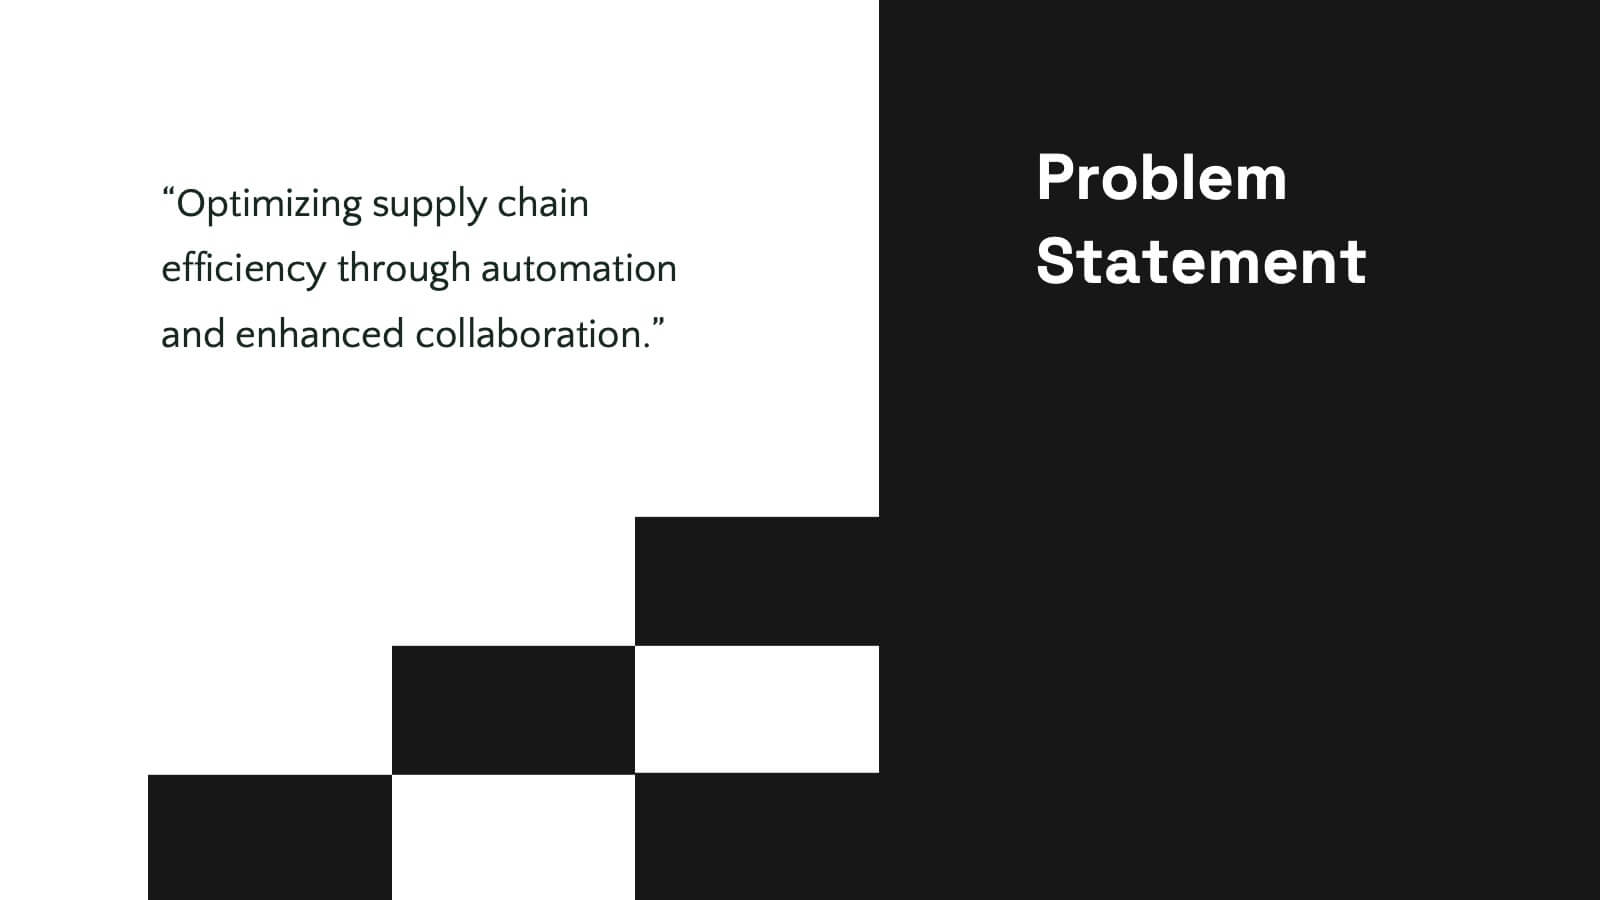
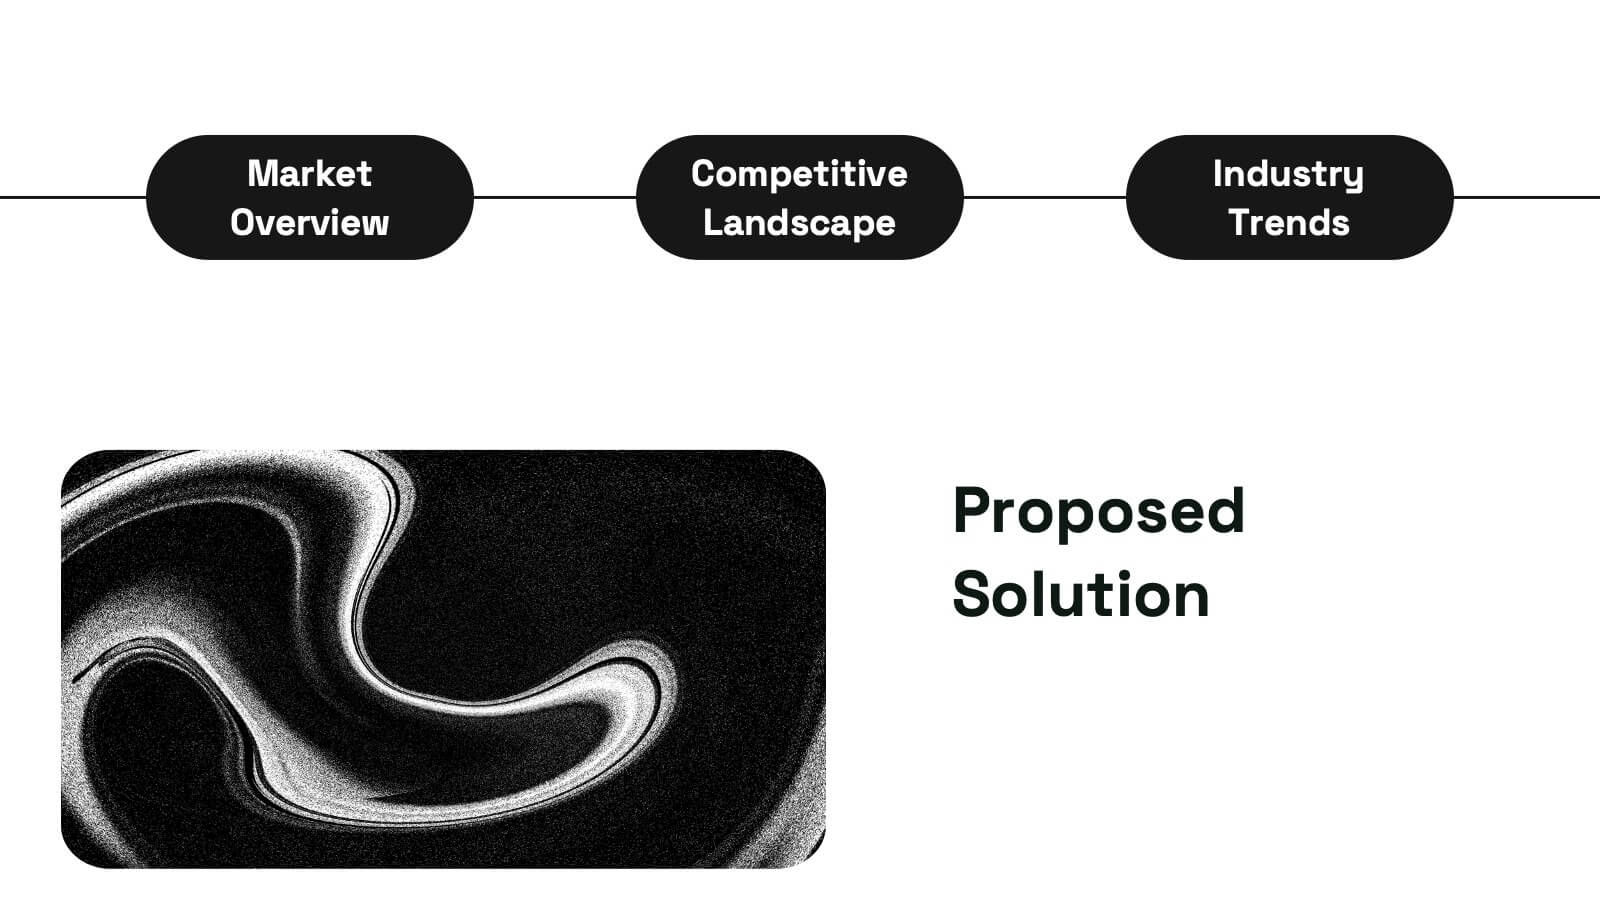
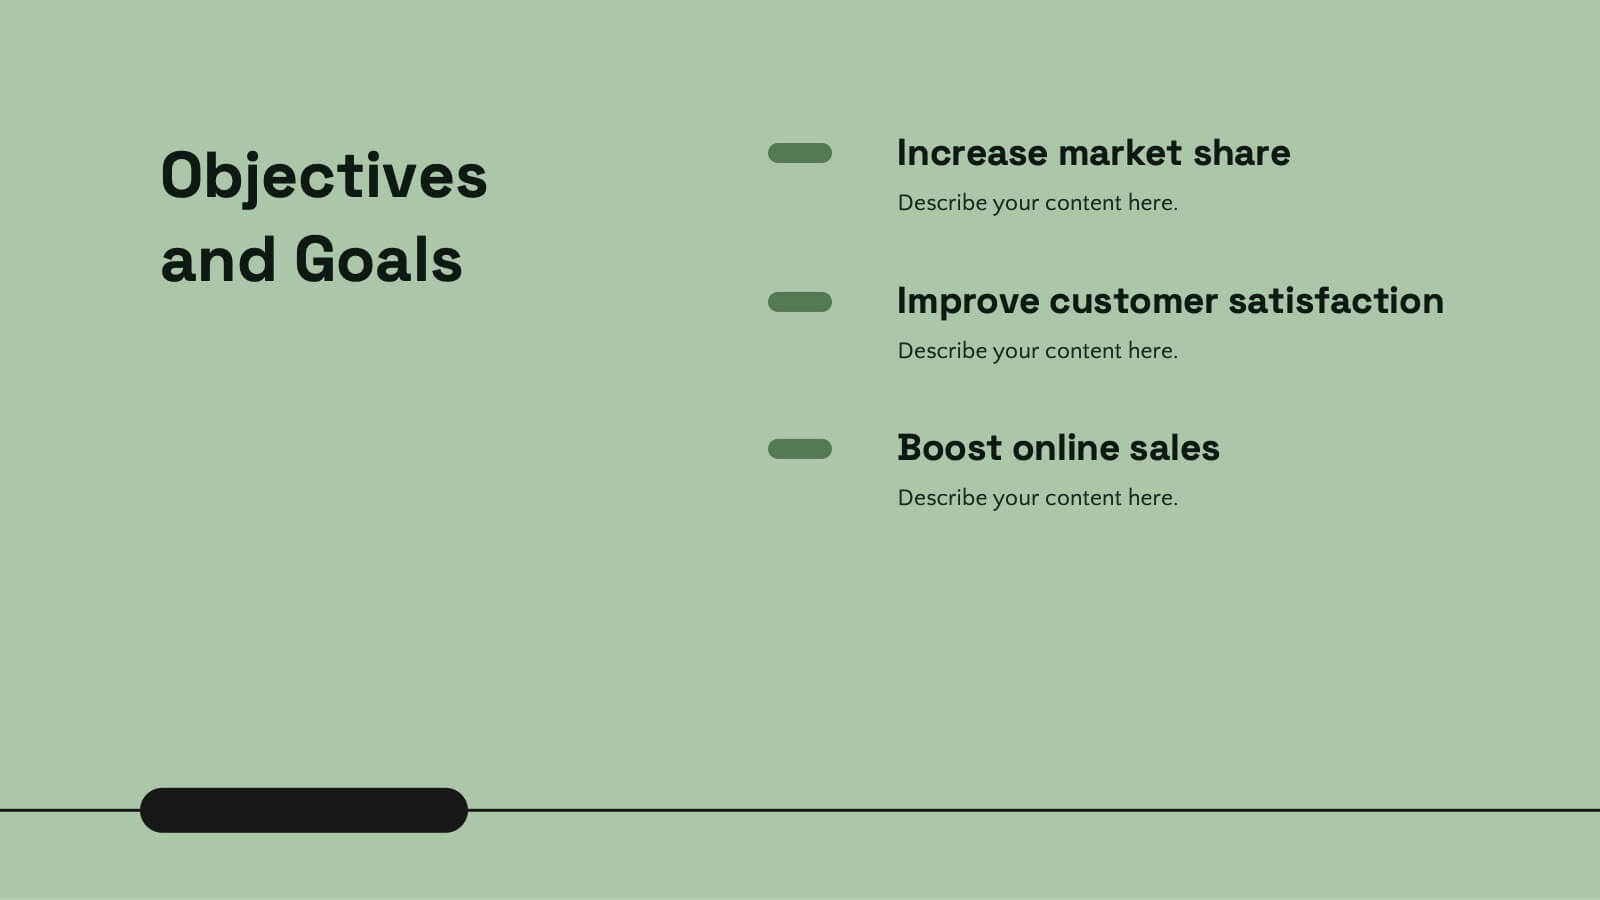
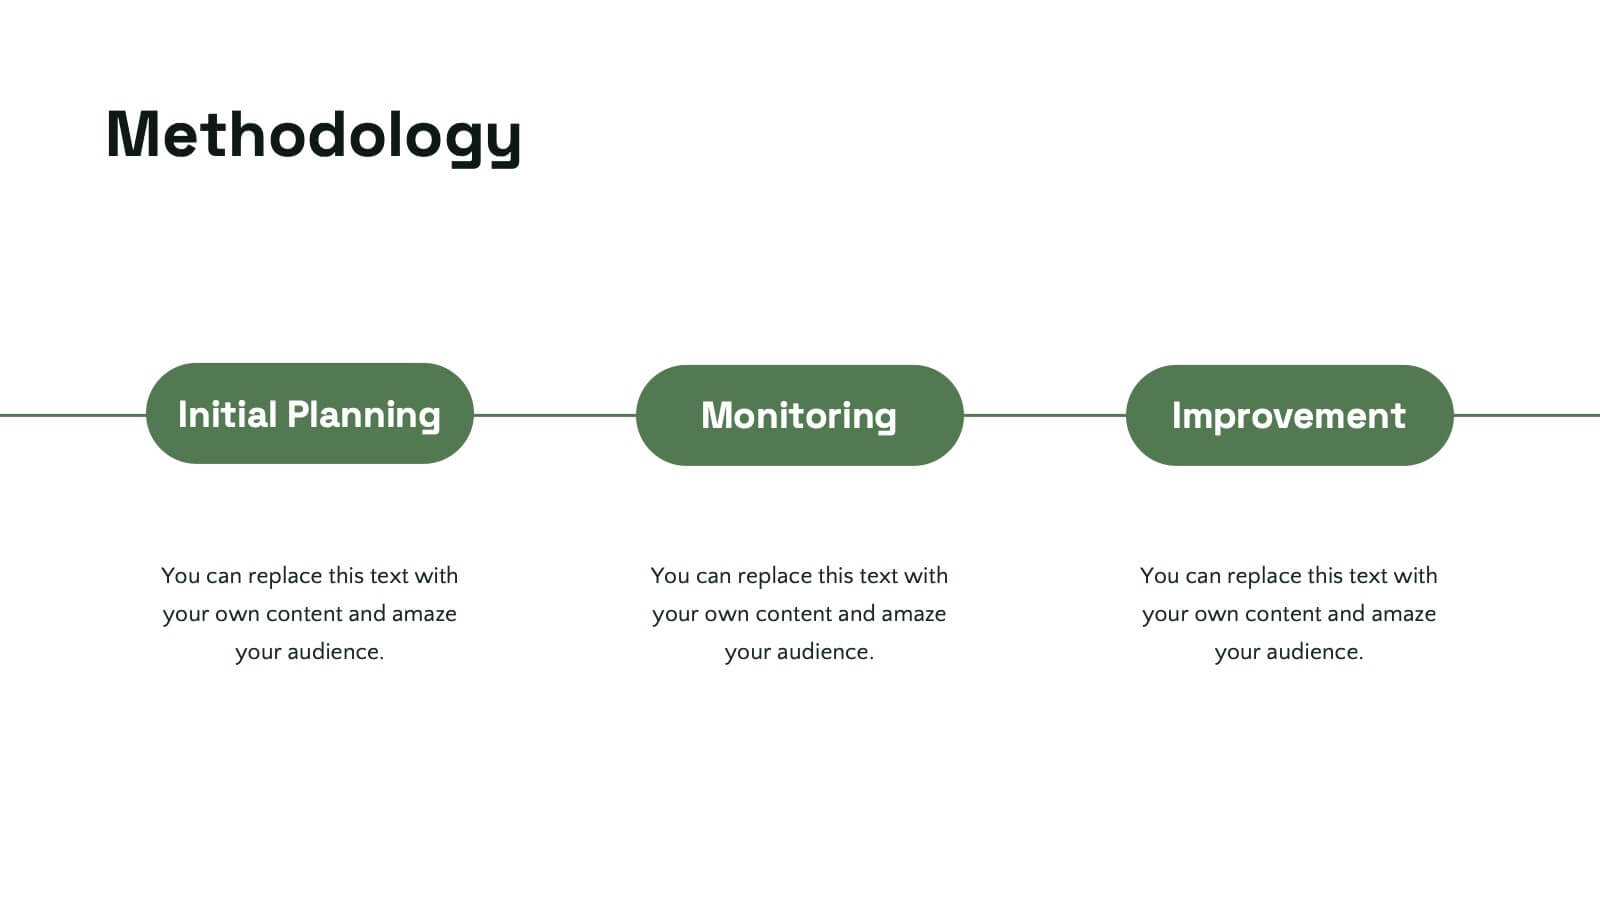
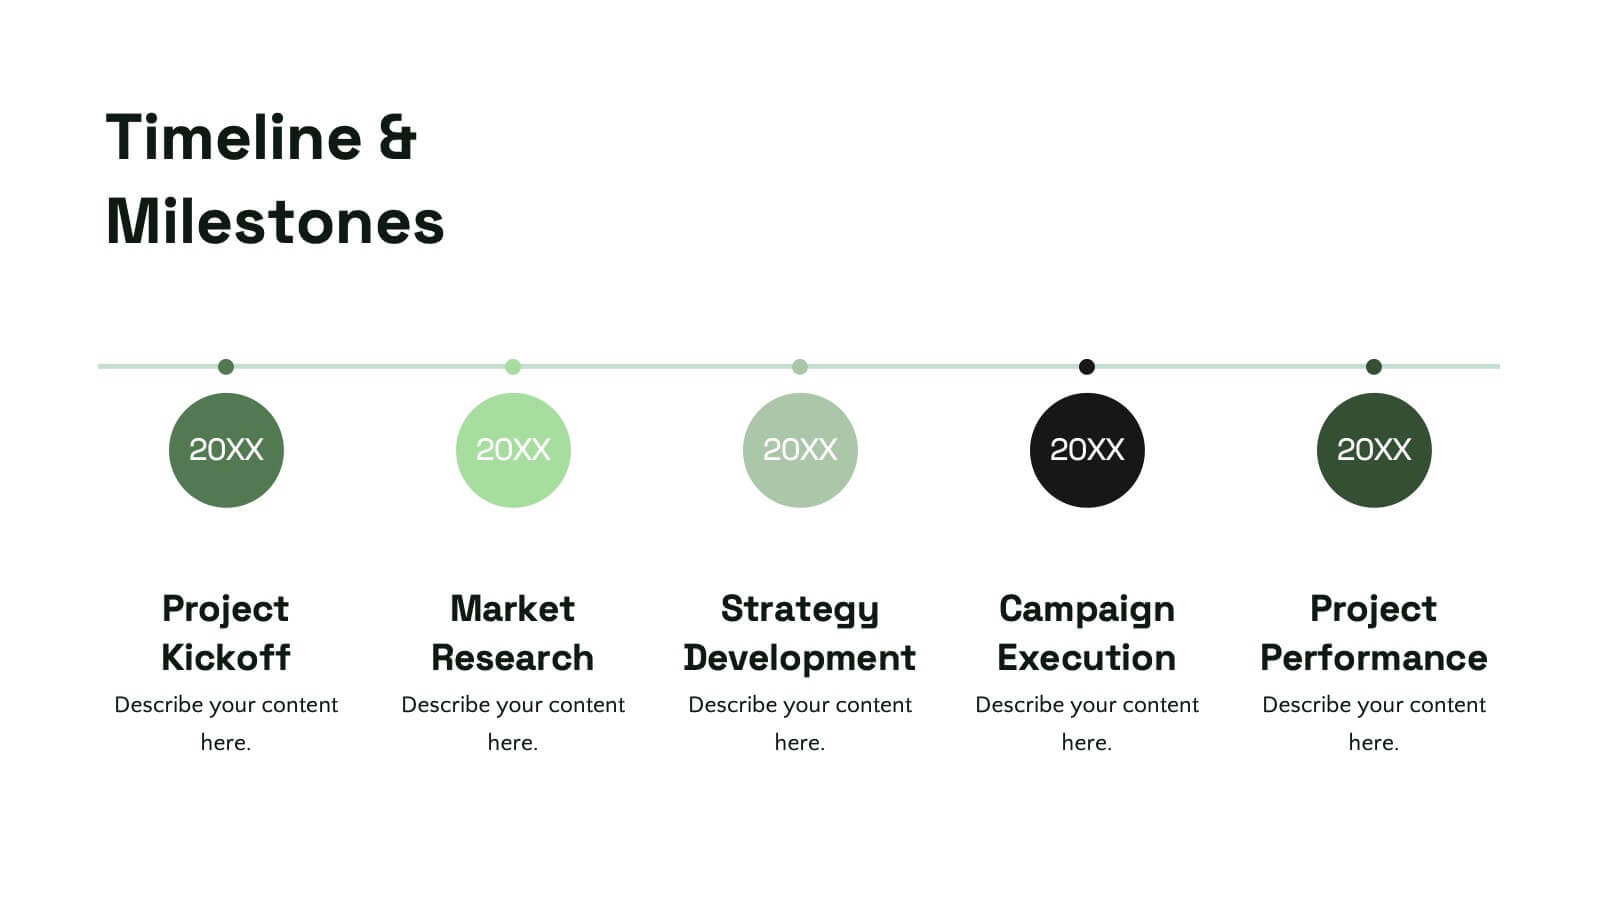
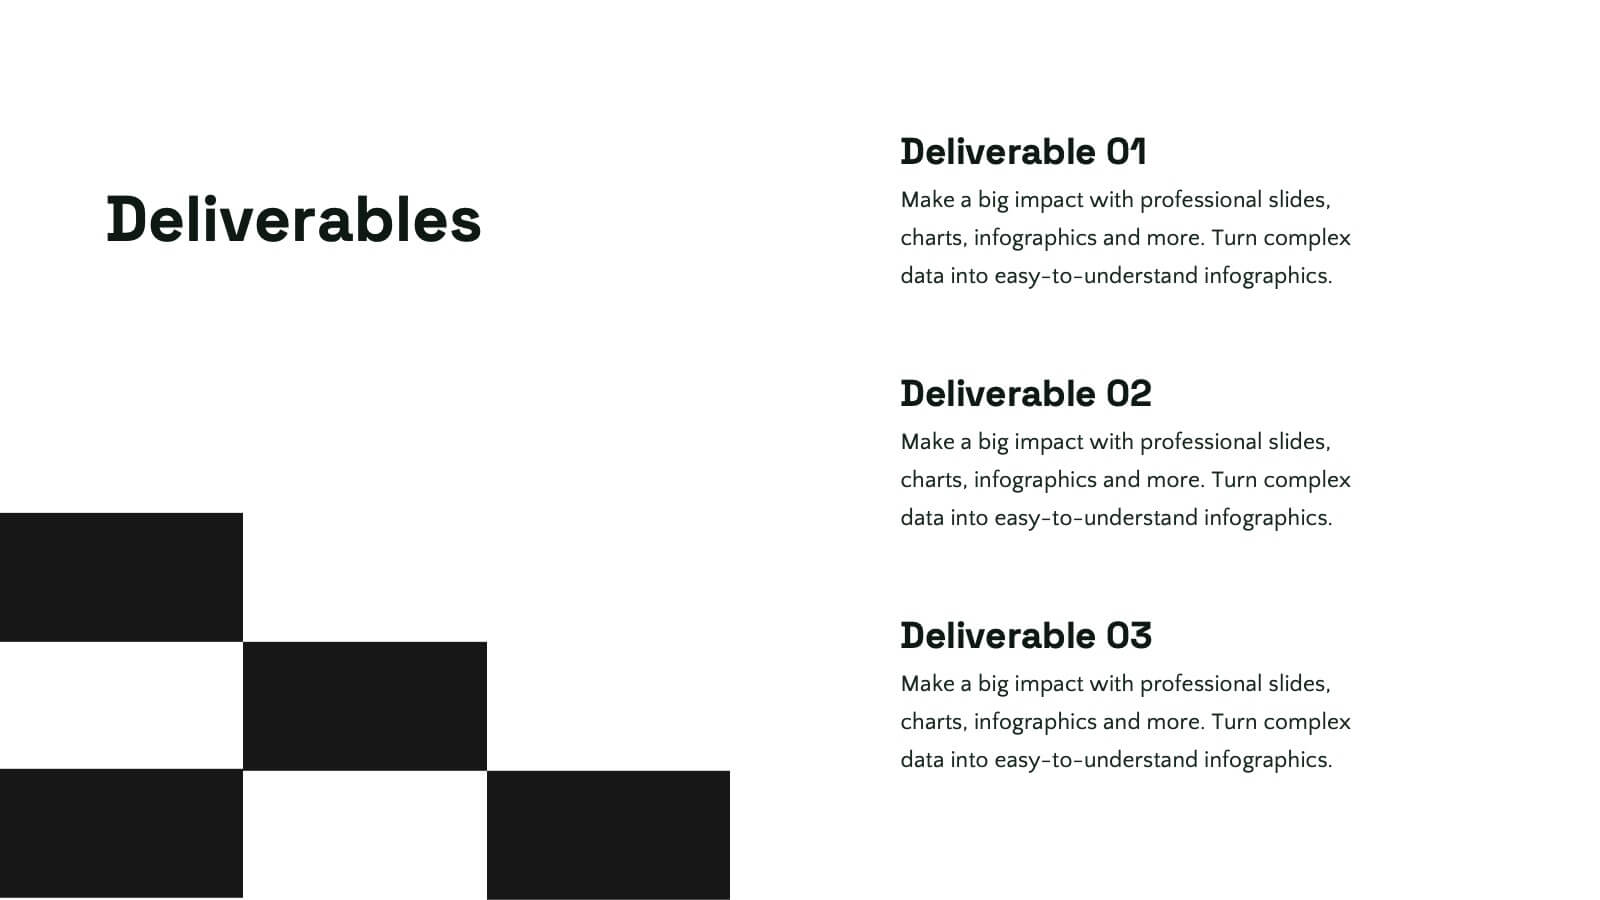
Tidal Design Proposal Presentation
Elevate your pitch with this sleek design proposal template! Perfect for presenting project details, objectives, methodology, and milestones, it ensures your ideas stand out. Impress stakeholders with clear, structured slides and professional aesthetics. Compatible with PowerPoint, Keynote, and Google Slides for a seamless presentation experience across all platforms.


4 diapositivas
Business Model Value Stream Design Presentation
Clarify complex operations with the Business Model Value Stream Design Presentation. This slide template is perfect for mapping out your business model, identifying value streams, and aligning teams around critical workflows. Its grid-style layout makes it easy to categorize key areas like customer segments, operations, and financial drivers—ideal for strategic planning sessions or executive overviews. Fully editable and compatible with PowerPoint, Keynote, and Google Slides, this design is a smart choice for consultants, business analysts, and operations leaders.