


Características


¿Tienes alguna pregunta?
Recomendar


10 diapositivas
SWOT Analysis Presentation
Enhance your strategic planning with our "SWOT Analysis Presentation" template. Designed to evaluate Strengths, Weaknesses, Opportunities, and Threats, this infographic facilitates a clear and structured examination of key business or project factors. Each quadrant is color-coded for easy differentiation and visual engagement, making complex analyses accessible and straightforward. Ideal for strategic development and competitive analysis meetings, this template ensures all critical aspects are considered. It's an essential tool for executives, strategists, and marketers focused on informed decision-making and business growth. Fully compatible with PowerPoint, Keynote, and Google Slides, this template is perfect for any professional setting.


6 diapositivas
Problem-Solving with Design Thinking Presentation
Master complex challenges with the Problem-Solving with Design Thinking presentation. This structured layout helps visualize ideas, collaboration, and strategic solutions through an intuitive, professional design. Ideal for workshops, business innovation, and strategic planning. Fully customizable and compatible with PowerPoint, Keynote, and Google Slides for a seamless experience.
22 diapositivas
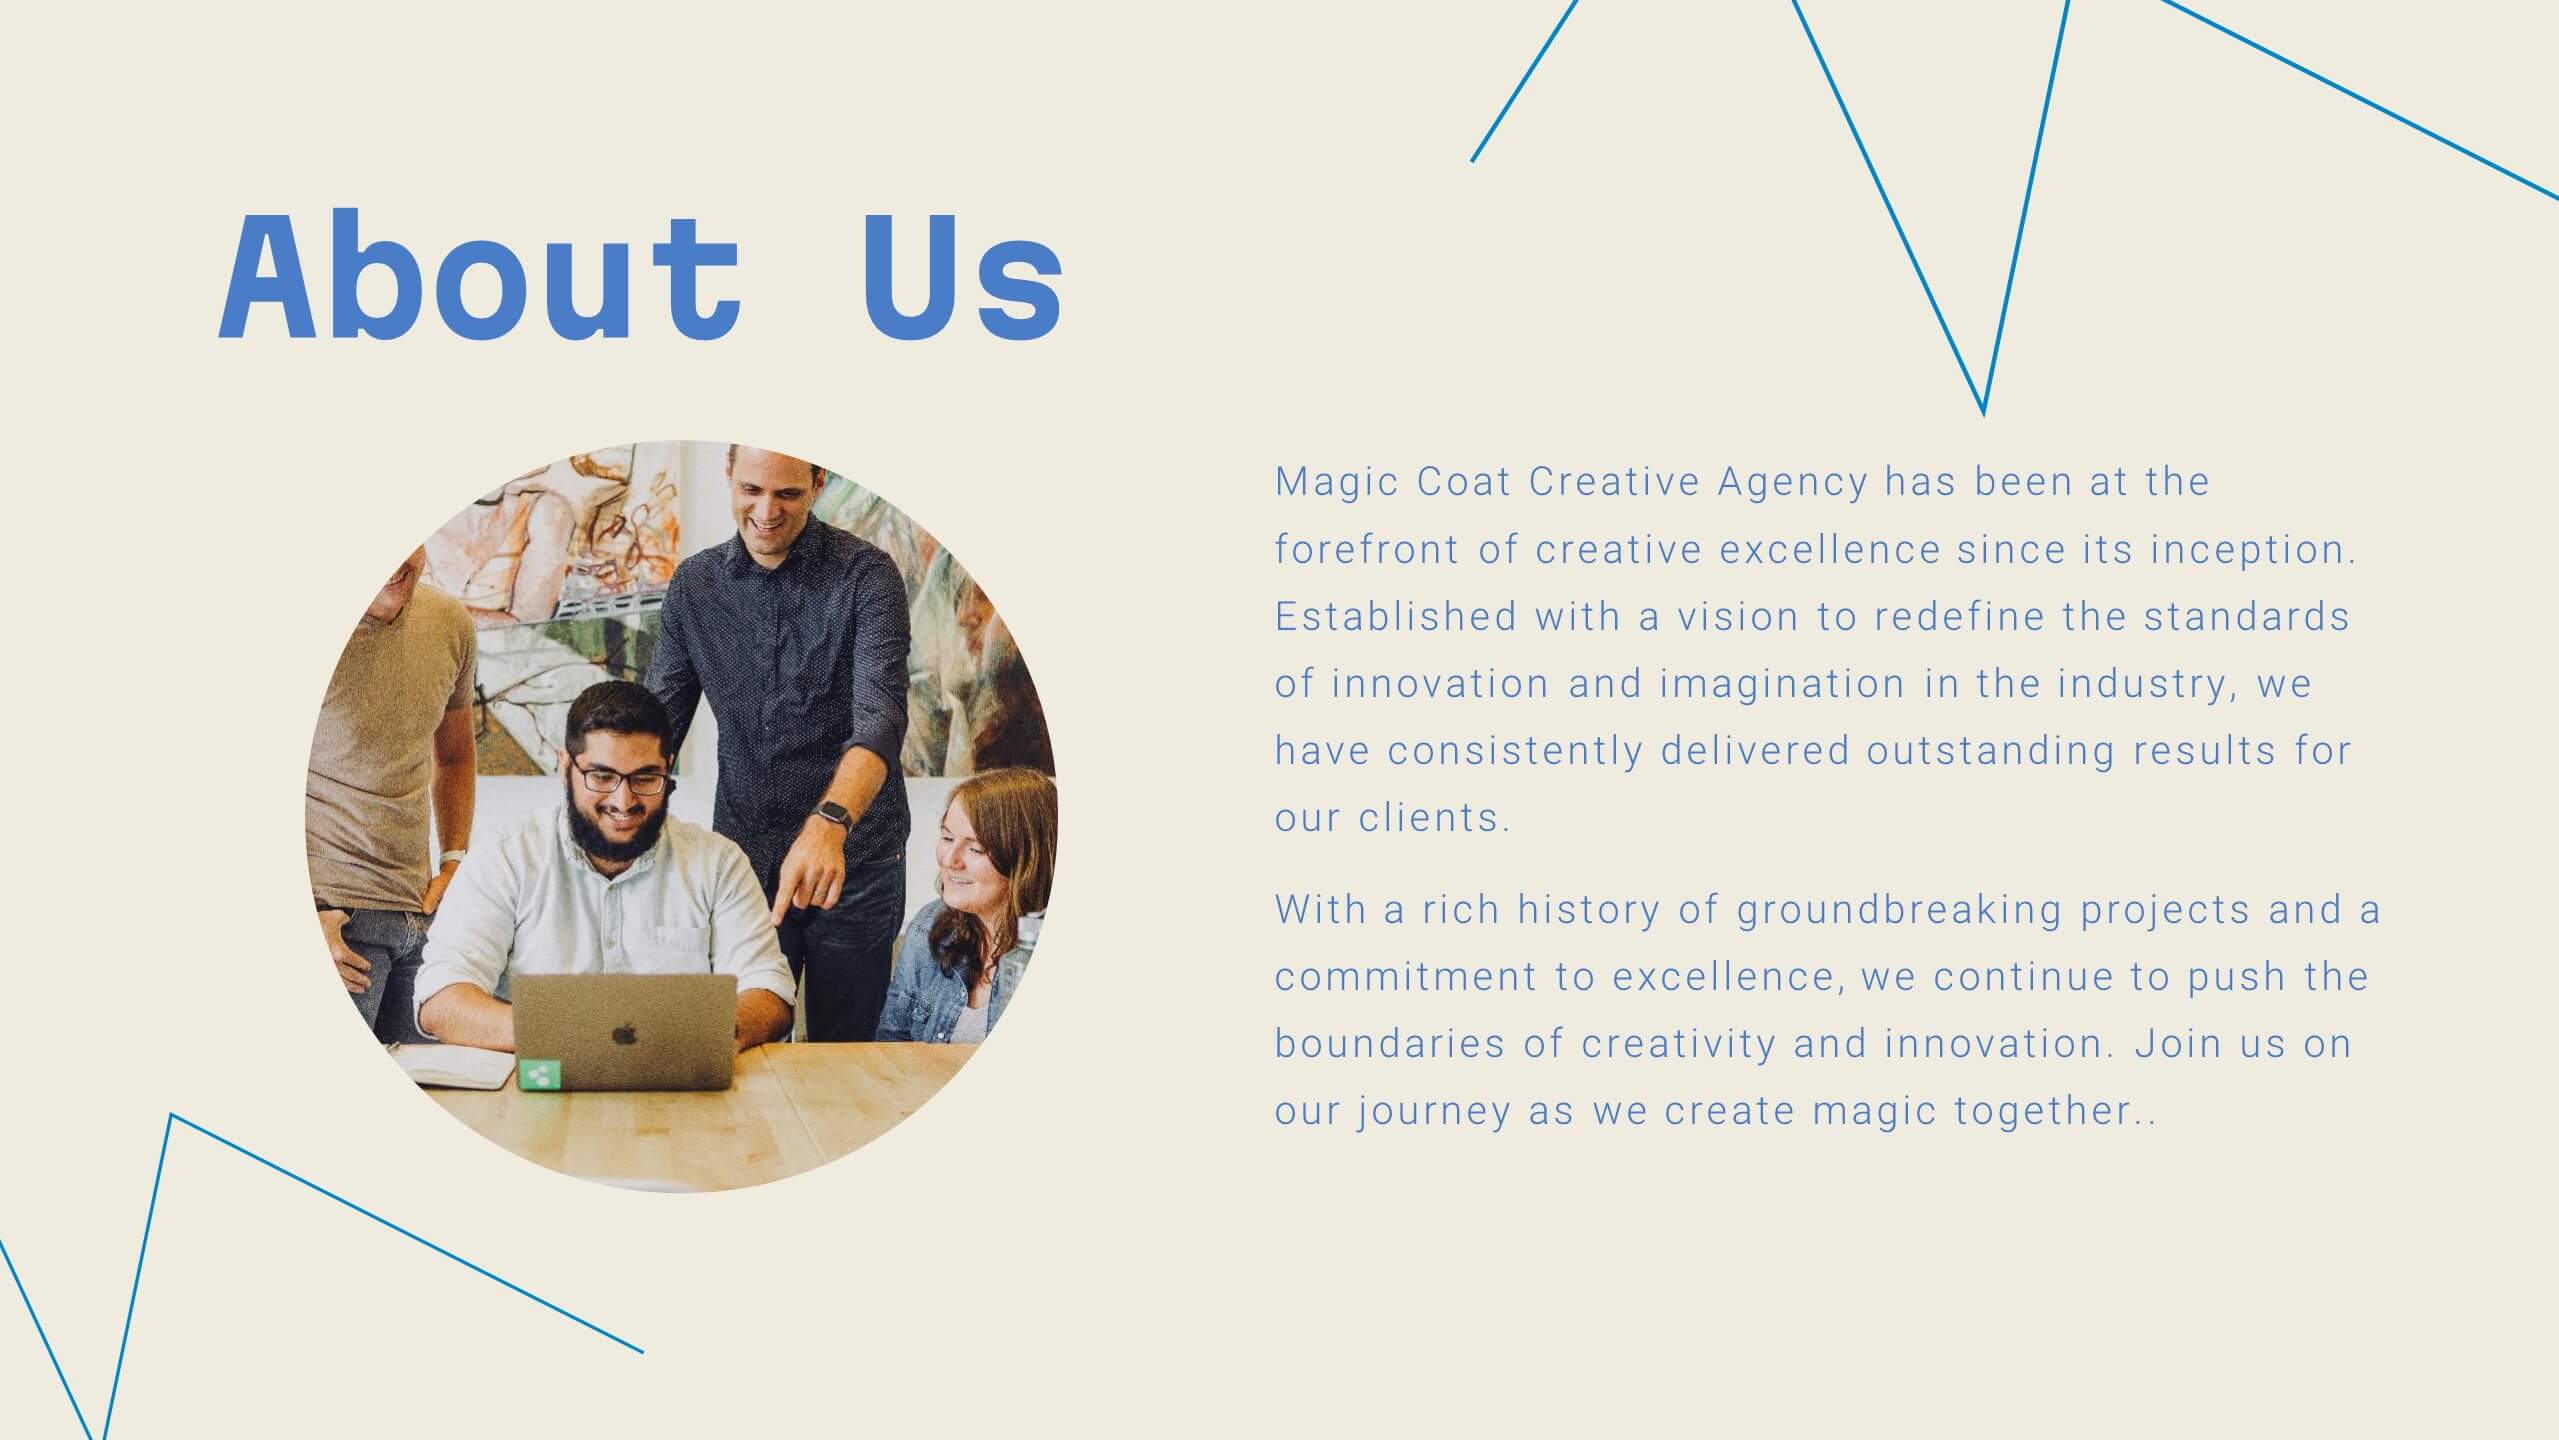
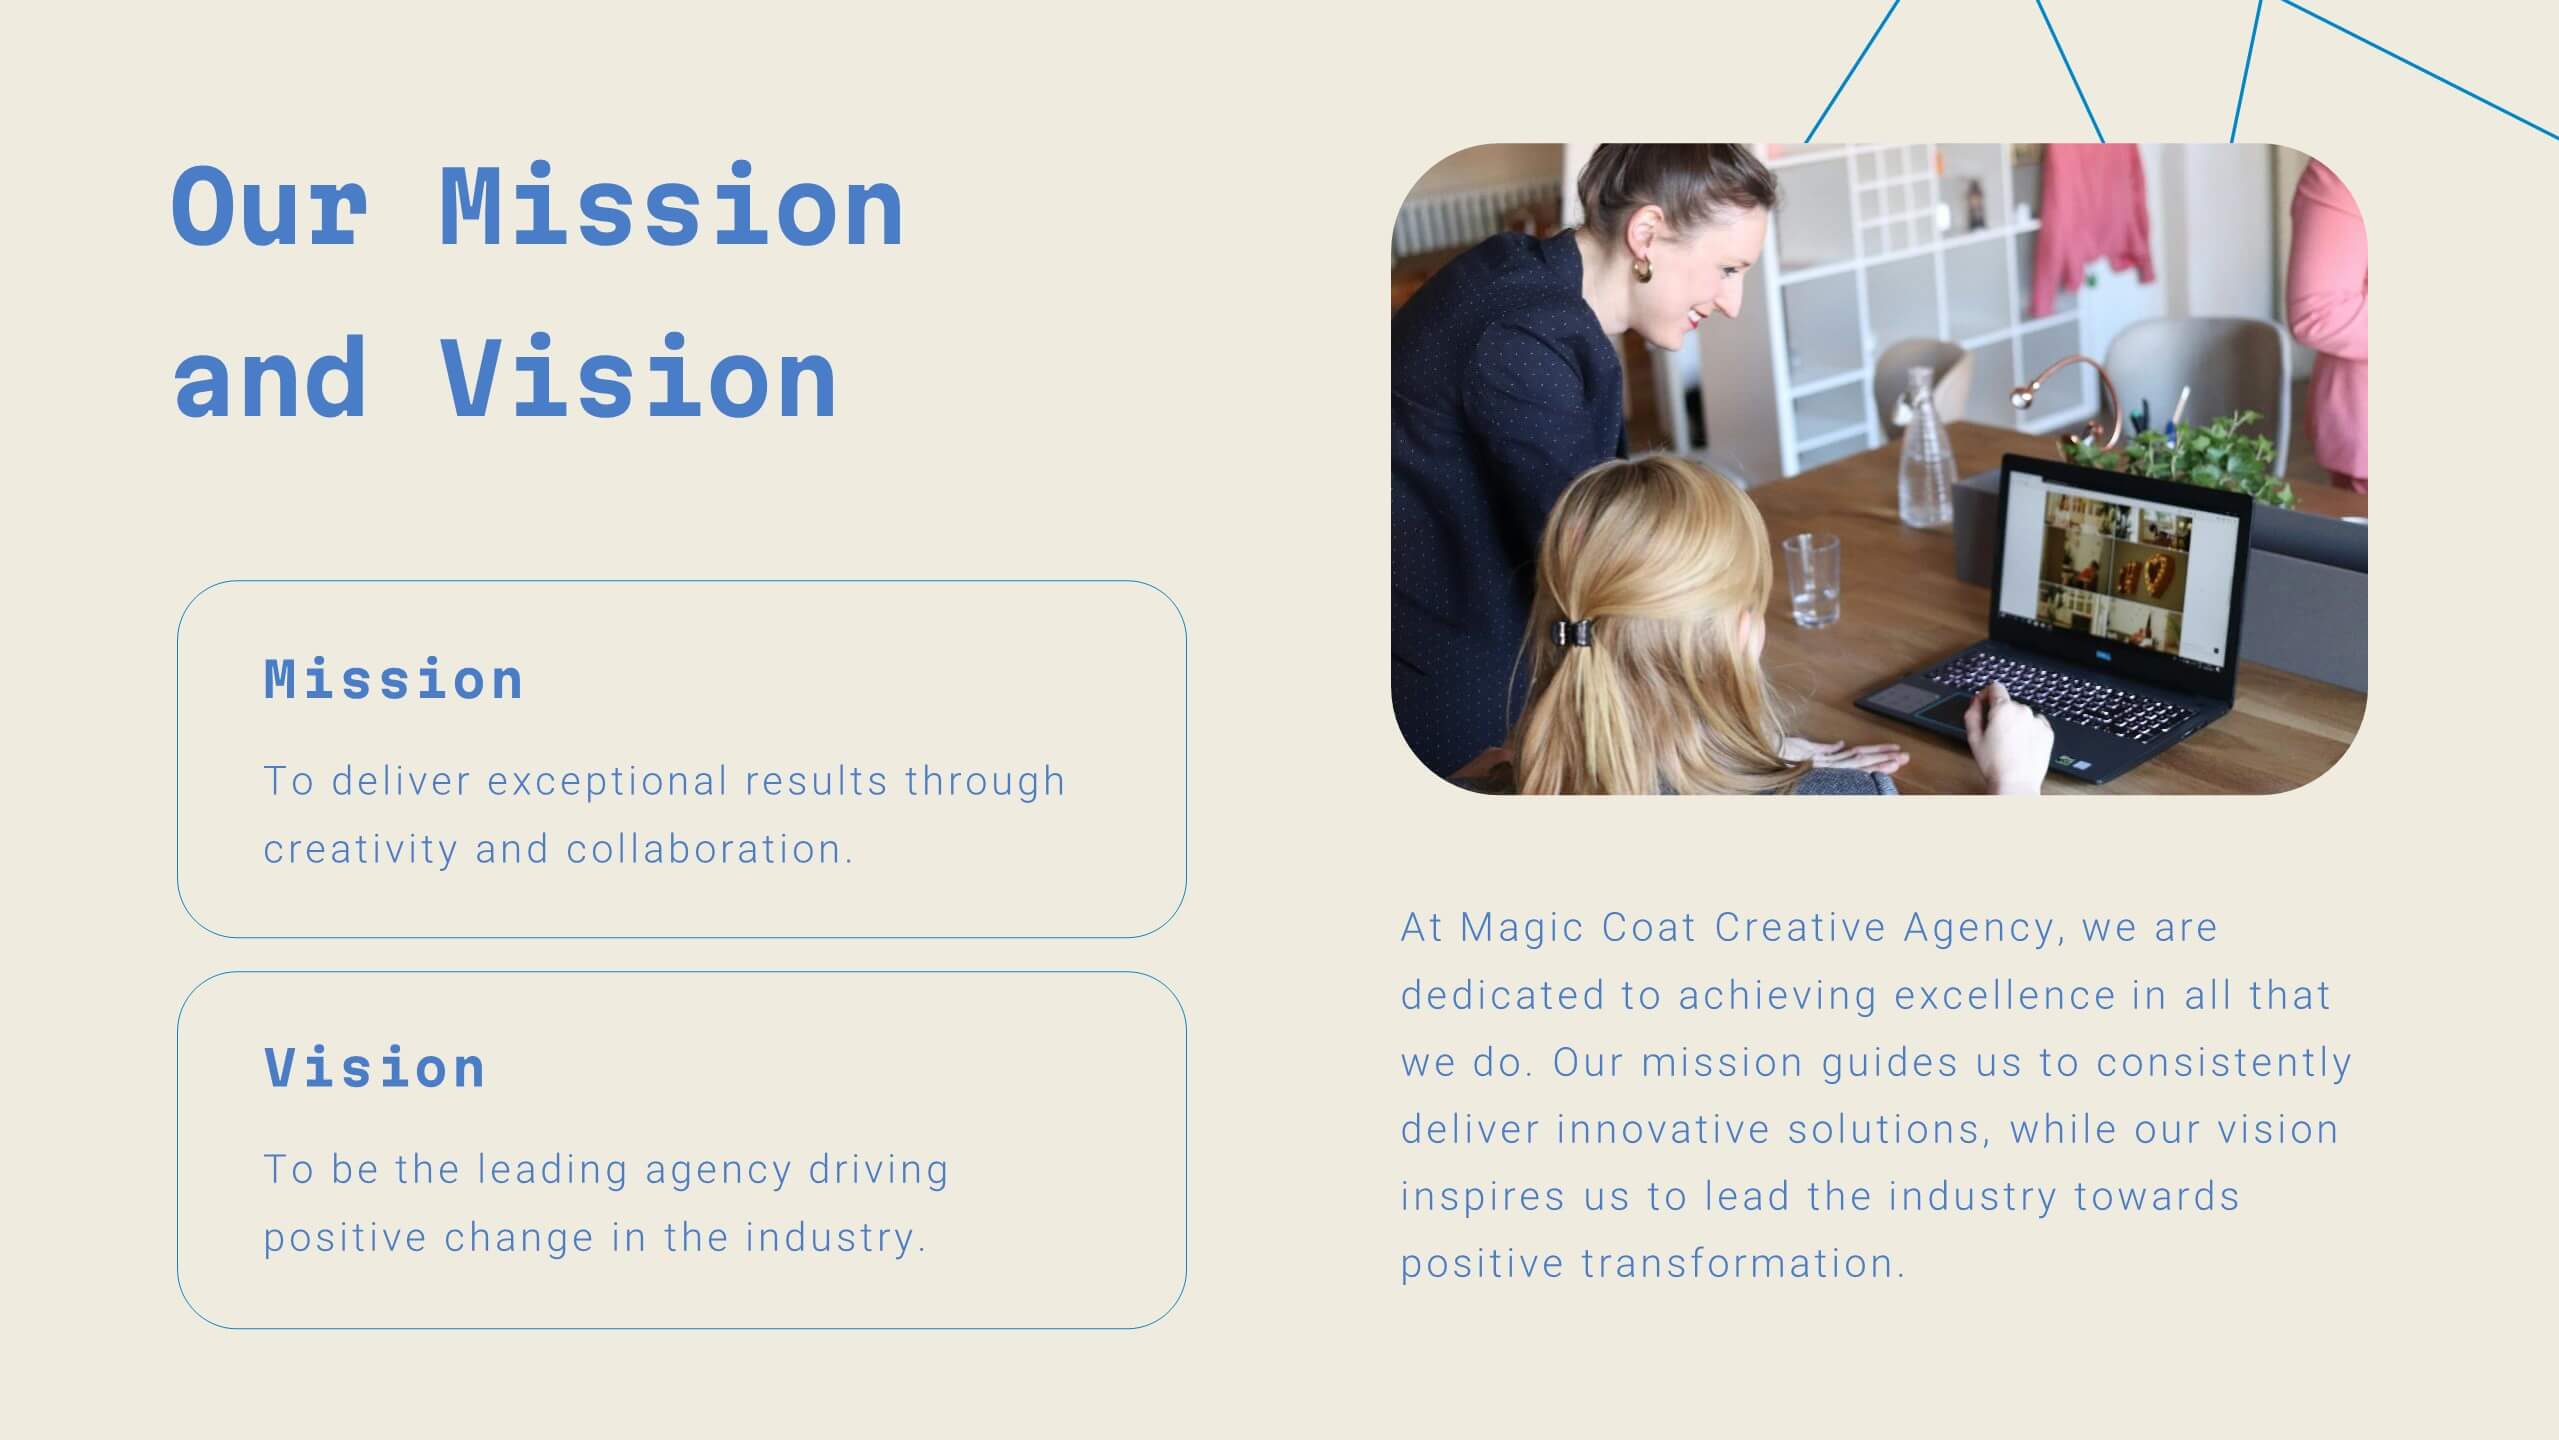
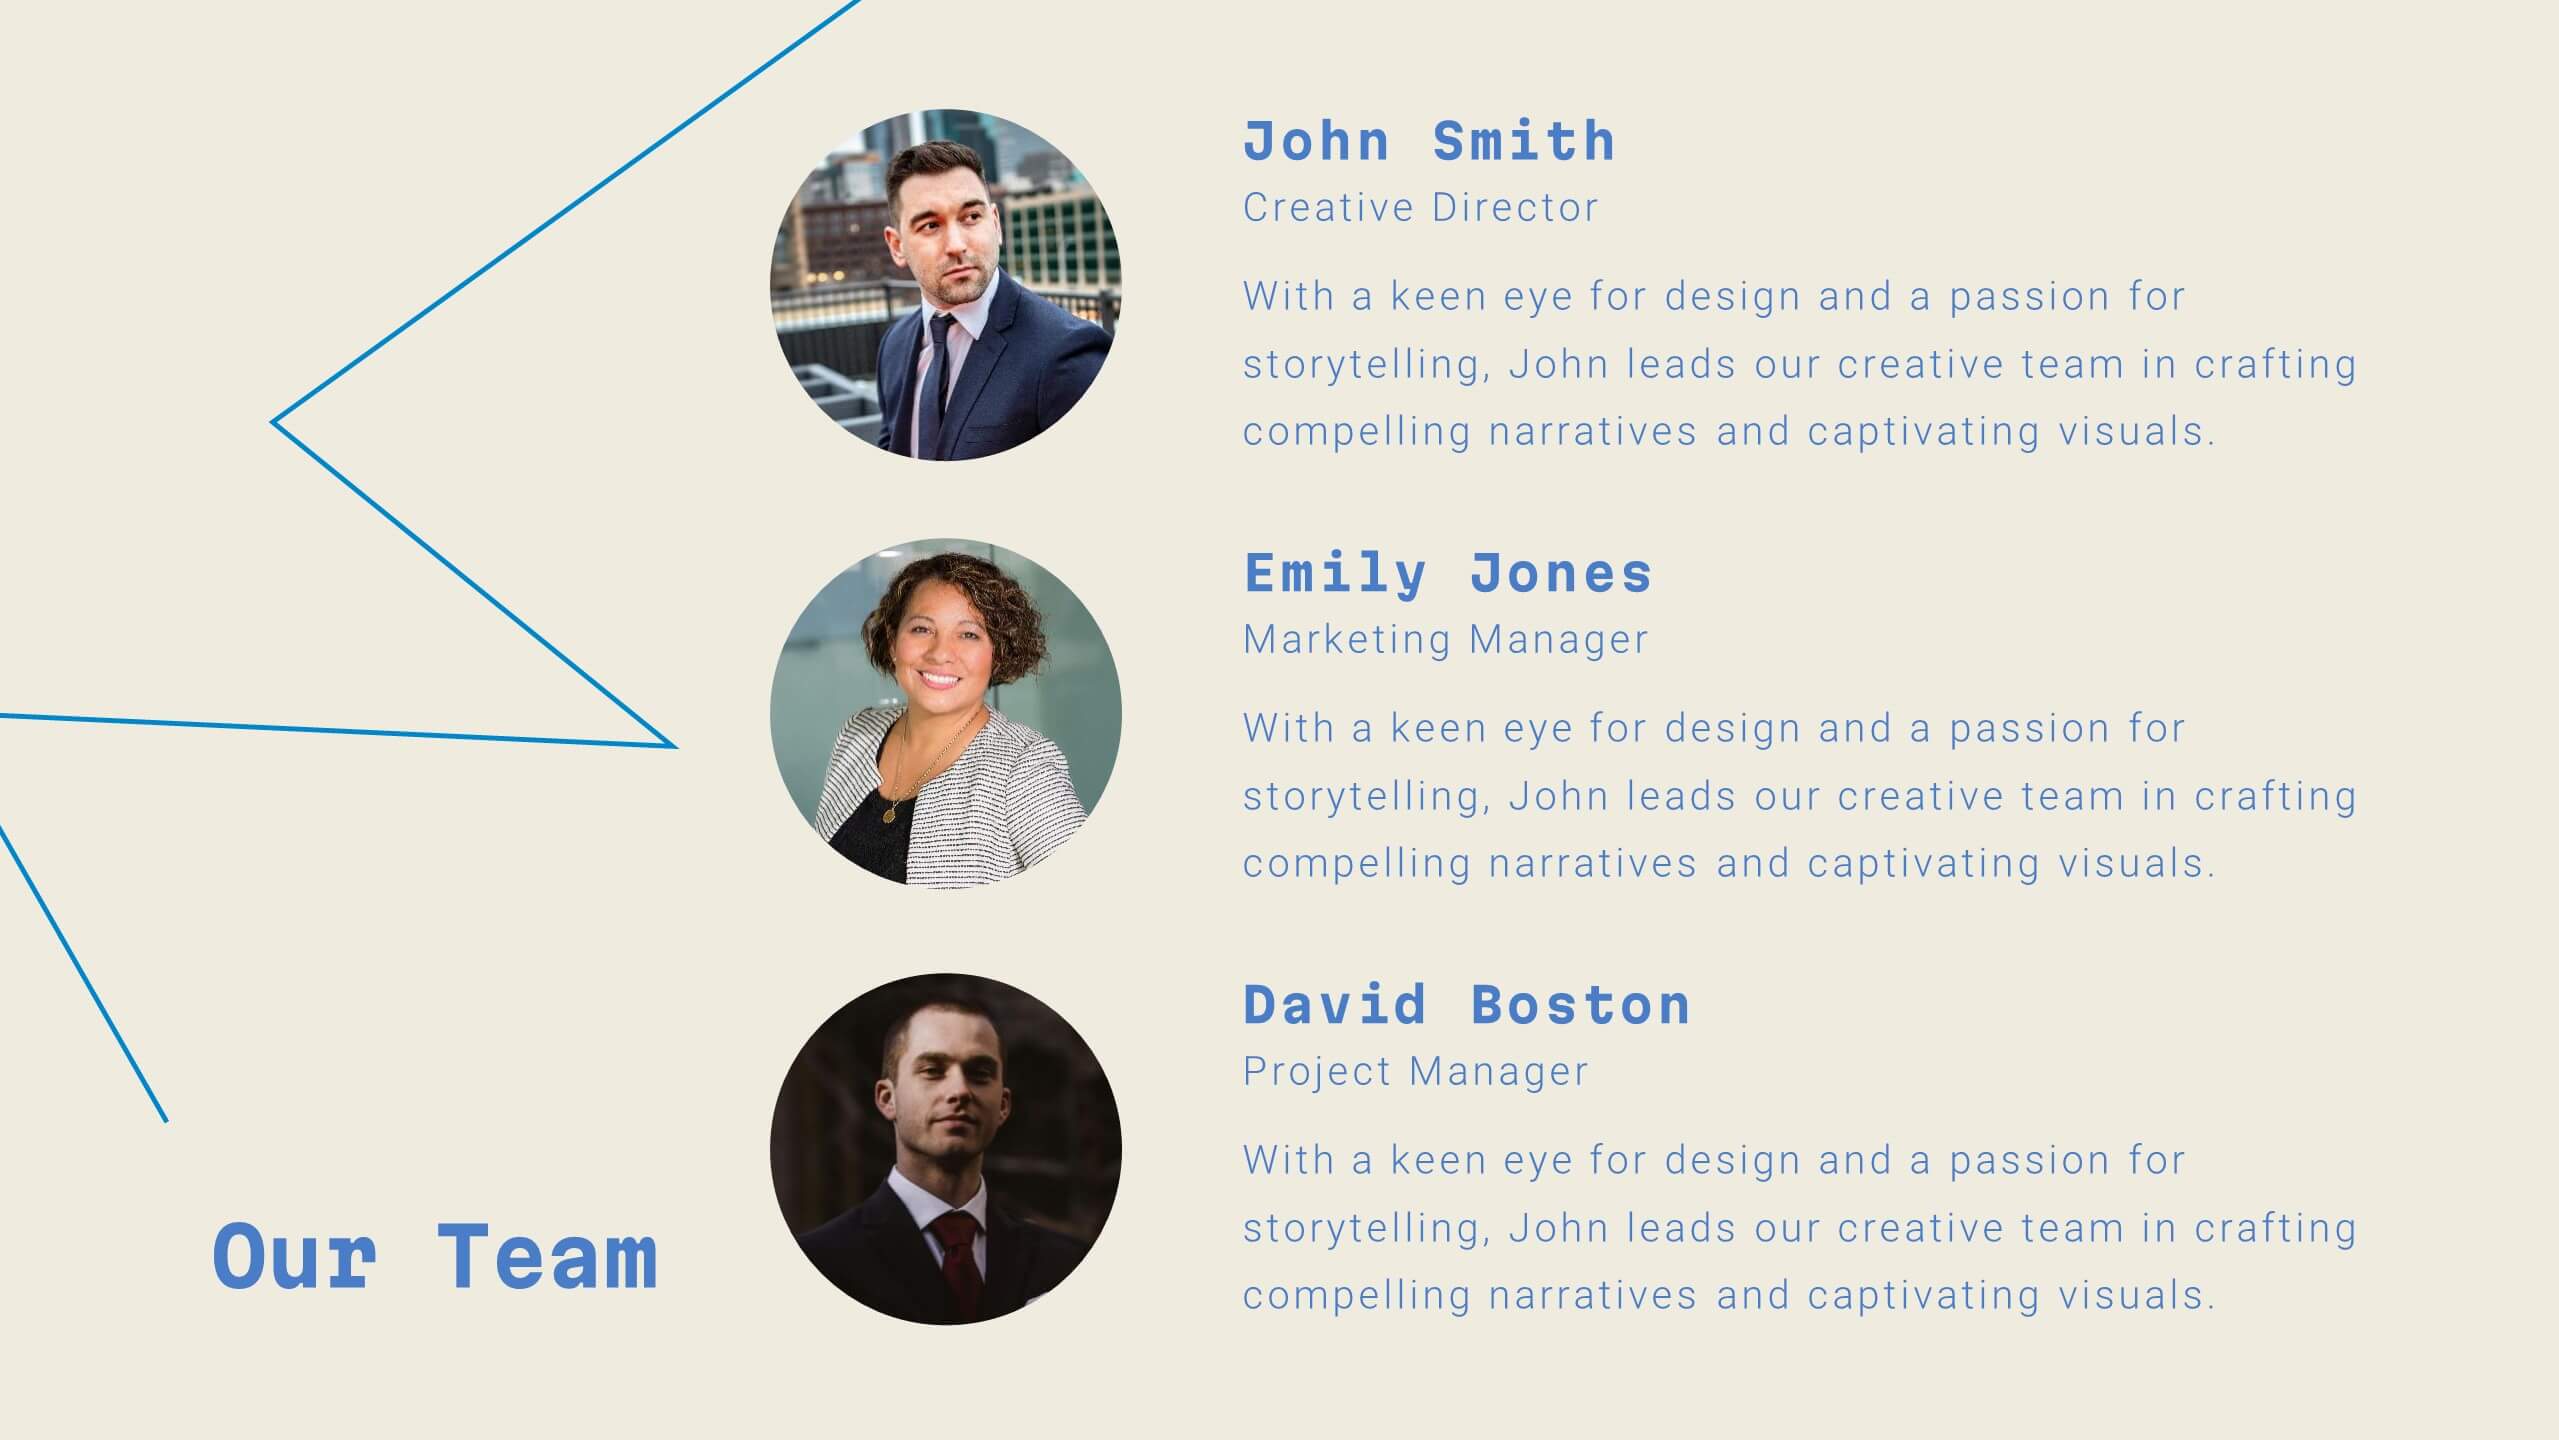
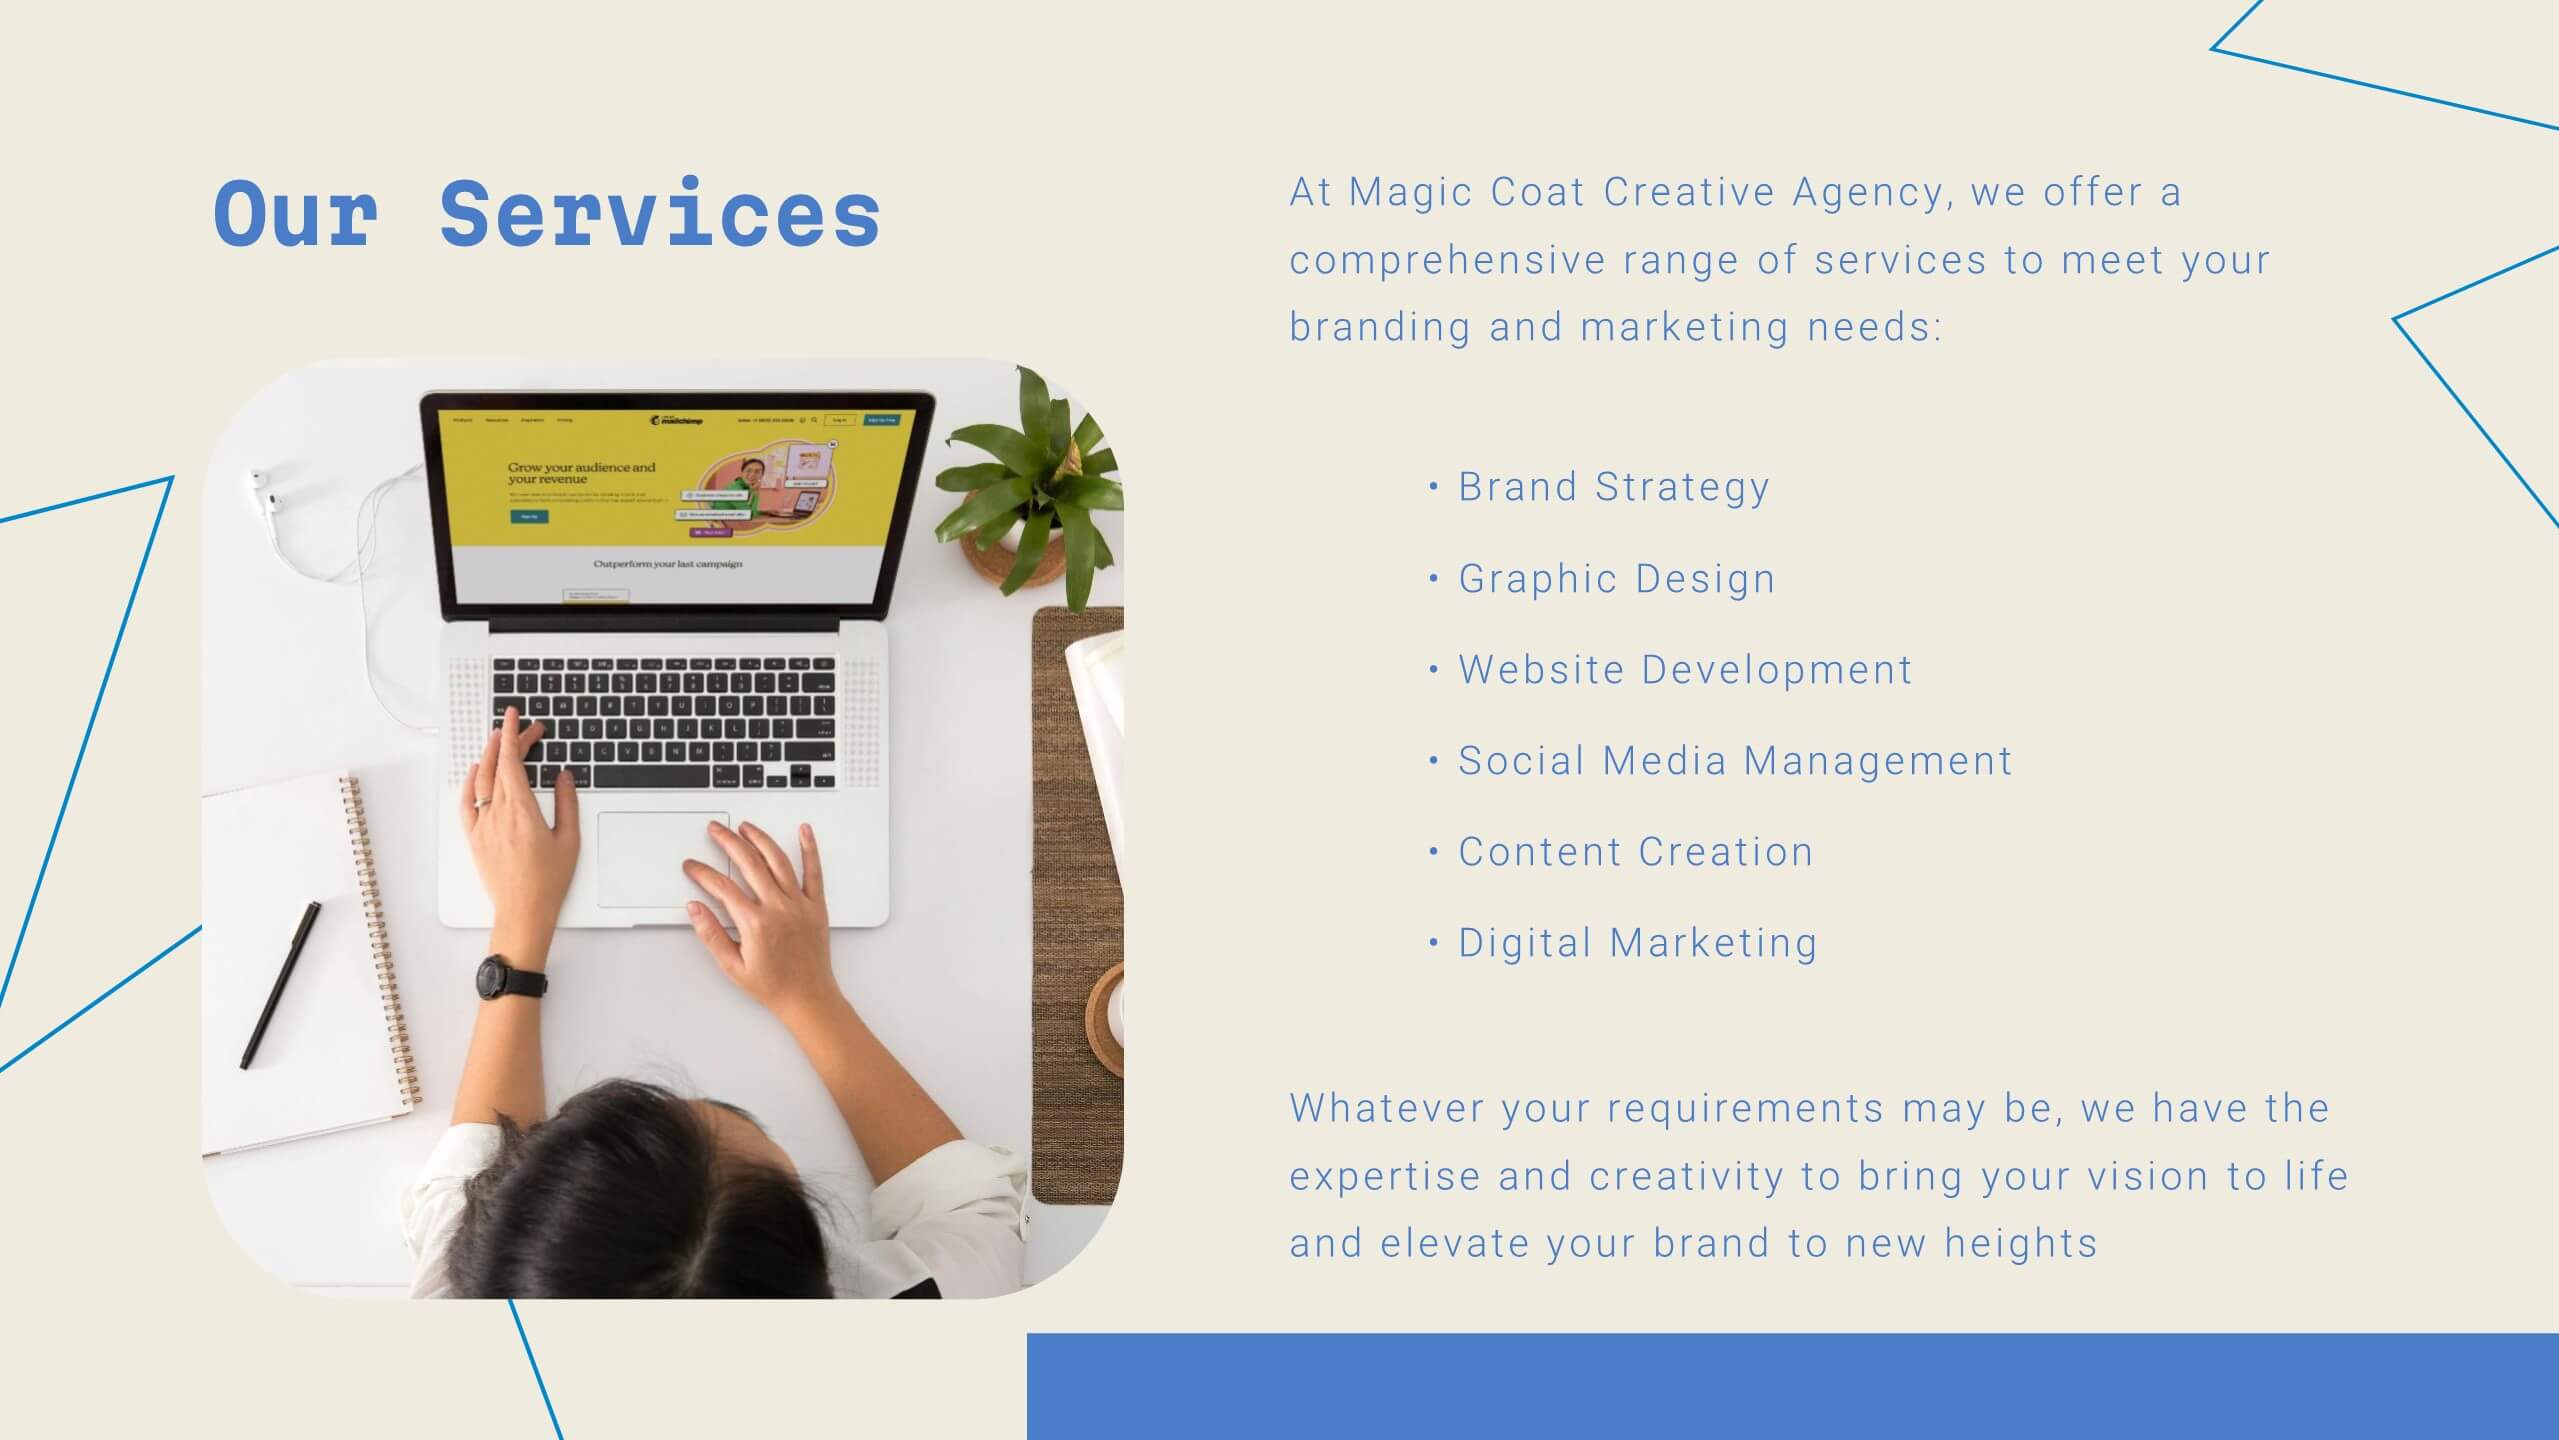
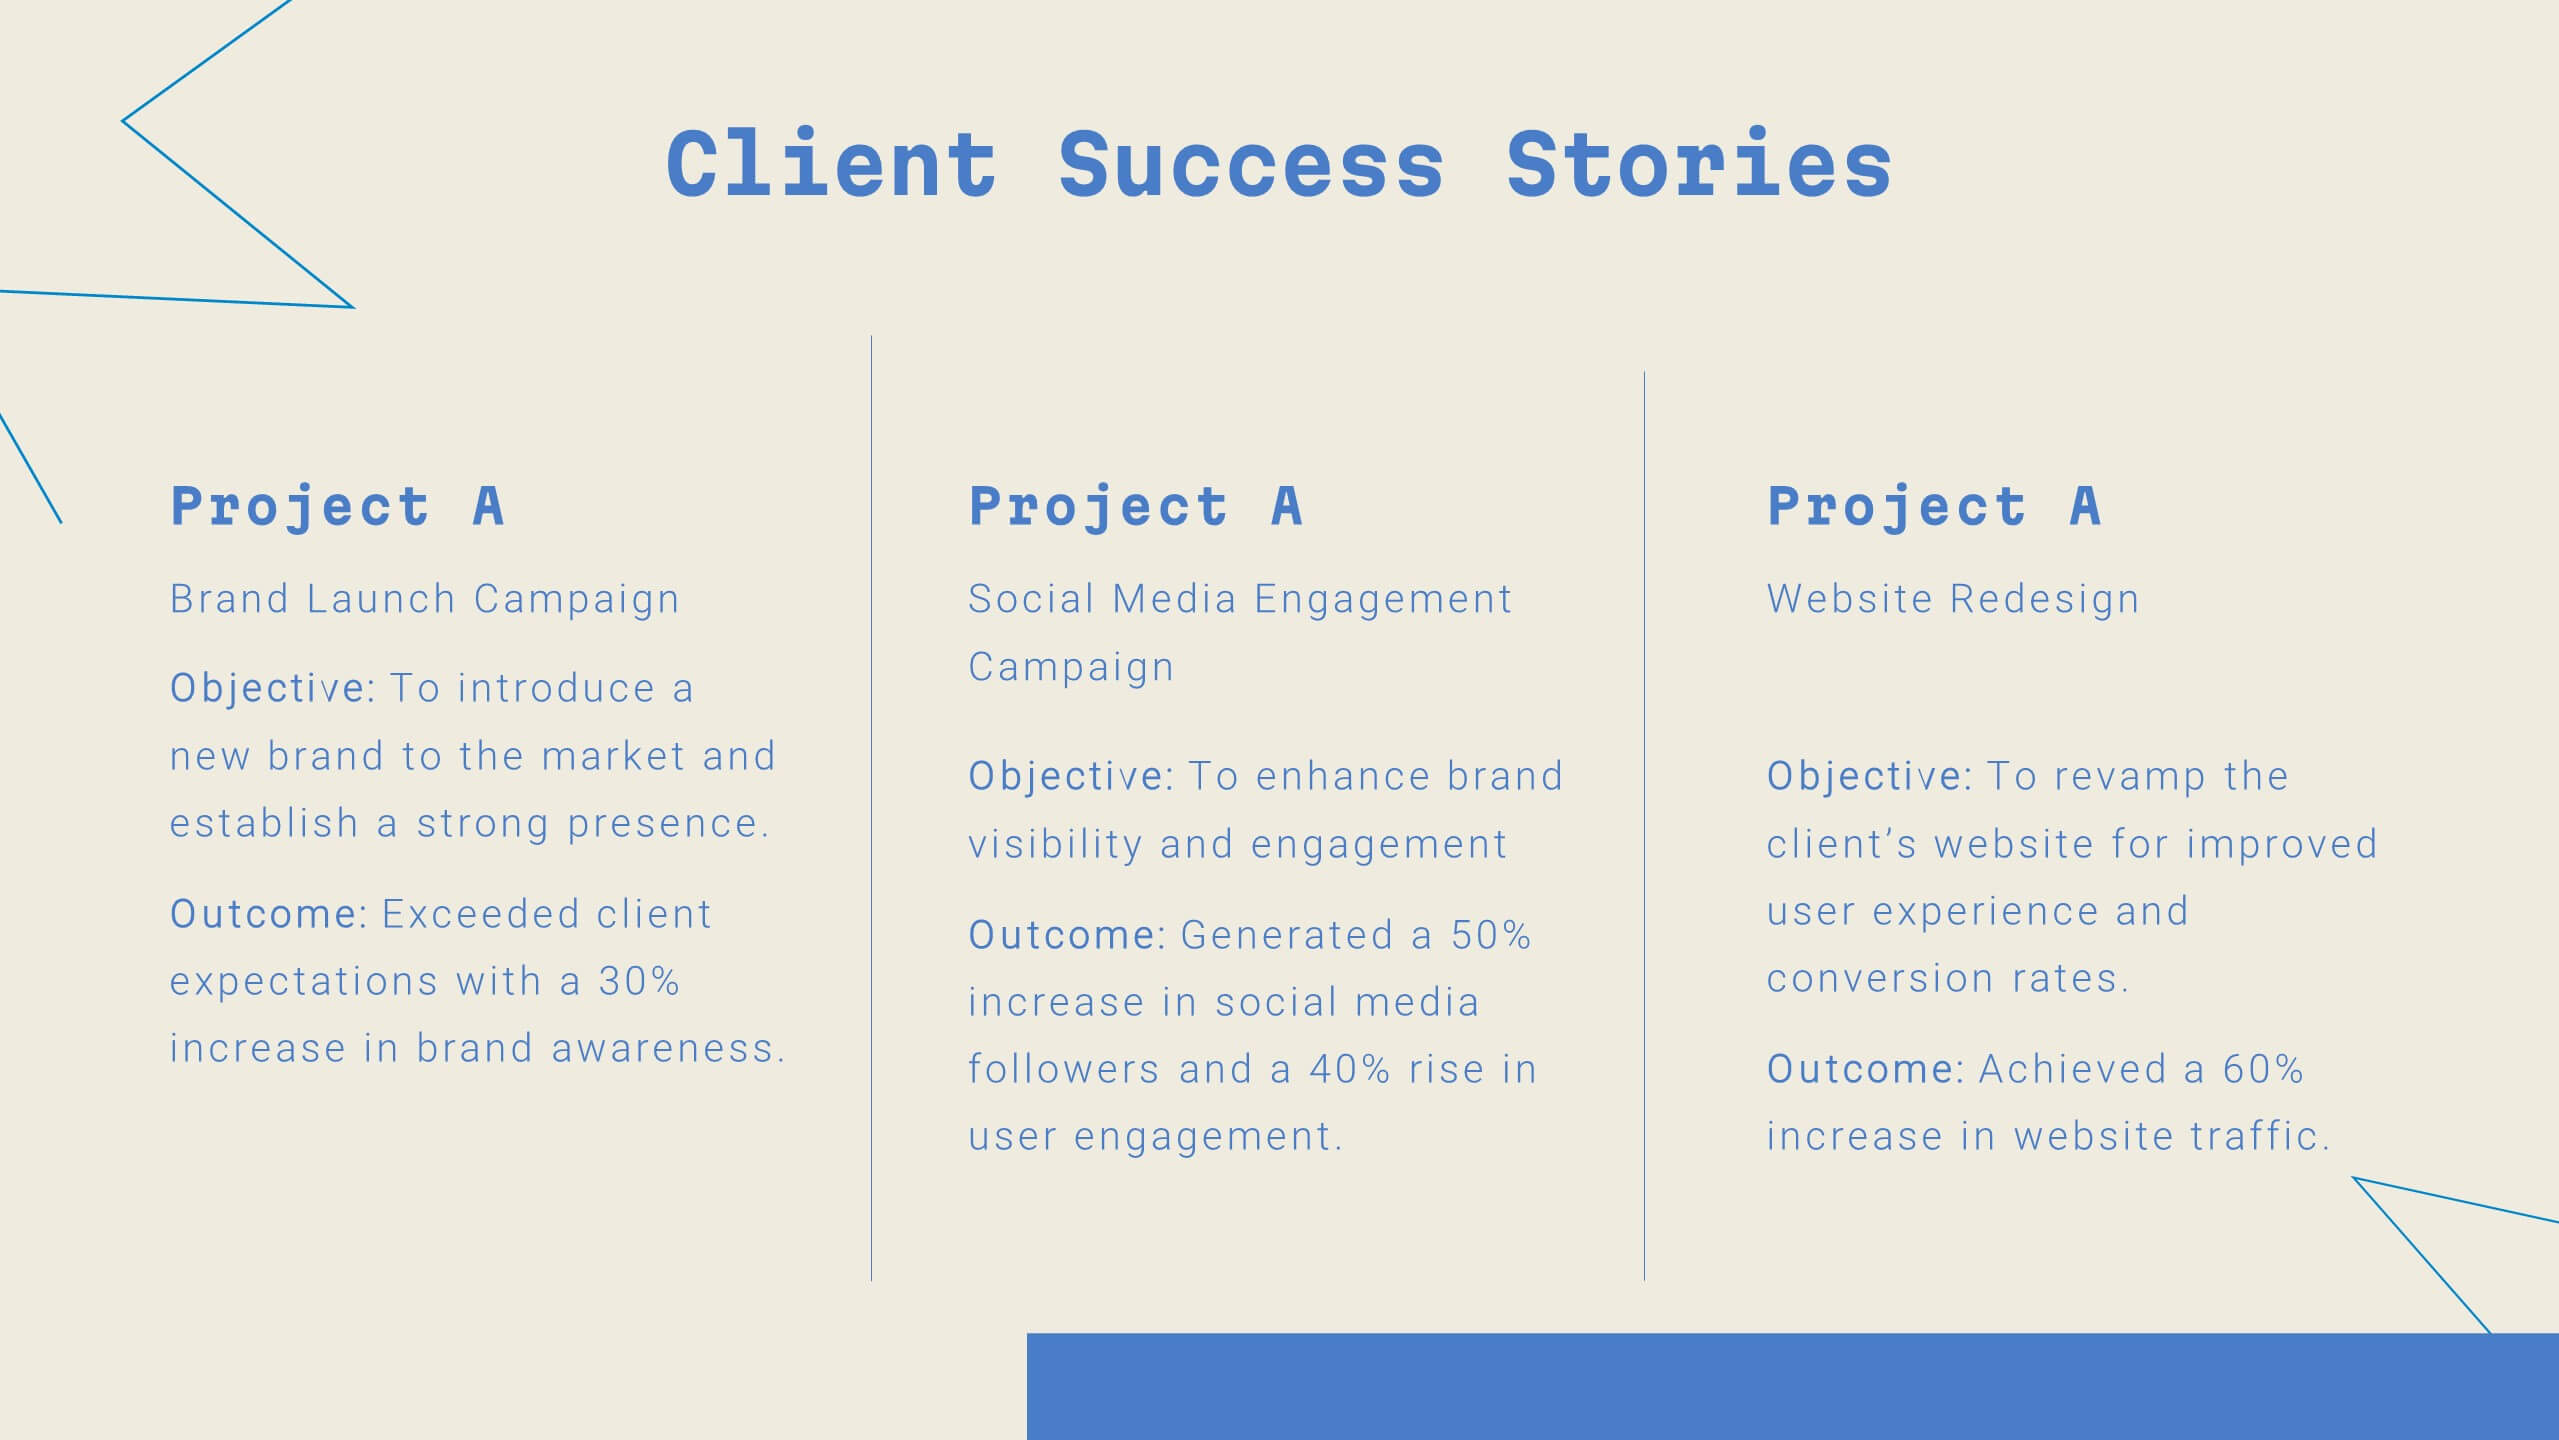
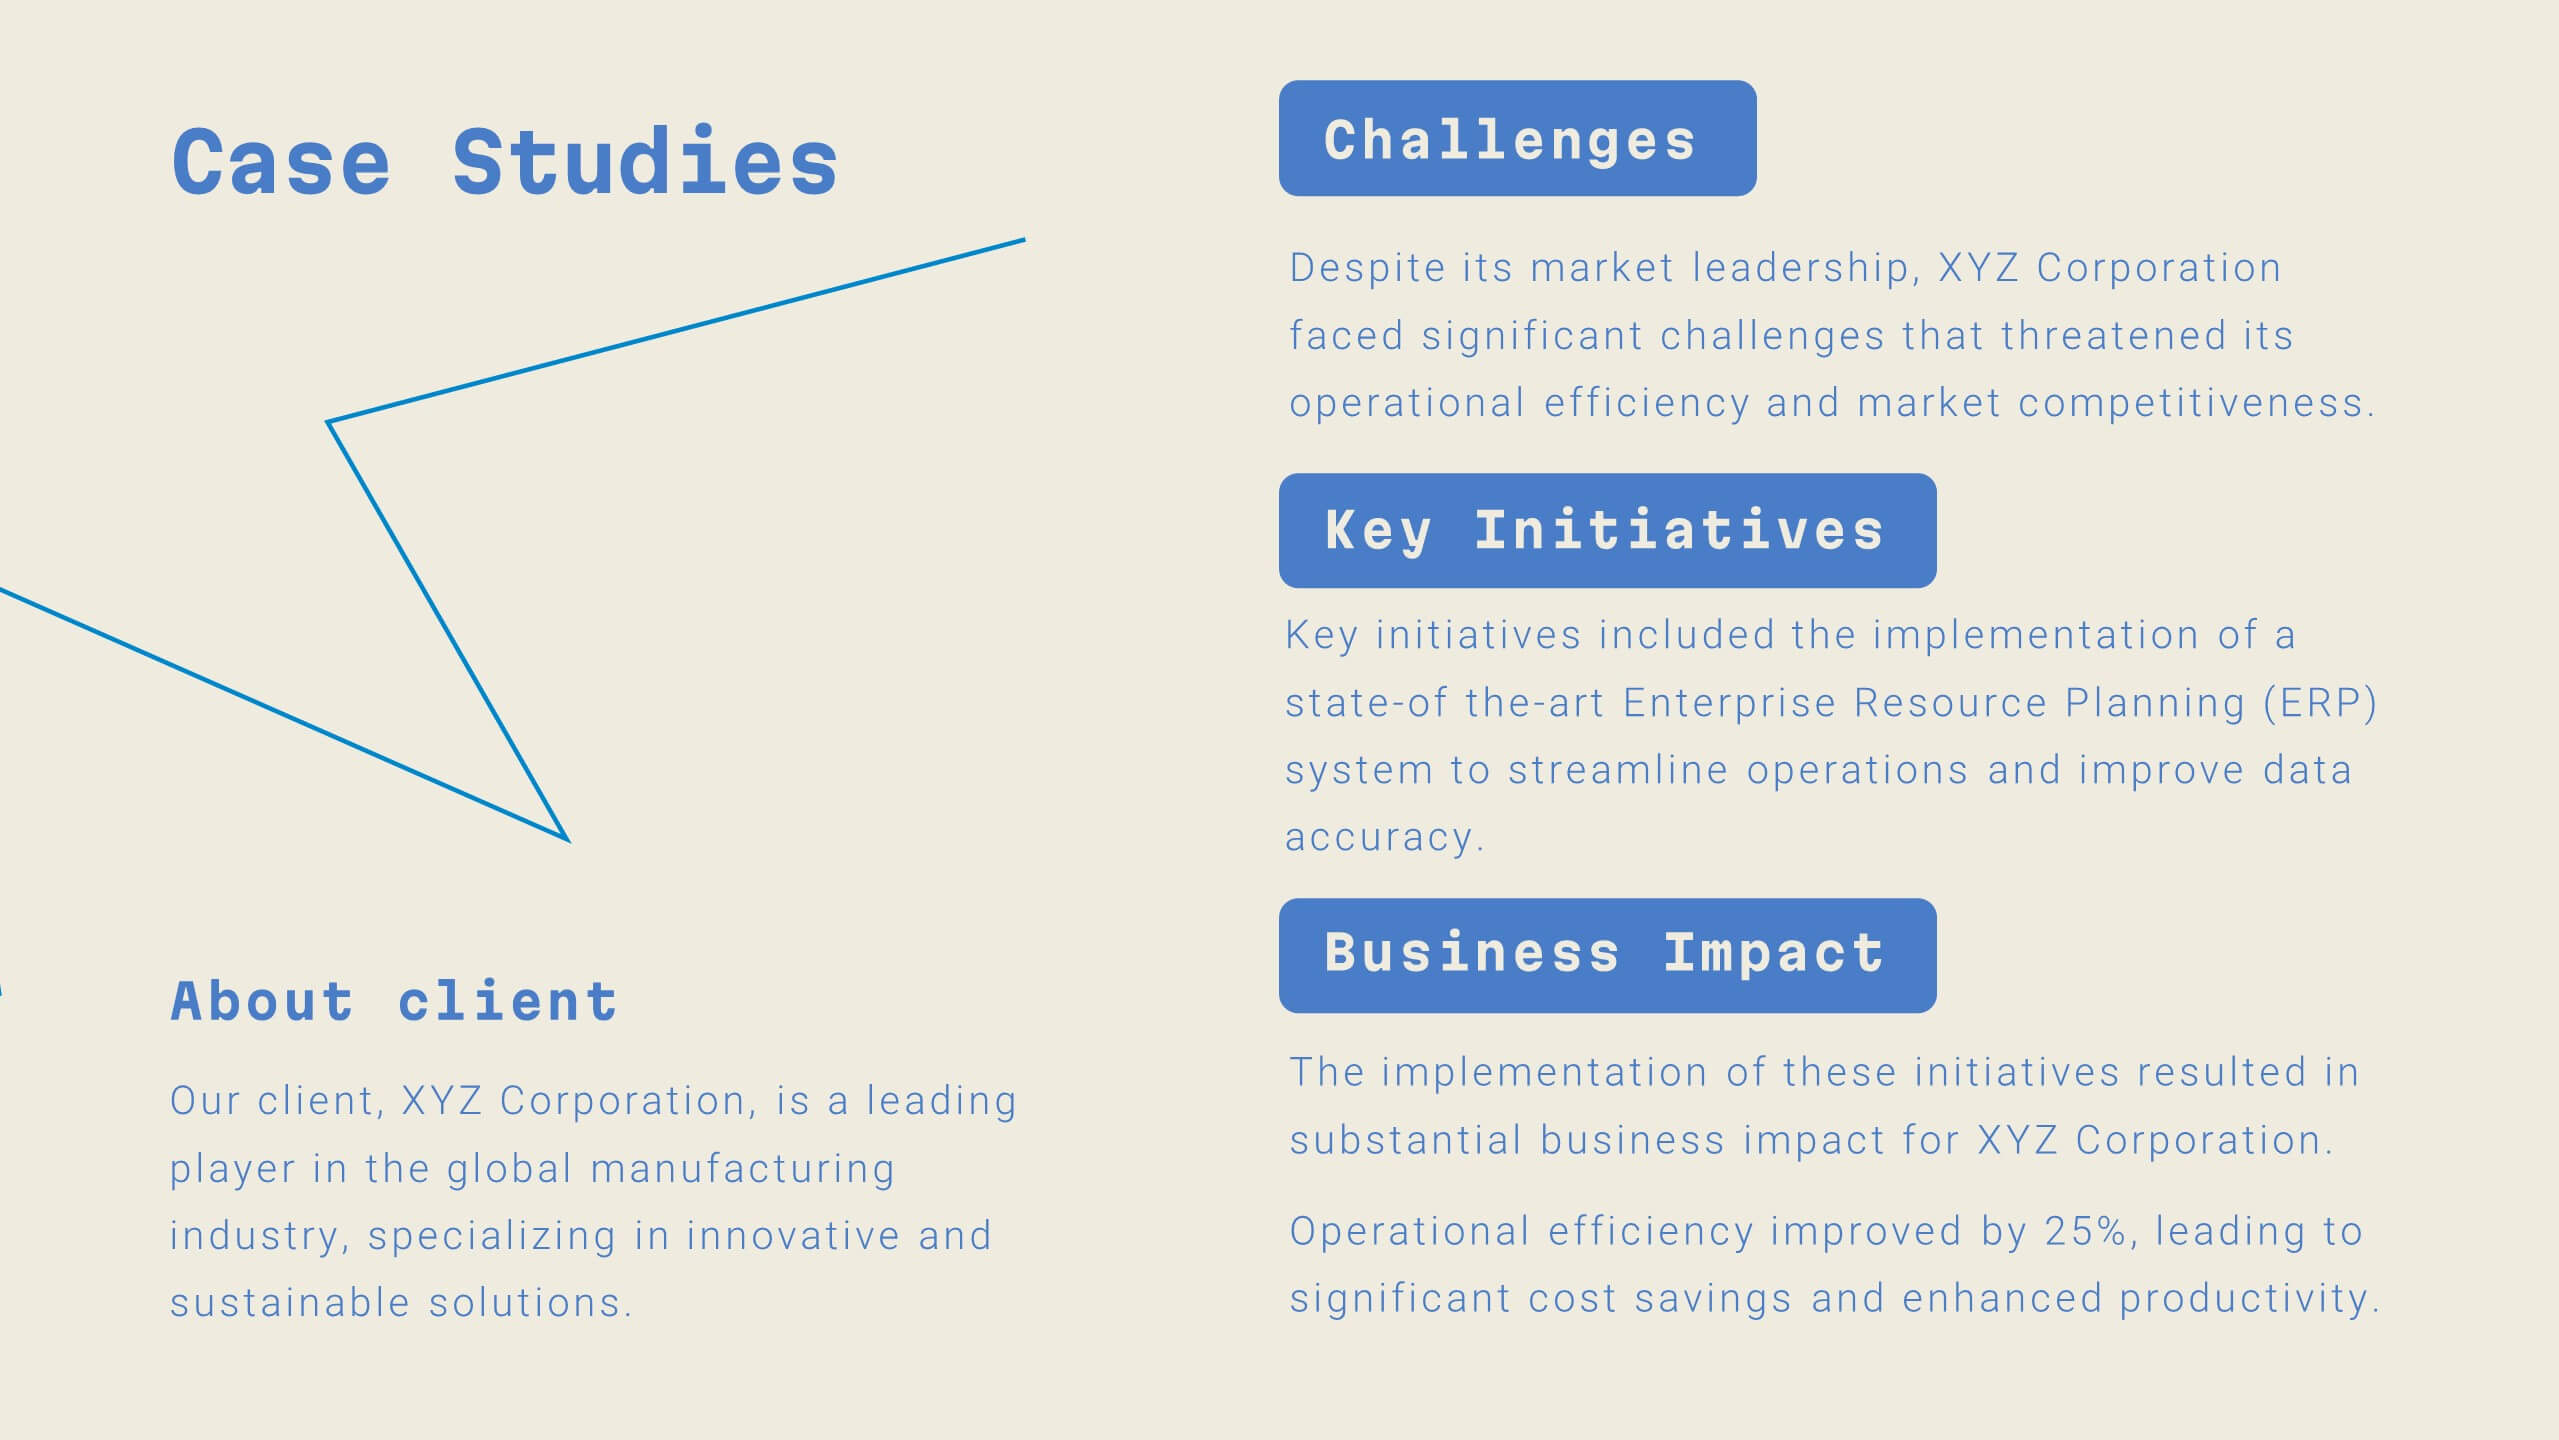
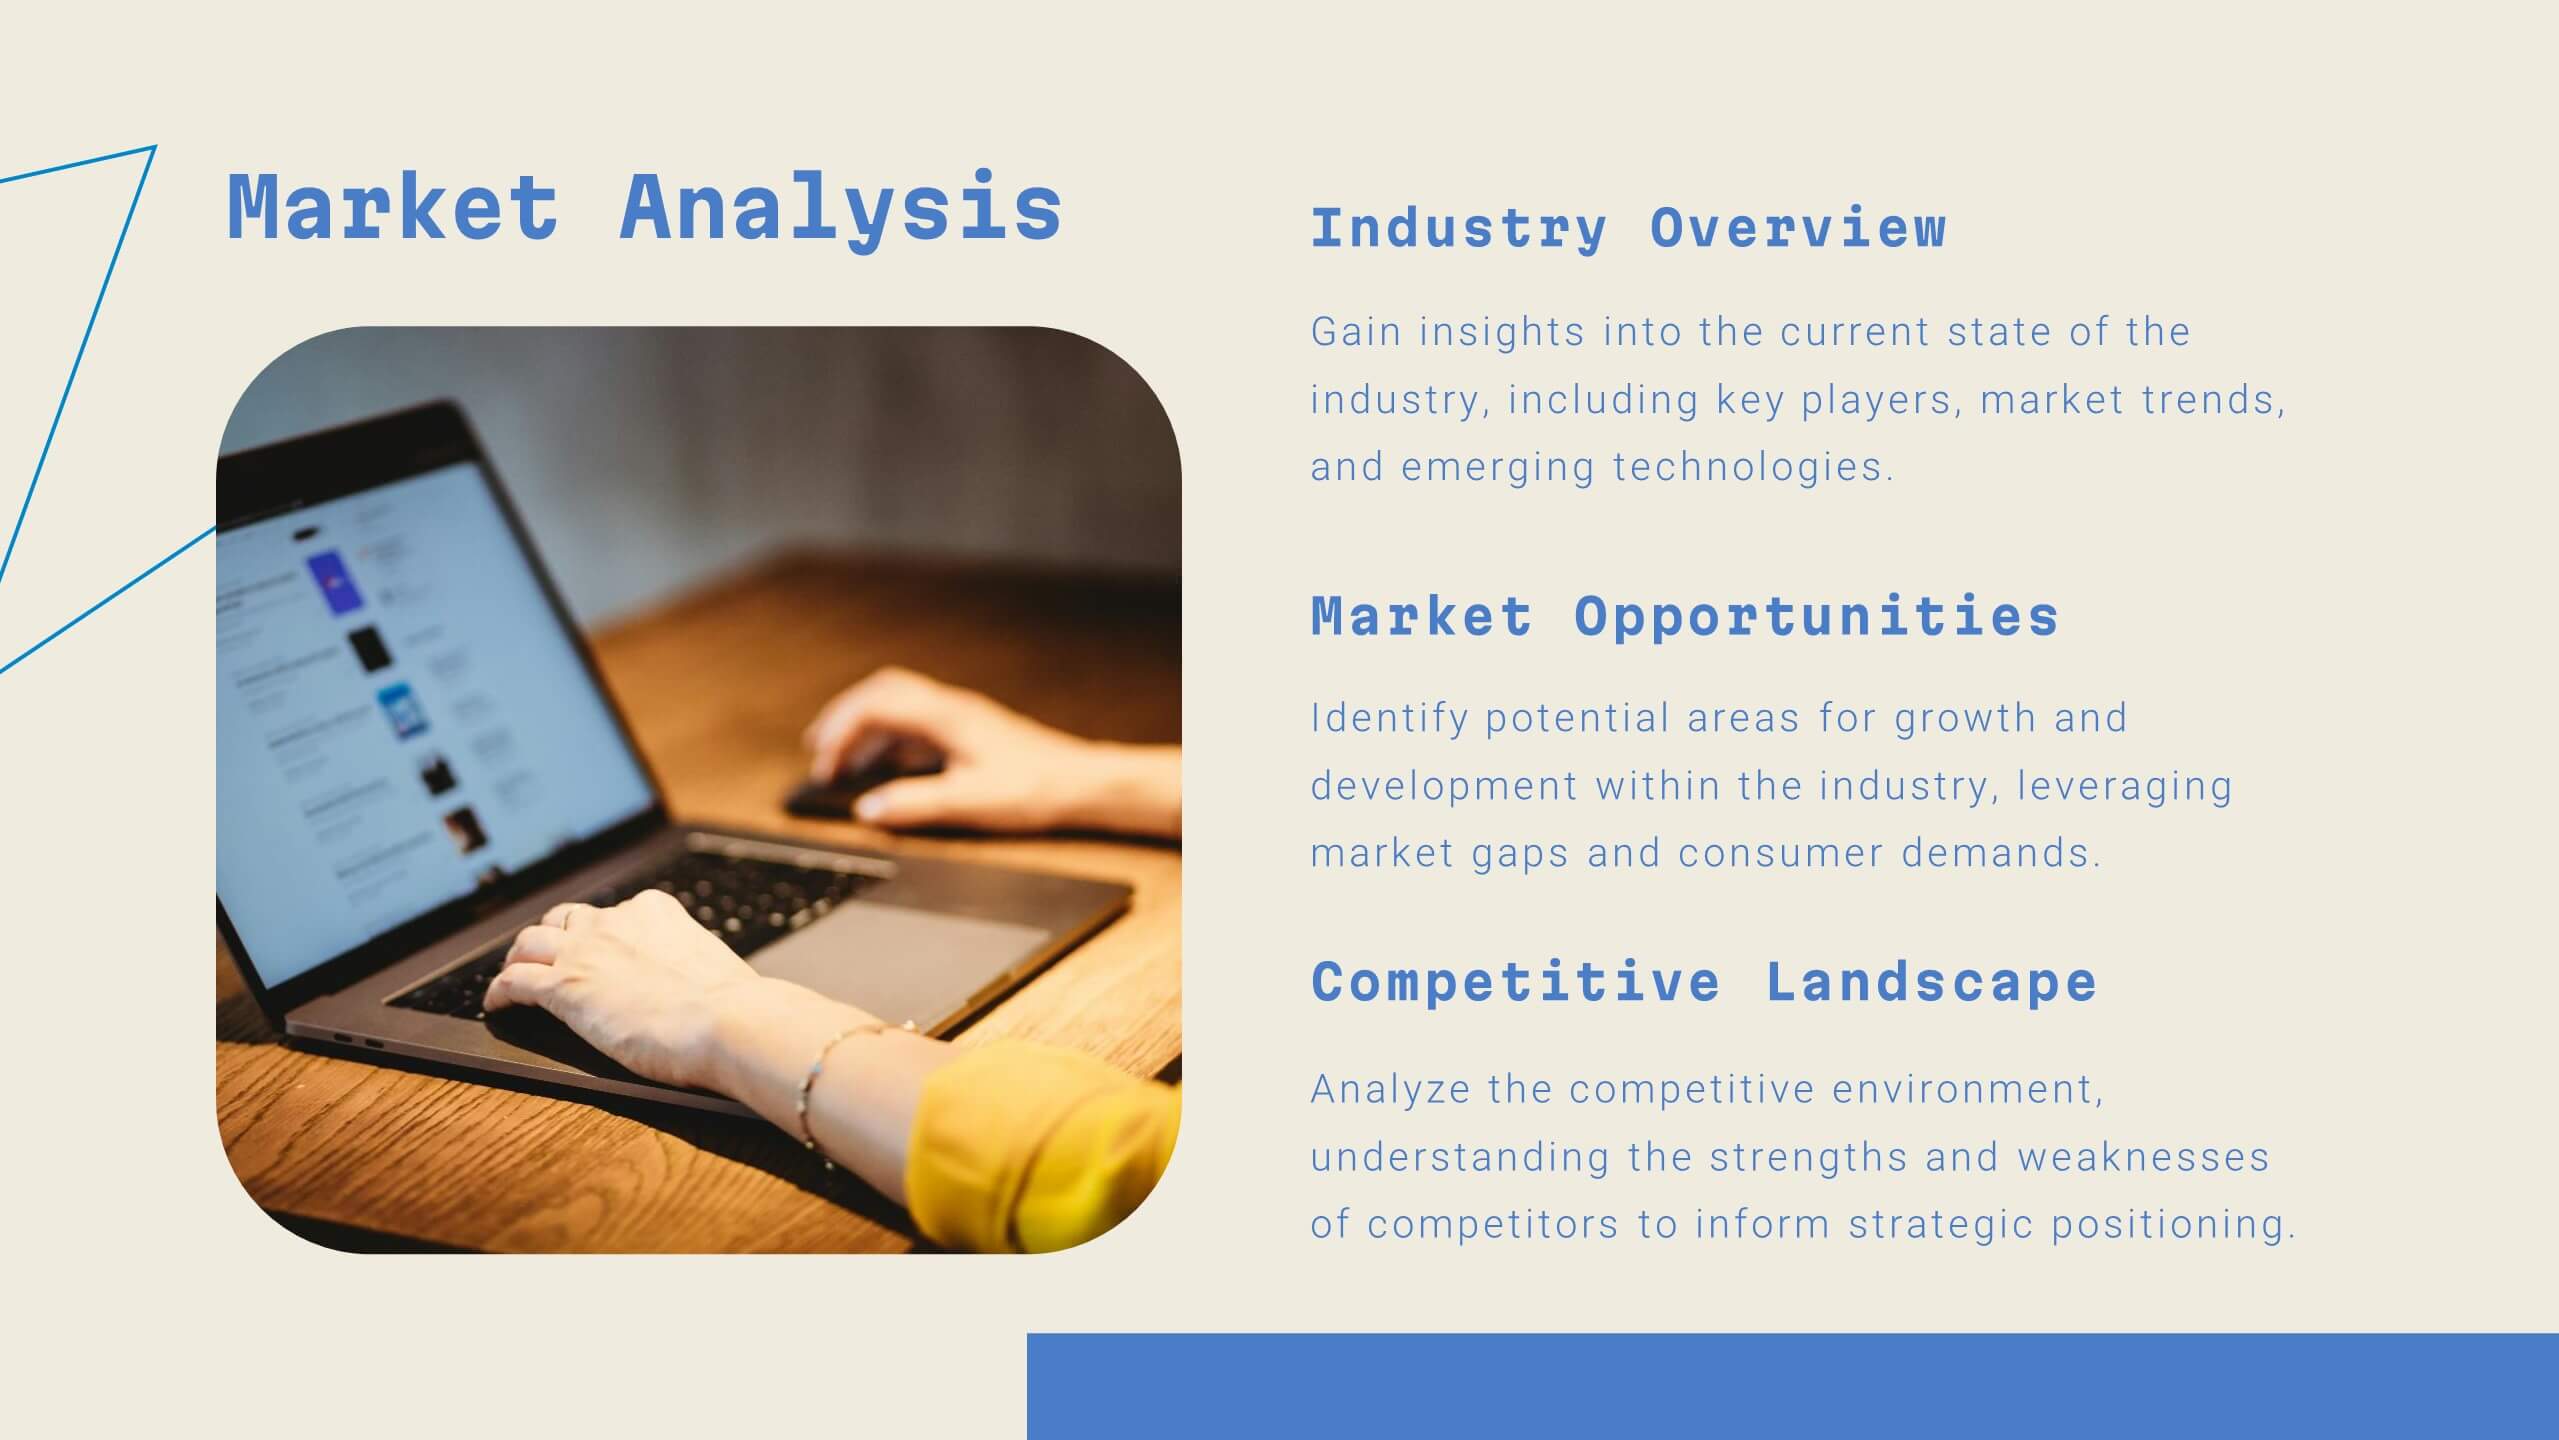
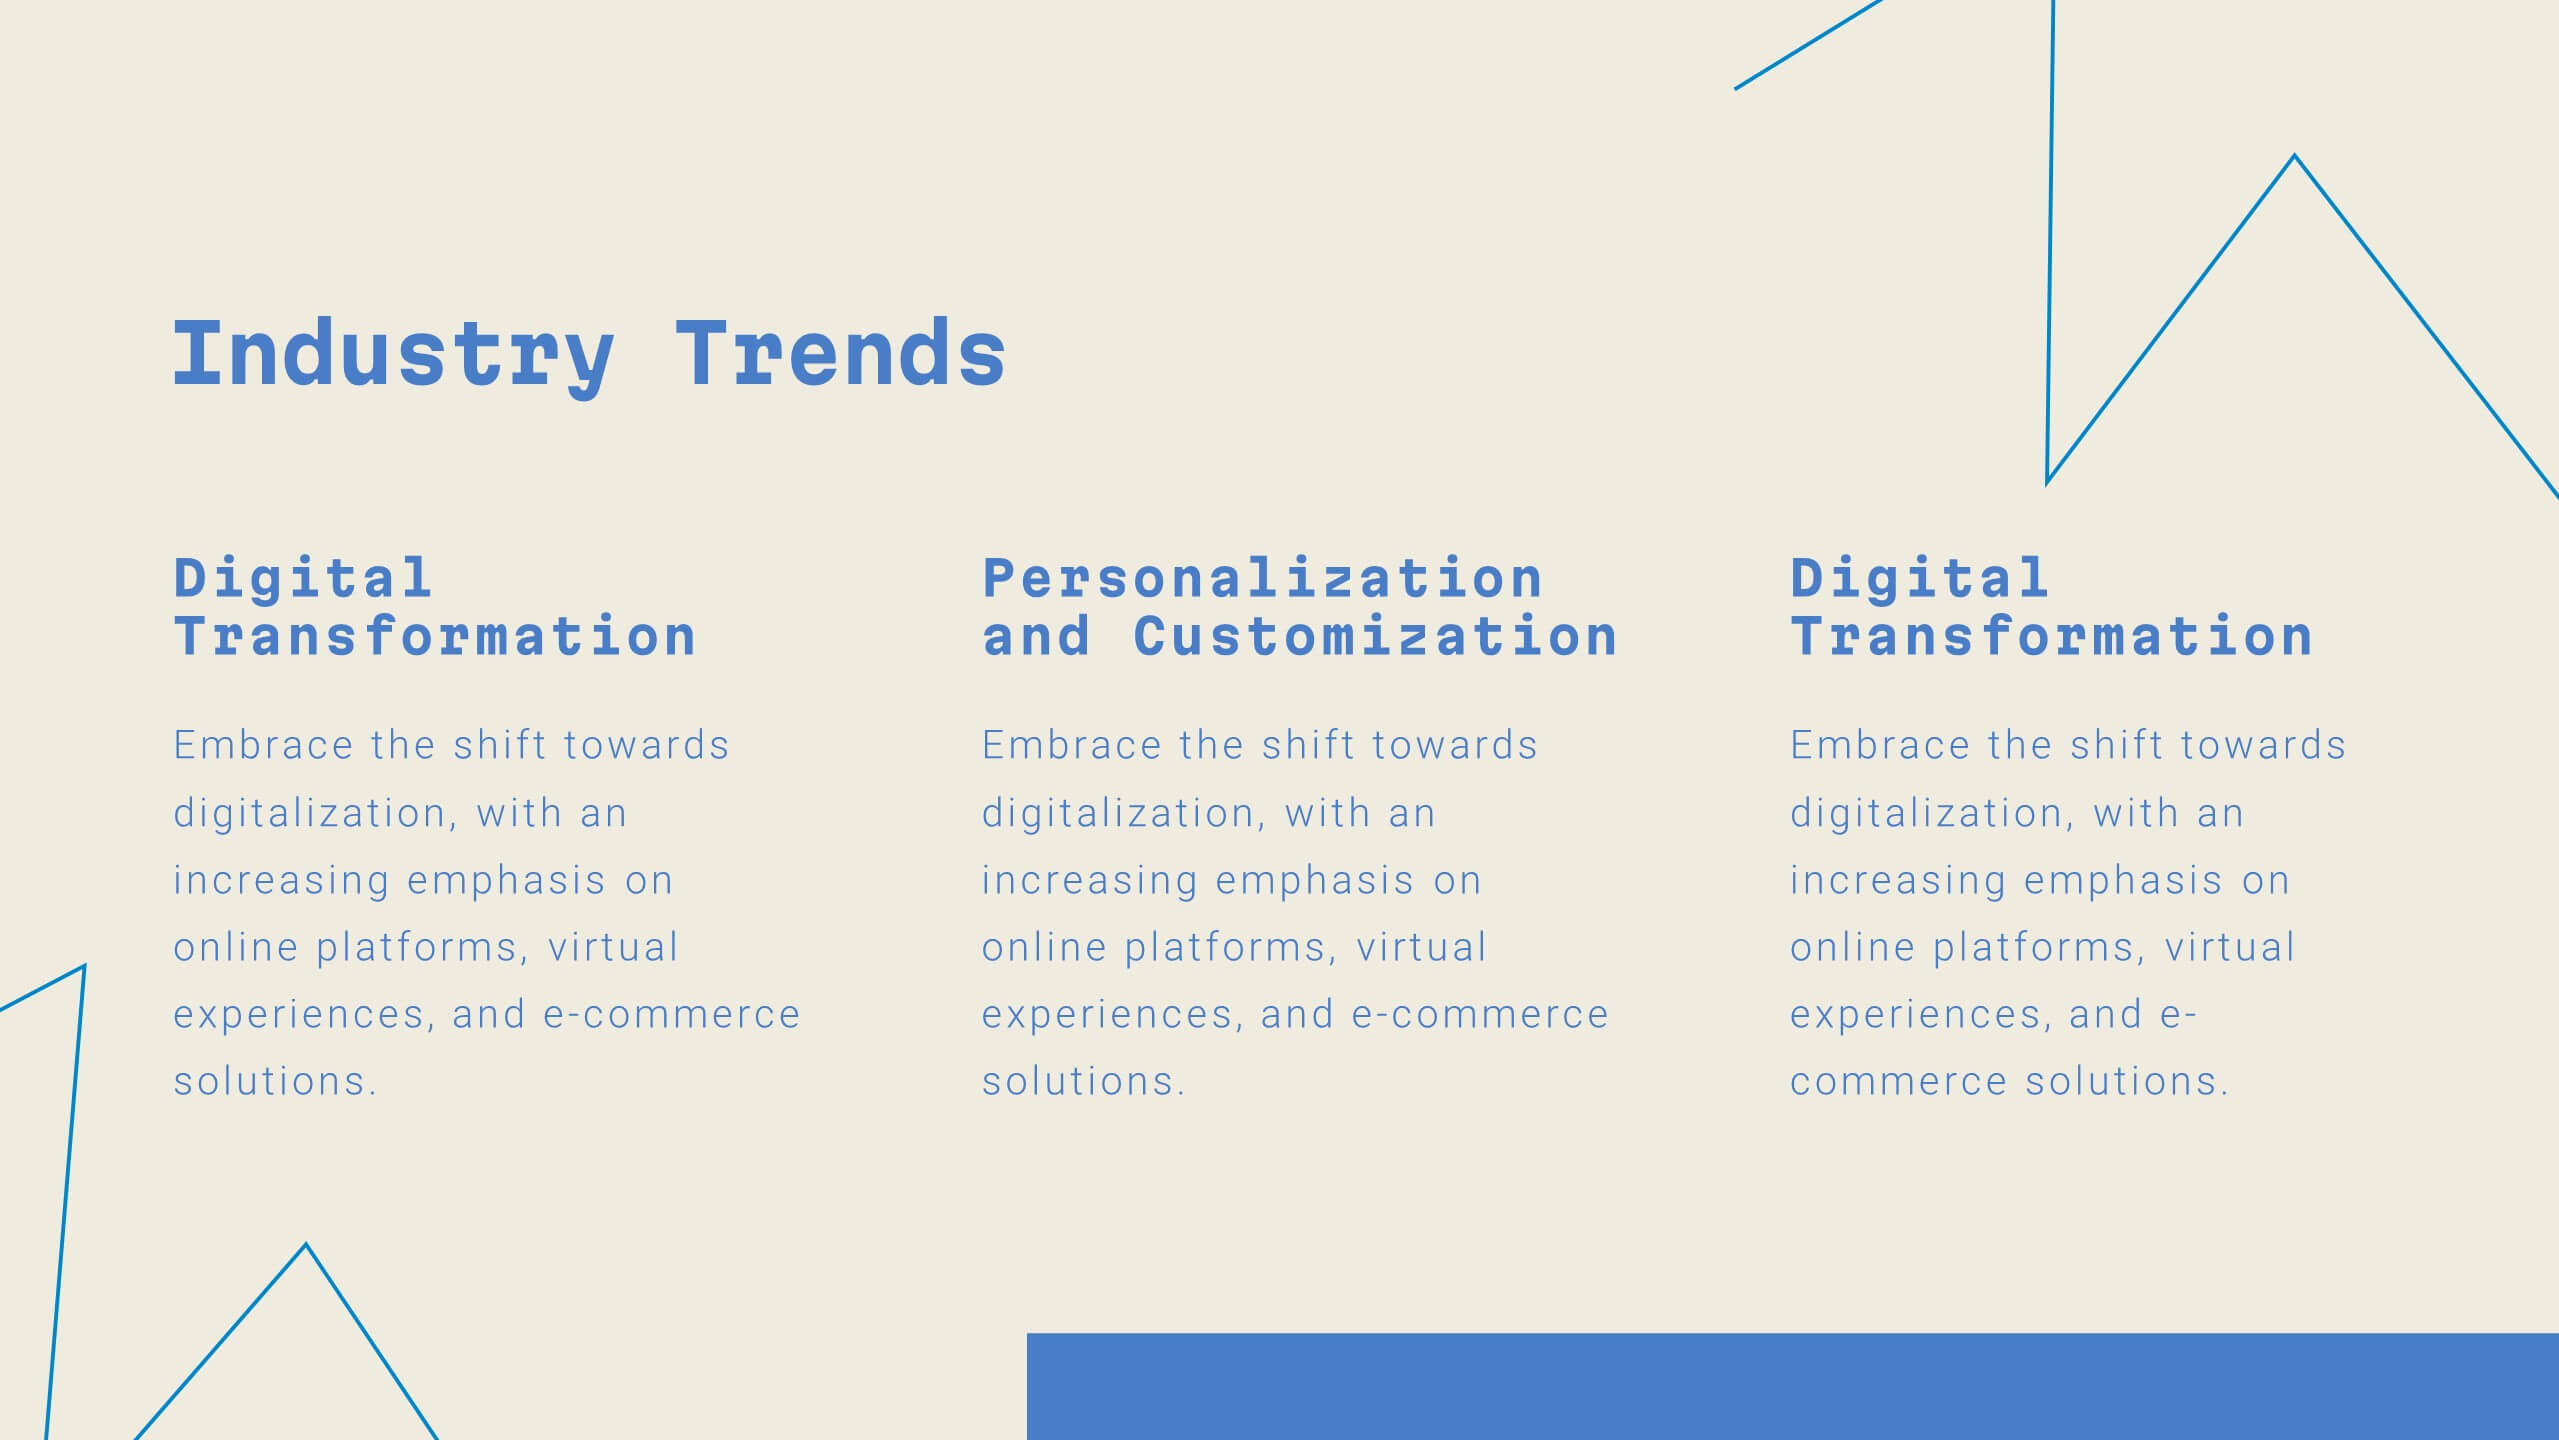
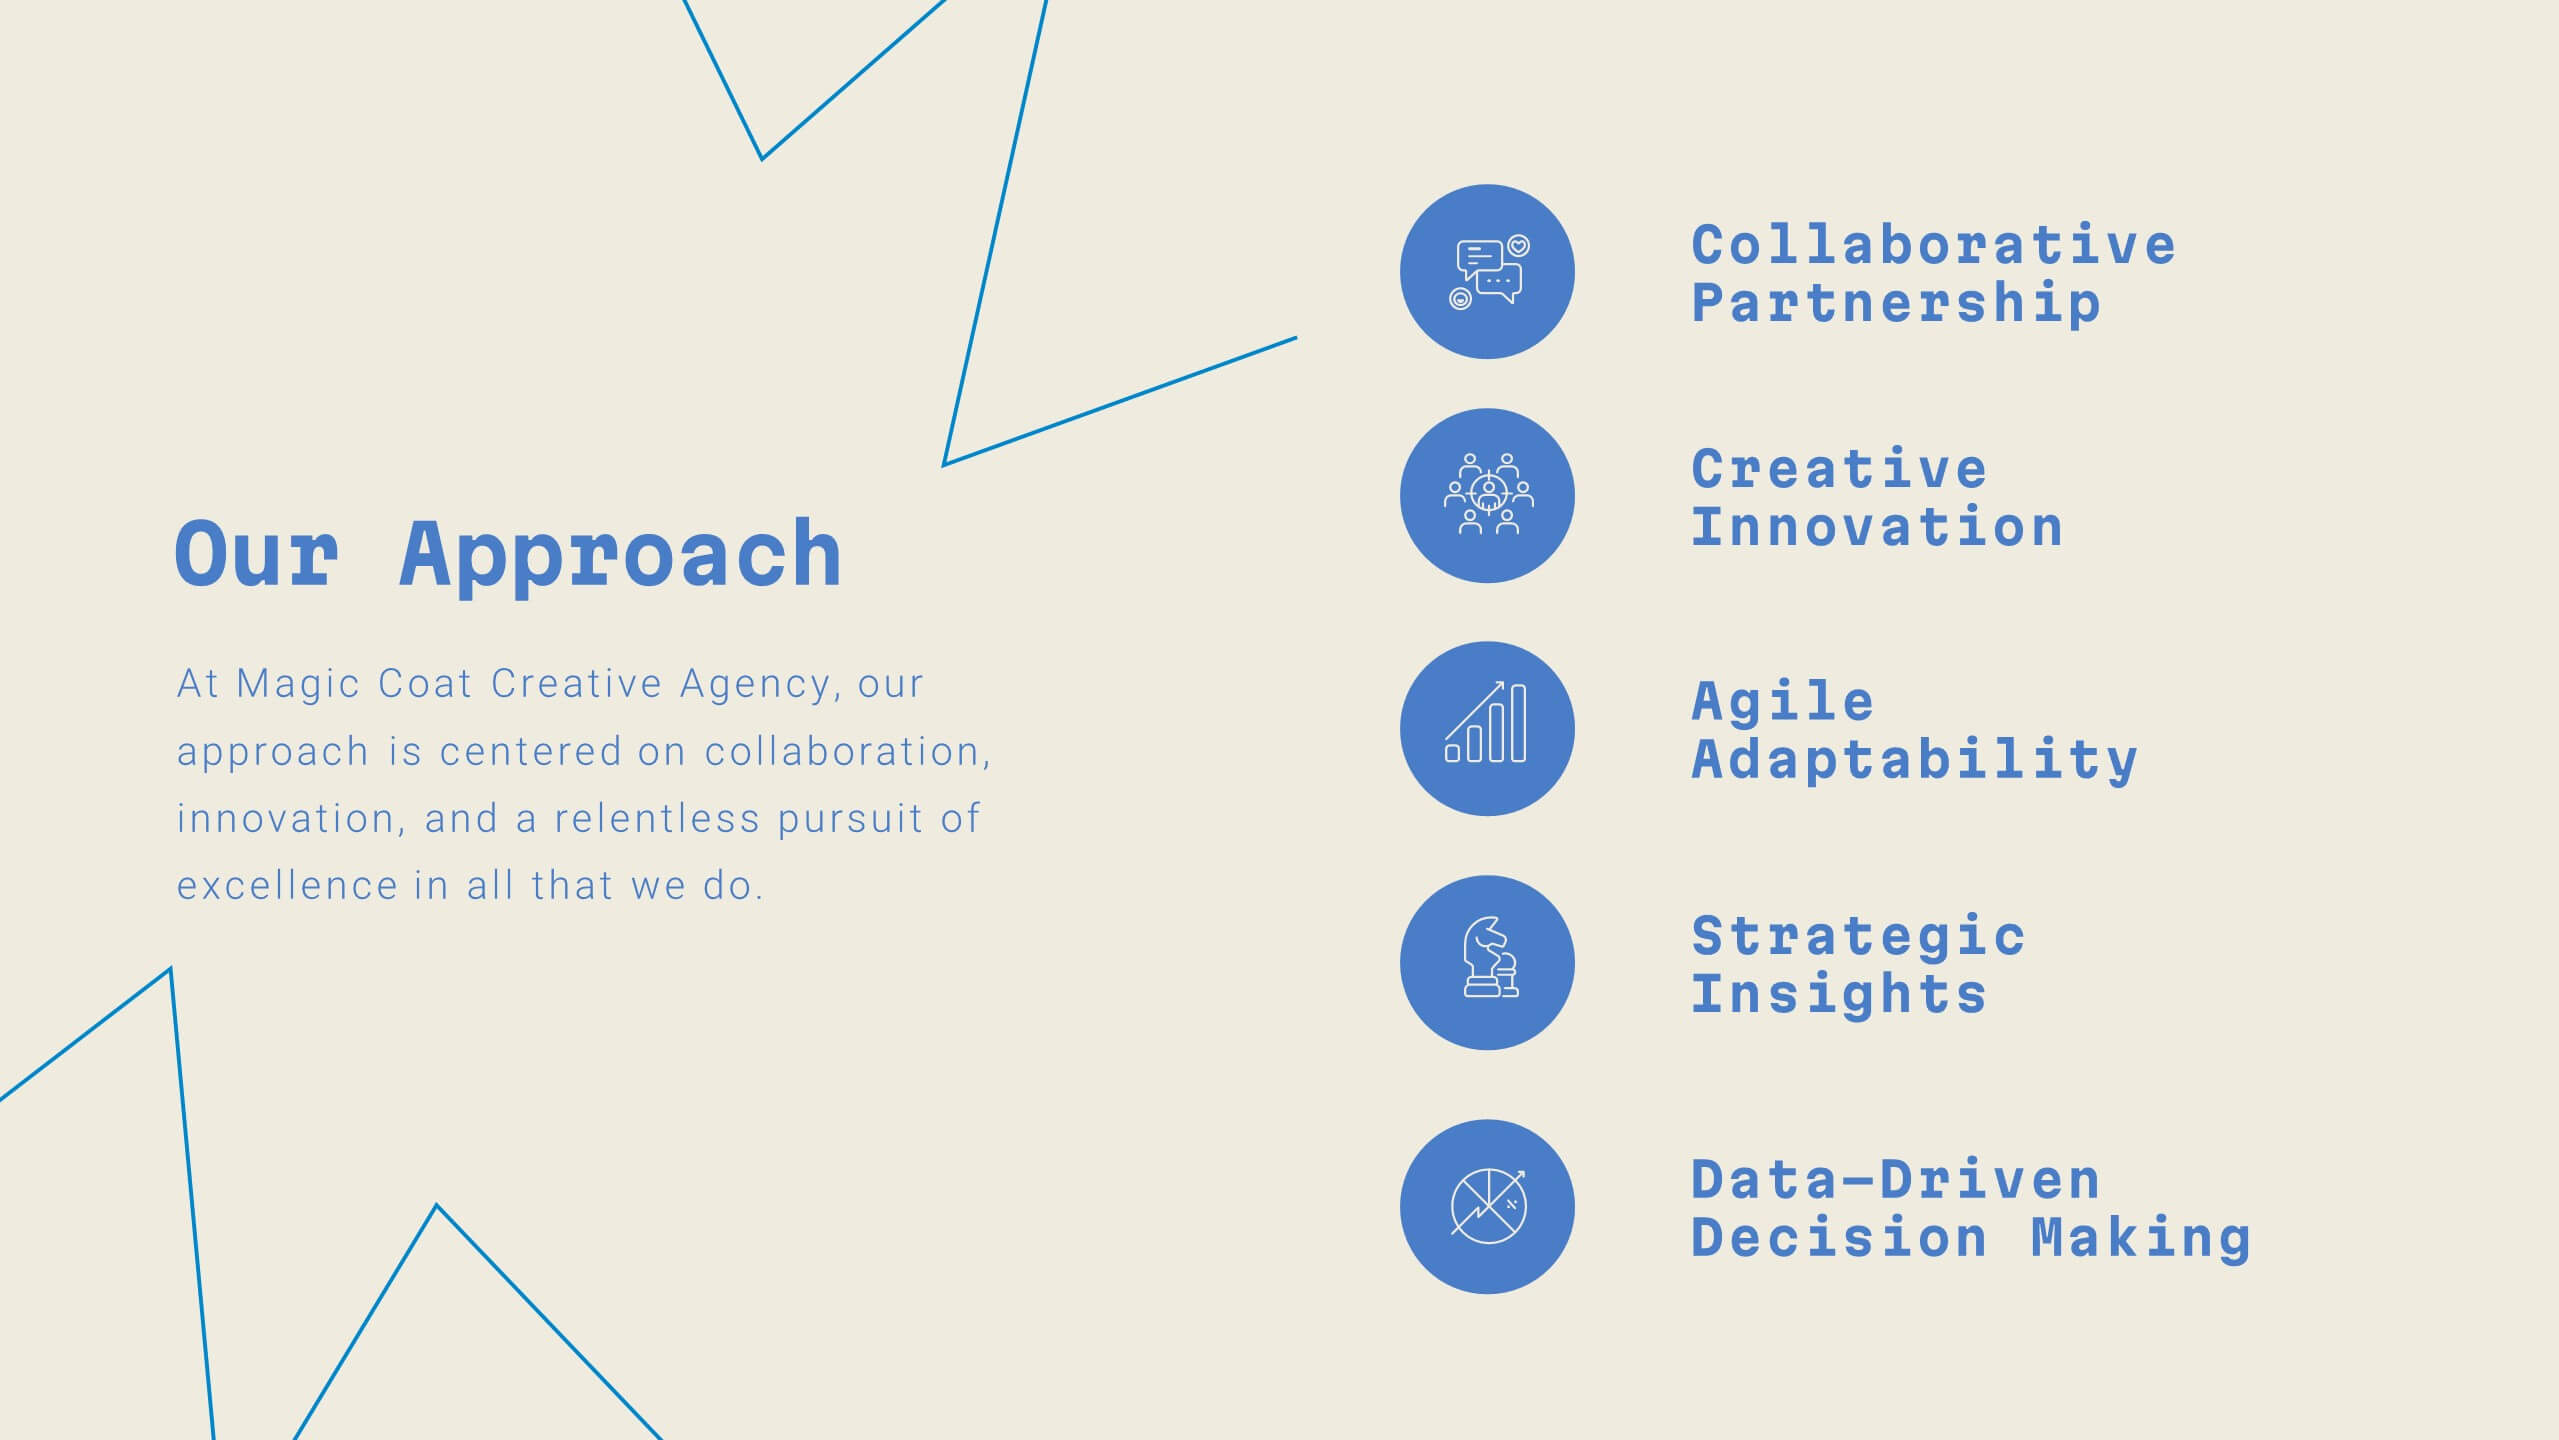
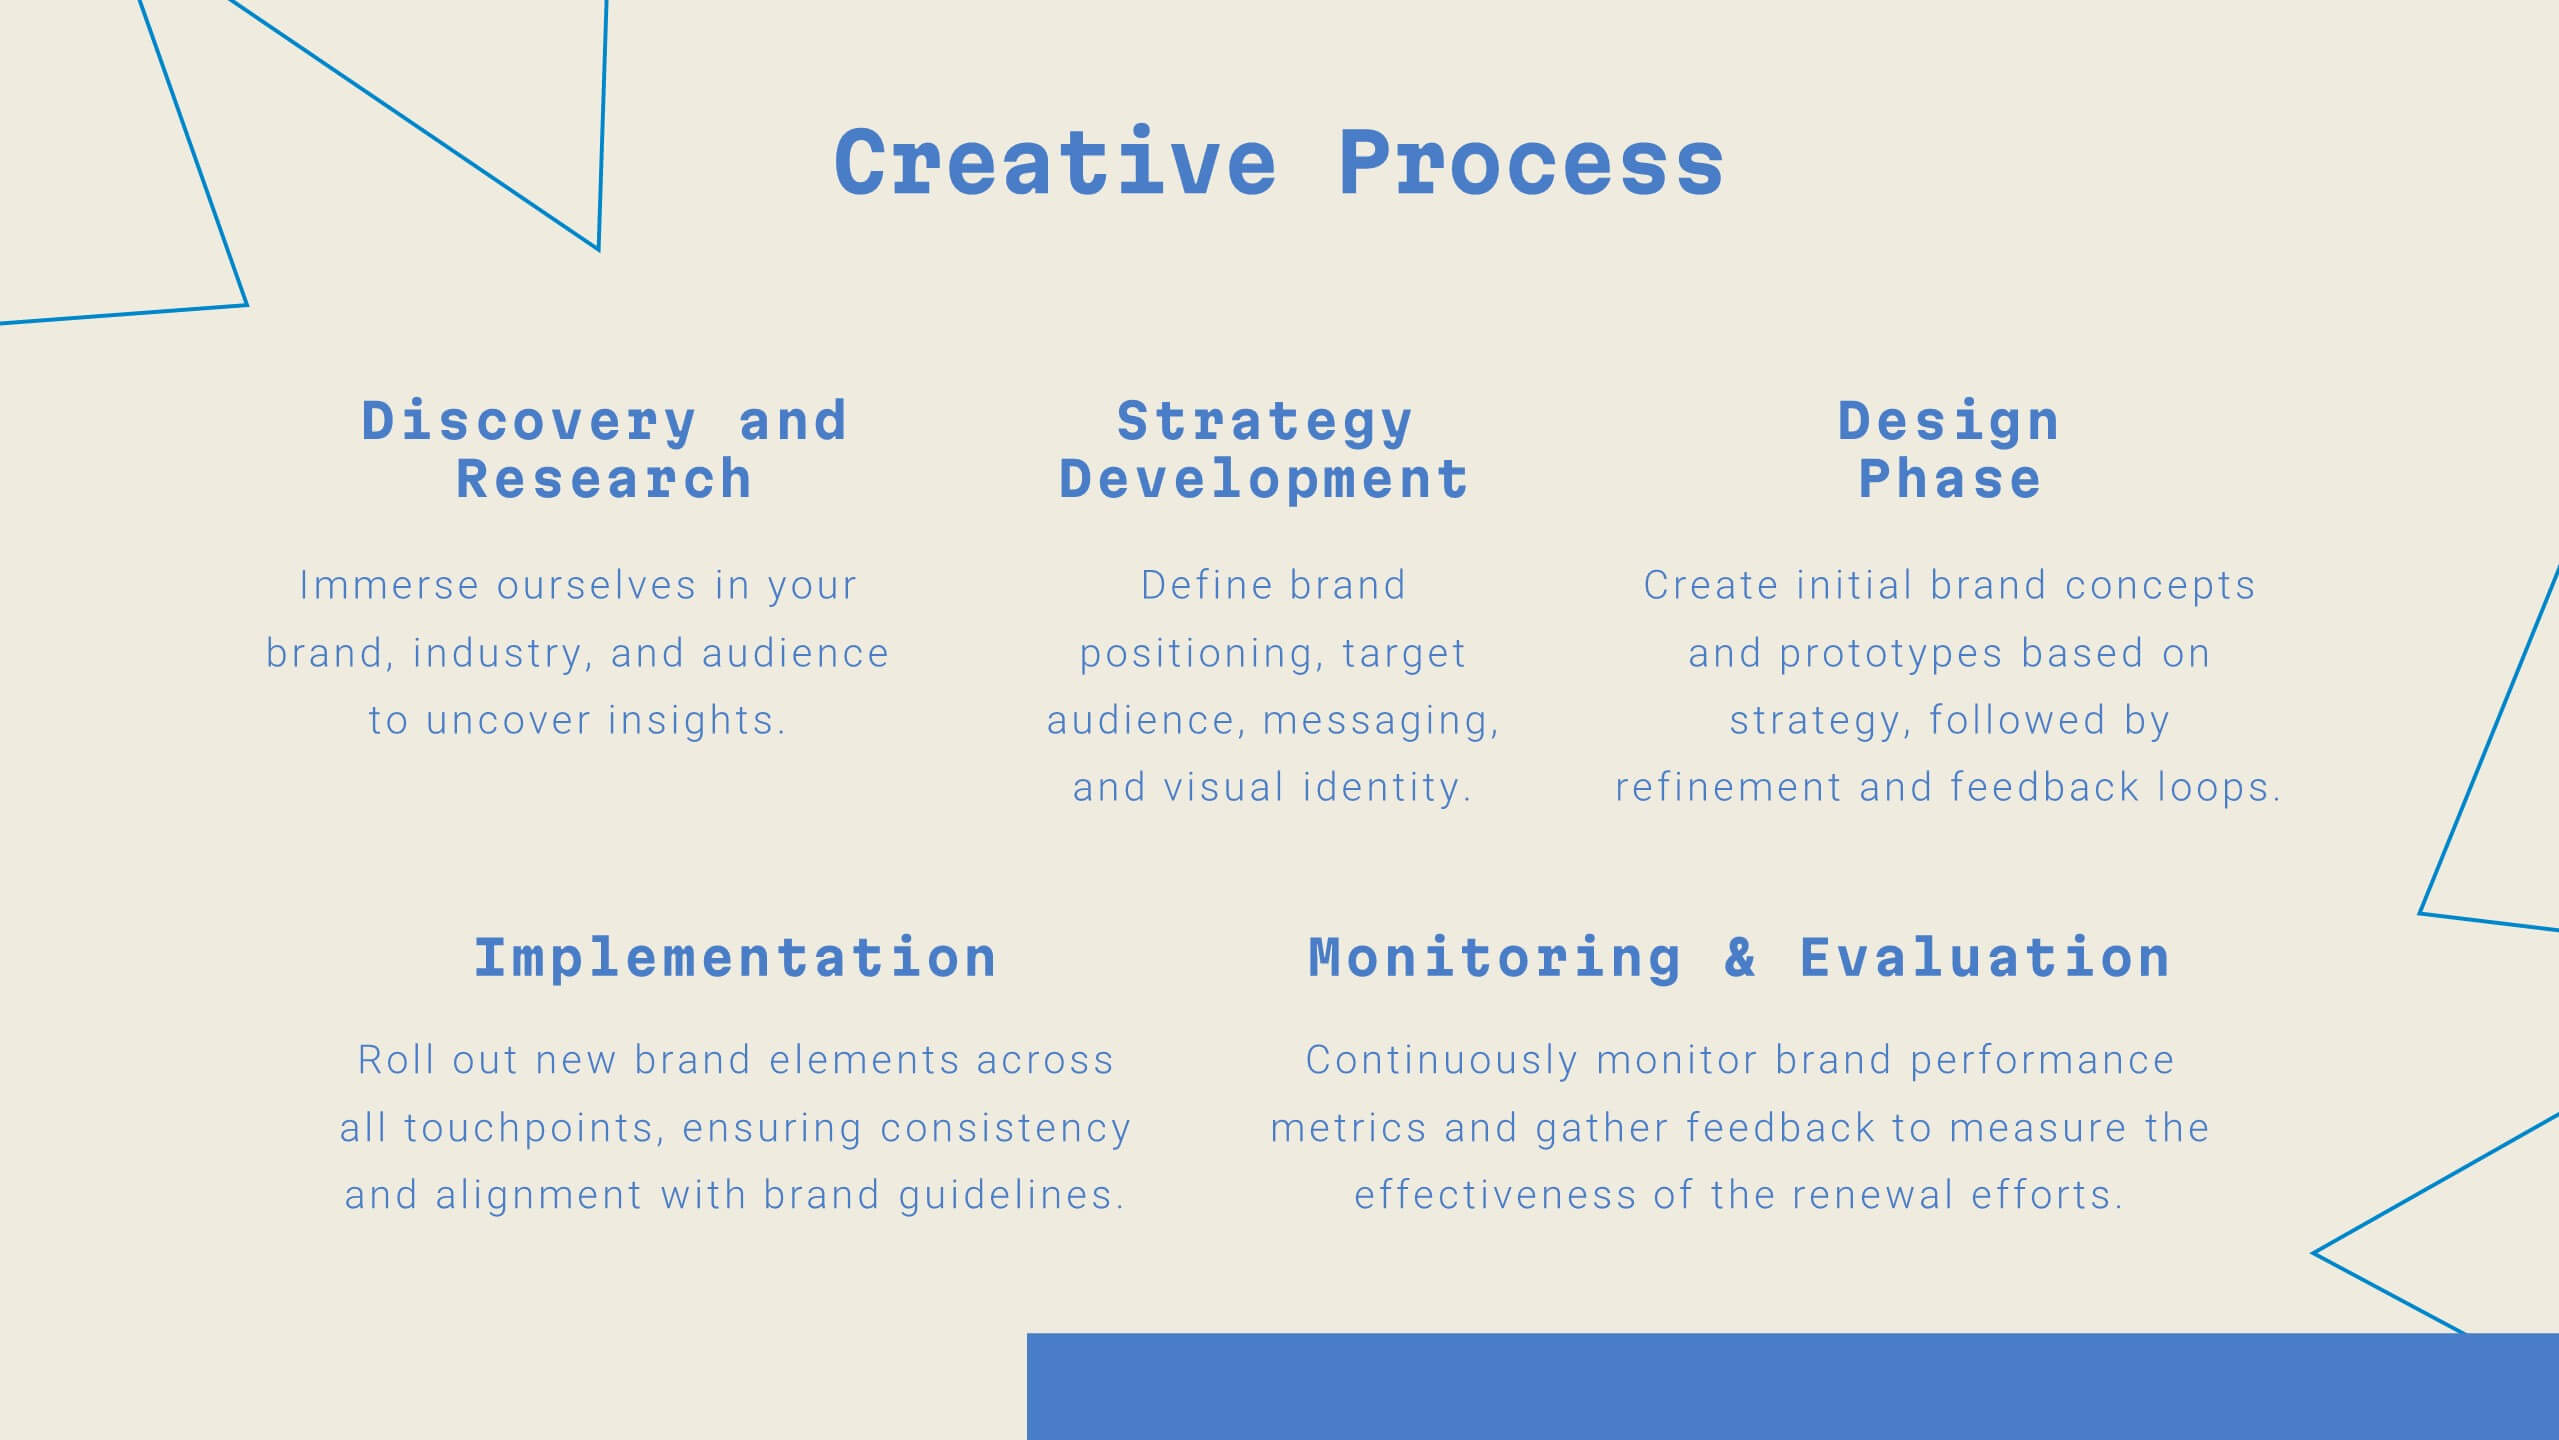
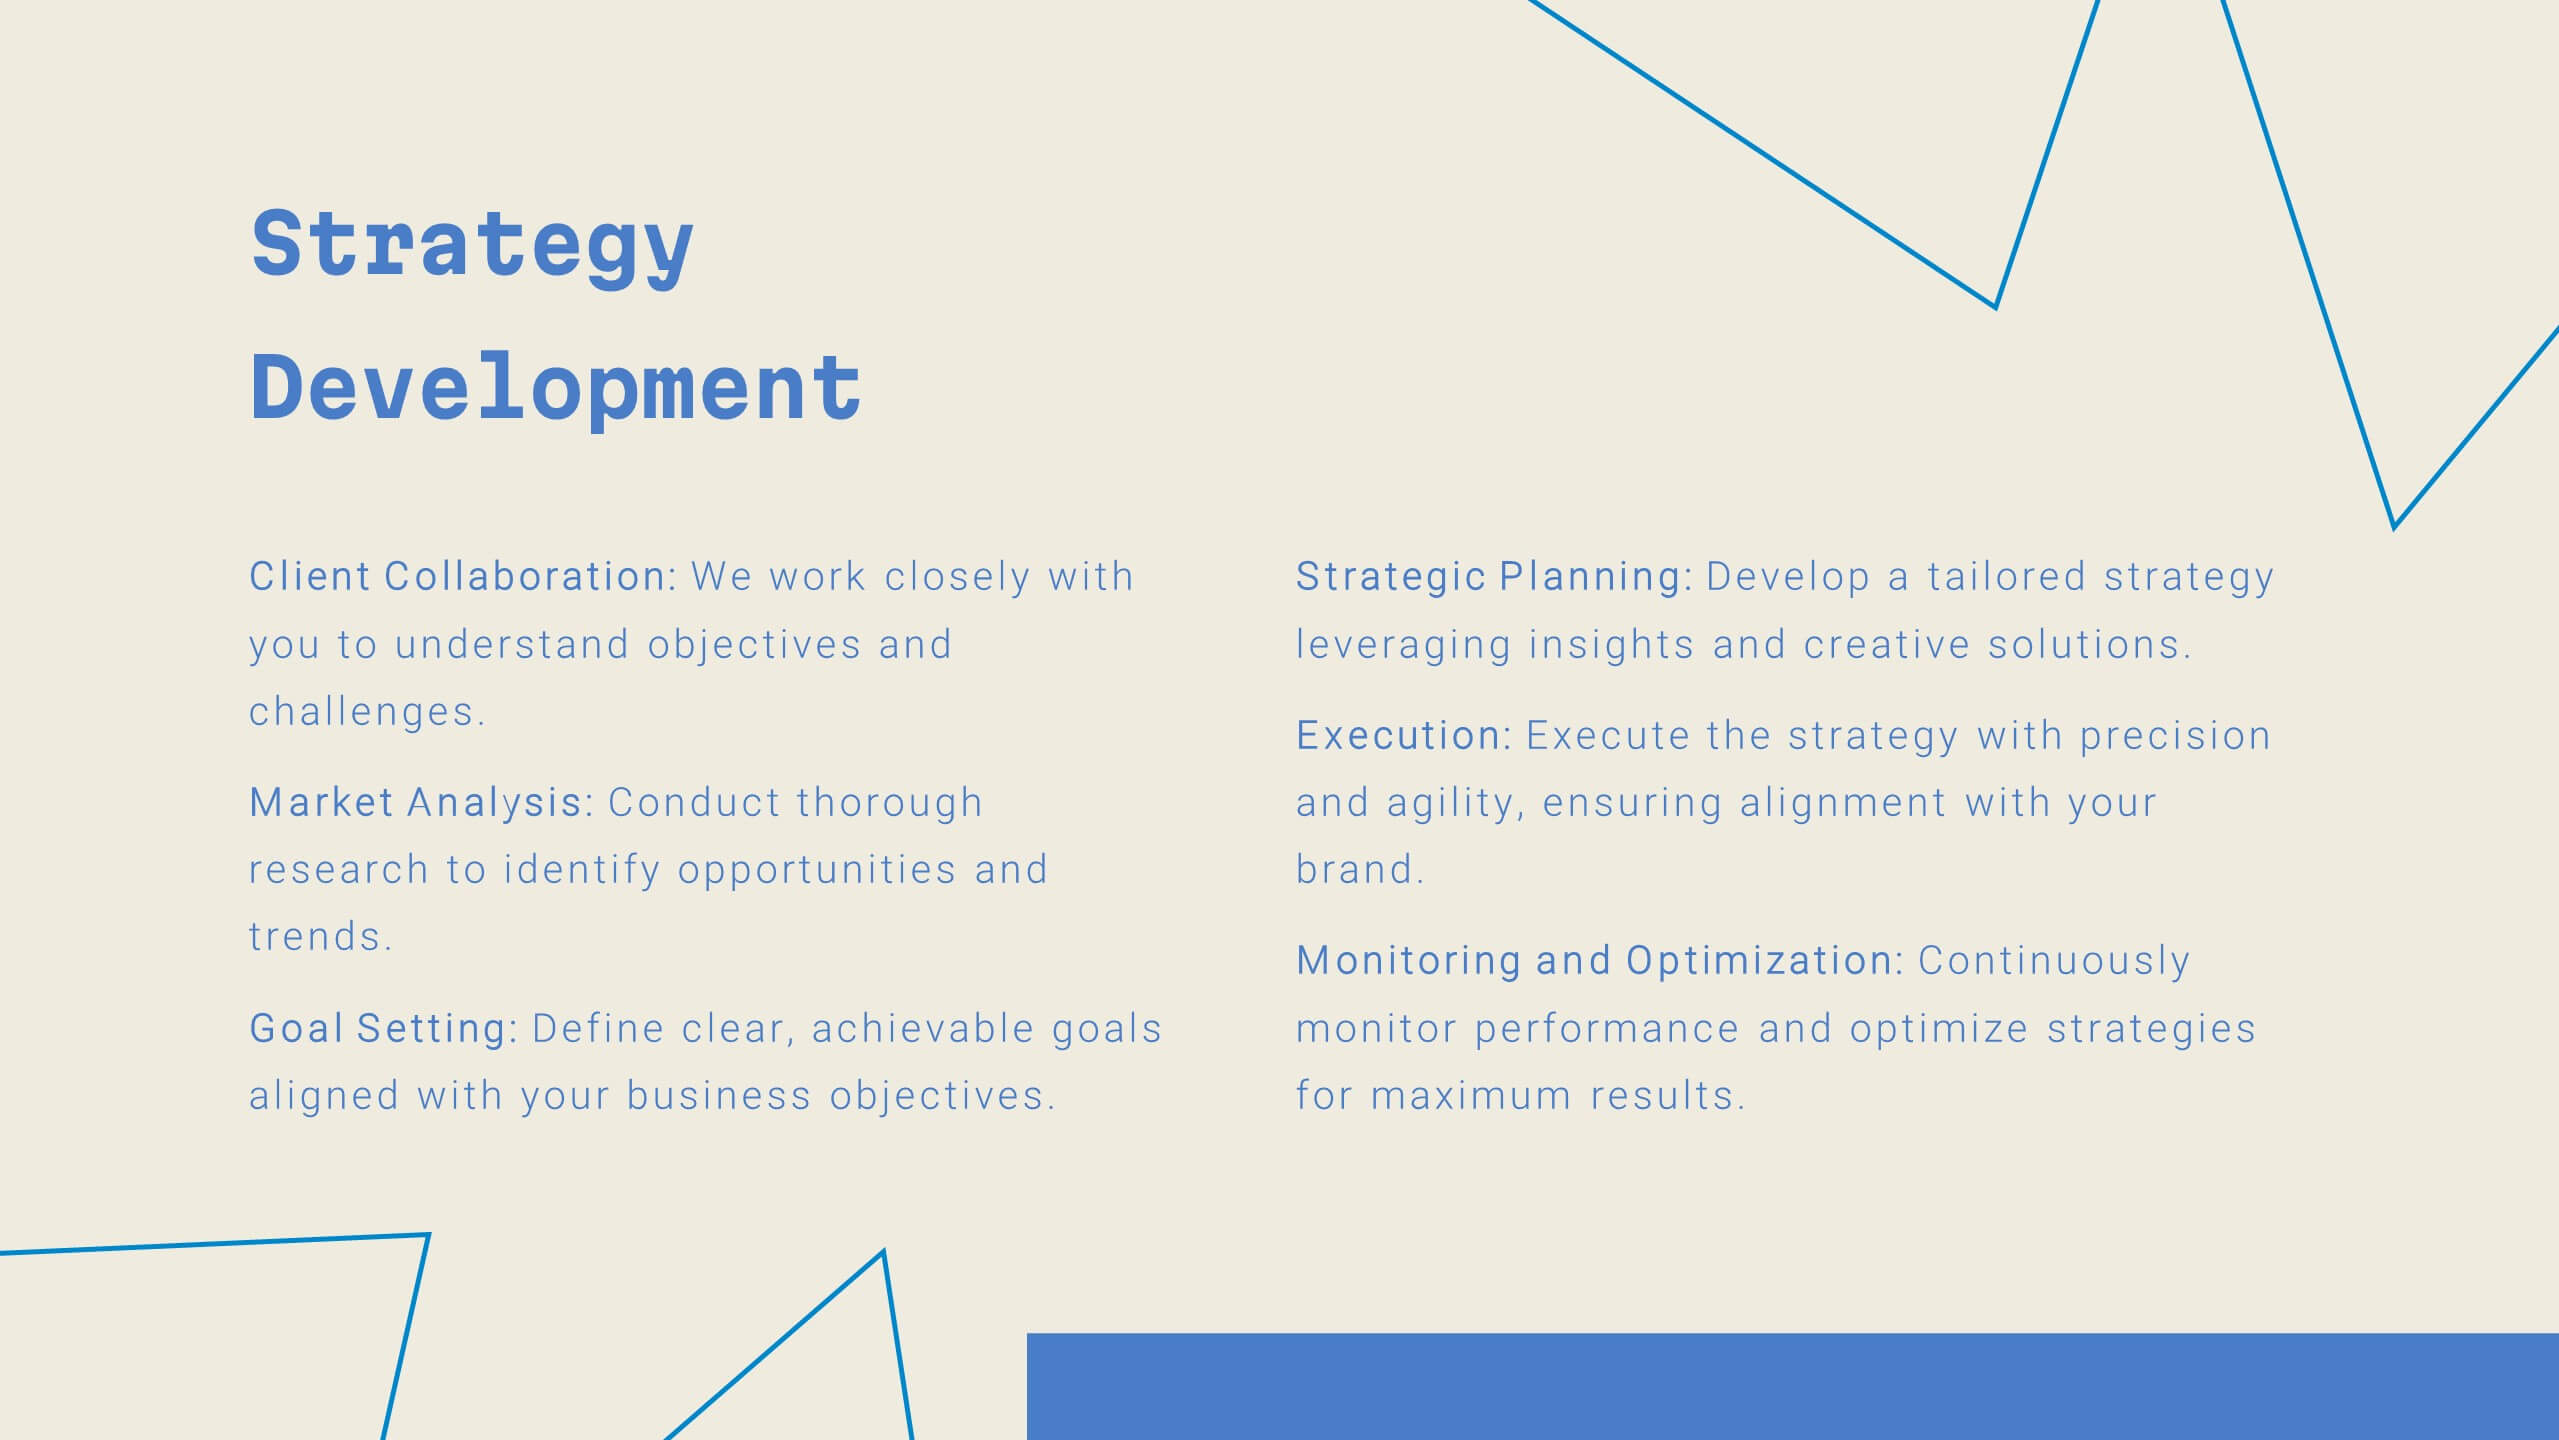
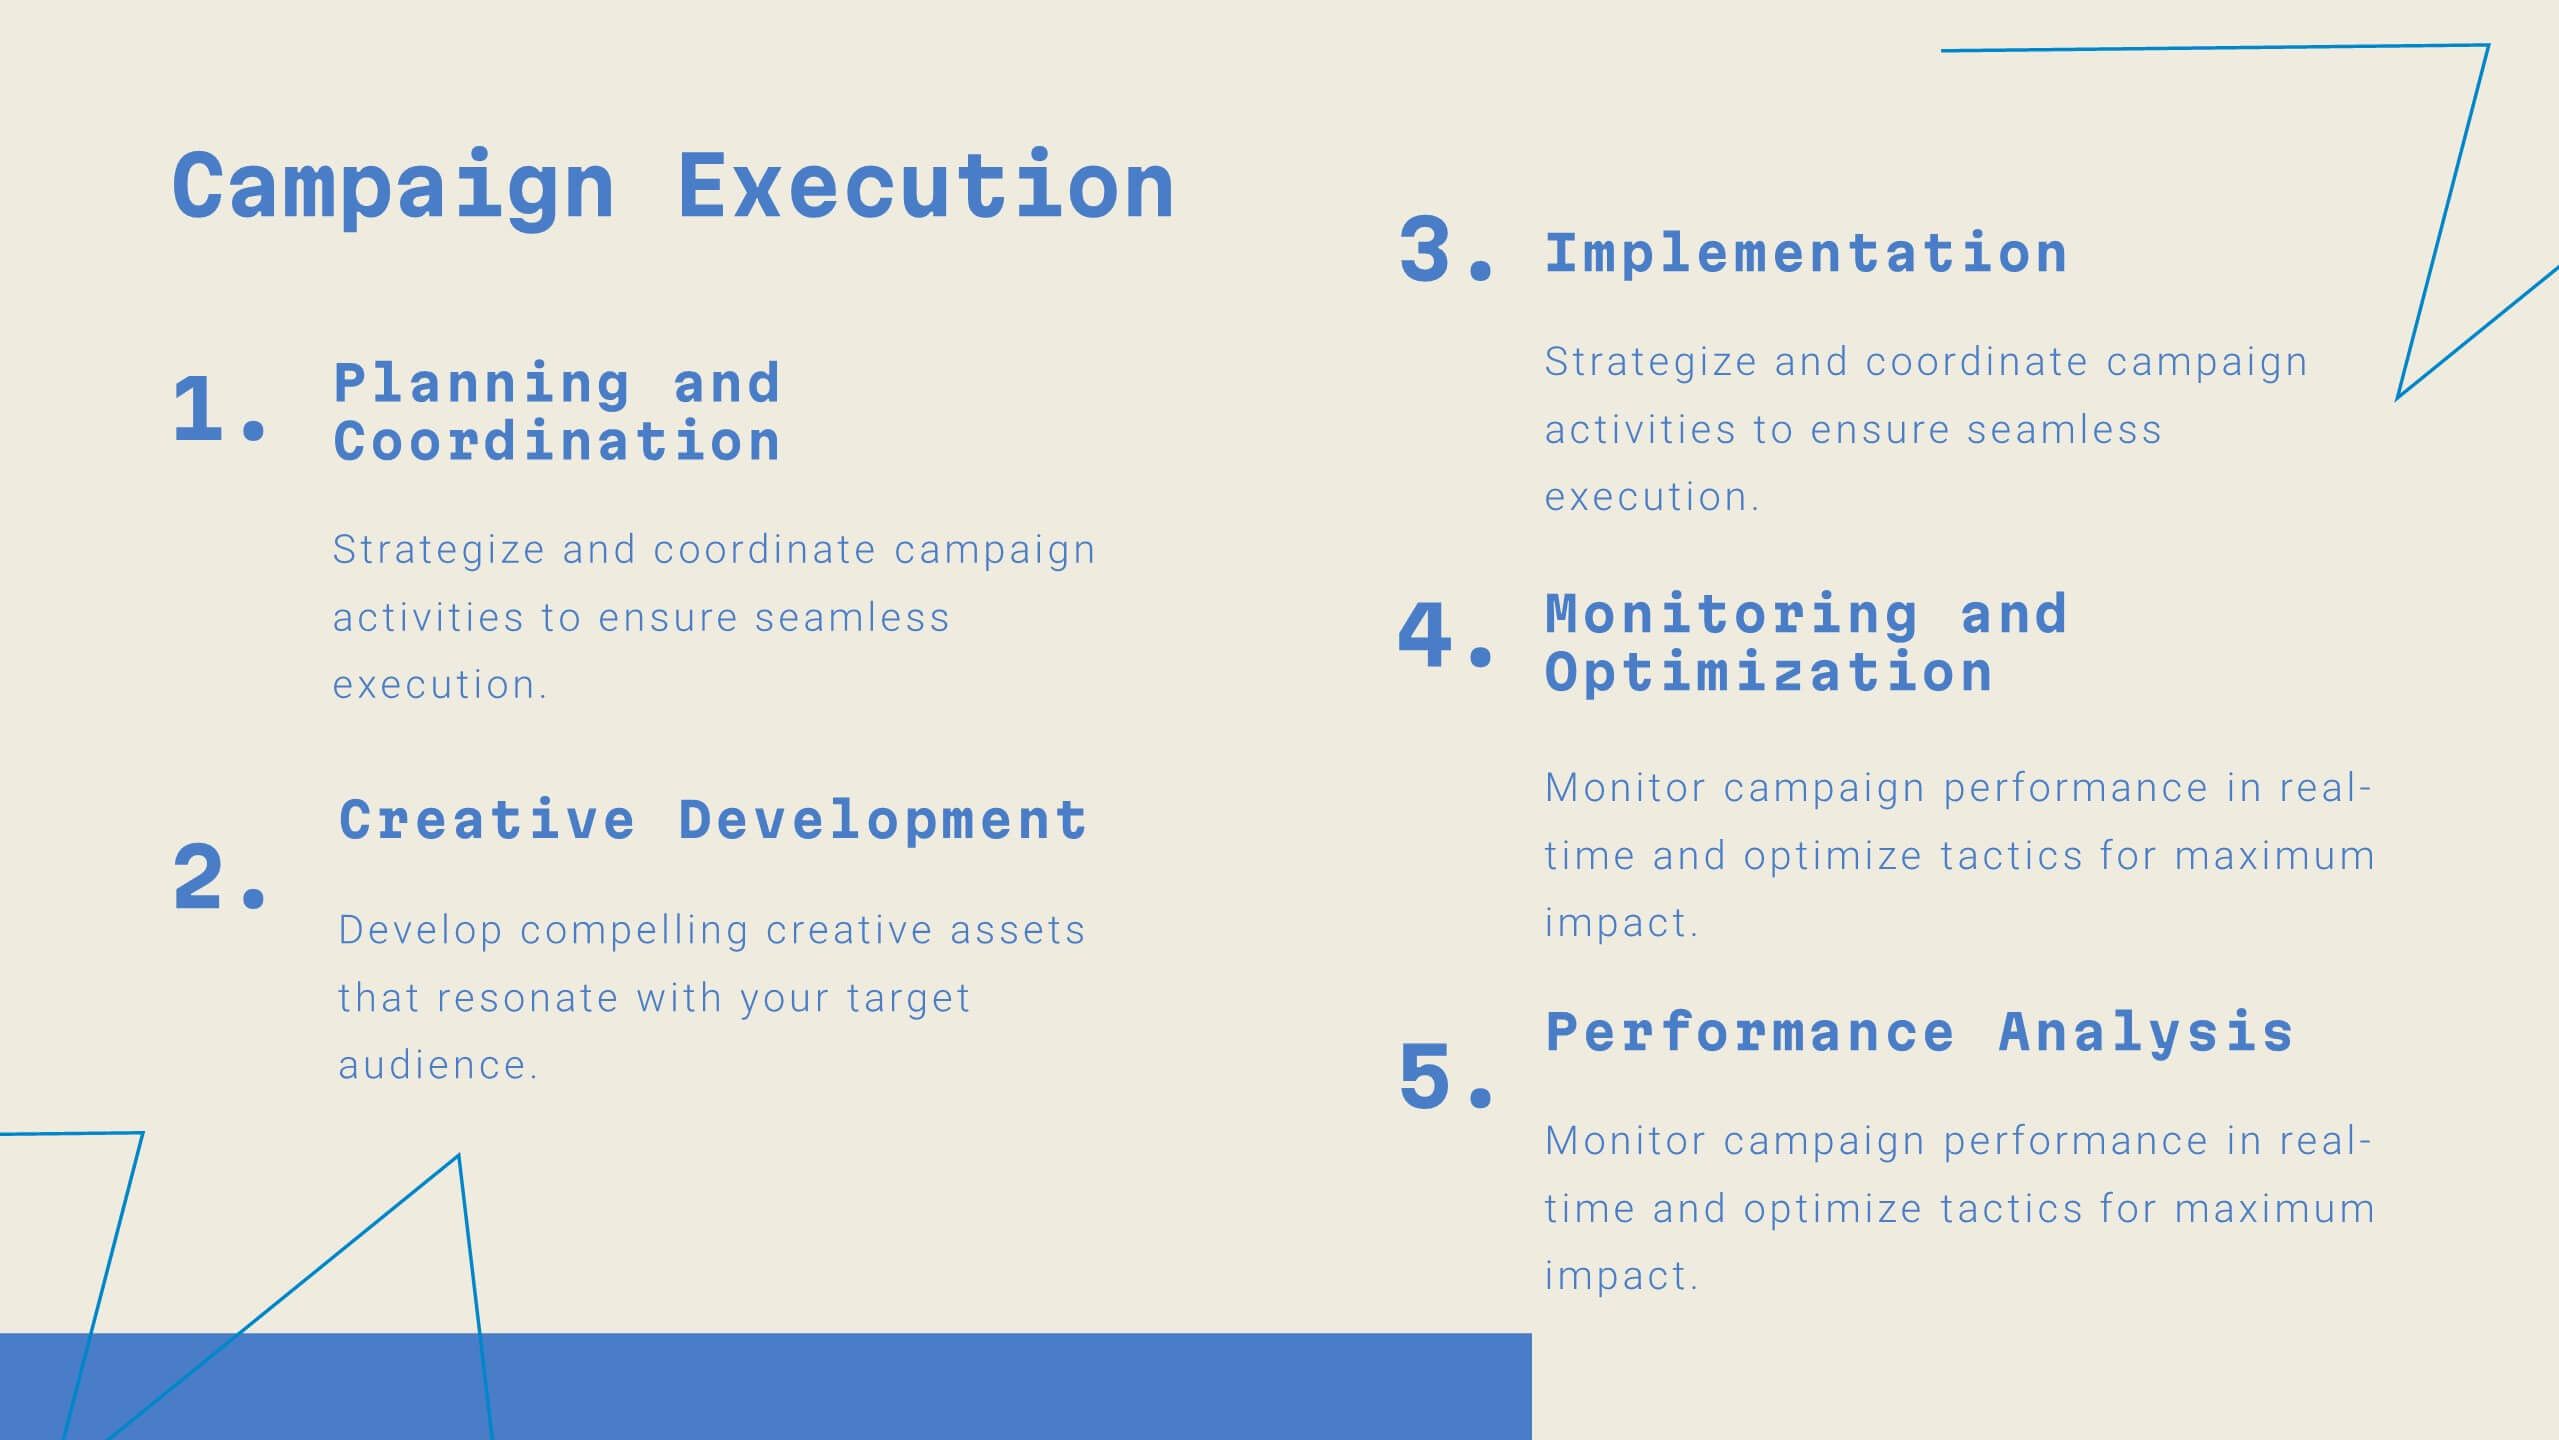
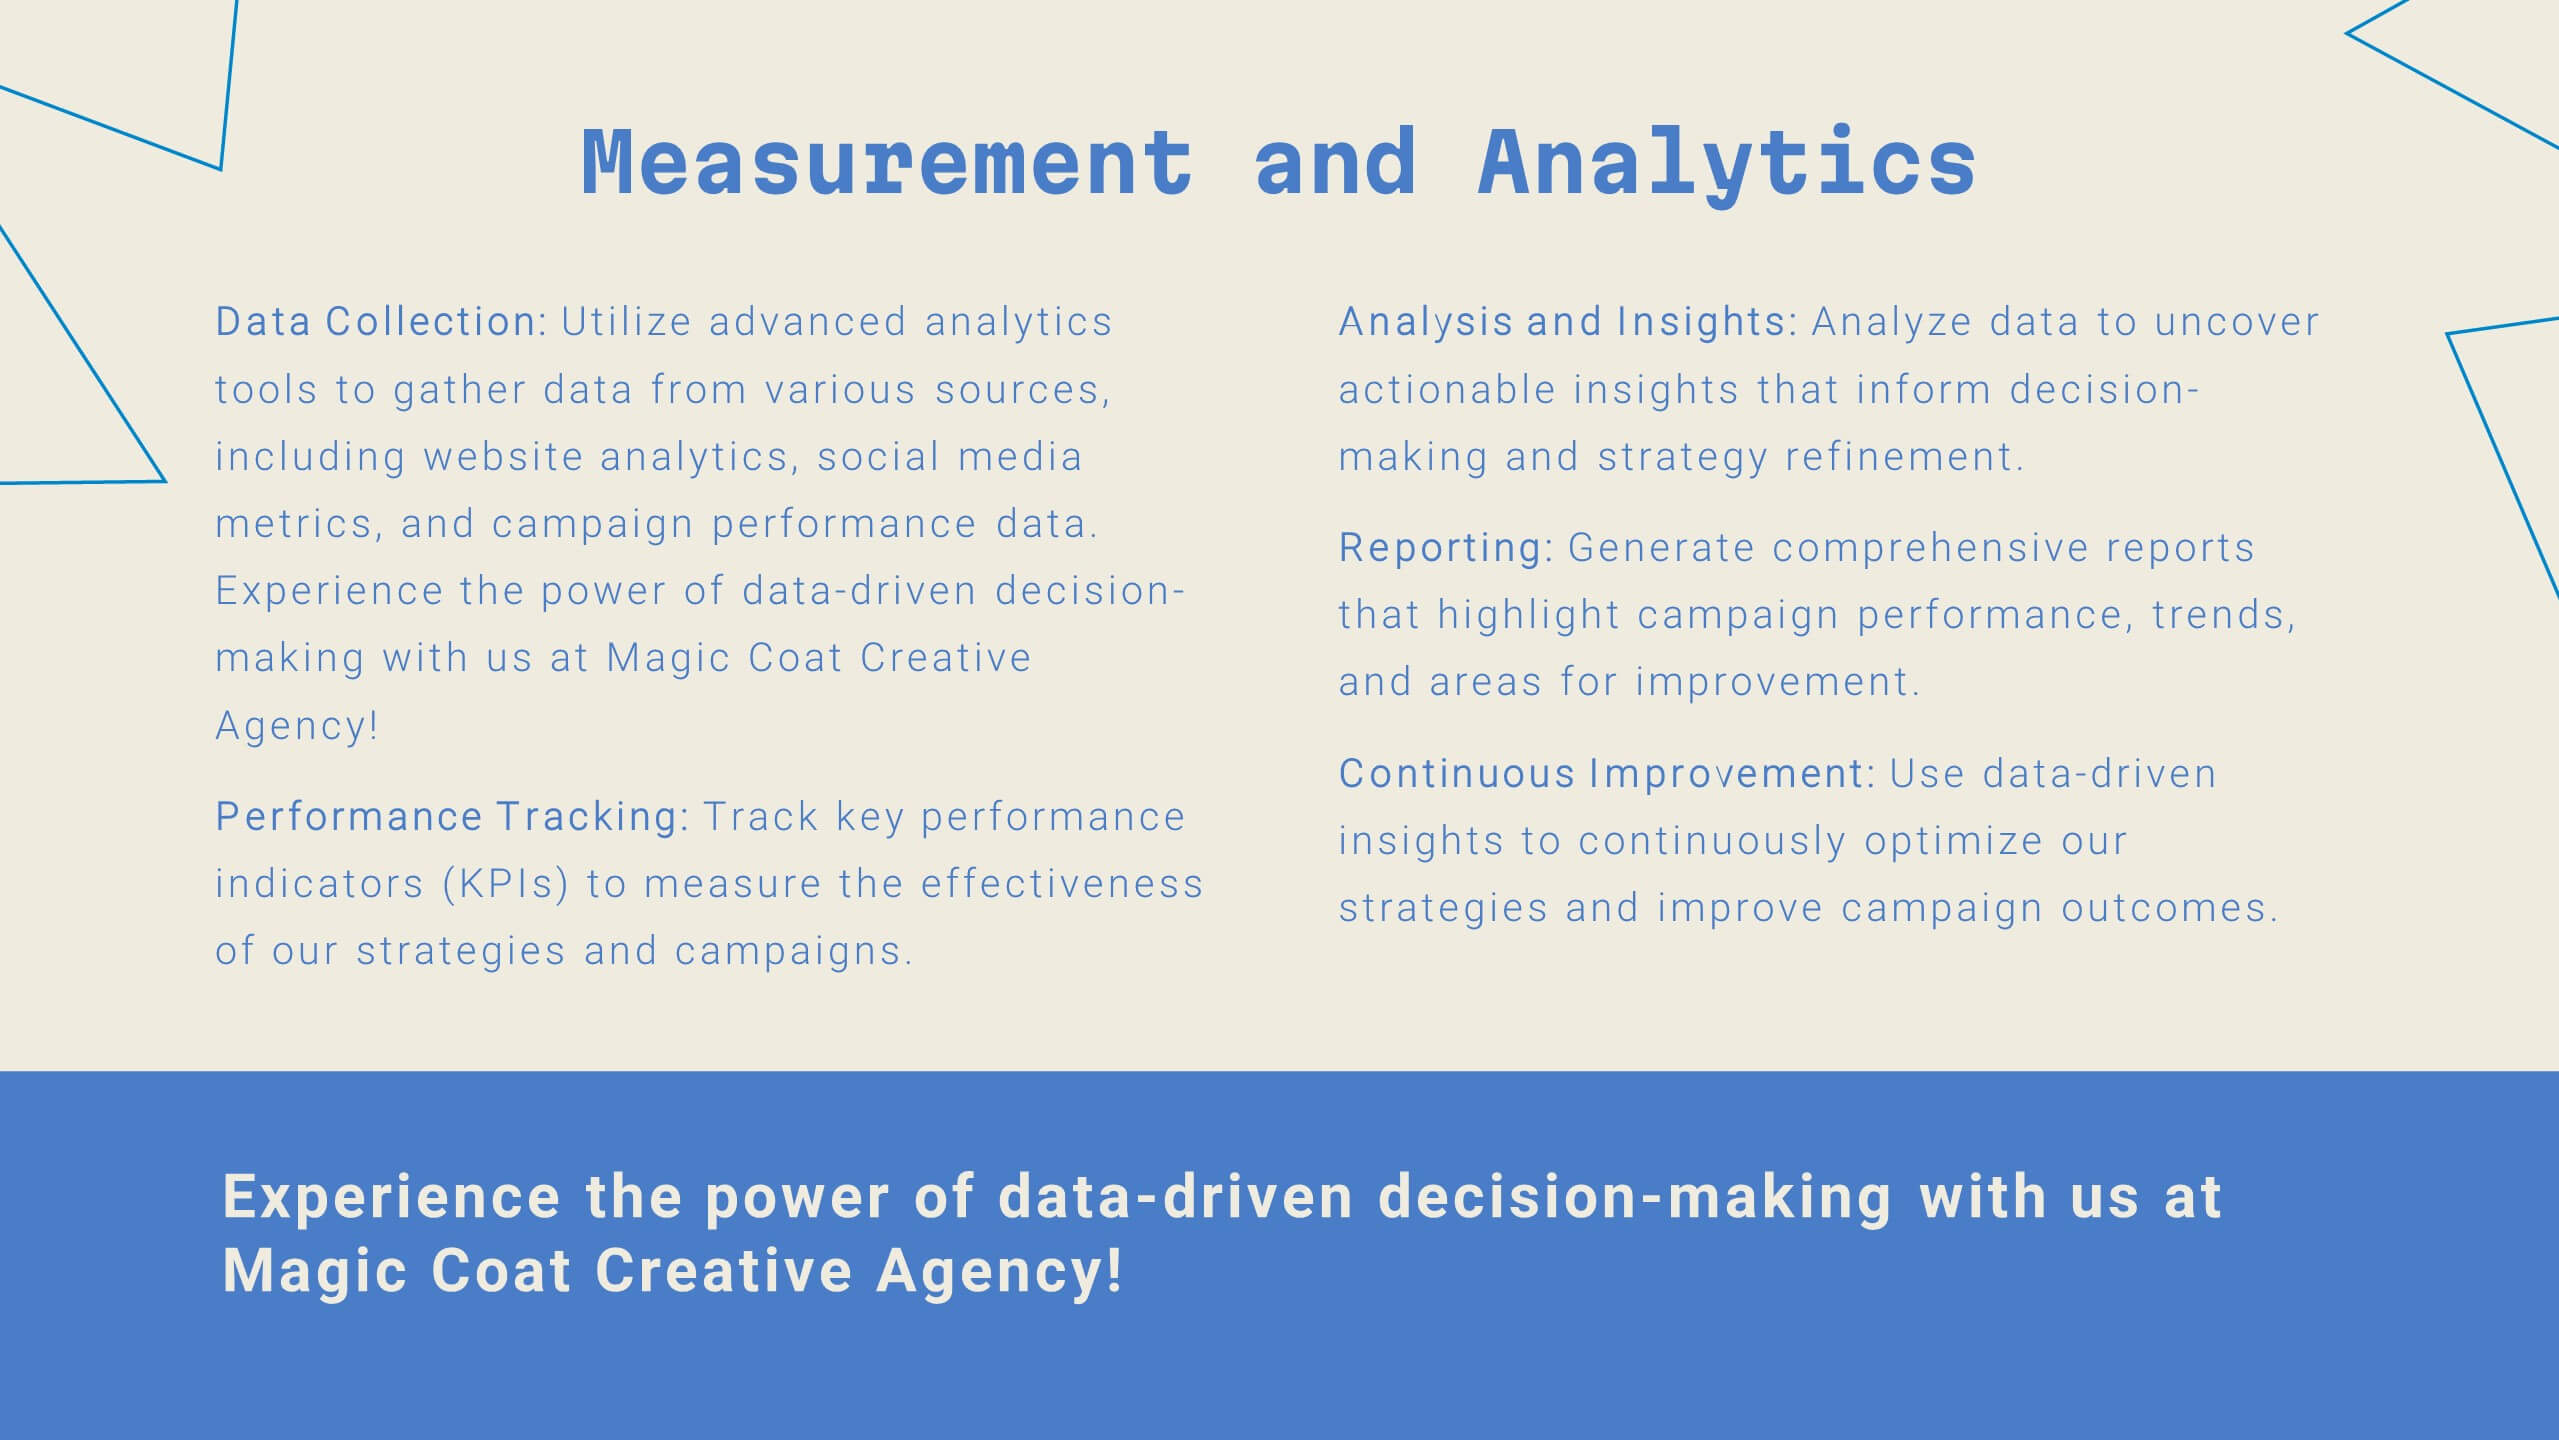
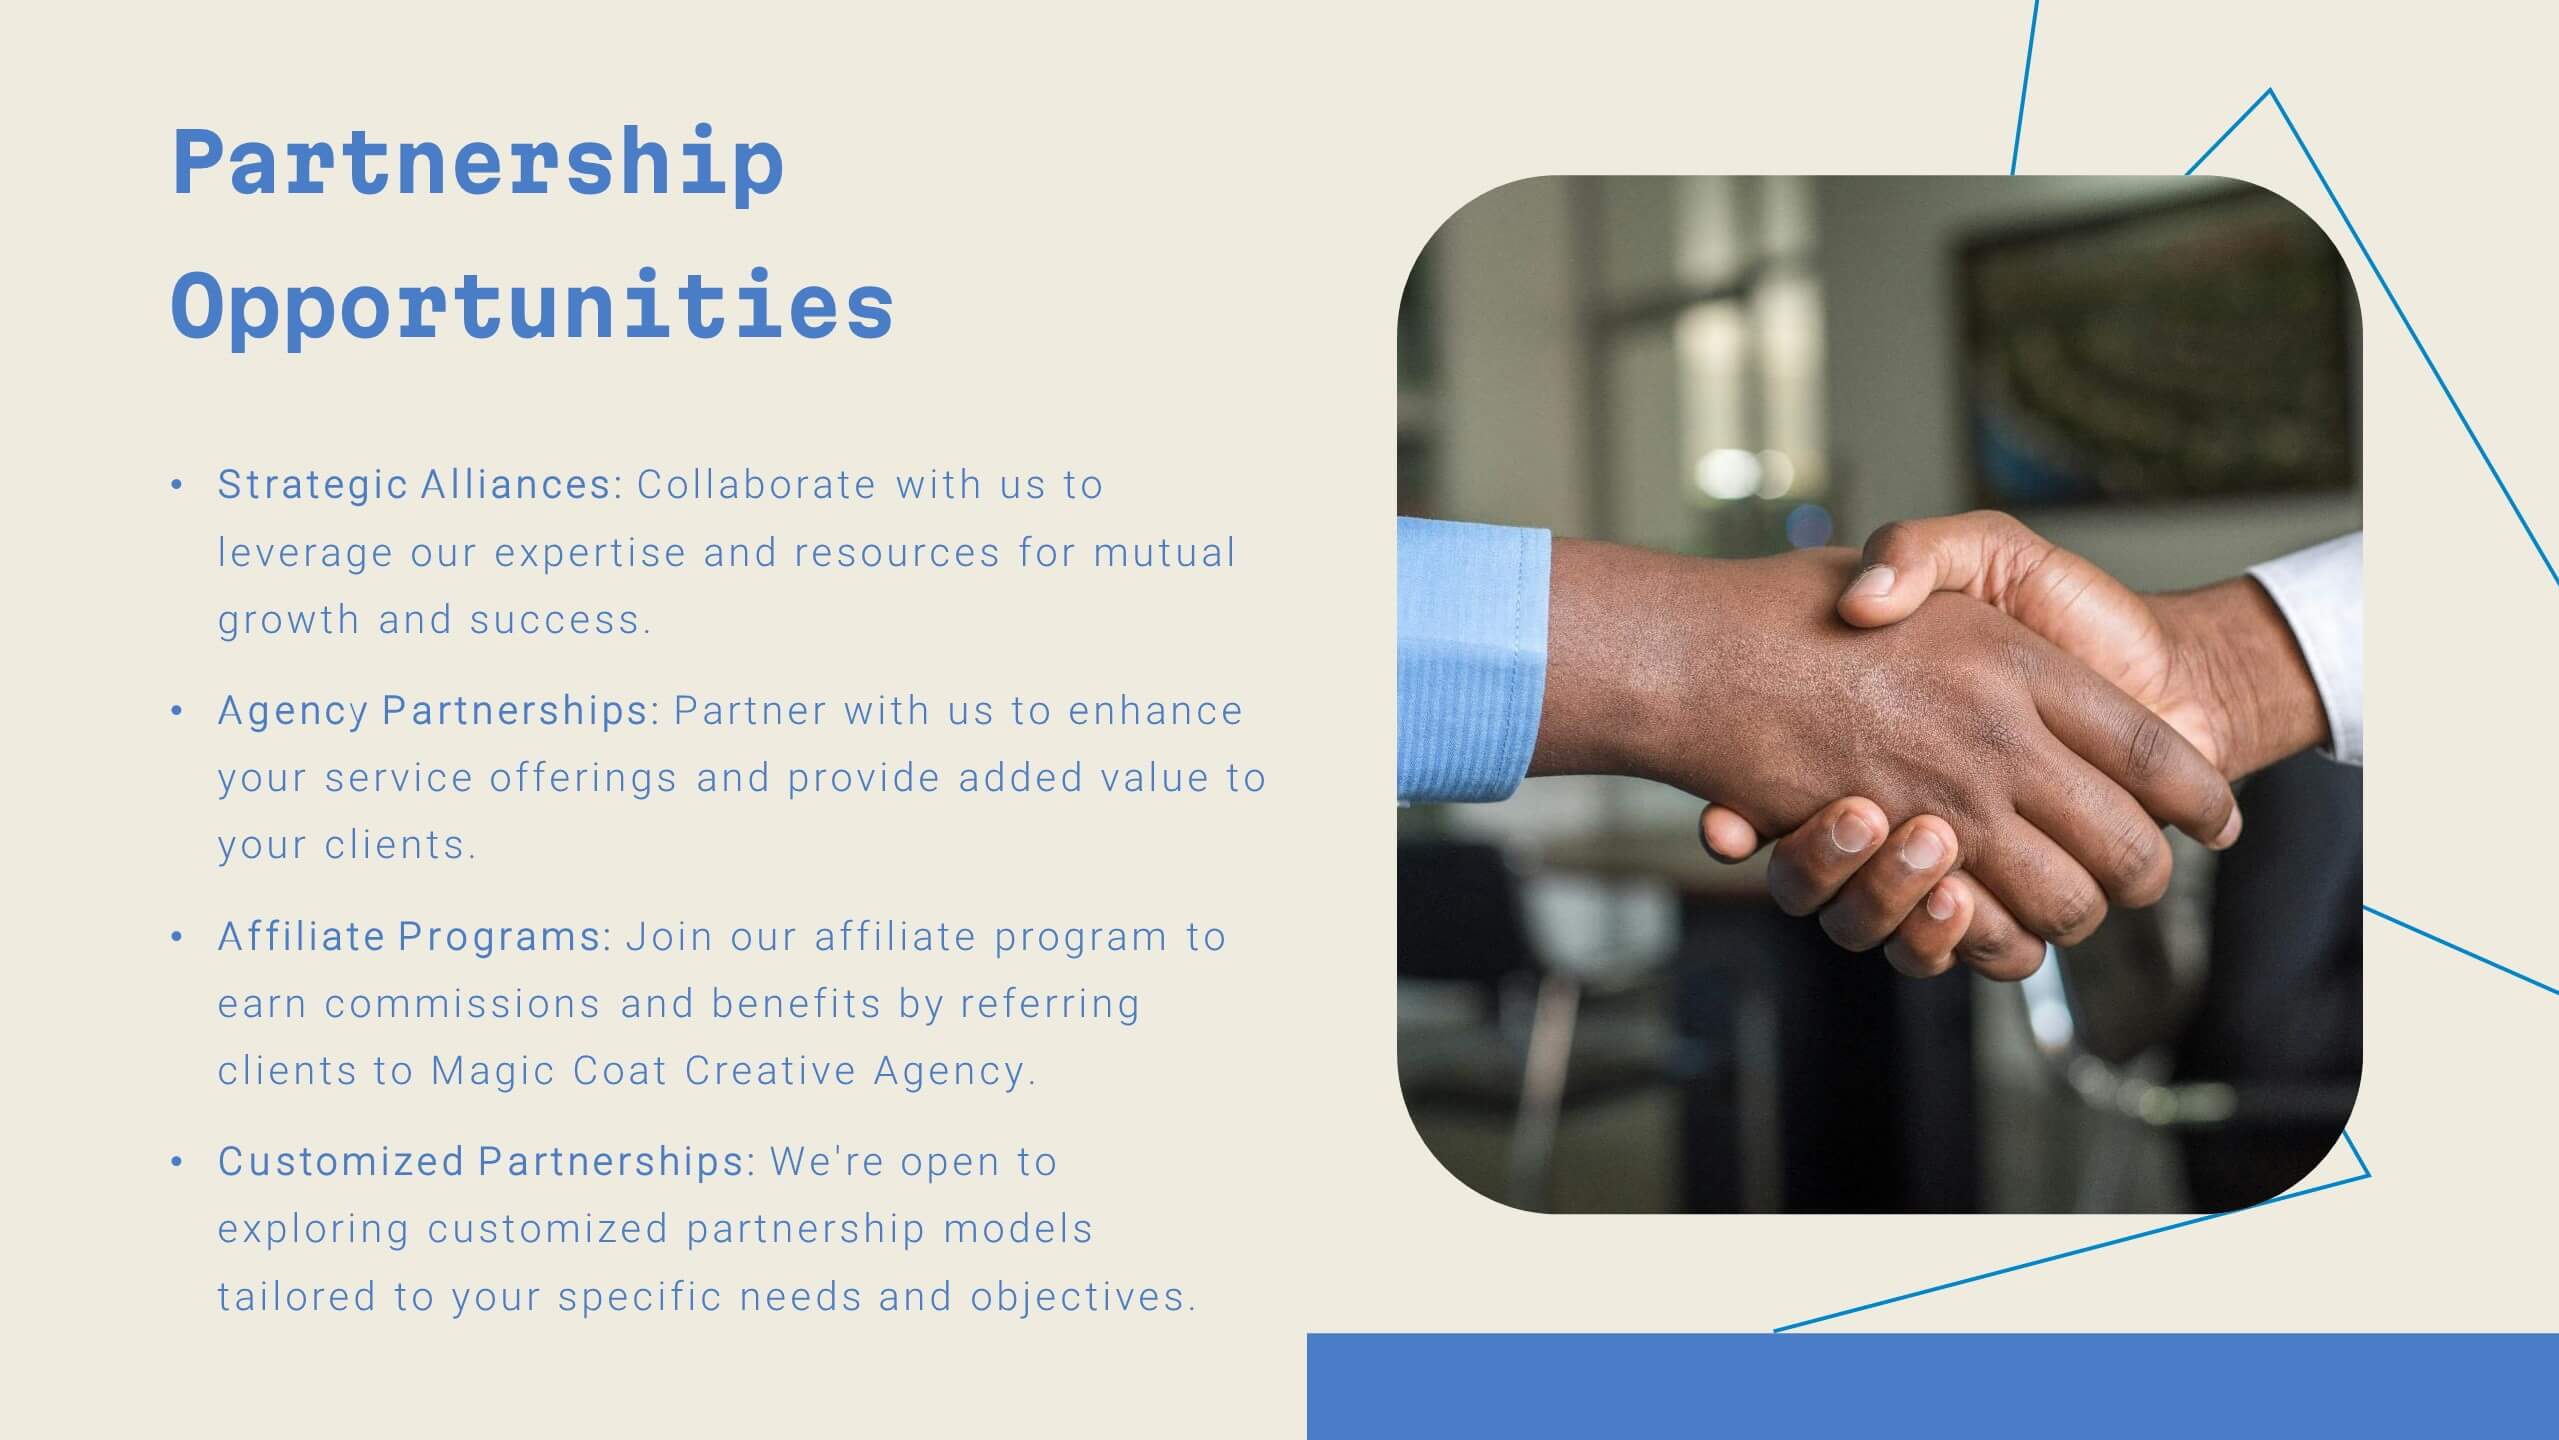
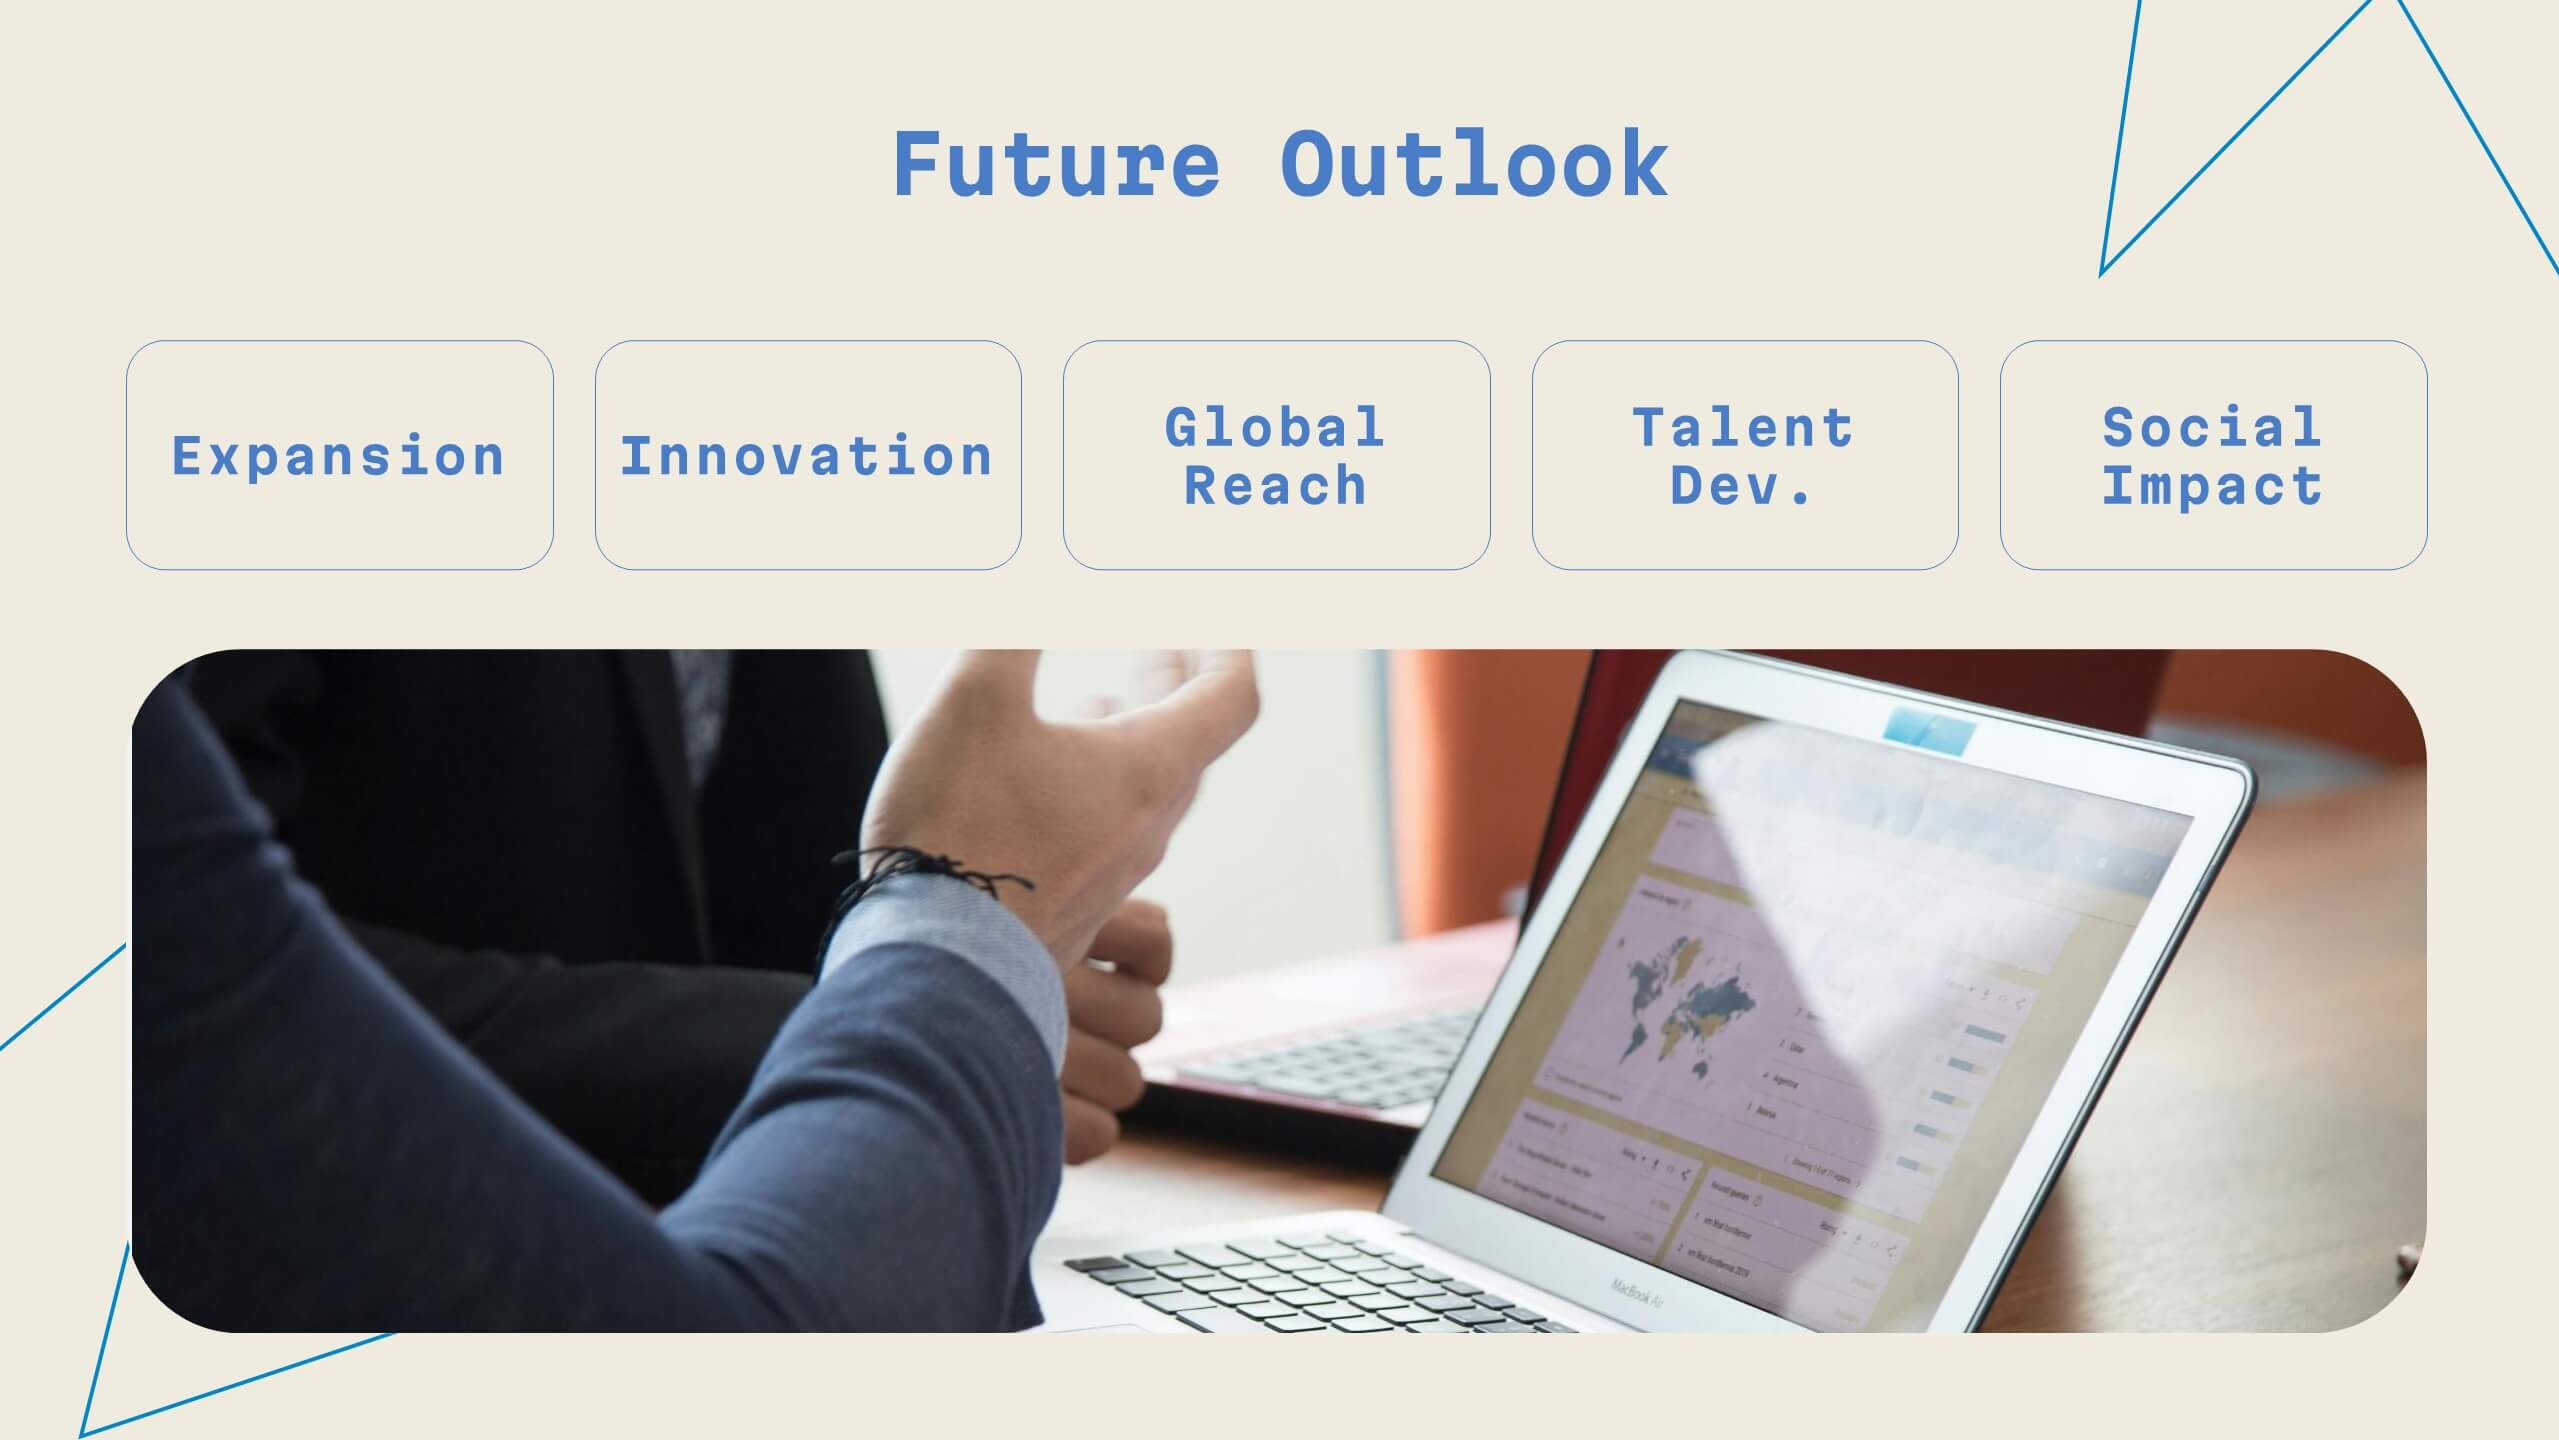
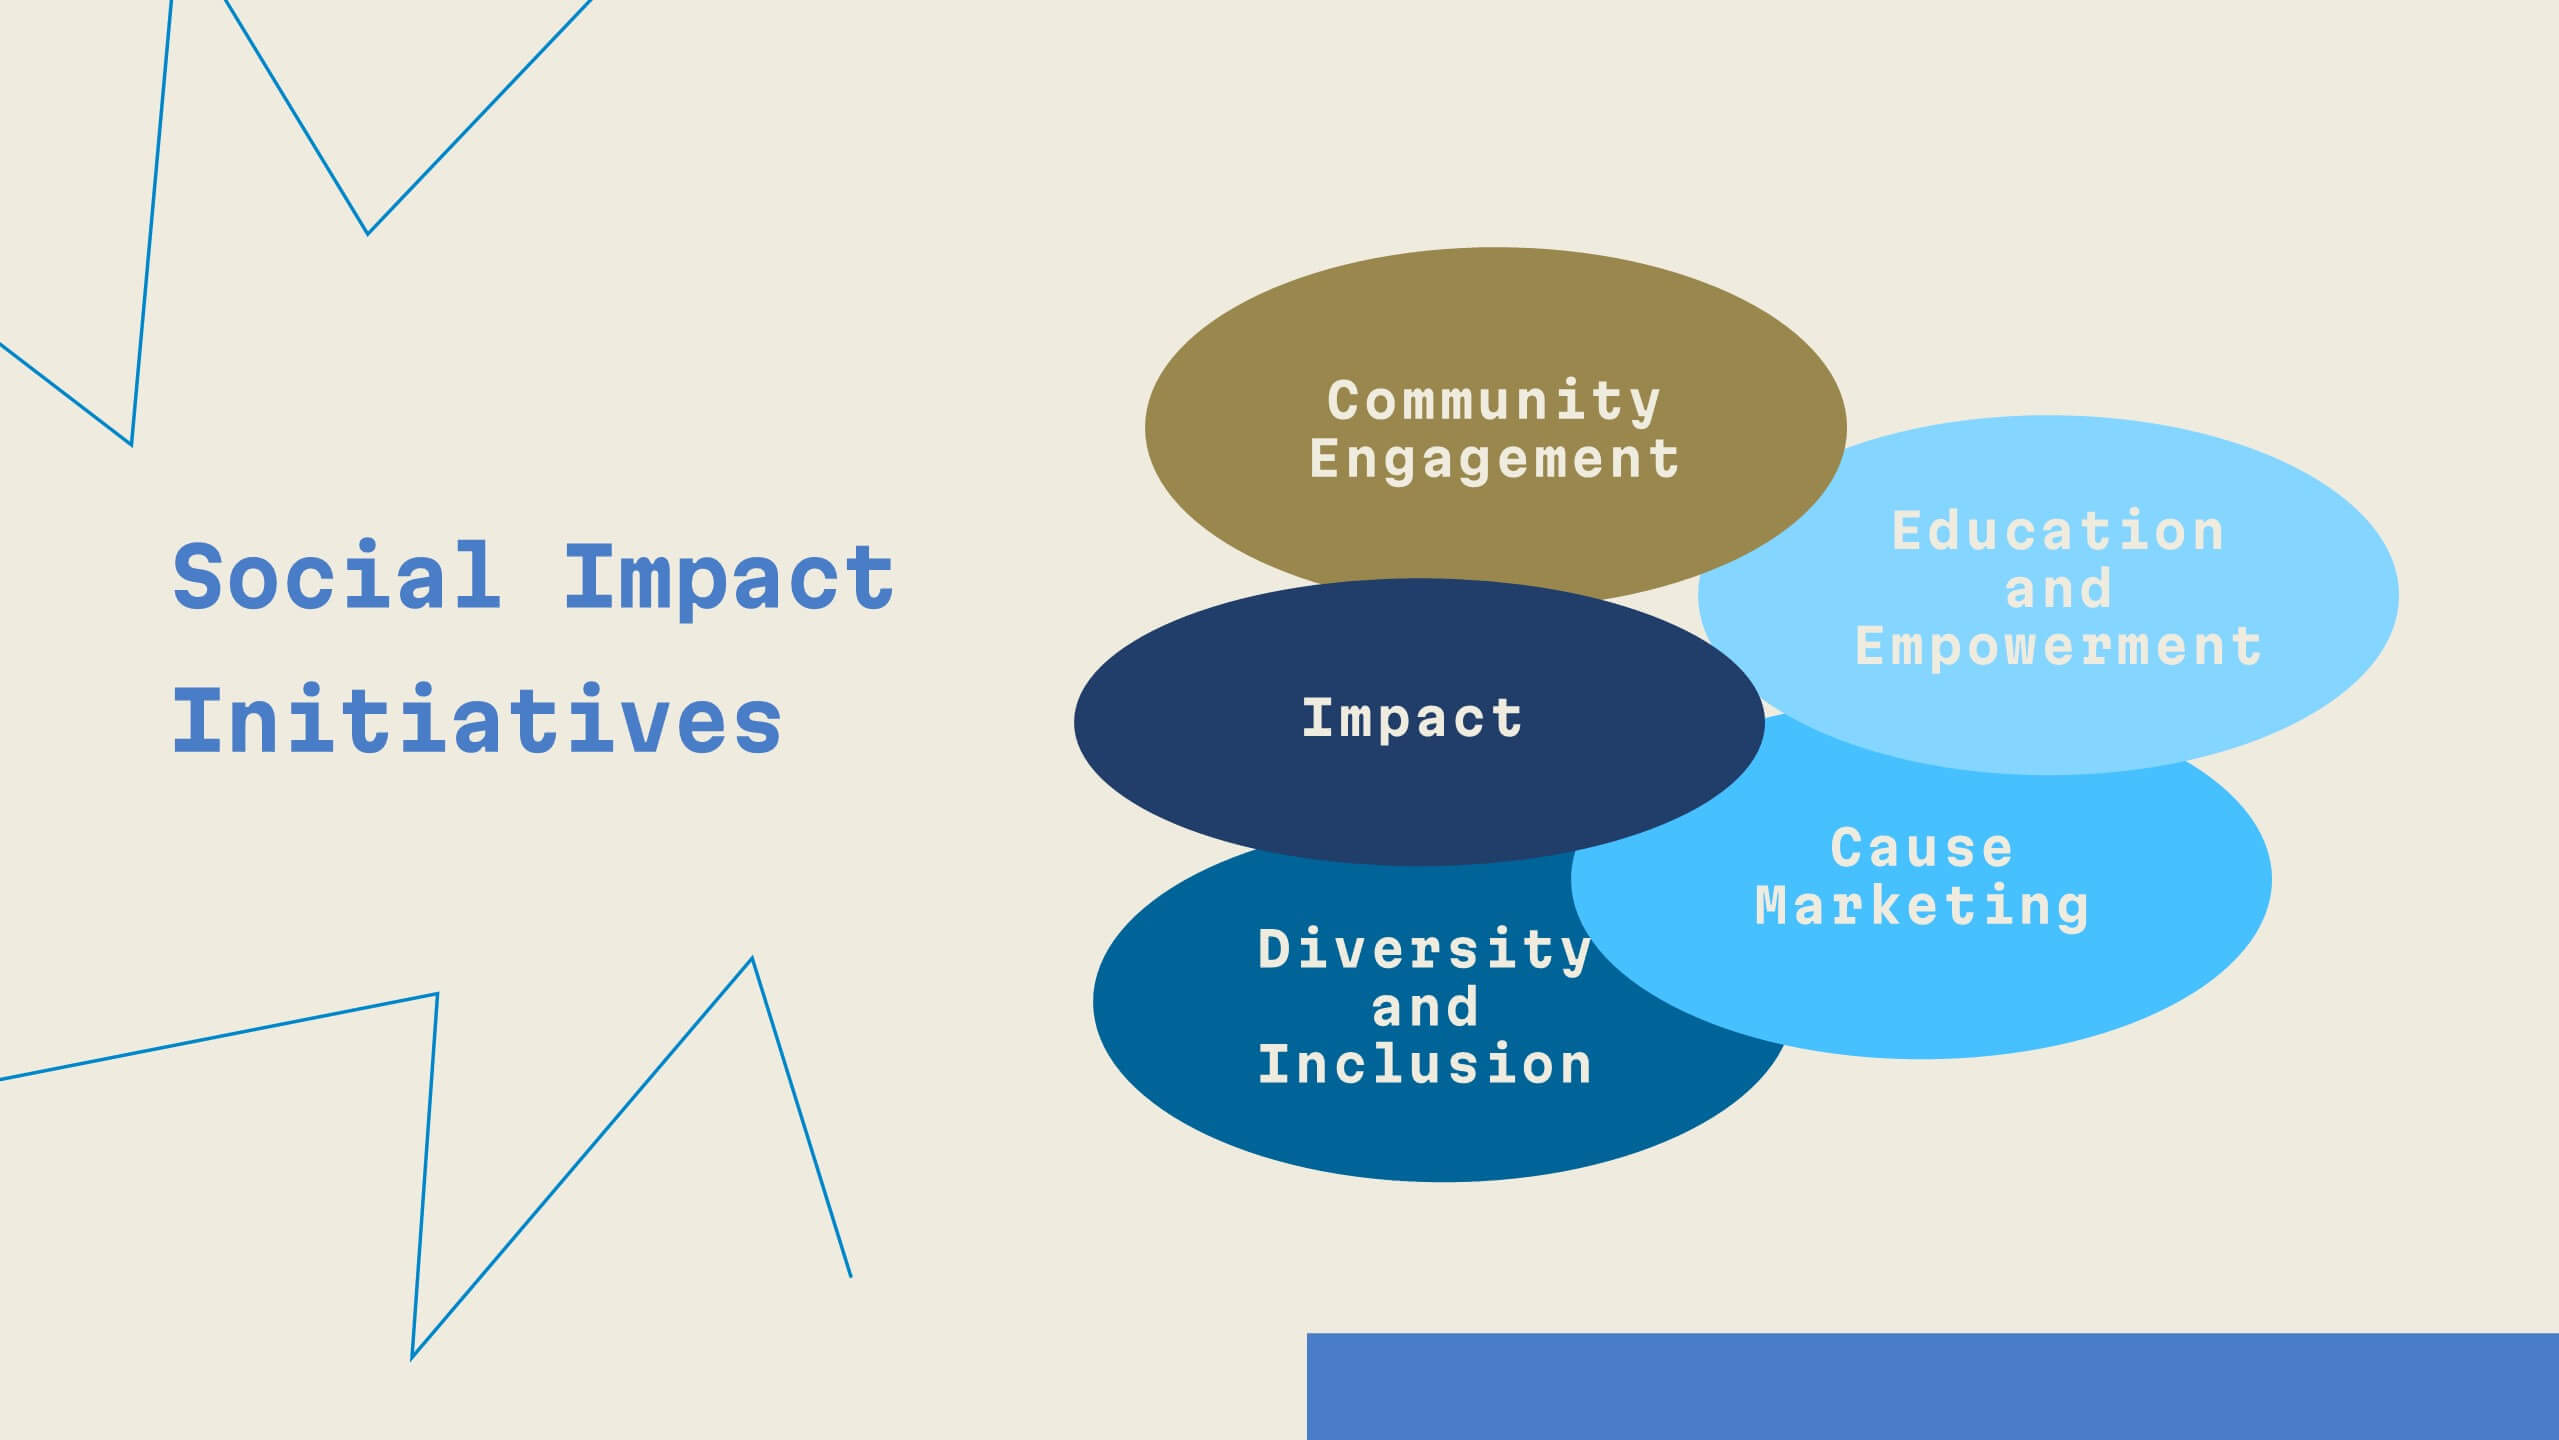
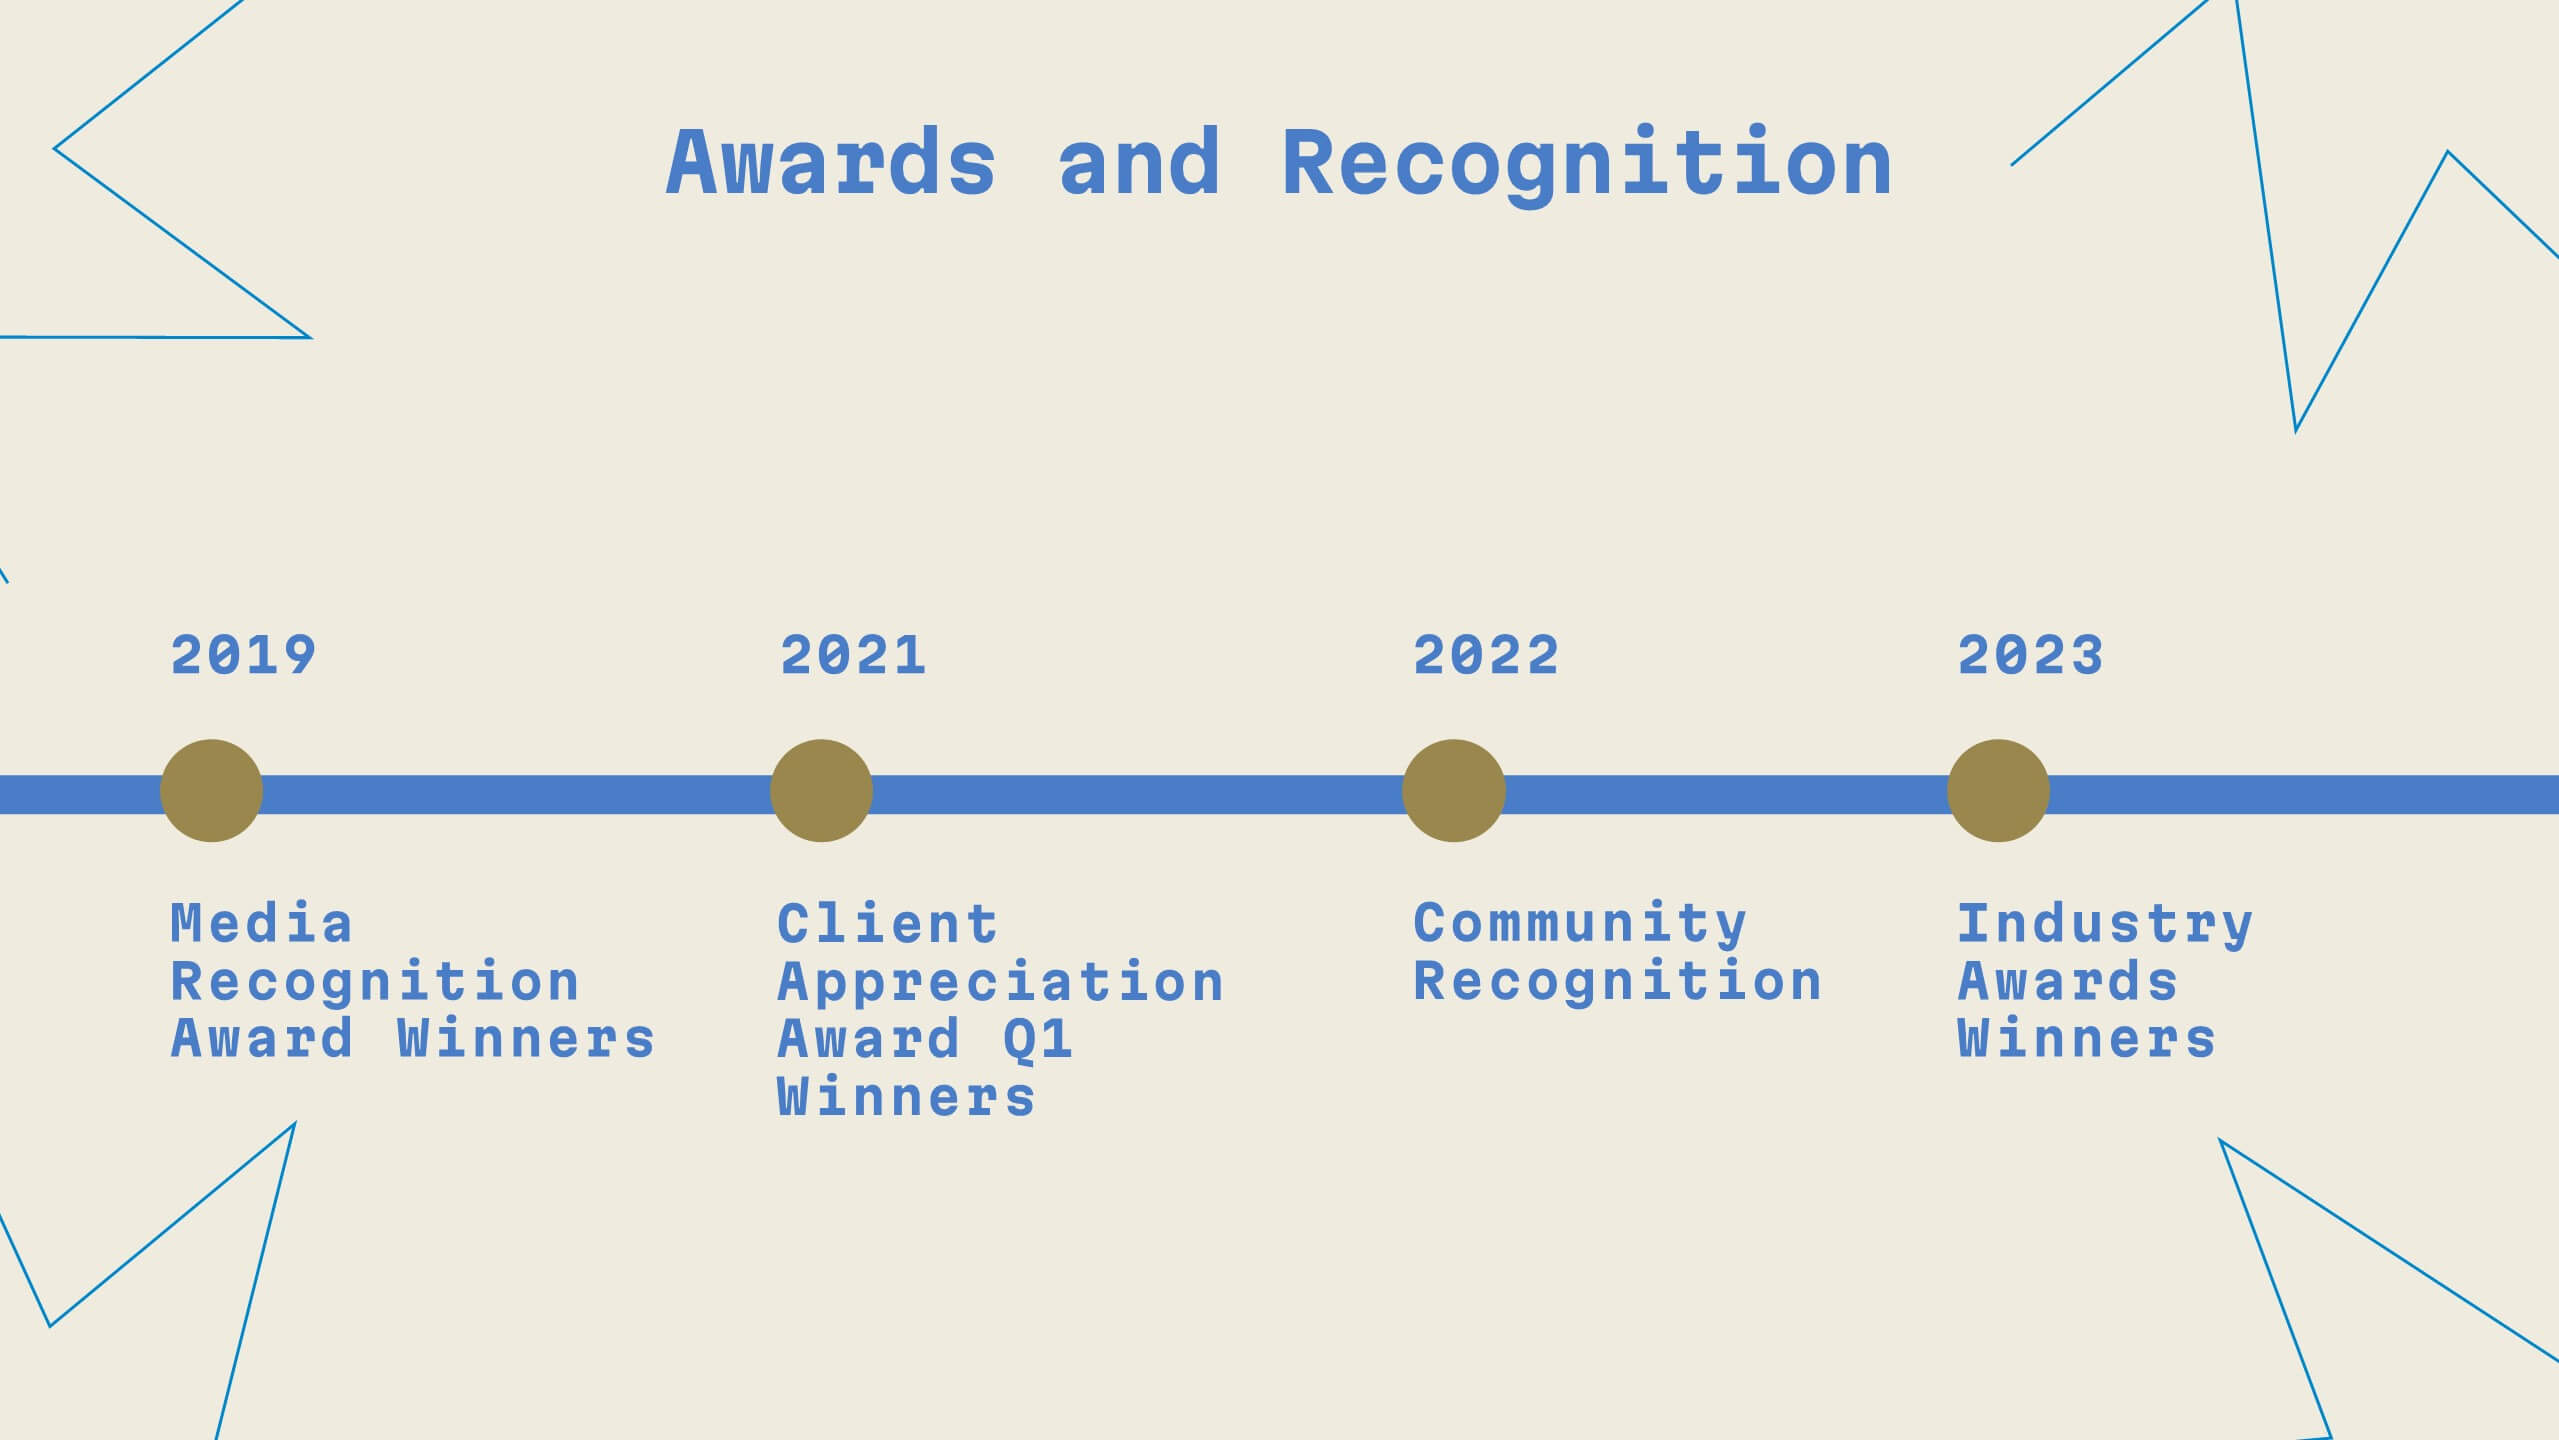
Unity Digital Agency Strategy Plan Presentation
Step into the future of digital marketing with this sleek template! From case studies to strategy development, it offers a comprehensive guide for creating impactful presentations. Highlight client success stories, industry trends, and creative processes with ease. Perfect for showcasing your agency's expertise. Compatible with PowerPoint, Keynote, and Google Slides.


6 diapositivas
Sales Team Infographic
The series presented showcases various slide templates tailored for enhancing sales team strategies and communication. Each slide is crafted to assist sales professionals in detailing team structures, sales goals, performance metrics, and strategic initiatives effectively. Utilizing vibrant color blocks and streamlined design elements, these templates make complex sales data approachable and engaging, facilitating clear and impactful presentations. The collection is designed with adaptability in mind, incorporating elements that can be easily customized to fit different team needs and company branding. These include comparative layouts for benchmarking, timeline formats for showcasing sales cycles, and diagrammatic representations for visualizing sales processes and results. Perfect for internal meetings, sales training sessions, and stakeholder presentations, these templates serve as essential tools for sales leaders to convey their team’s progress, celebrate wins, and strategize for future sales endeavors.


6 diapositivas
Brain Development Infographic
Brain Development refers to the growth, maturation, and organization of the brain throughout an individual's life, starting from early prenatal stages and continuing into adulthood. This infographic template serves as a valuable educational resource for educators, parents, healthcare professionals, and anyone interested in understanding the fascinating process of brain development. This infographic highlights the stages and factors that shape brain growth, to help promote awareness and emphasize the importance of creating supportive environments for brain development. Compatible with Powerpoint, Keynote, and Google Slides.


26 diapositivas
Effective Communication Skills Presentation
Discover the key to successful interactions with our Effective Communication Skills presentation template. This all-in-one template is fully compatible with PowerPoint, Keynote, and Google Slides, making it the perfect addition to your toolkit, whether you're an educator, a corporate trainer, or a team leader. Our template is meticulously designed to help you convey the essence of effective communication, breaking down complex concepts into easily understandable segments. From active listening to clear articulation, it covers various aspects of communication that are crucial in both personal and professional environments. Each slide in the Effective Communication Skills template features a clean, engaging design, encouraging viewers to focus on the content. Editable charts, graphs, and models allow for a customized experience, ensuring that your message resonates with your specific audience. By using this template, you can confidently guide your audience through the intricacies of effective communication, making your presentation a reference point for those looking to improve their communication skills. Elevate your presentations and ensure your message is not just heard, but understood and acted upon.


5 diapositivas
Best Travel Planning Template
Bring wanderlust to life with a slide that turns trip planning into a clear, engaging journey. This presentation breaks down key travel steps—documents, packing, routes, and timing—using simple visuals that keep details organized and easy to follow. Fully customizable and compatible with PowerPoint, Keynote, and Google Slides.


7 diapositivas
Product Roadmap Infographic Presentation
A well-designed Roadmap infographic can be a powerful tool used to communicate your vision. This template highlights important dates, objectives and milestones to achieve over a period of time. The roadmap provides a clear view of what needs to be done, and when it needs to be done. This template is fully editable in PowerPoint, Keynote and Google Slides, making it easily personalized and customized to suit your project needs. Use this roadmap infographic to help you display a plan for accomplishing a long-term goal, and communicate your vision in an appealing and memorable way!


10 diapositivas
Water Cycle and Hydrological Study Presentation
Break down complex water cycle processes with this engaging diagram layout. Featuring a bottle-shaped center graphic with directional arrows, it’s perfect for illustrating hydrological stages or sustainability concepts. Fully editable in PowerPoint, Keynote, and Google Slides, making it ideal for educational, environmental, or scientific presentations. Clear, modern, and easy to use.


5 diapositivas
Professional Business Proposal Presentation
Make your pitch stand out with a polished, minimal design that highlights every key stage of your business strategy. This clean visual layout is perfect for outlining project phases, services, or data-driven insights with clarity and impact. Fully compatible with PowerPoint, Keynote, and Google Slides for easy customization.


4 diapositivas
Audience Segmentation by Persona Presentation
Make data talk with personality! This vibrant slide set helps you visually compare buyer personas and their unique traits to refine audience targeting strategies. Whether you’re mapping user types or customer behaviors, these editable slides are perfect for strategic marketing. Fully compatible with PowerPoint, Keynote, and Google Slides.


5 diapositivas
Ecological Impact Reduction Strategies Presentation
Present your sustainability efforts with the Ecological Impact Reduction Strategies Presentation. This tree-inspired layout is perfect for outlining key eco-friendly initiatives, from waste management to energy efficiency. Clean visuals and editable elements make it easy to adapt for environmental proposals, reports, or team planning. Fully customizable in Canva, PowerPoint, or Google Slides.


8 diapositivas
Restaurant Menu Design Presentation
Showcase your menu items with style using this bold, modern restaurant menu infographic. Designed to highlight pricing, meal categories, and featured items, this layout is perfect for restaurant presentations, promotions, or digital signage. Includes editable text areas and food-themed icons. Works seamlessly in PowerPoint, Keynote, and Google Slides.


26 diapositivas
Operational Efficiency Tips Purple Presentation
Optimize your team's workflow and showcase your strategies for improved performance with this operational efficiency template. The vibrant purples and dynamic design invite viewers into a world where streamlined processes and clear objectives lead to success. Lay out the steps of your action plan, from the CEO's vision to the team's execution, with a variety of slides designed for clear communication. Charts and diagrams turn complex data into easy-to-follow visuals, while mockups provide a real-world view of your tools and platforms. Tailored for use in popular presentation software, this set of slides is an excellent aid for managers and consultants aiming to present plans that boost productivity and cut down waste. It’s all about making the complex simple and achieving more with less, helping your audience see the path to a leaner and more effective operation.


7 diapositivas
Frequently Asked Questions (FAQ)
Answer key concerns clearly with this Frequently Asked Questions (FAQ) infographic template. Featuring a clean question mark-centered design with six content blocks, this layout is perfect for addressing customer queries, onboarding information, or stakeholder briefs. Fully customizable in PowerPoint, Keynote, and Google Slides.


5 diapositivas
Customer Profile and Persona Insights Presentation
Showcase your target audience with style using this modern persona insights deck. Highlight demographics, traits, and behaviors through visual cards and editable text placeholders. Perfect for marketing strategy, user research, or campaign planning. Fully customizable in PowerPoint, Keynote, and Google Slides to align with your branding and presentation needs.


6 diapositivas
Customer Satisfaction Smile Chart Presentation
Bring your data to life with a slide that instantly shows how customers feel, blending clean visuals with an intuitive emotion scale. This presentation helps you communicate feedback trends, highlight satisfaction levels, and support decision-making with clarity. Ideal for reports, reviews, and strategy updates. Fully compatible with PowerPoint, Keynote, and Google Slides.