


Características


¿Tienes alguna pregunta?
Recomendar


20 diapositivas
Cinderbark Product Launch Pitch Deck Presentation
Showcase your product launch with a sleek, modern, and professional pitch deck template. This design empowers you to captivate stakeholders by clearly presenting your problem statement, unique solutions, and market opportunity. Effectively highlight your target audience, revenue model, and competitive landscape to demonstrate market viability. Create impact with visuals detailing your sales strategy, growth projections, and financial summary, ensuring transparency and confidence in your business plan. Timeline and milestone slides keep the focus on key achievements and future goals, while team introduction pages establish credibility and expertise. Fully customizable and compatible with PowerPoint, Google Slides, and Keynote, this template is ideal for startups, entrepreneurs, and product managers aiming for a polished and compelling presentation. Tailor it to your needs and deliver your vision with clarity and style.


26 diapositivas
Navigating Freelance and Flexible Work Presentation
Take control of your career with this insightful presentation on navigating freelance and flexible work. Covering key topics like client management, productivity strategies, income stability, and remote work tools, this template helps you present a clear roadmap to success. Fully customizable and compatible with PowerPoint, Keynote, and Google Slides for a seamless experience.


10 diapositivas
5G Technology and Network Advancements Presentation
Showcase key milestones and trends in modern telecom evolution with this dynamic 5G network infographic. The slide features a clean, wave-like flow connecting five signal tower icons, perfect for outlining technological phases, speed upgrades, or infrastructure rollouts. Suitable for IT professionals, telecom analysts, and future-tech strategists. Fully customizable in PowerPoint, Keynote, and Google Slides.


26 diapositivas
Cassanra Presentation Template
Cassanra is a bold, professional template with a retro look. Its ravishing, modern aesthetic will stand out and grab your attention, while detailed design elements keep it readable. Packed with features like charts, timelines, and easy to edit text blocks, Cassanra is perfect for businesses as well as personal use. A mixture of bold colors are used to help keep the look appealing and easy to read. This template comes with a large amount of features from charts, timelines and an easy to edit text this template is perfect for businesses seeking to make an impression on their audience.


5 diapositivas
Customer Loyalty Program Strategy
Design a winning rewards system with this engaging loyalty program infographic. Featuring a vertical layout with five customizable stages alongside a gift icon, this slide is perfect for outlining incentives, customer tiers, or retention plans. Fully editable in PowerPoint, Keynote, and Google Slides.


6 diapositivas
Business Tree Diagram Layout Presentation
Bring your ideas to life with a dynamic visual flow that connects every stage of your business strategy. Perfect for mapping growth, processes, or team structures, this clean and modern layout keeps your data clear and engaging. Fully compatible with PowerPoint, Keynote, and Google Slides for effortless customization.


6 diapositivas
Children's Smile Rating Infographic
Smile Rating refers to a method of evaluating customer satisfaction or user experience by measuring the positive emotional response elicited, often in the form of a smile. This infographic template is a visually engaging way to showcase customer satisfaction or feedback using smiley faces to represent different levels of happiness or contentment. This type of infographic is commonly used in customer service, user experience, and feedback analysis. This can provide valuable insights into emotional engagement and satisfaction. This infographic is designed to focus on providing services or products that are intended to create a positive and enjoyable experience.


8 diapositivas
3D Infographic Design Presentation
Make your data pop—literally—with a stacked design that brings depth and clarity to your message. This 3D infographic template helps break down layered concepts, step-by-step processes, or hierarchical data in a visually striking way. It’s fully customizable and compatible with PowerPoint, Keynote, and Google Slides for easy presentation building.


3 diapositivas
Break Even Financial Model Presentation
Bring your financial story to life with this sleek and professional presentation design. Ideal for illustrating profit margins, cost recovery, or growth potential, it helps visualize when investments start to pay off. Fully customizable and compatible with PowerPoint, Keynote, and Google Slides for effortless editing and impactful presentations.


26 diapositivas
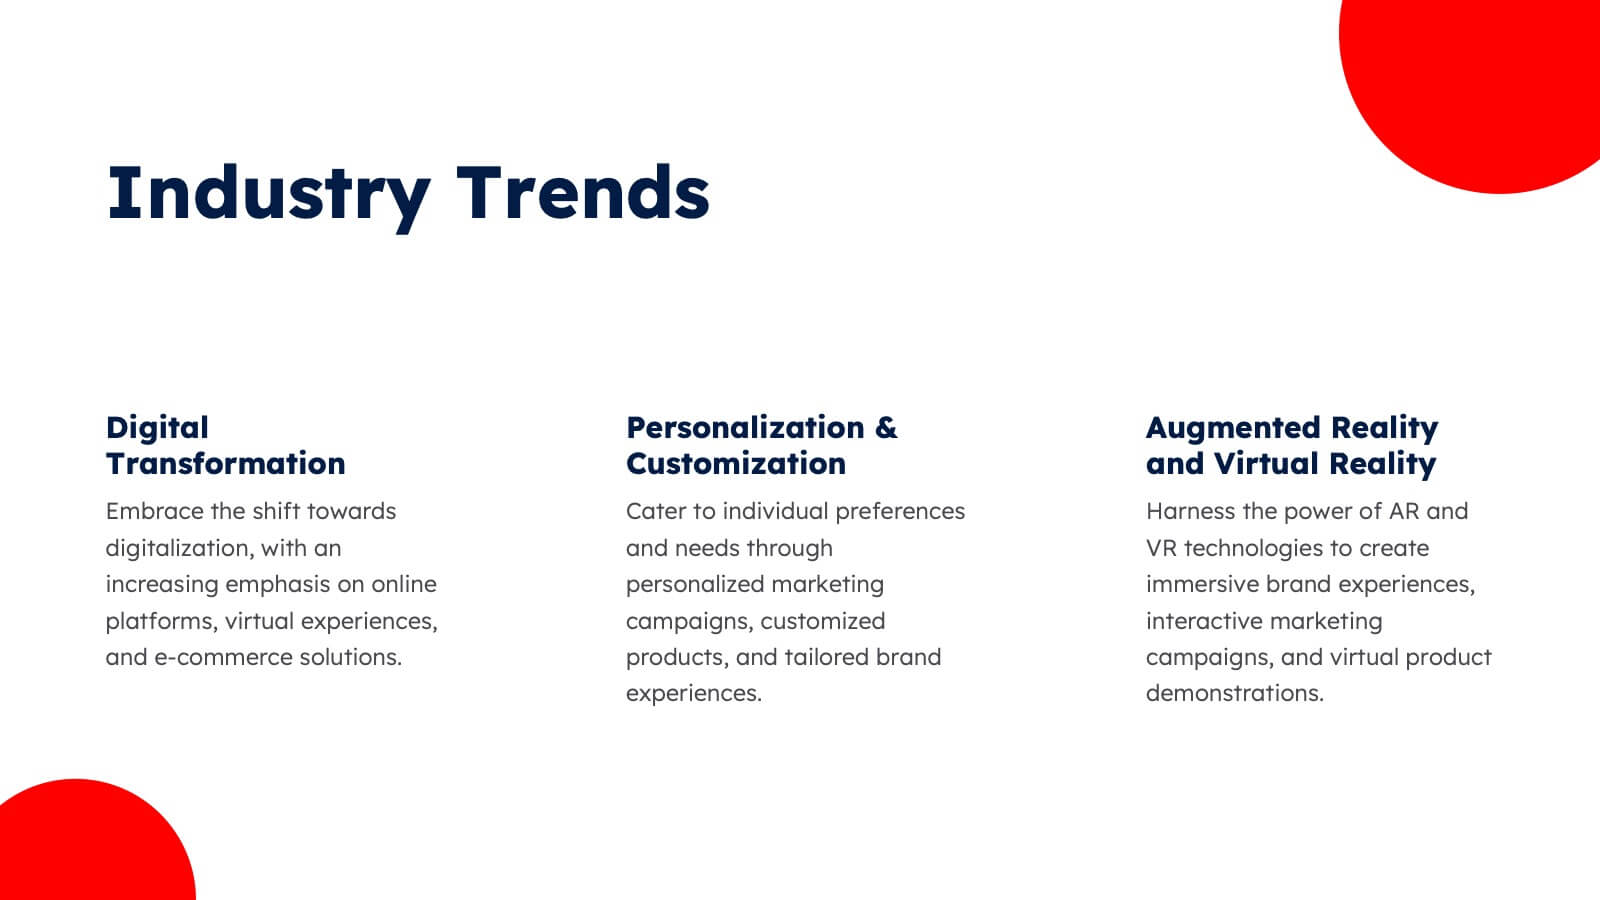
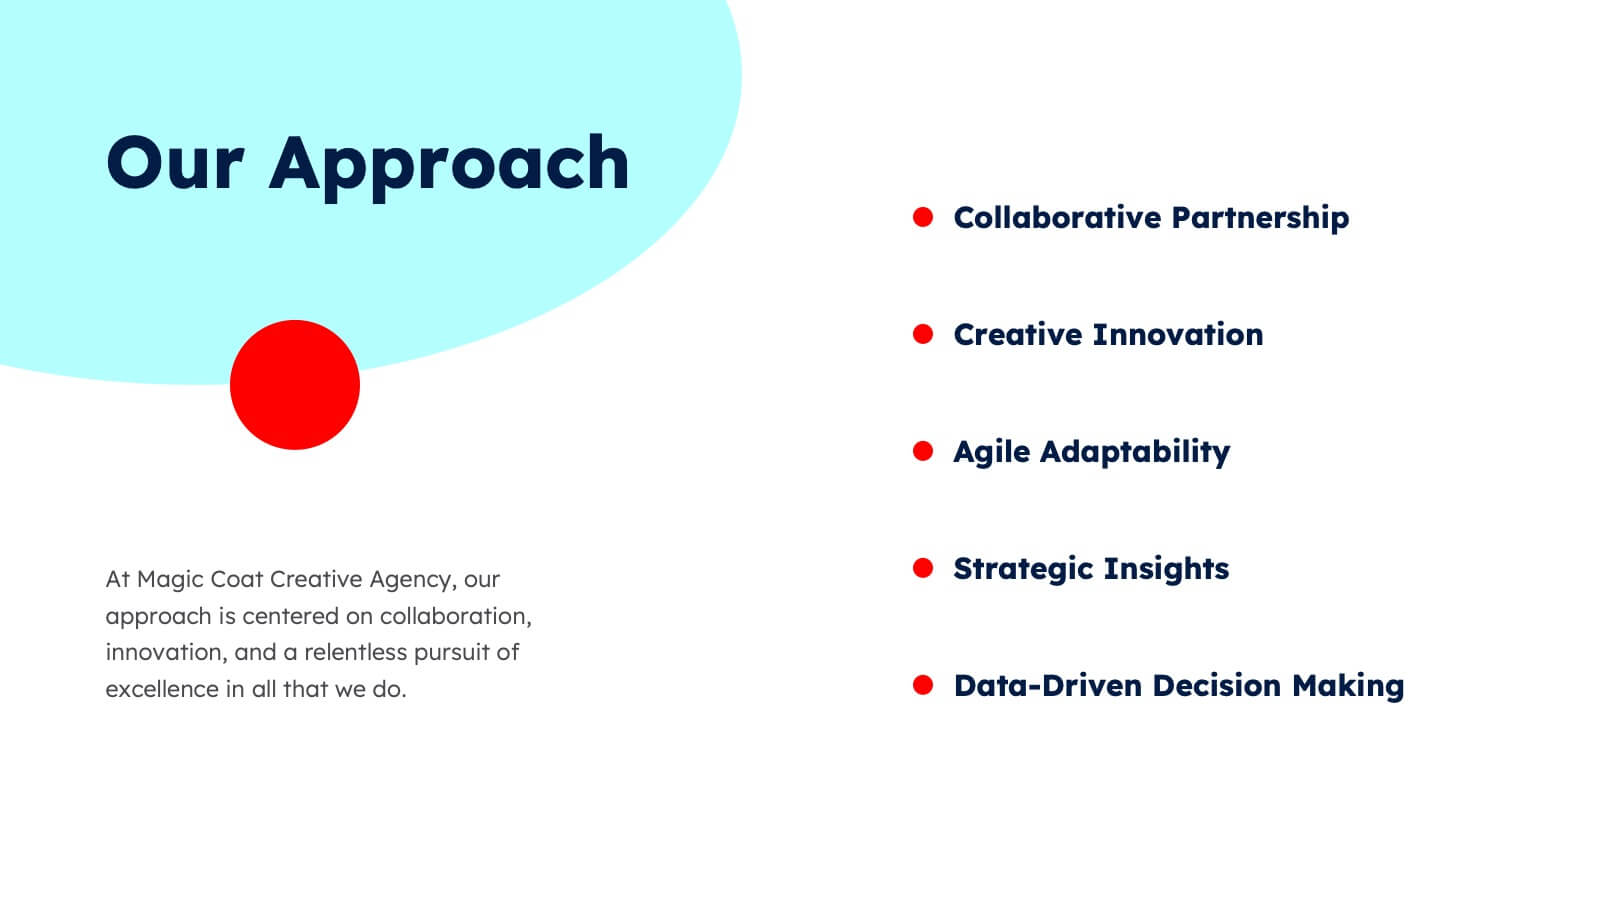
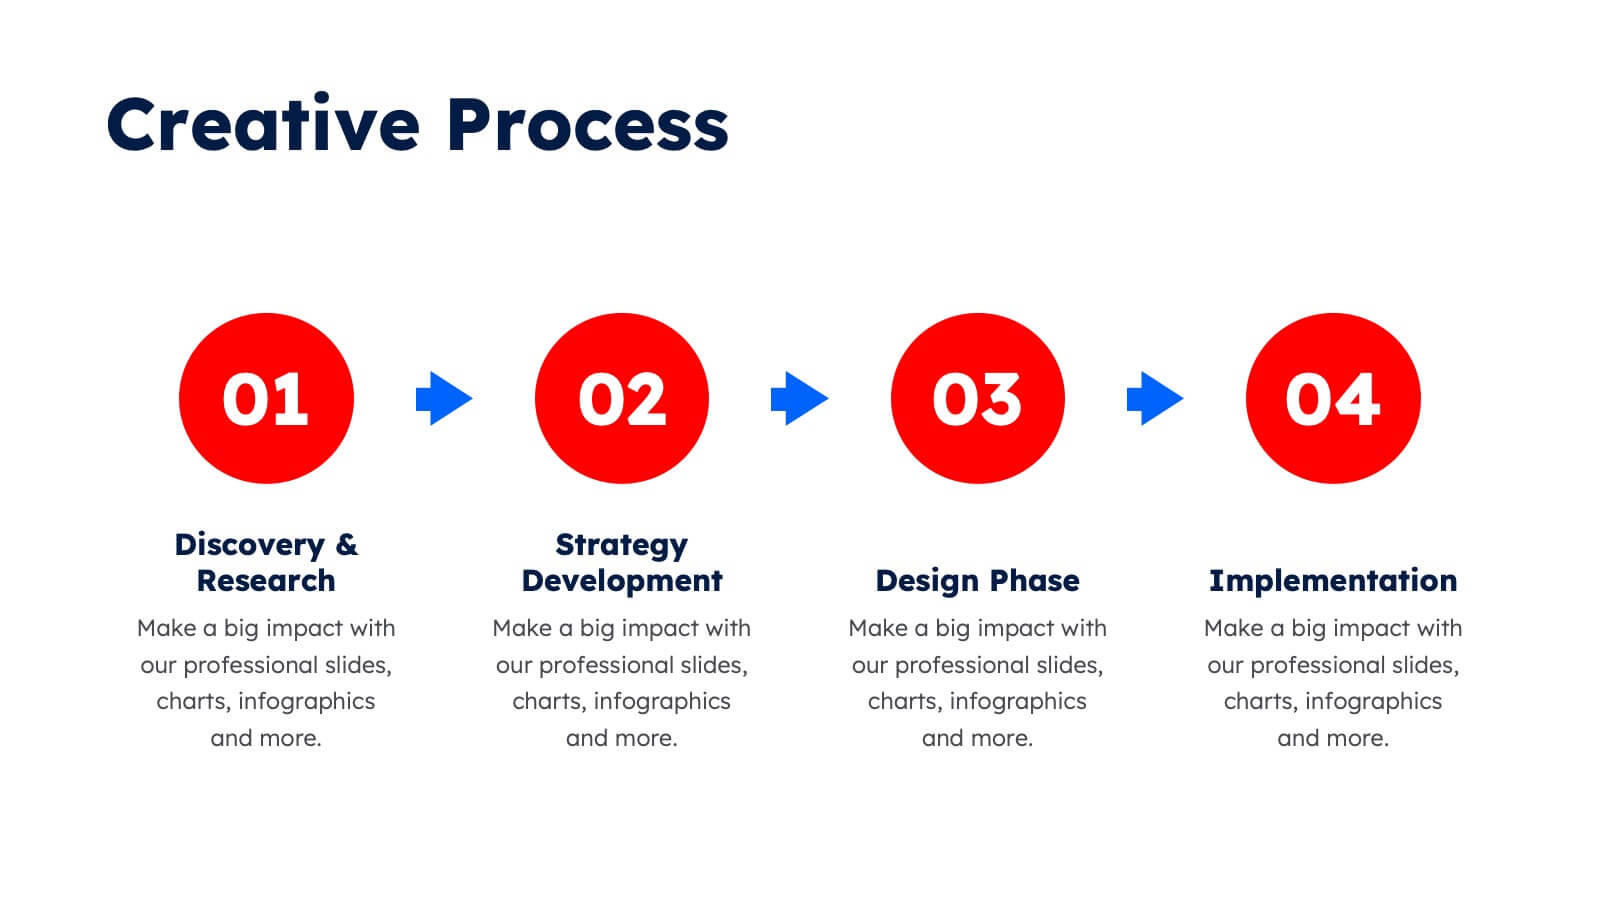
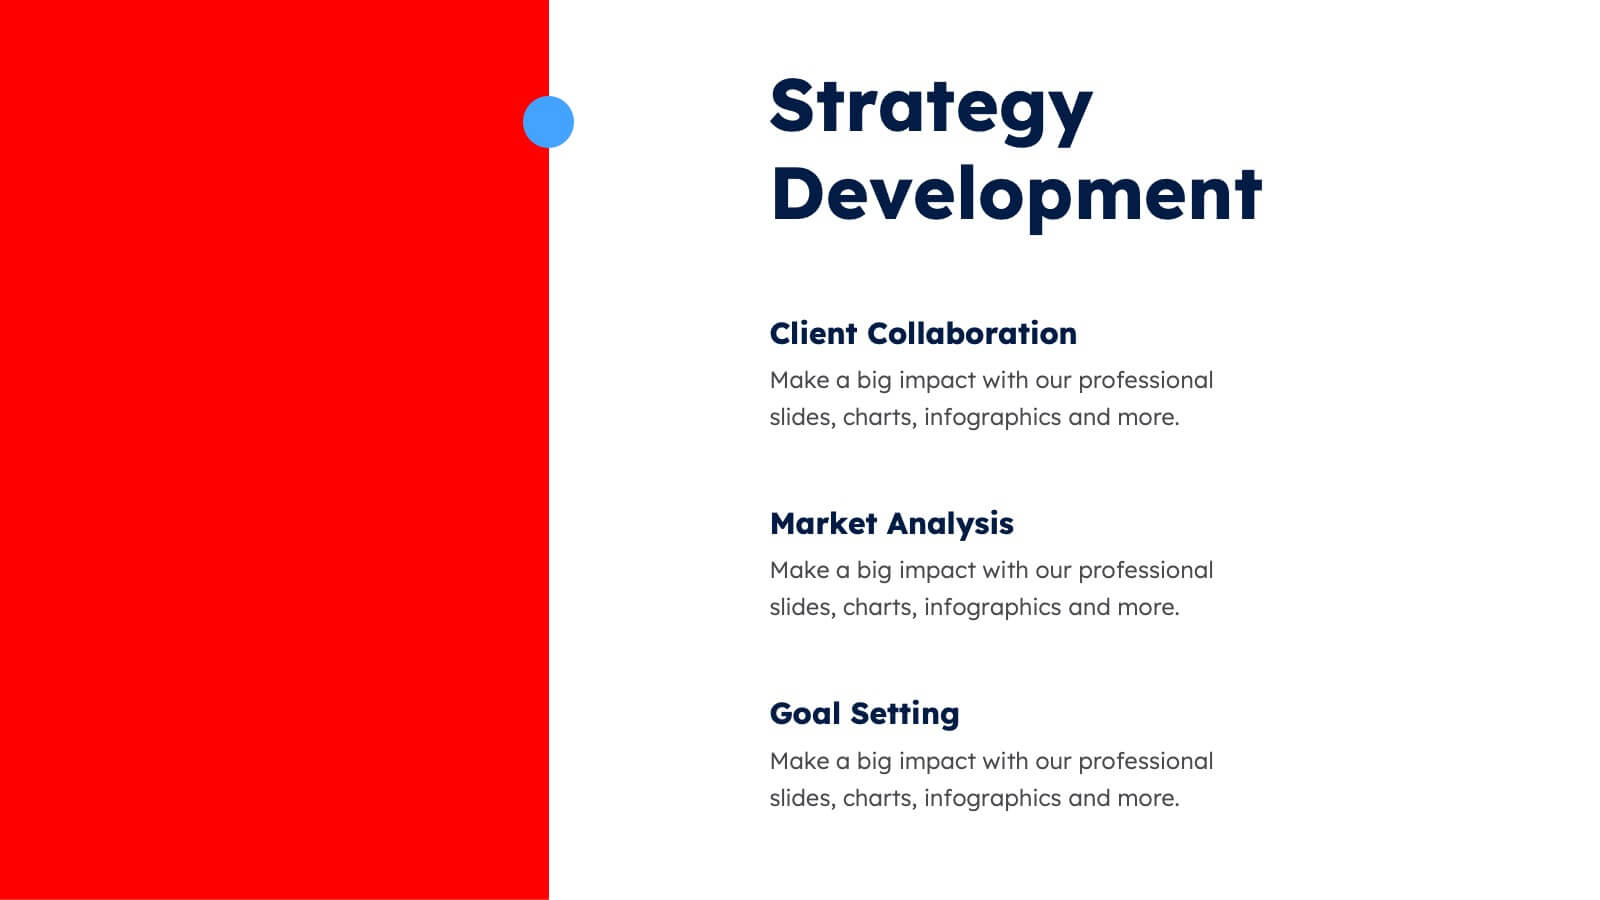
Entrepreneurship 101 Professional Presentation
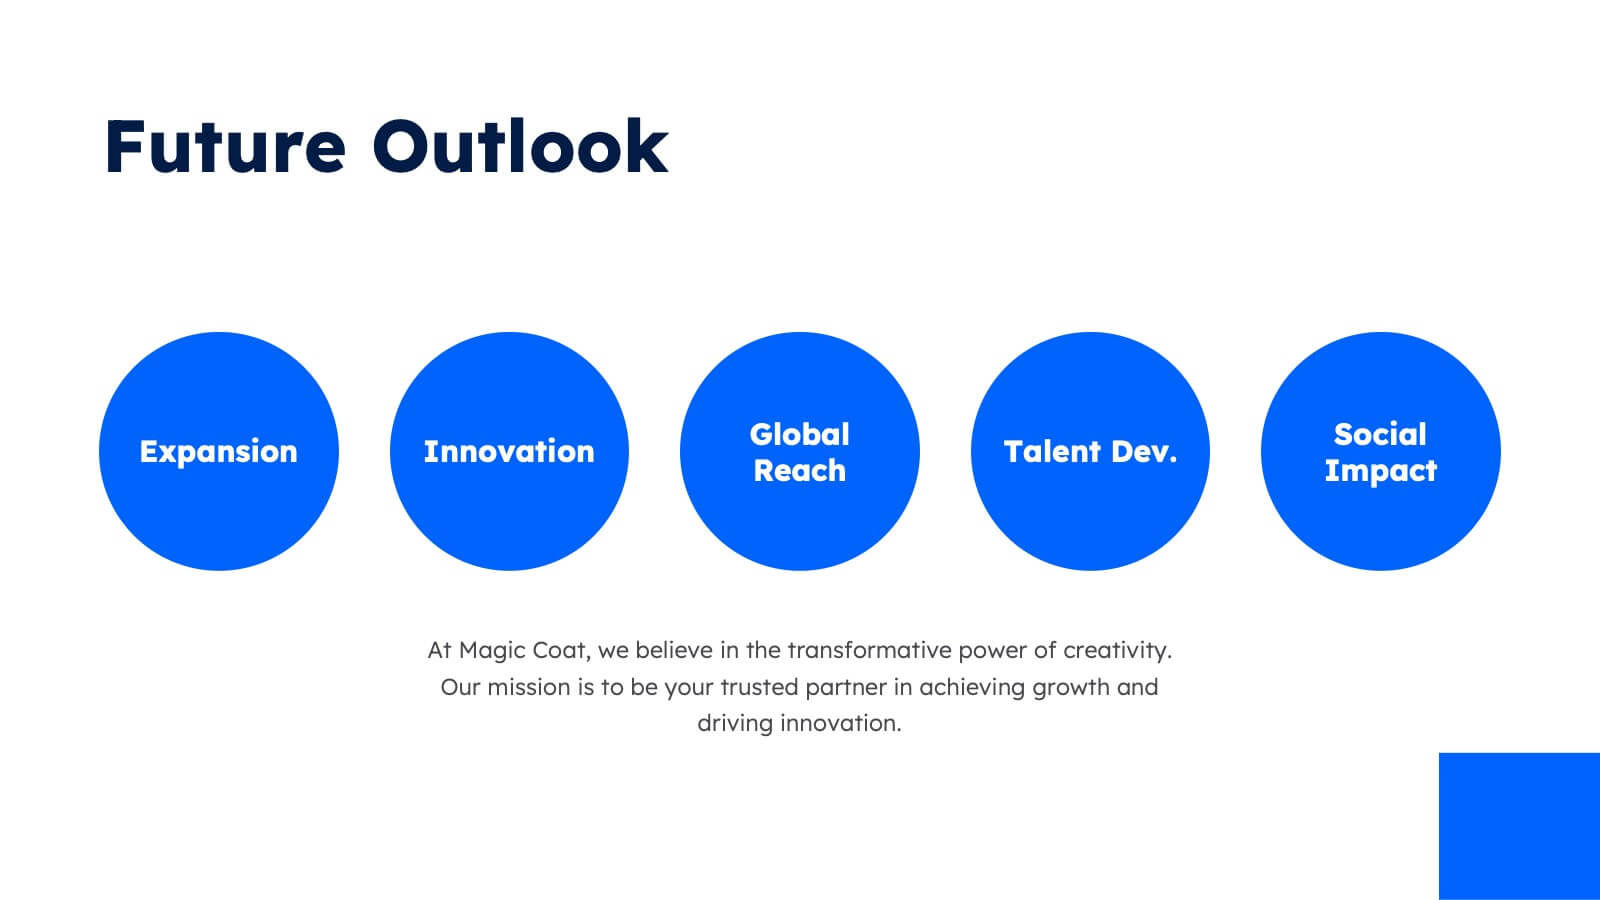
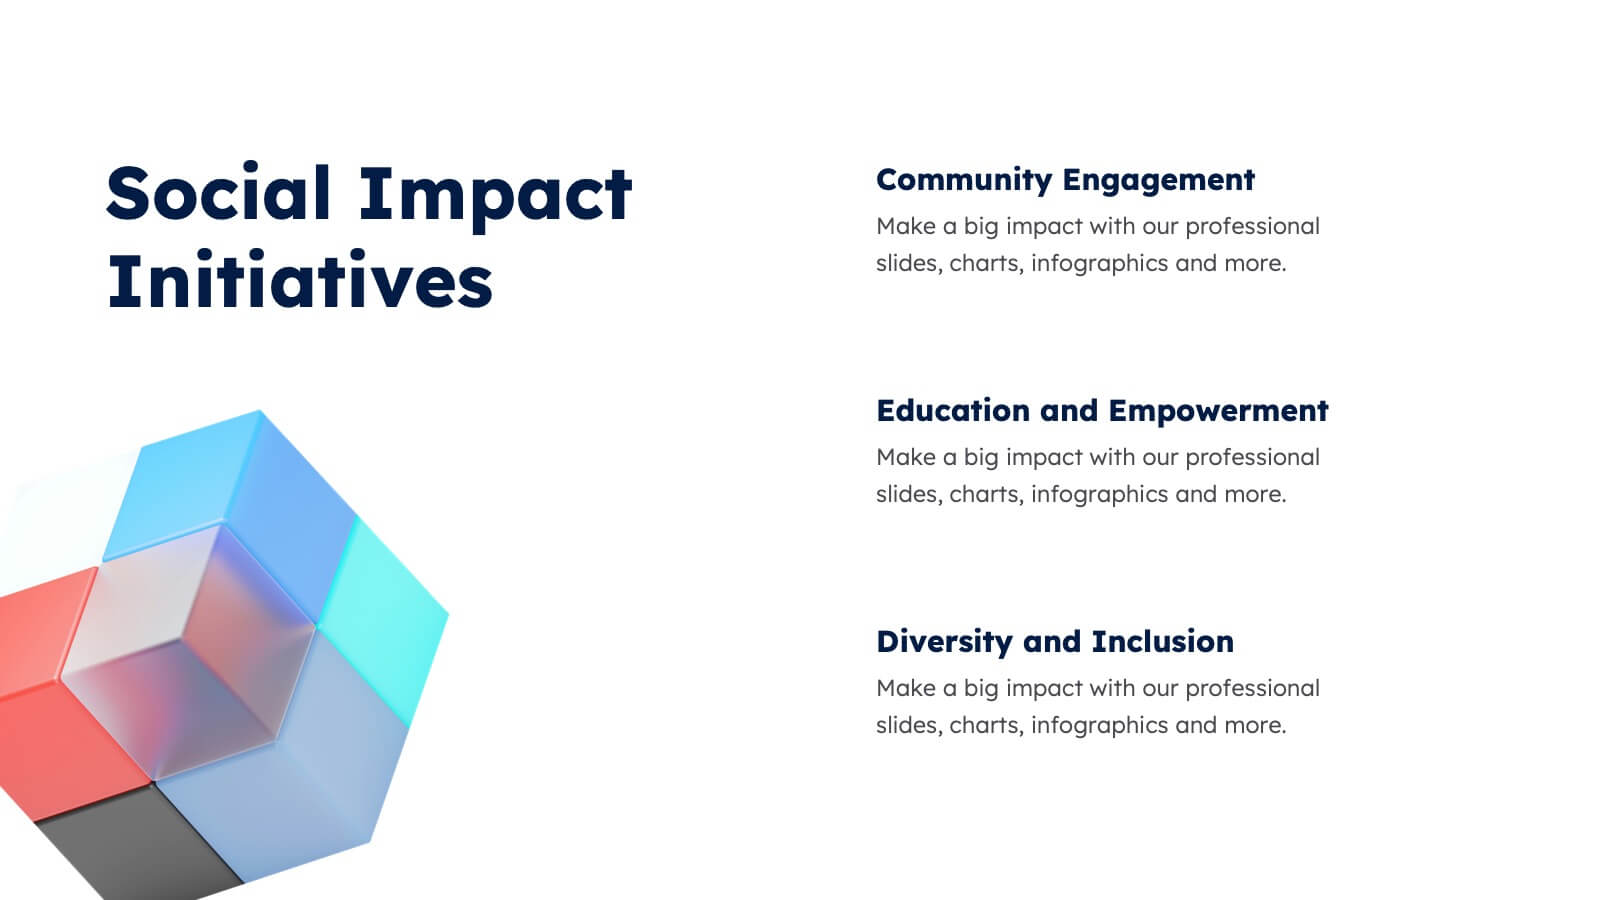
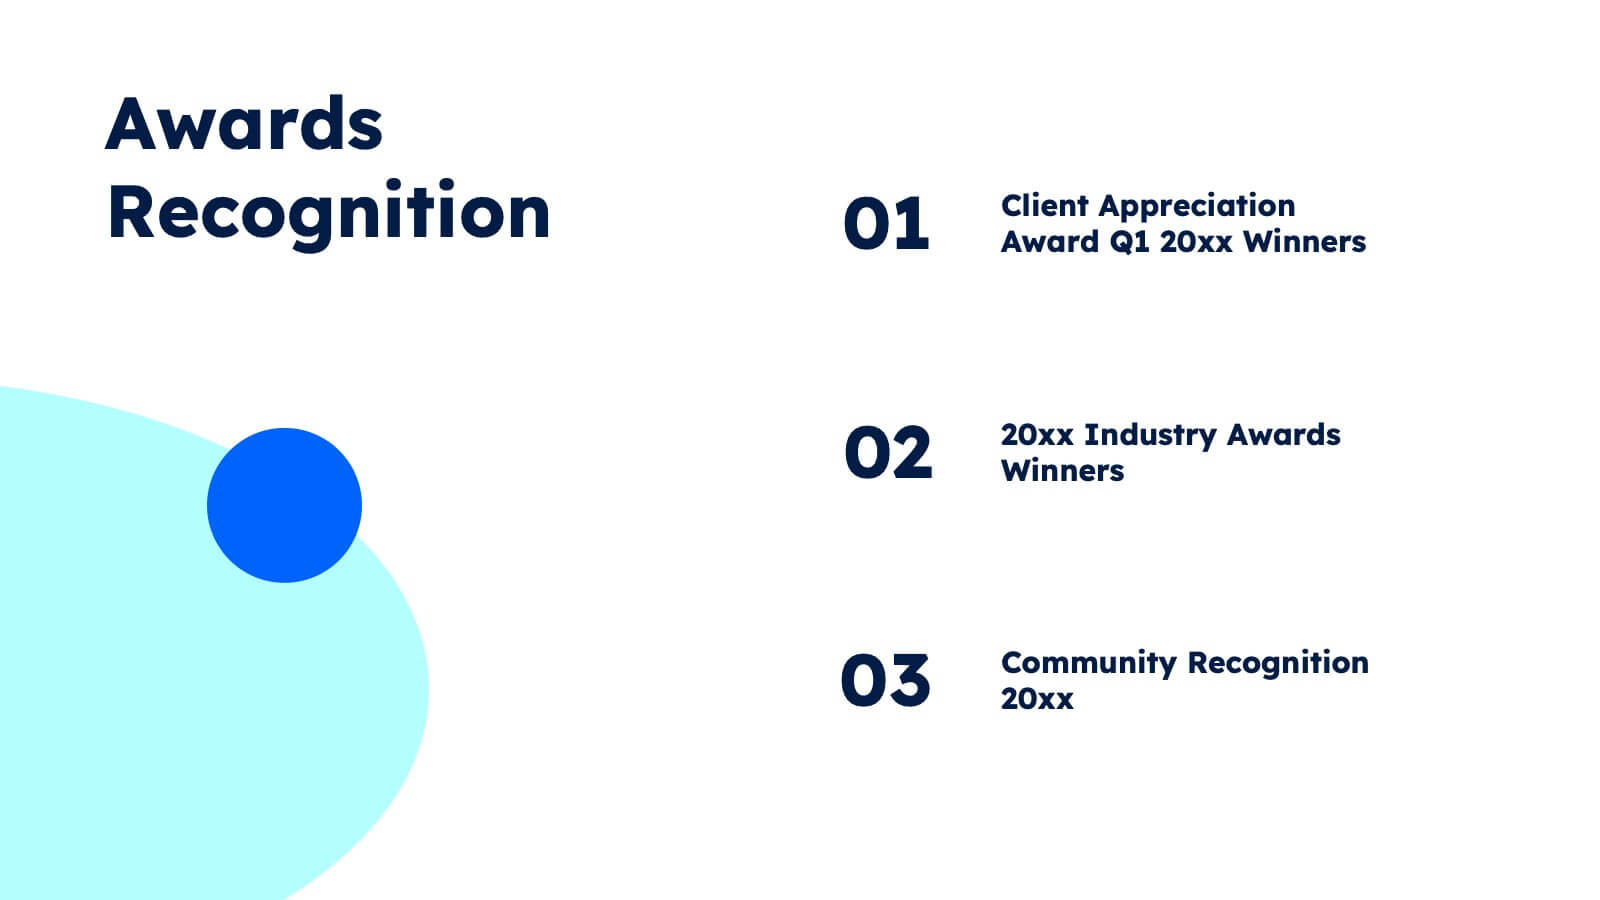
This template offers a modern, professional framework for presentations about Entrepreneurship 101. It combines a clean, contemporary design with a palette of cool blues and muted reds, setting a tone that's both creative and serious—just right for the innovative spirit of entrepreneurship. Within its slides, you'll find all the tools needed to outline the essentials of starting a new business, from identifying opportunities to understanding market trends. Perfect for aspiring entrepreneurs, business school classes, or startup workshops, the template includes varied slide types: team introductions, big ideas, comparative analyses, and growth charts. The slides also feature infographics for brainstorming sessions, process flows for business operations, and timeline representations for strategic planning. Designed for adaptability, the template works seamlessly with PowerPoint, Keynote, and Google Slides, ensuring your entrepreneurial vision can be shared with clarity and impact.
6 diapositivas
Performance Tracking Heat Map Presentation
Turn performance data into bold visual stories with a sleek, bubble-style layout that highlights progress and key metrics. Ideal for showcasing results, performance reviews, or KPI tracking, this presentation helps audiences grasp insights quickly. Fully compatible with PowerPoint, Keynote, and Google Slides for seamless editing and customization.


7 diapositivas
Roadmap Guide Infographic
A roadmap guide is a visual representation of the steps you need to take in order to reach your destination. A roadmap infographic is a great way to show your clients what the future will look like. Use this template to create an infographic that's high-energy, enthusiastic, and engaging. This infographic is designed to help guide you by showing where you are now, what direction you're going, and where you need to go next. This template is fully customizable and compatible with Powerpoint, Keynote, and Google Slides. Break down complex plans into easily digestible visual elements.


22 diapositivas
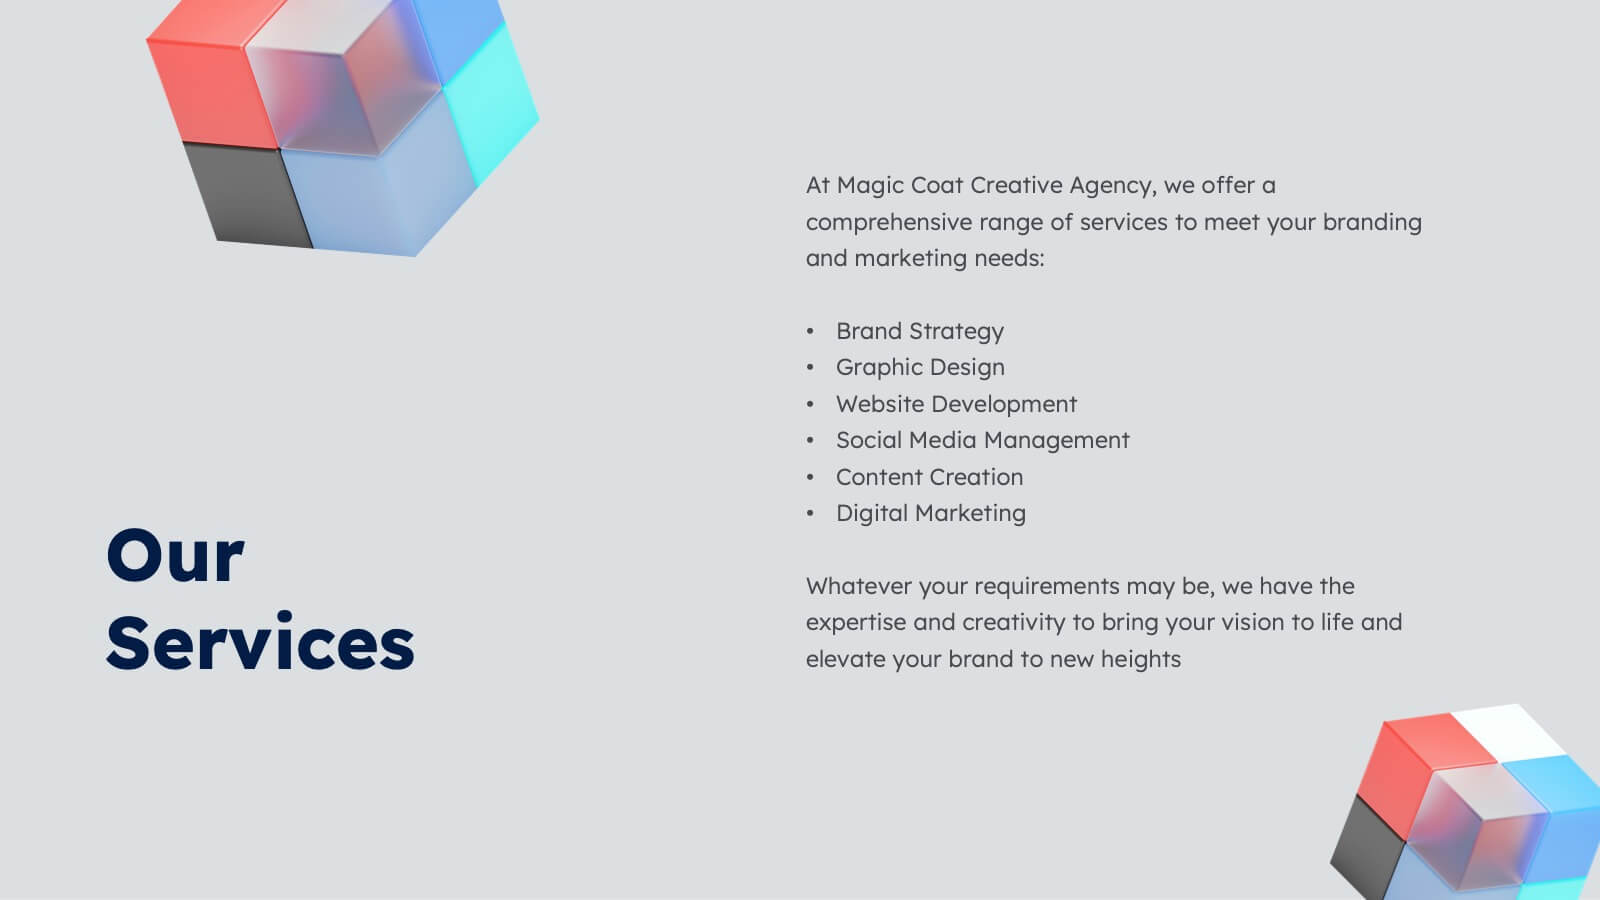
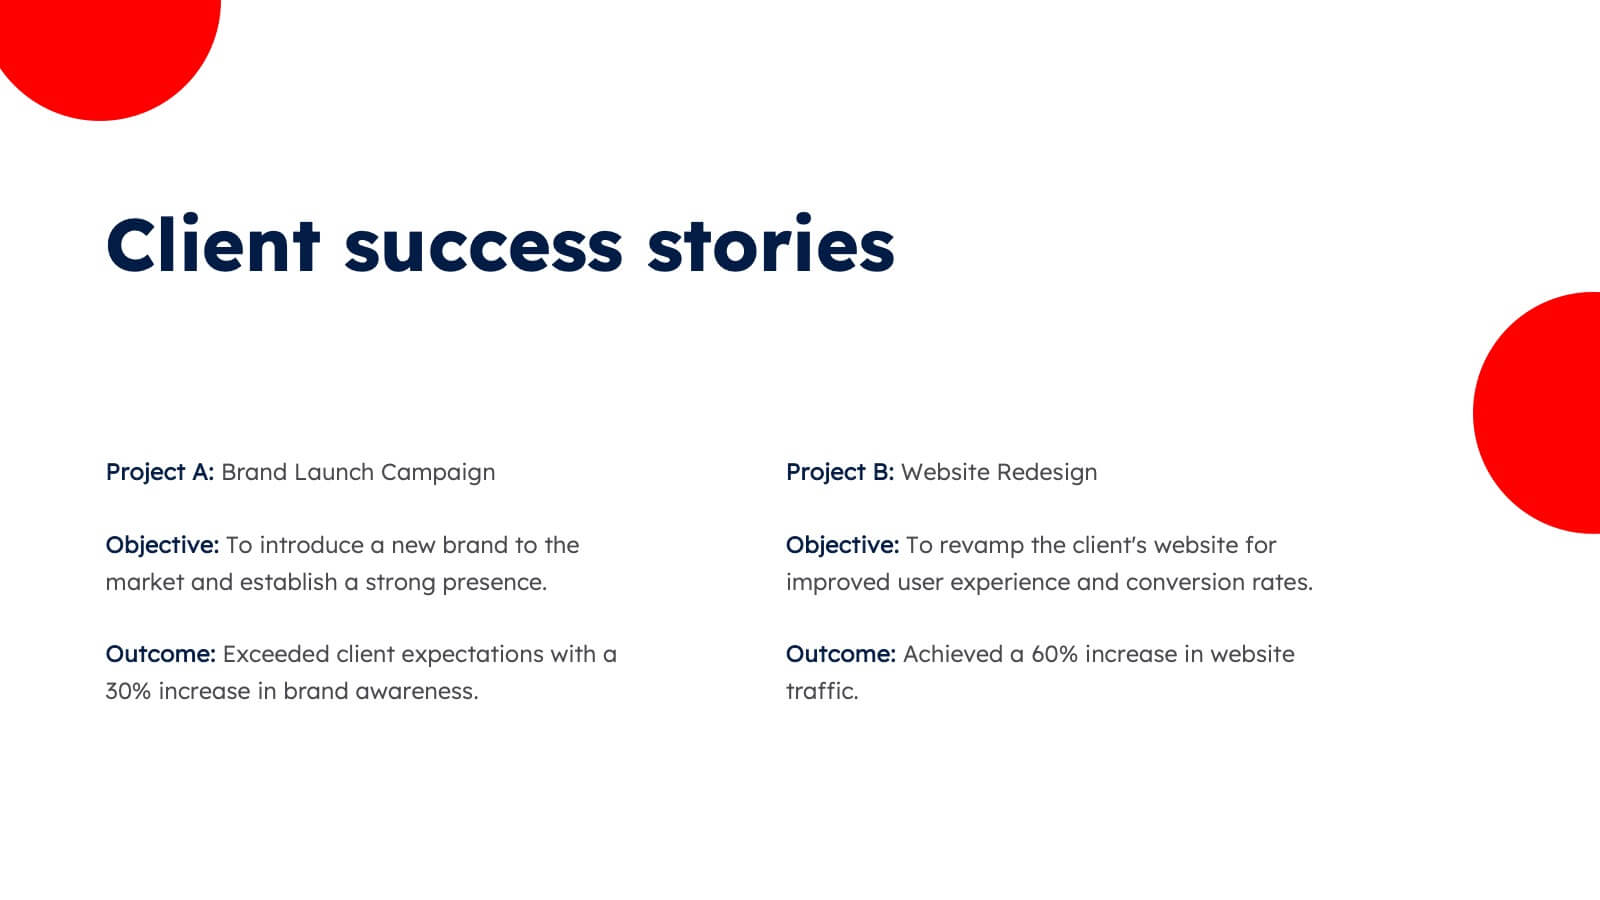
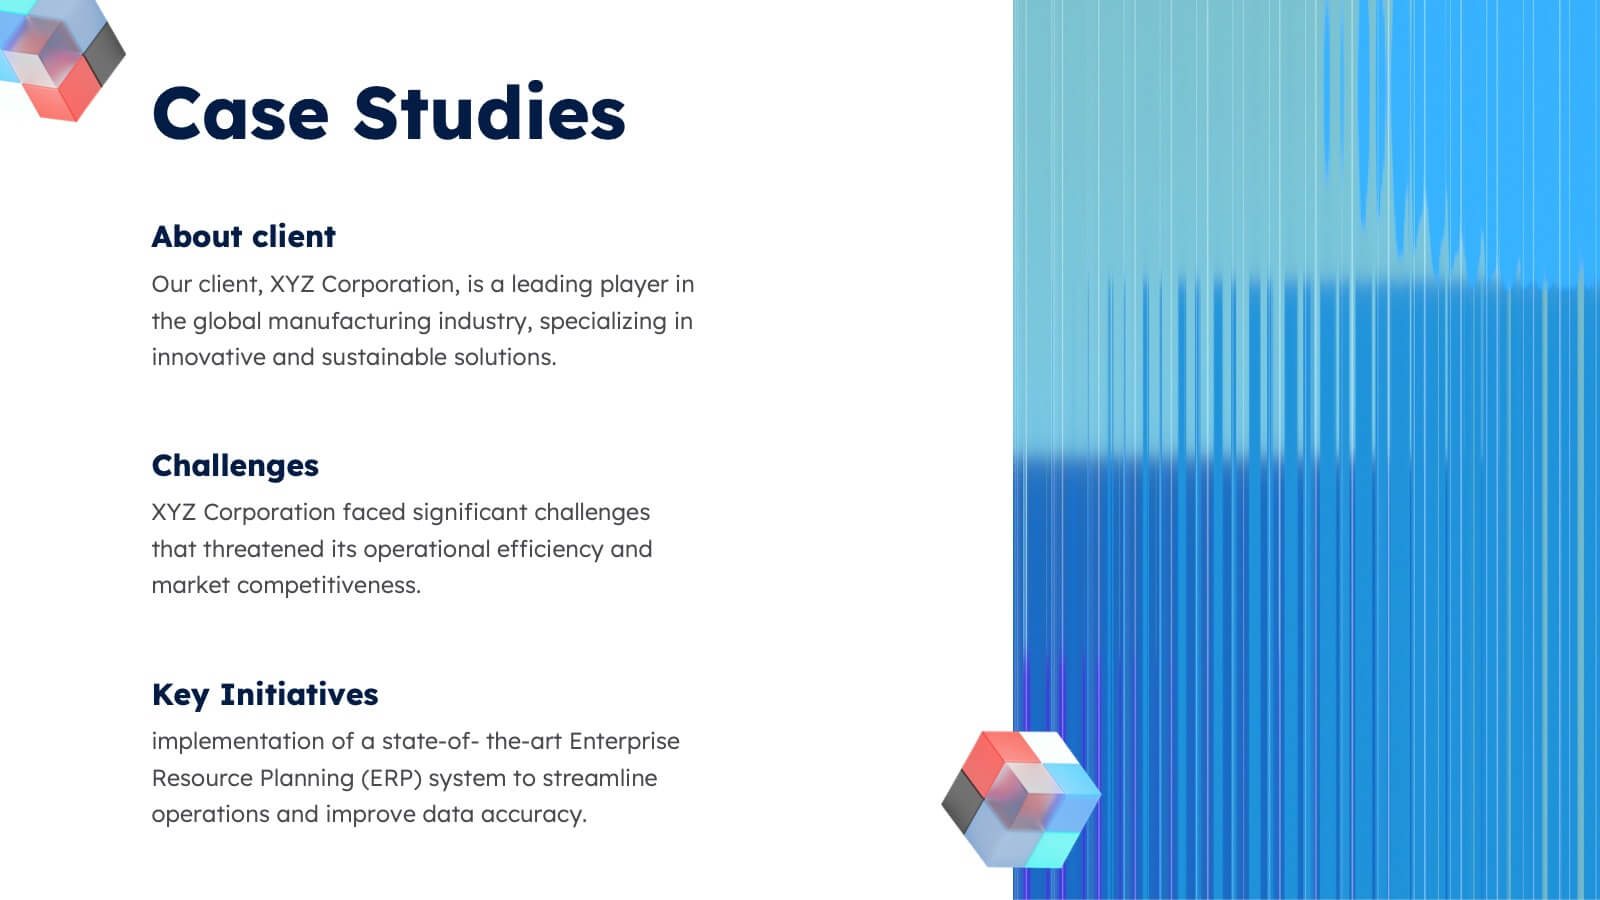
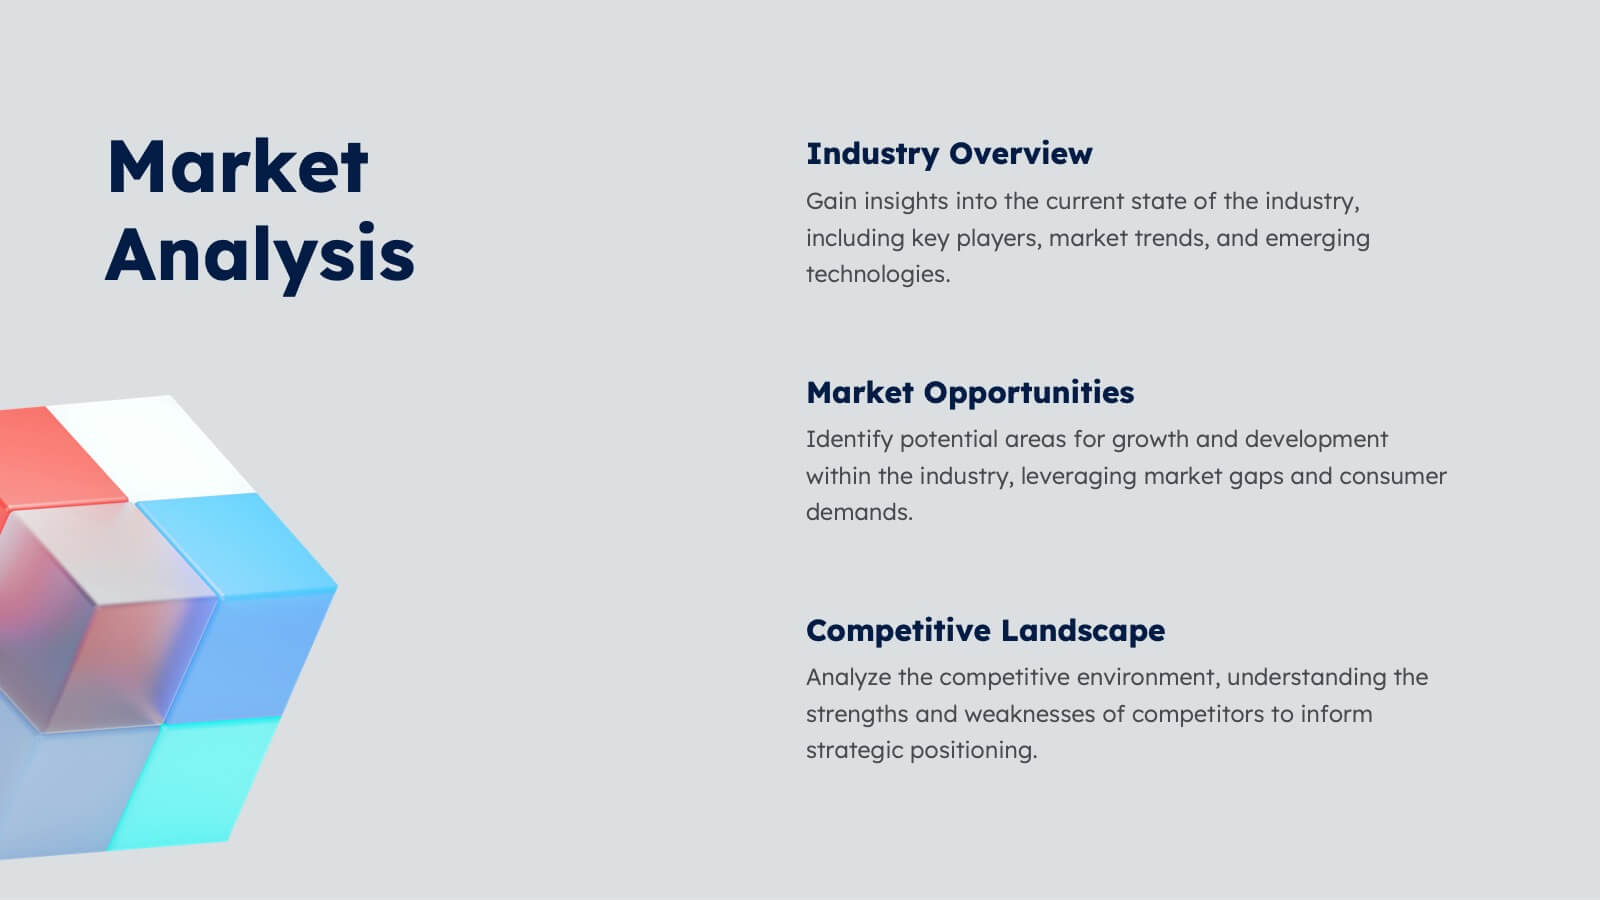
Aura Agency Portfolio Presentation
Showcase your agency's brilliance with this vibrant portfolio presentation template! Ideal for highlighting your mission, vision, case studies, and market analysis, it brings your achievements to life with colorful, engaging slides. Impress clients and partners with a well-structured, visually appealing narrative. Compatible with PowerPoint, Keynote, and Google Slides for easy use on any platform.


7 diapositivas
Empathy Map Tools Infographic
Navigate the intricate landscapes of human emotions with our empathy map infographic. Bathed in the reflective tones of blue, the clarity of white, and the insightful hints of yellow, our template offers a deep dive into understanding and capturing user experiences. Equipped with purpose-driven infographics, intuitive icons, and relevant image placeholders, it visualizes the nuances of empathy in a tangible manner. Meticulously tailored for Powerpoint, Keynote, or Google Slides. An invaluable tool for UX designers, psychologists, researchers, or any professional keen on enhancing user experiences. Delve deeper; let every slide amplify understanding.


20 diapositivas
Creative Marketing Proposal Presentation
Elevate your business proposals with this sleek marketing proposal template, designed in dynamic purple tones. It comprehensively covers everything from company overview to pricing structures, making it perfect for detailing your marketing strategies effectively. Compatible with PowerPoint, Google Slides, and Keynote, it's ideal for professionals aiming to impress clients and secure projects.


7 diapositivas
McKinsey 7S Model Strategy Presentation
Bring clarity to complex organizational relationships with a clean, structured layout that highlights how key elements connect and influence performance. This presentation helps you explain core components, identify alignment gaps, and guide strategic decision-making with confidence. Easy to customize and fully compatible with PowerPoint, Keynote, and Google Slides.


4 diapositivas
Insurance Services Overview Presentation
Present your offerings with clarity using this Insurance Services Overview slide. Ideal for explaining coverage tiers, policy types, or service options. The clean umbrella graphic adds a strong visual metaphor for protection. Fully customizable and compatible with PowerPoint, Keynote, and Google Slides for use across any insurance or finance presentation.