


Características


¿Tienes alguna pregunta?
Recomendar


21 diapositivas
Rakshasa Project Status Report Presentation
This detailed status report template helps track progress with clarity and precision. Featuring sections on financial summaries, operational updates, key achievements, and market trend analysis, it ensures seamless reporting and decision-making. Perfect for reviewing team productivity, challenges, and upcoming priorities, this template offers easy customization in PowerPoint, Keynote, or Google Slides.


12 diapositivas
Digital Marketing Strategy Presentations
Turn complex campaigns into captivating visuals with this modern, data-driven layout designed for marketing professionals. Perfect for outlining strategies, performance metrics, and digital funnels, it keeps information clear and visually engaging. Easily customizable and fully compatible with PowerPoint, Keynote, and Google Slides for seamless editing across your favorite platforms.


5 diapositivas
Strategic Planning with Foundational Pillars Presentation
Define the structure behind your strategic vision with the Strategic Planning with Foundational Pillars presentation. This template showcases four strong pillars beneath a classical pediment, symbolizing the stability and balance of your business strategy. Each pillar represents a core principle—perfect for themes like leadership, values, operations, or goals. Clean, modern, and entirely editable in PowerPoint, Keynote, and Google Slides, this visual works great for executive briefings, annual plans, or business consulting pitches.


10 diapositivas
Adapting to Business Transformation Presentation
Guide your audience through change with this dynamic, step-by-step layout tailored for showcasing transformation journeys. The slide features a curved flow design with five customizable stages, perfect for visualizing digital shifts, organizational restructuring, or innovation roadmaps. Best for corporate strategists, consultants, and change managers. Fully editable in PowerPoint, Keynote, and Google Slides.


4 diapositivas
Employee Performance Feedback
Showcase progress clearly with this Employee Performance Feedback presentation. Featuring skill-based metrics, productivity scores, and analysis ratings, this layout uses visual data bars to evaluate team performance at a glance. Perfect for HR reviews, team assessments, or quarterly check-ins. Fully editable in PowerPoint, Keynote, and Google Slides.


5 diapositivas
Employee Training Needs Presentation
Spark growth and strengthen team performance with a clear visual guide that highlights skill gaps, development priorities, and learning pathways. This presentation helps HR and managers map essential competencies and plan impactful training programs. Perfect for performance reviews and workforce planning. Fully compatible with PowerPoint, Keynote, and Google Slides.


5 diapositivas
Investment Opportunity Business Case
Visualize the value behind your proposal with this key-themed layout, ideal for presenting compelling reasons to invest. Each section highlights a unique point, making it easy to walk stakeholders through critical benefits and insights. Fully editable and compatible with PowerPoint, Keynote, and Google Slides.


5 diapositivas
Ecological Impact Reduction Strategies Presentation
Present your sustainability efforts with the Ecological Impact Reduction Strategies Presentation. This tree-inspired layout is perfect for outlining key eco-friendly initiatives, from waste management to energy efficiency. Clean visuals and editable elements make it easy to adapt for environmental proposals, reports, or team planning. Fully customizable in Canva, PowerPoint, or Google Slides.


6 diapositivas
Startup Investors Pitch Deck Presentation
Inspire confidence and spark investor interest with the Startup Investor Pitch Deck Presentation. Featuring a creative visual of a rocket launching from a piggy bank, this slide is ideal for illustrating funding momentum, business growth, or financial milestones. Each section allows space to highlight critical investment points such as traction, market opportunity, financials, and team highlights. Fully customizable in PowerPoint, Keynote, or Google Slides, this pitch-ready layout is perfect for entrepreneurs, startup founders, and innovation teams aiming to deliver a memorable and professional presentation.


4 diapositivas
Customer Type Identification Strategy Deck Presentation
Visualize your customer segmentation strategy with this layered targeting slide. Perfect for identifying different customer types based on behavior or loyalty levels, this layout uses a human silhouette and concentric zones to highlight proximity to the core user. Fully editable and compatible with PowerPoint, Keynote, and Google Slides.


16 diapositivas
SEO Research Analysis Presentation
Designed with meticulous attention to detail, this presentation template offers an extensive overview of SEO Analysis Research, perfect for specialists eager to explore the depths of search engine optimization. The initial slide establishes a solid foundation for comprehensive analysis. Following, the 'About' segment delivers a brief yet informative look at the organization's prowess and experience in the realm of SEO. The 'Our Teamwork' slide introduces the team behind the SEO success, showcasing the individuals and their roles. Moving on to 'Strategy,' the template allows for a detailed exposition of the approach and methodologies applied to enhance online visibility. Key metrics are brought to the forefront in a monthly overview, providing insights into traffic sources, content performance, and keyword rankings. The 'SEO Report' highlights significant analytics, such as searches and sign-up rates, emphasizing the impact of the SEO efforts. Complete the presentation with a cordial 'Thank You' to the audience and a 'Credits' slide for resource attribution, ensuring transparency and professionalism. This template is ideal for delivering powerful insights into SEO practices and outcomes.


6 diapositivas
Startup Business Launch Framework Presentation
Showcase your startup journey with the Startup Business Launch Framework Presentation. This step-by-step visual illustrates four key stages in your business launch process—from ideation to execution—using ascending blocks and modern icons. Ideal for founders, incubators, and pitch decks. Fully customizable in PowerPoint, Keynote, Google Slides, and Canva.

22 diapositivas
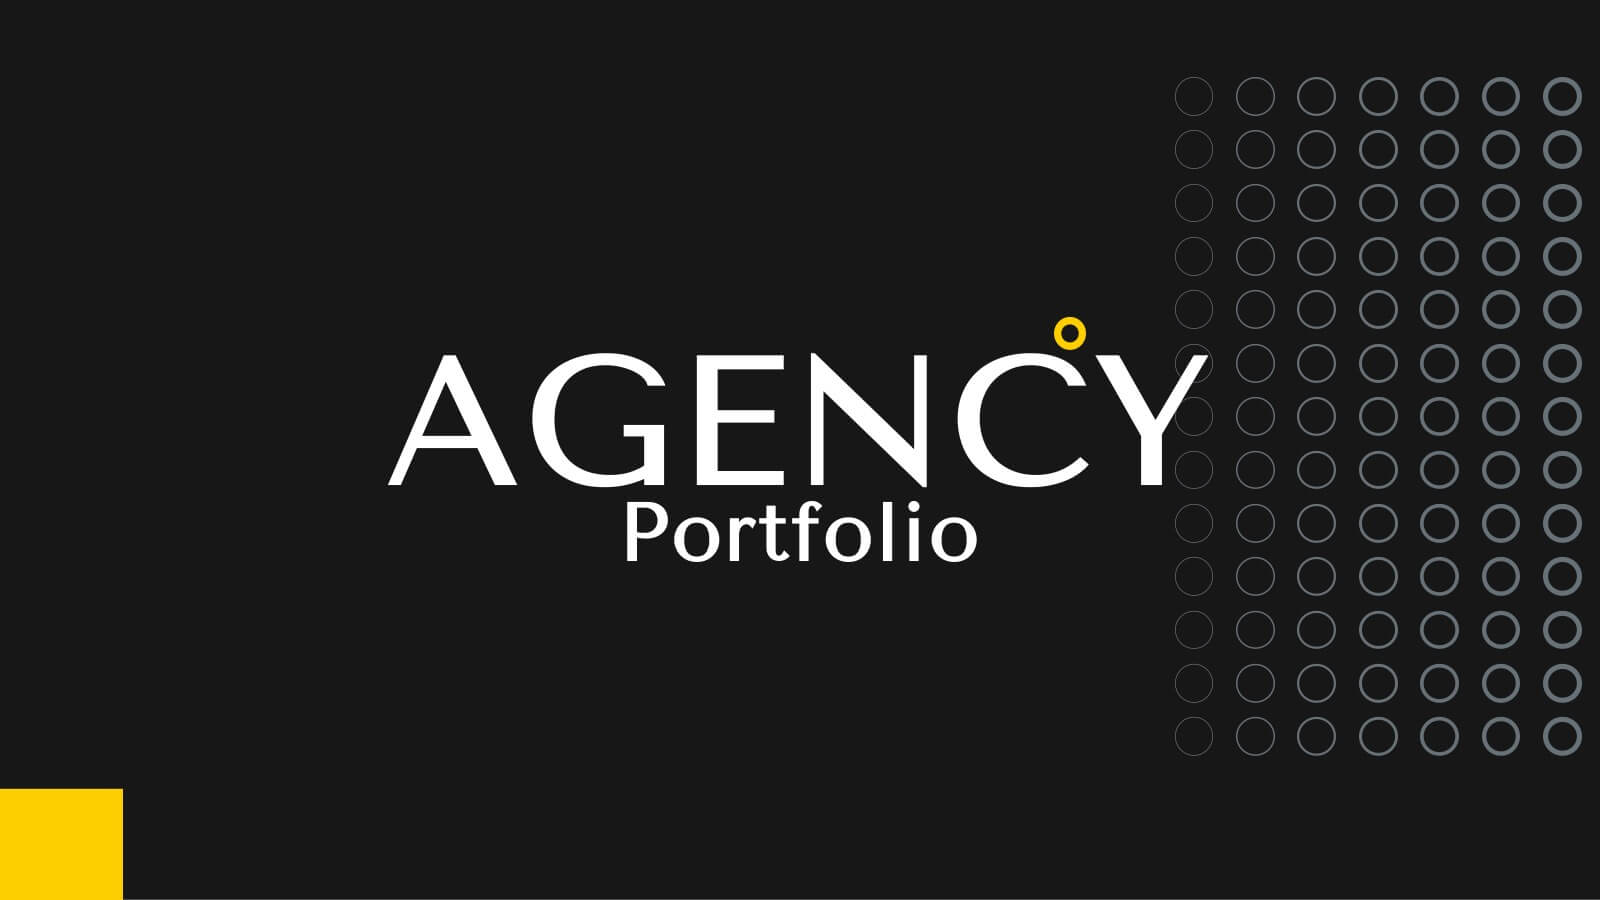
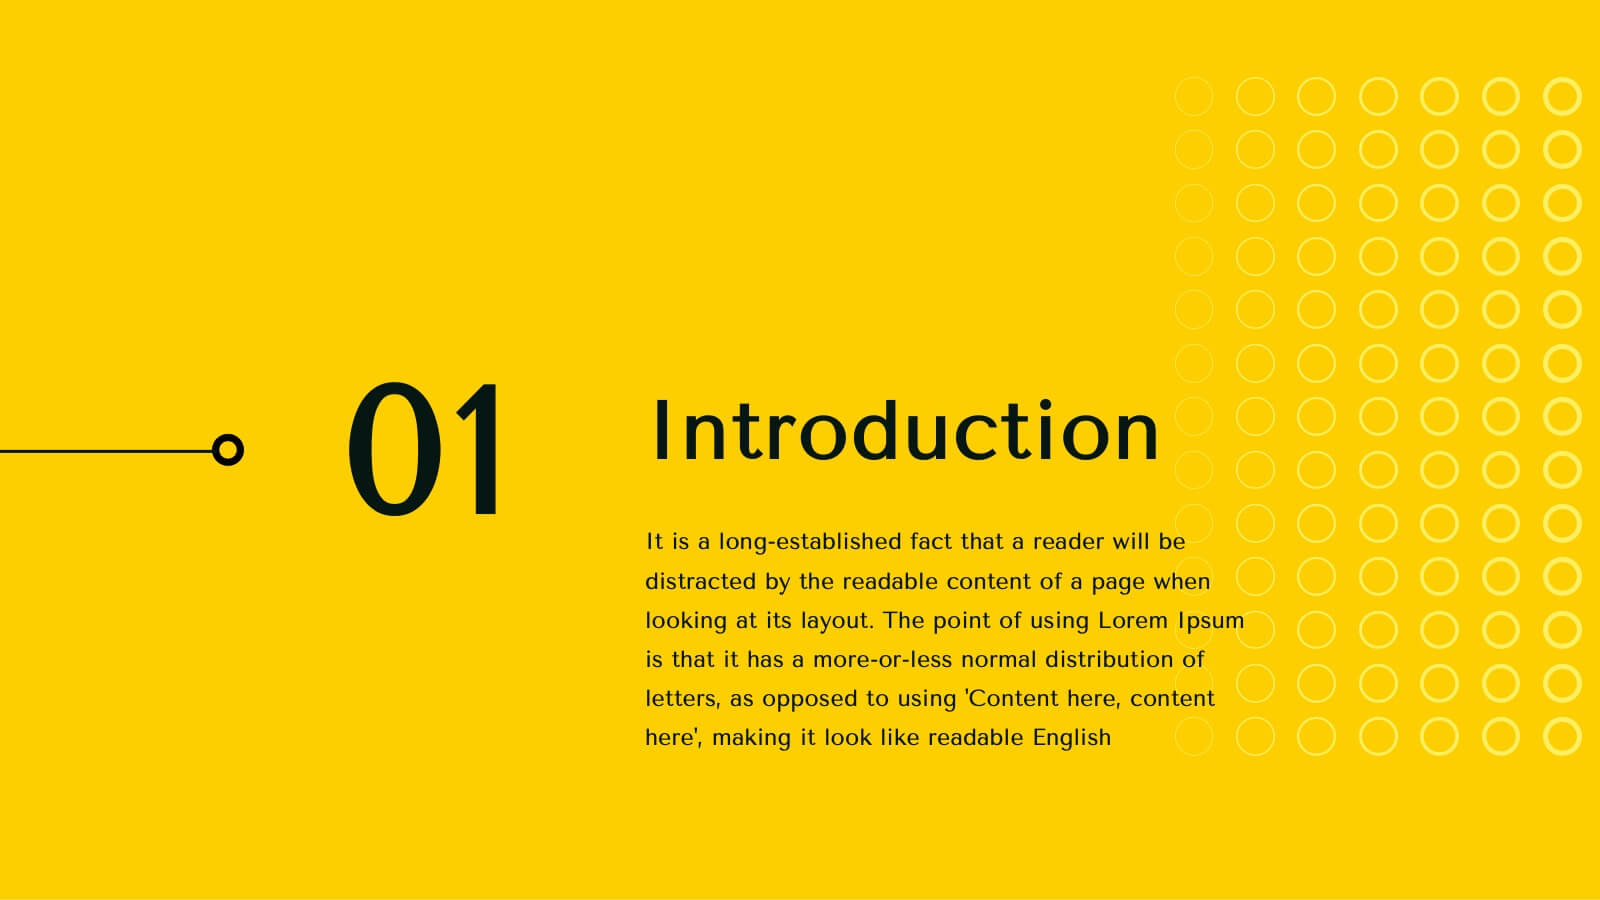
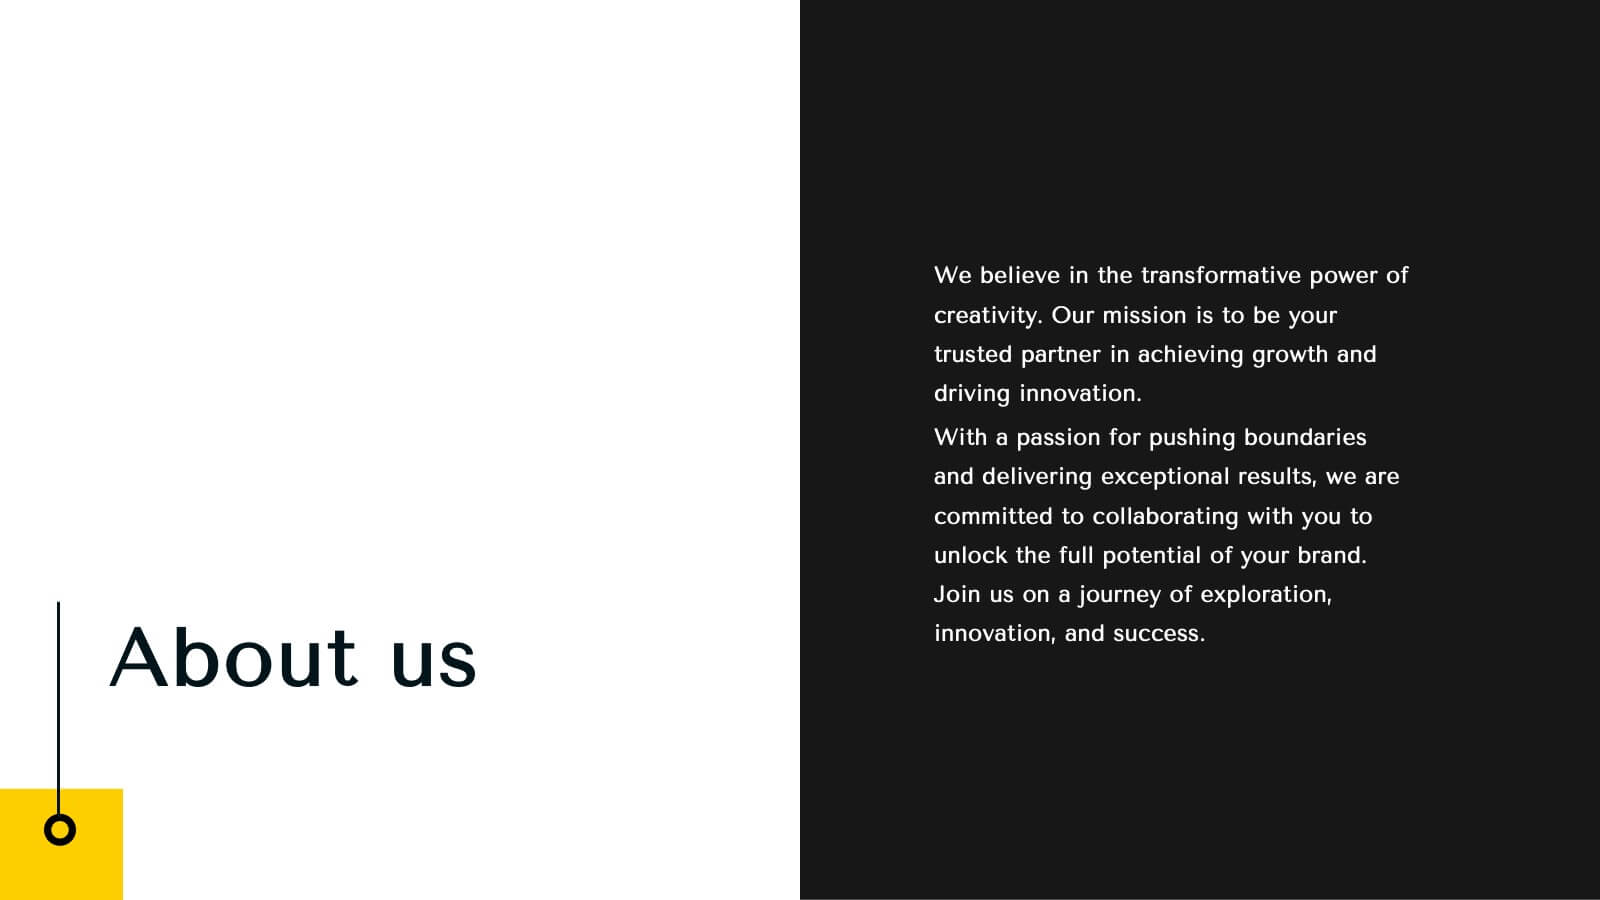
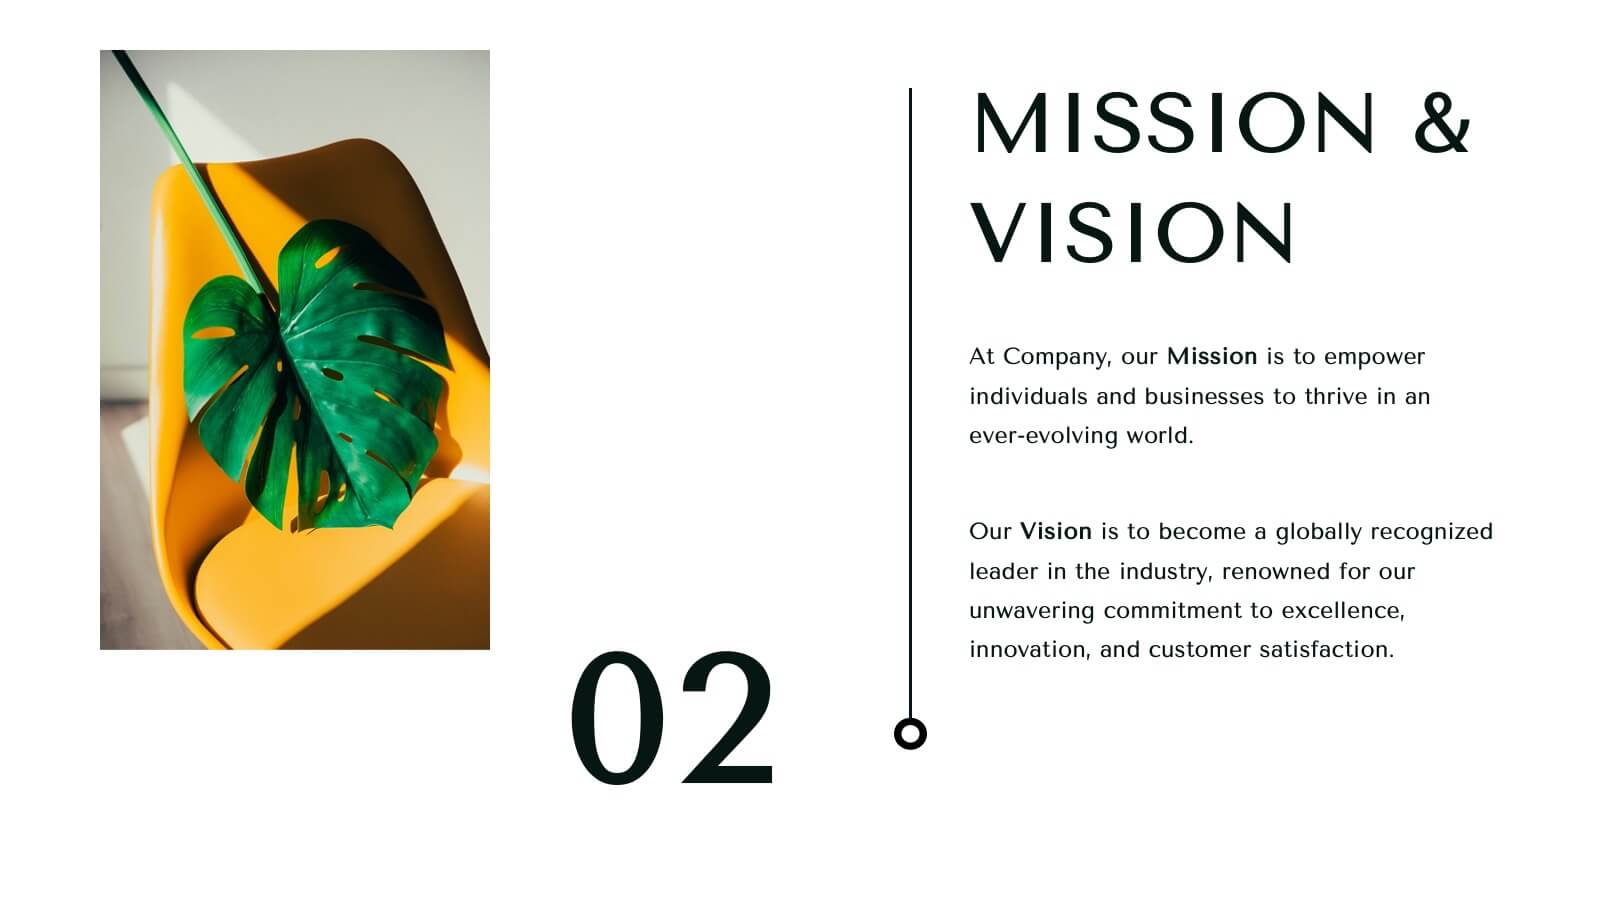
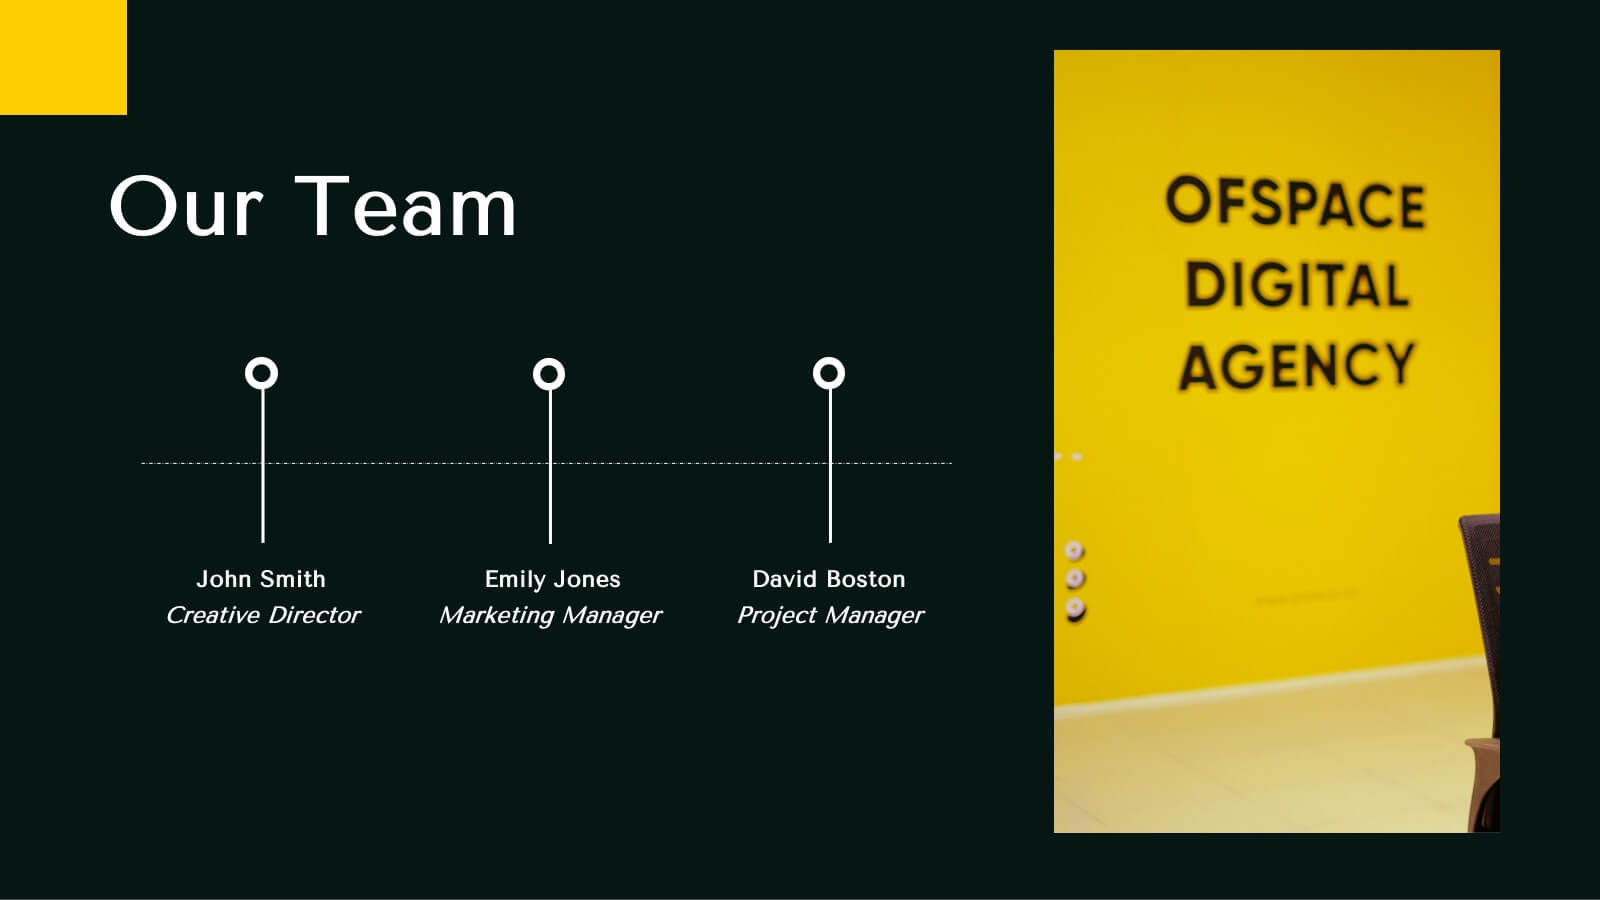
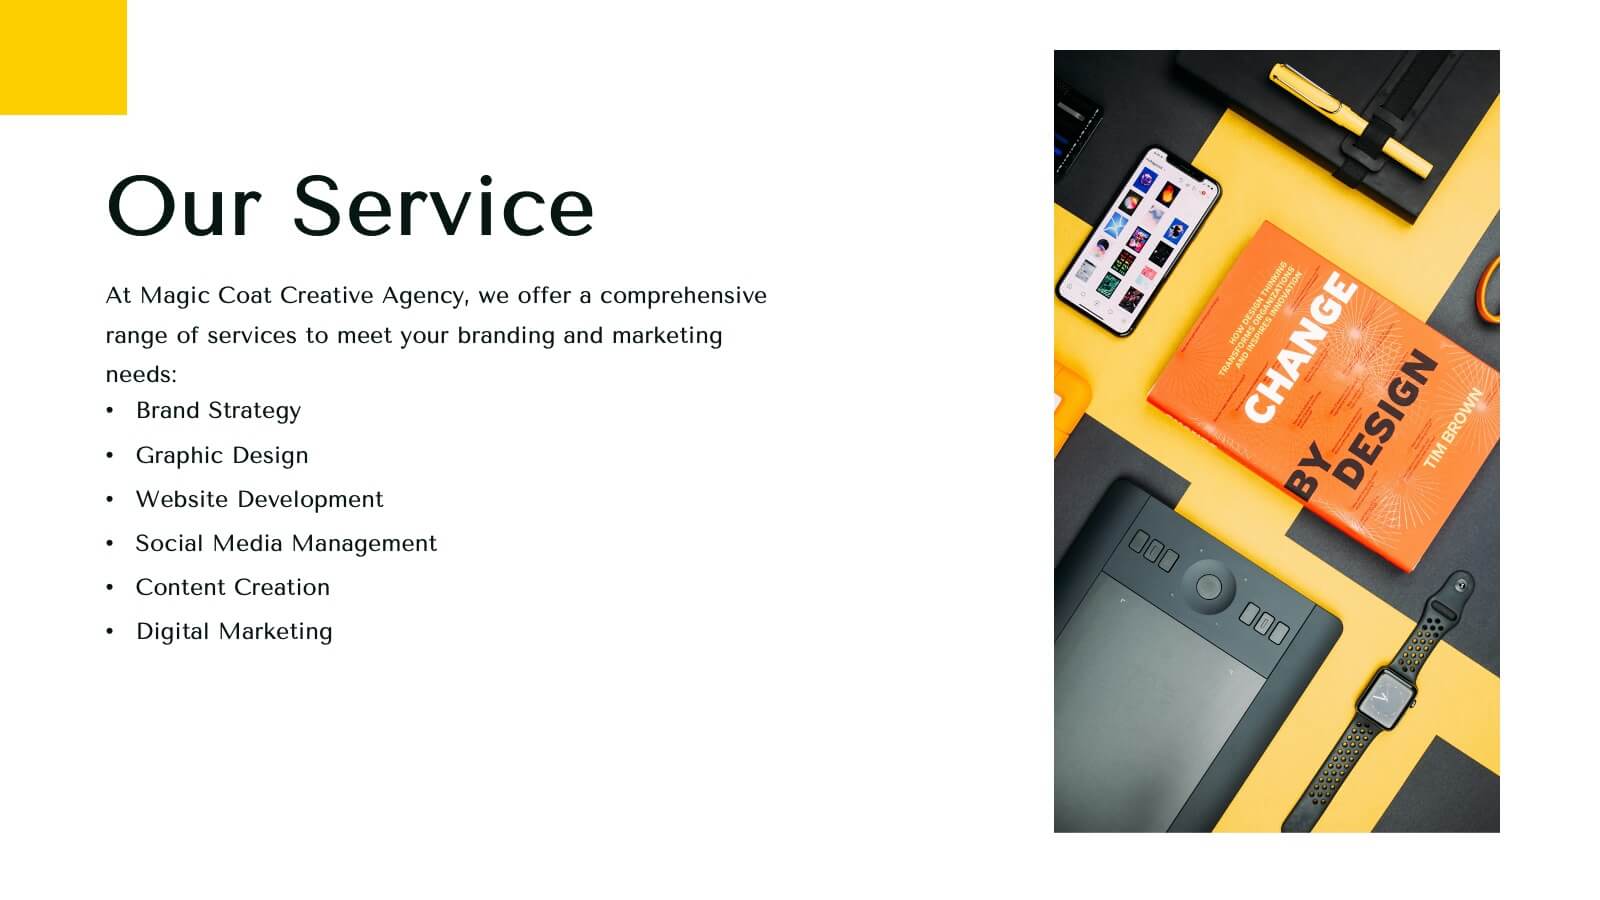
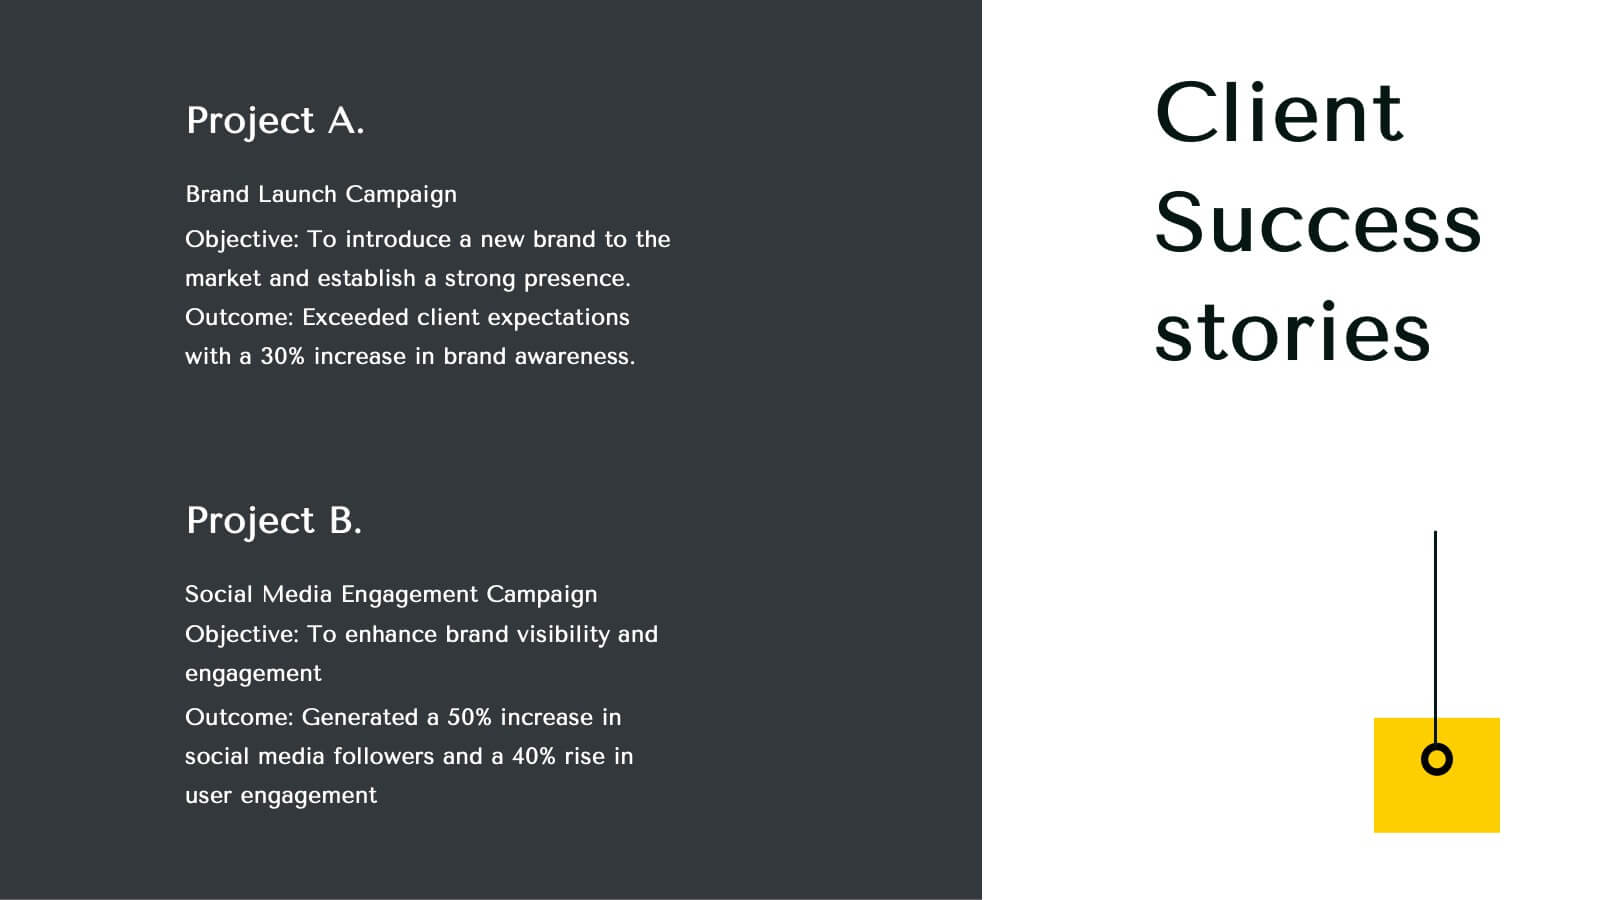
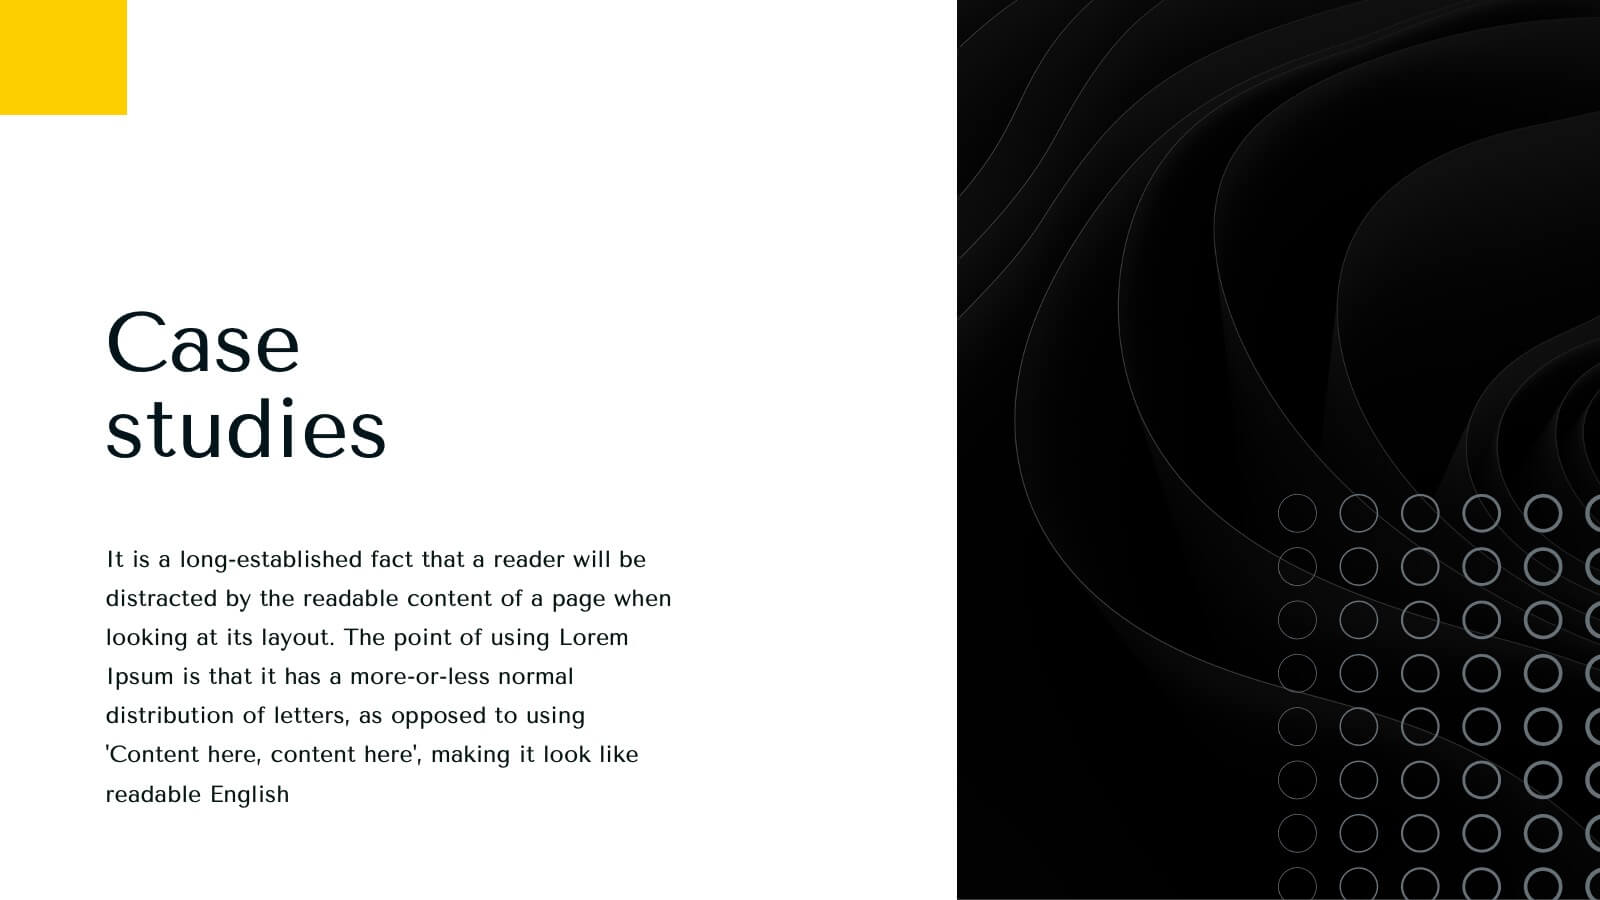
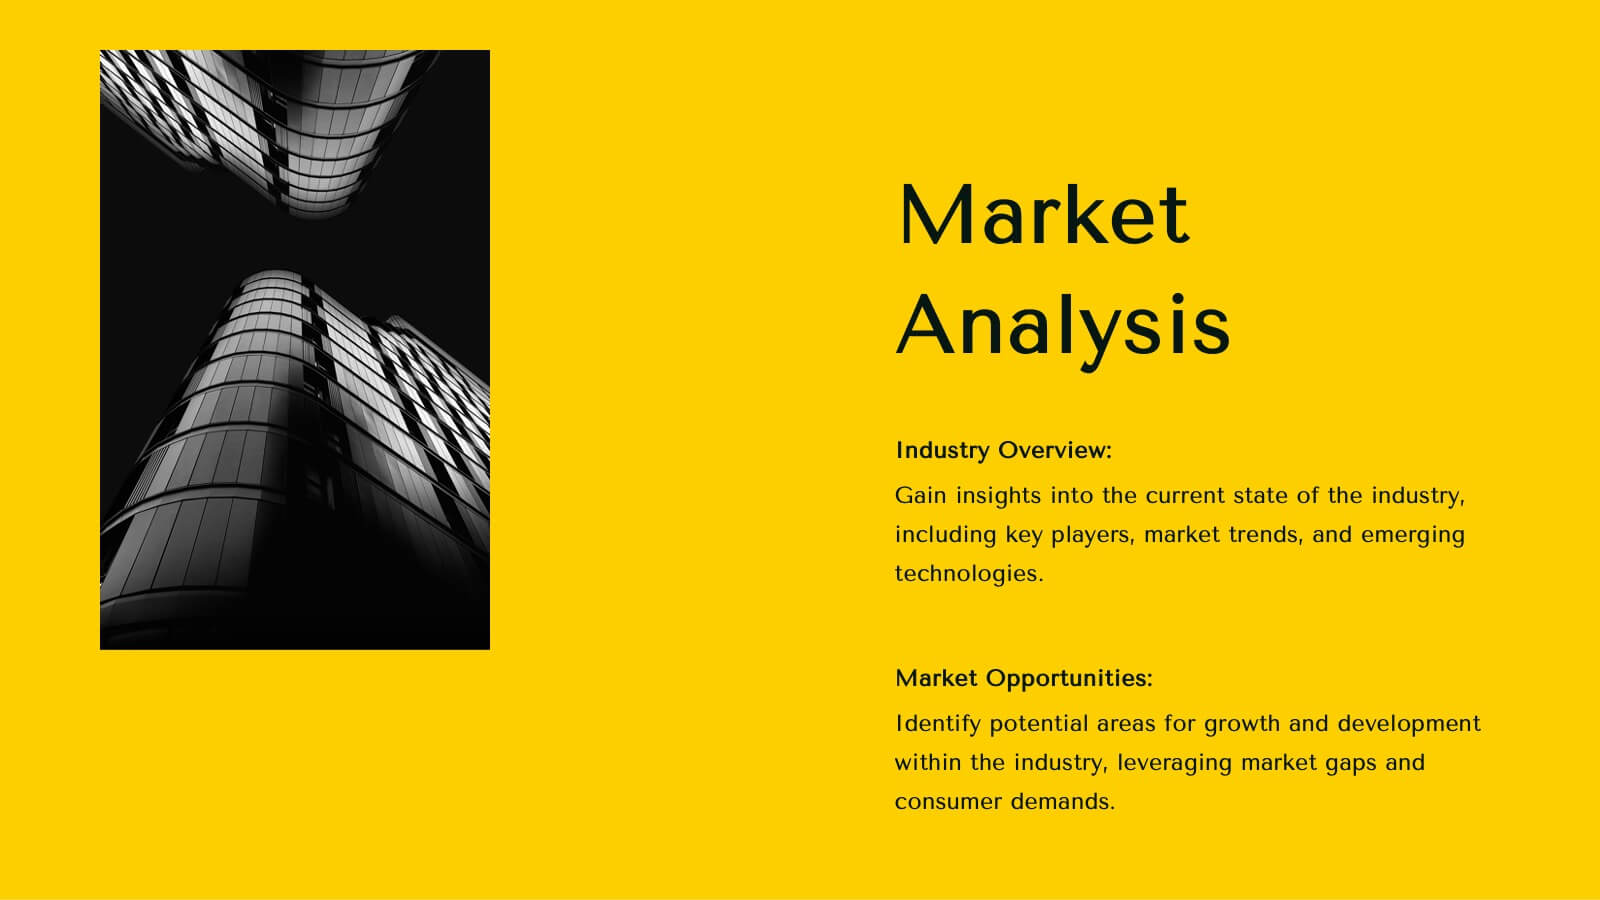
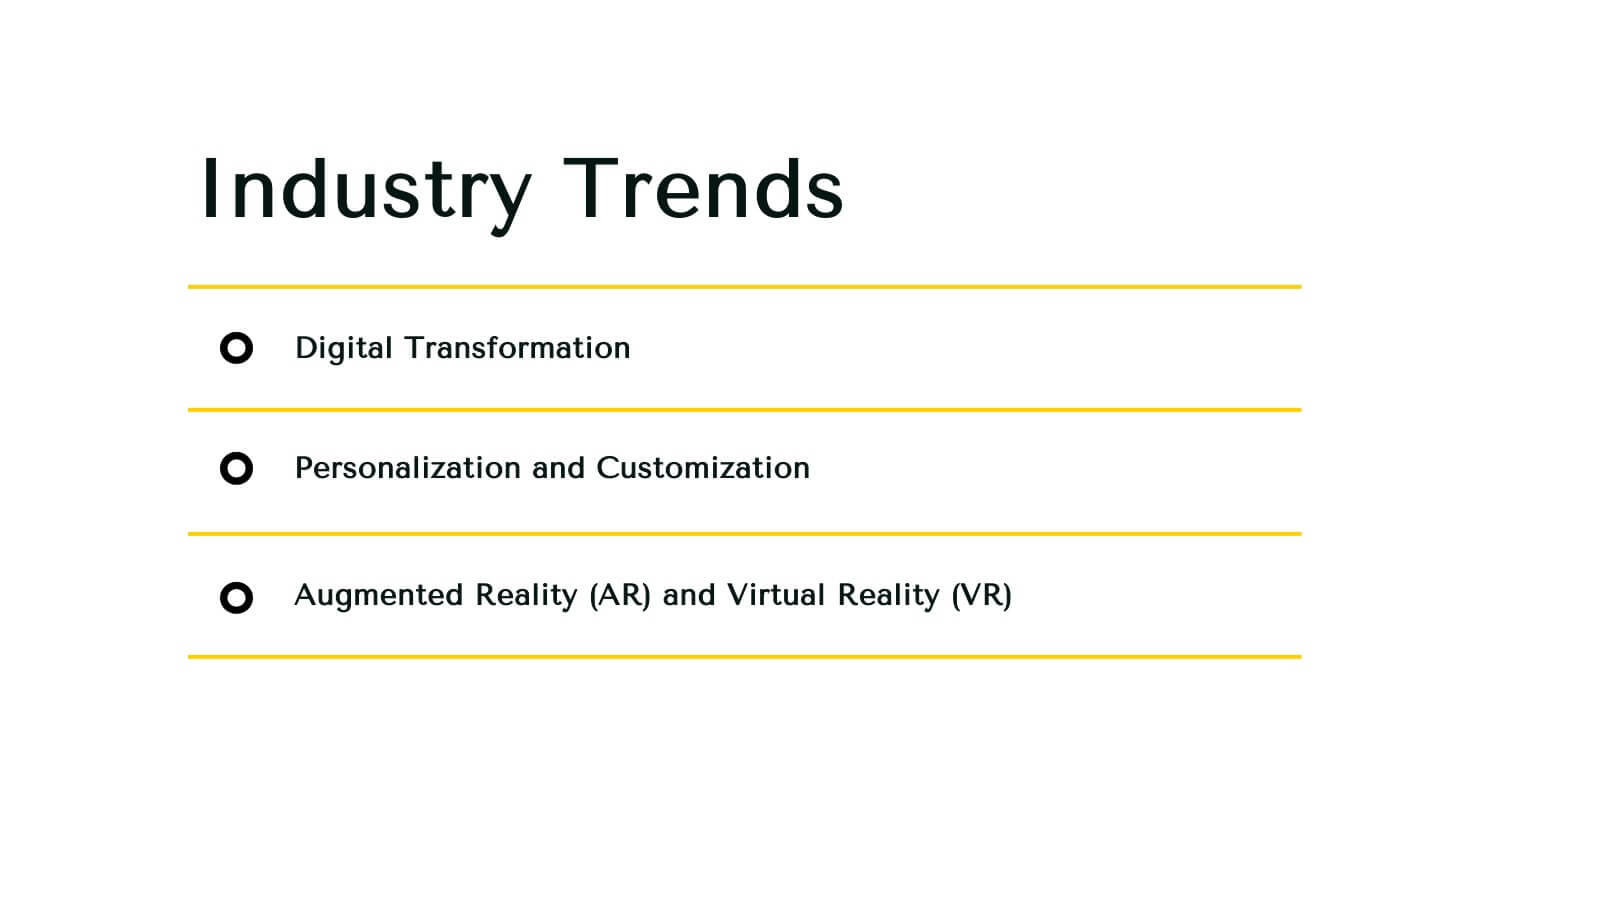
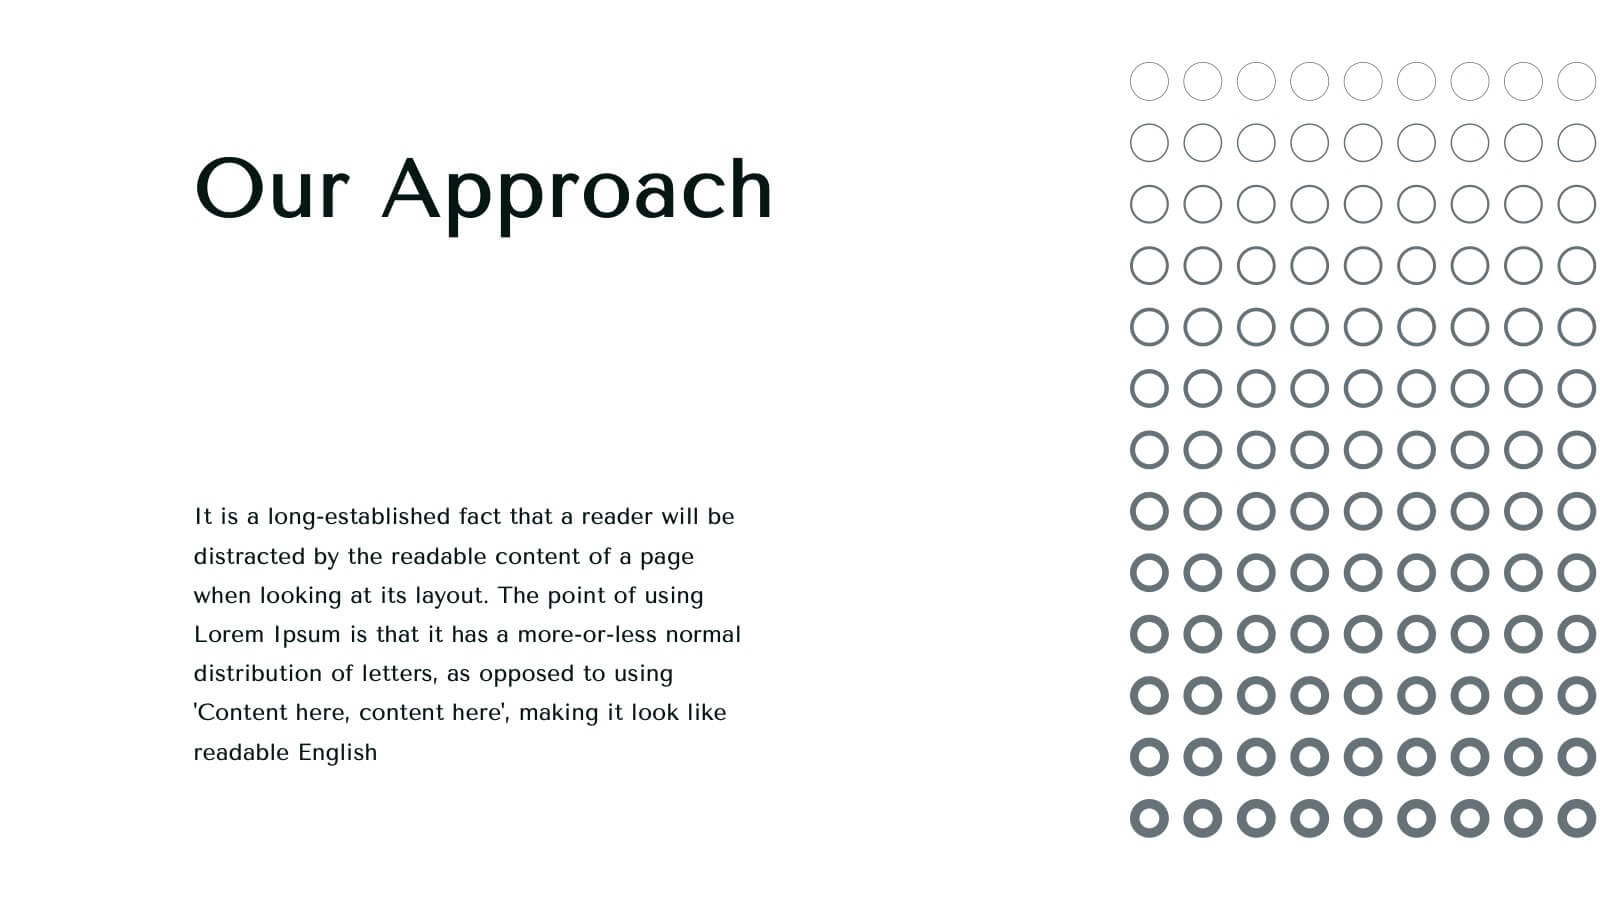
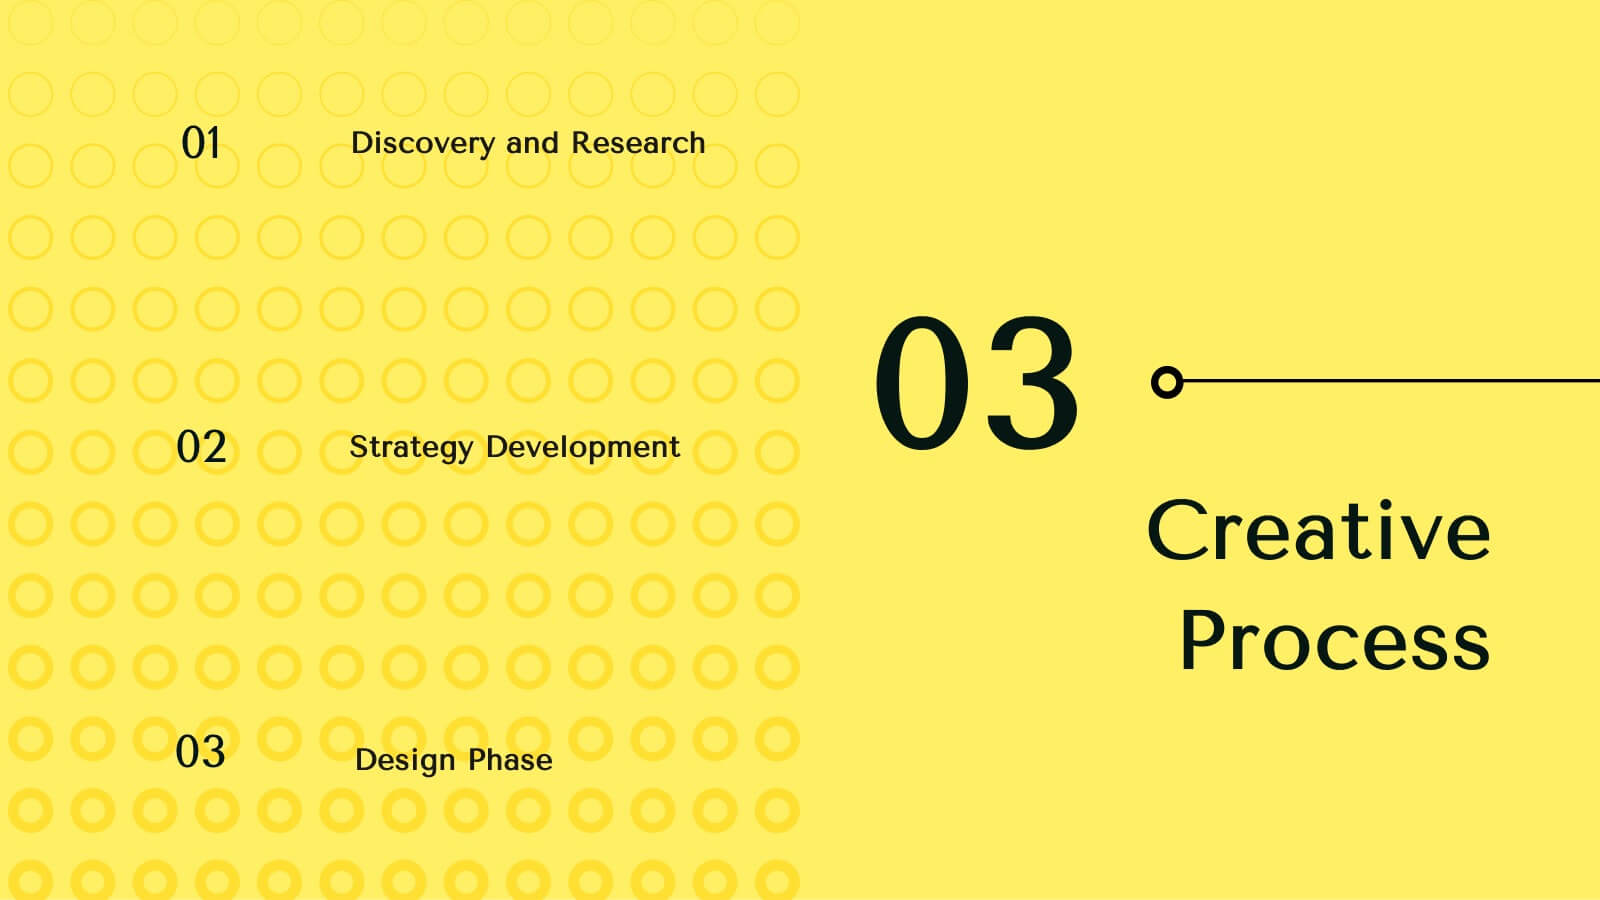
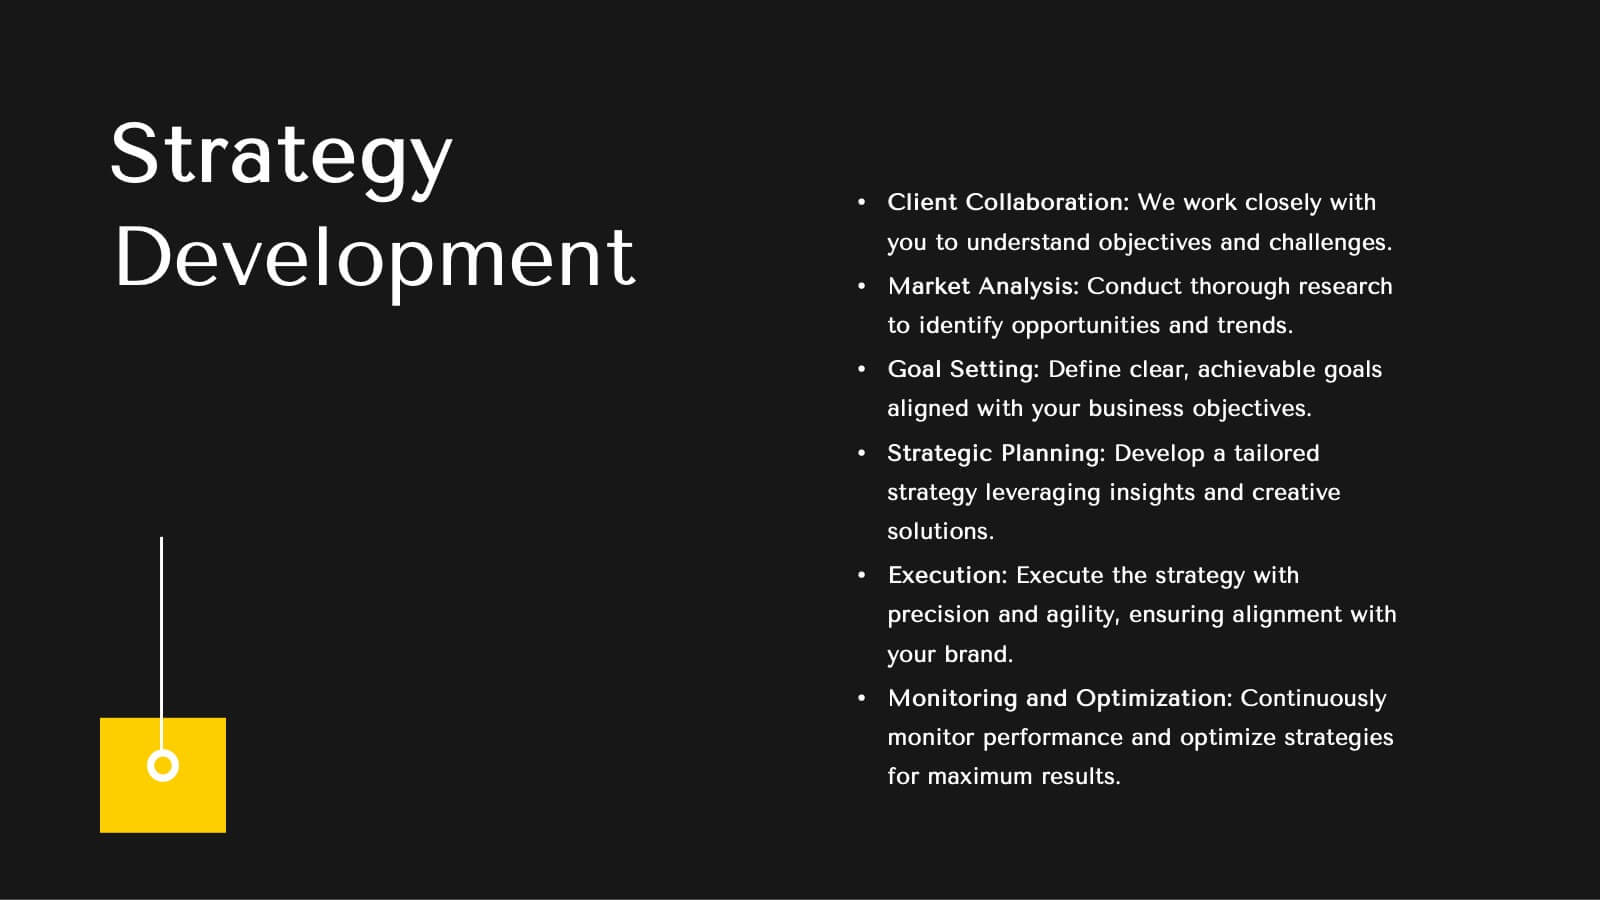
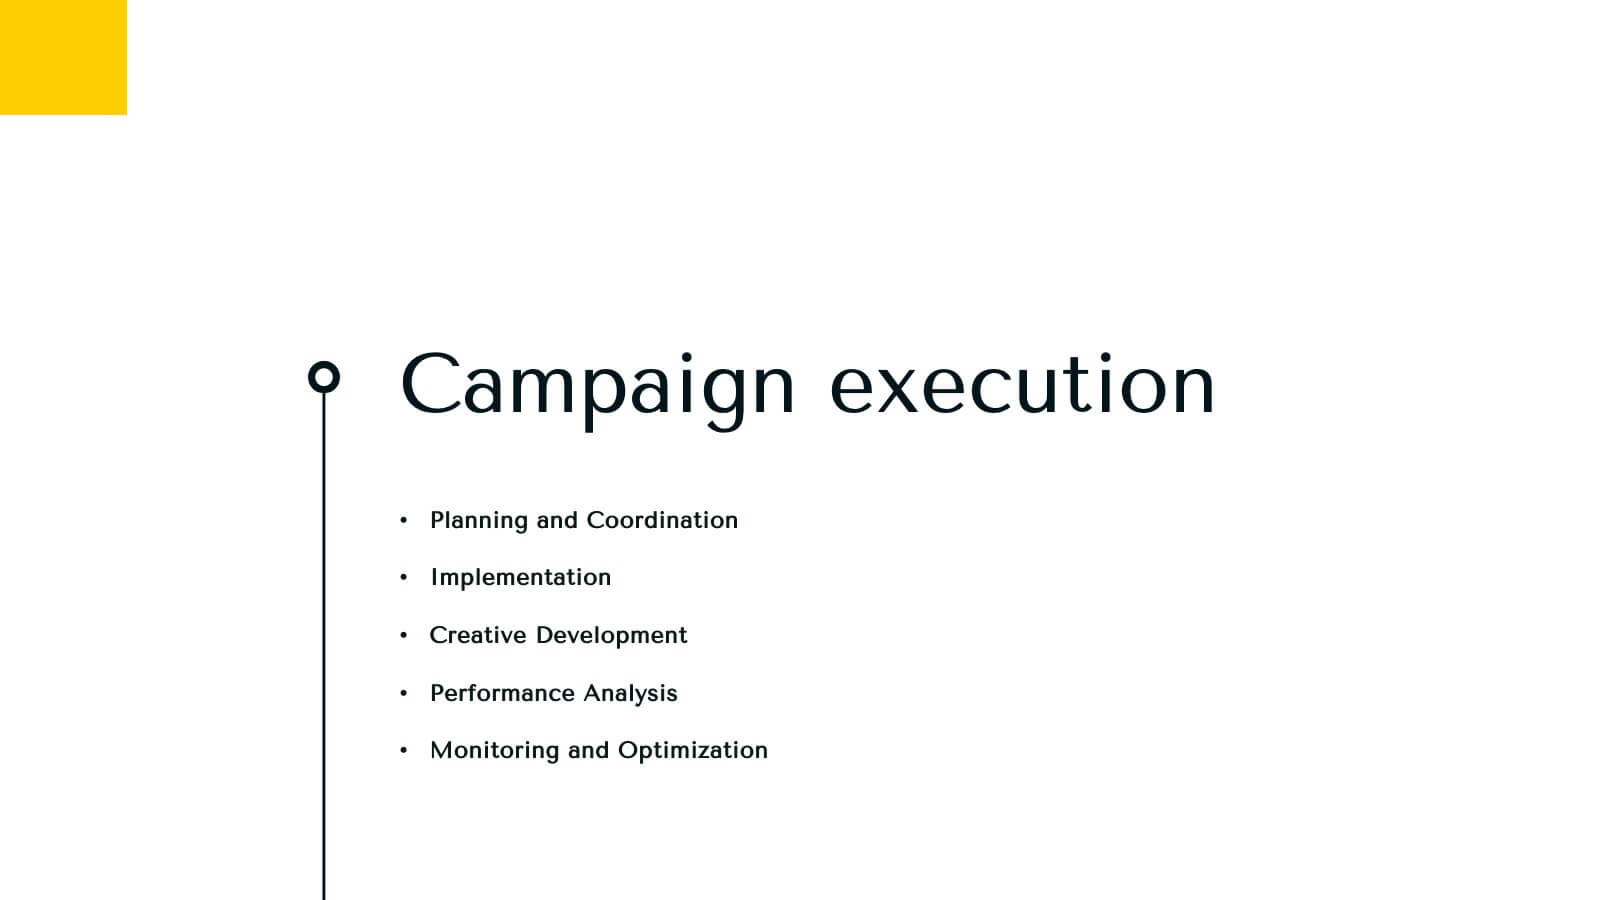
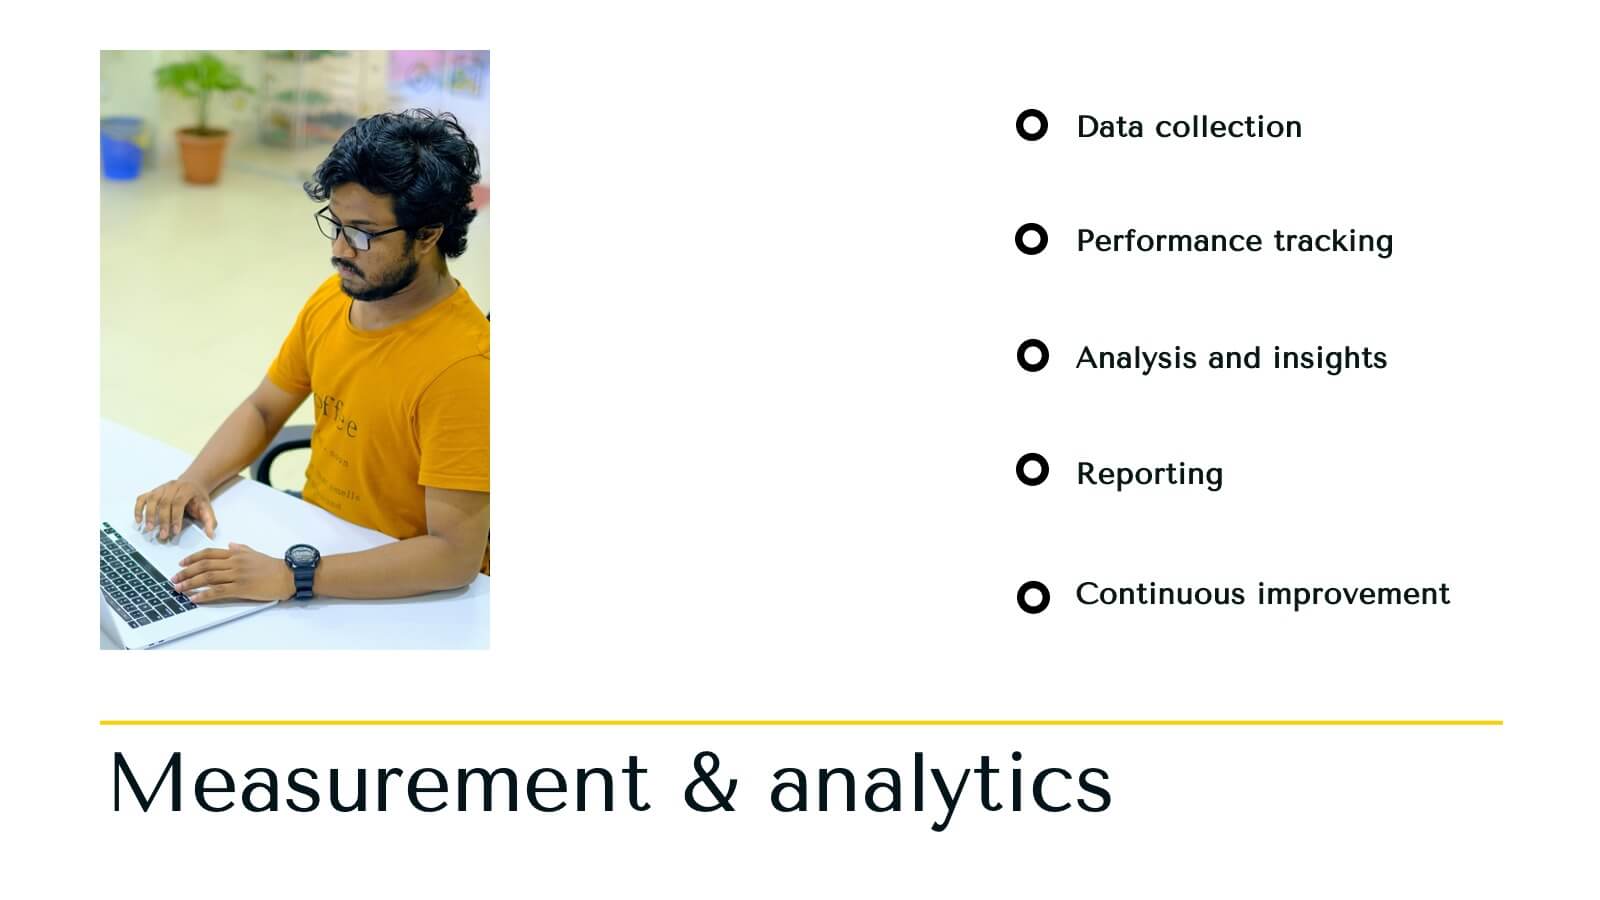
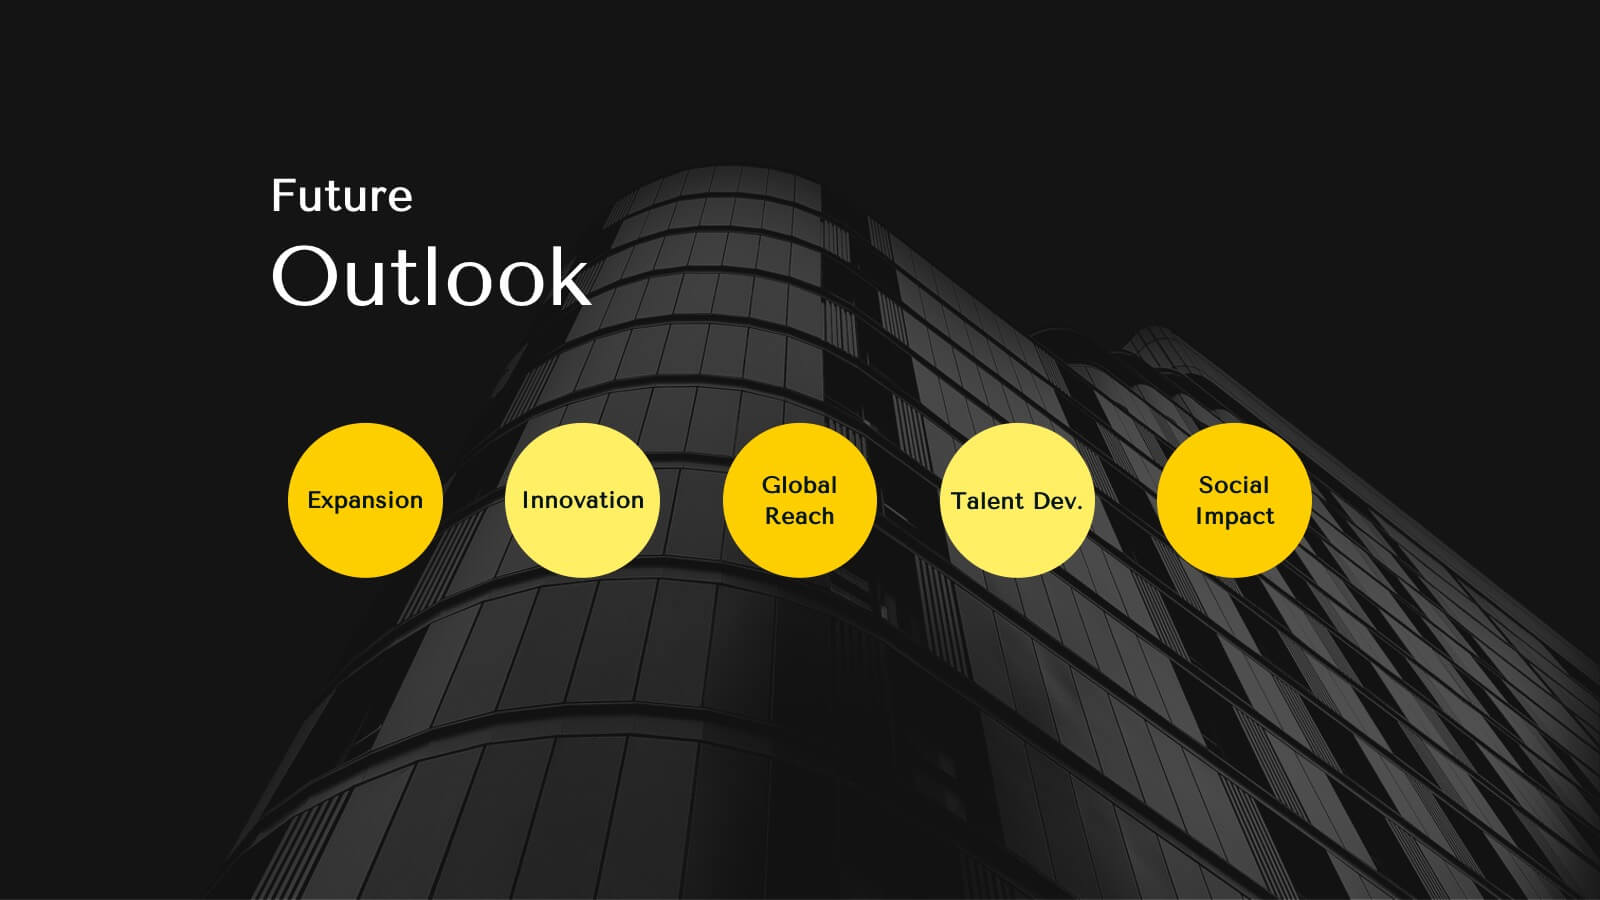
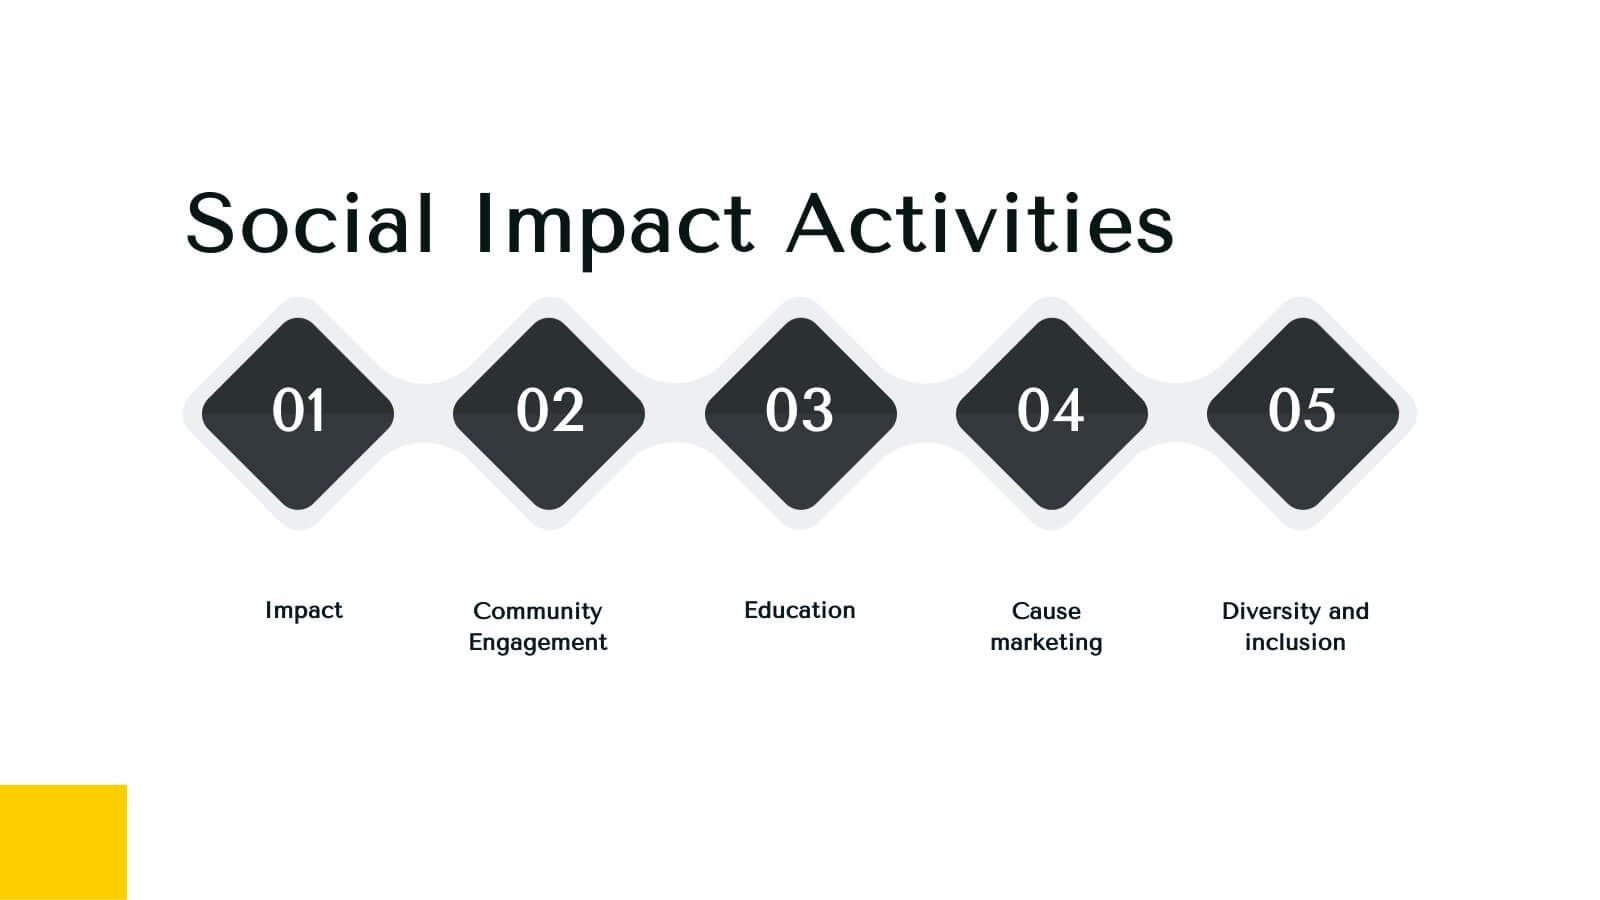
Infinity Agency Portfolio Presentation
Showcase your agency's excellence with this dynamic and modern presentation template. Ideal for presenting market analysis, client success stories, and strategic development plans, it features a bold design with a vibrant yellow and black theme. Highlight your unique approach and creative process to captivate your audience. Compatible with PowerPoint, Keynote, and Google Slides, it's perfect for any platform.


4 diapositivas
Agile Workflow Presentation
Bring energy and motion to your process overview with a clean, loop-based flow that makes each stage easy to follow. This presentation is designed to clarify steps, illustrate iterations, and support clear decision-making for any project. Fully customizable and compatible with PowerPoint, Keynote, and Google Slides.


5 diapositivas
Market Improvement Trends and Expansion in Oceania Map Presentation
Present your market insights with clarity using this Oceania-focused expansion map. Highlight four key regions with callouts and data pointers, ideal for tracking growth trends, regional strategies, or entry points. Fully editable and compatible with PowerPoint, Keynote, and Google Slides—perfect for strategic planning, investor decks, and regional market analysis.


26 diapositivas
Flowers Bold Company Profile Presentation
Step into the enchanting garden of happy flowers, where petals dance and colors sing. Our template, awash in sunlit shades of pink, yellow, orange, and blue, encapsulates the very essence of floral joy. Bursting with vibrant graphics, whimsical icons, and cheerful image placeholders, it's a bouquet of design brilliance. Crafted to perfection for Powerpoint, Keynote, or Google Slides. A delightful pick for florists, garden enthusiasts, event planners, or anyone looking to infuse their presentation with a touch of nature's merriment. Blossom your ideas; let your presentations bloom with happiness.


22 diapositivas
Synchrony New Product Proposal Presentation
Present your innovative ideas effectively with this sleek and organized product proposal template, tailored to showcase every aspect of your new product. From introduction to execution, this template covers every detail, ensuring your proposal is both comprehensive and visually appealing. Key features include slides for product overview, features, target audience analysis, and customer pain points. Additionally, it provides sections for competitive analysis, pricing strategy, and distribution channels, equipping you with all the tools to communicate your value proposition clearly. Technical specifications and production processes are also included, perfect for presenting intricate details. Compatible with PowerPoint, Google Slides, and Keynote, this template is fully customizable to align with your brand’s aesthetics. Whether pitching to stakeholders, potential investors, or internal teams, this presentation ensures your proposal is structured, impactful, and engaging. Save time and leave a lasting impression with this professional design, suitable for any new product launch.