


Características


¿Tienes alguna pregunta?
Recomendar


21 diapositivas
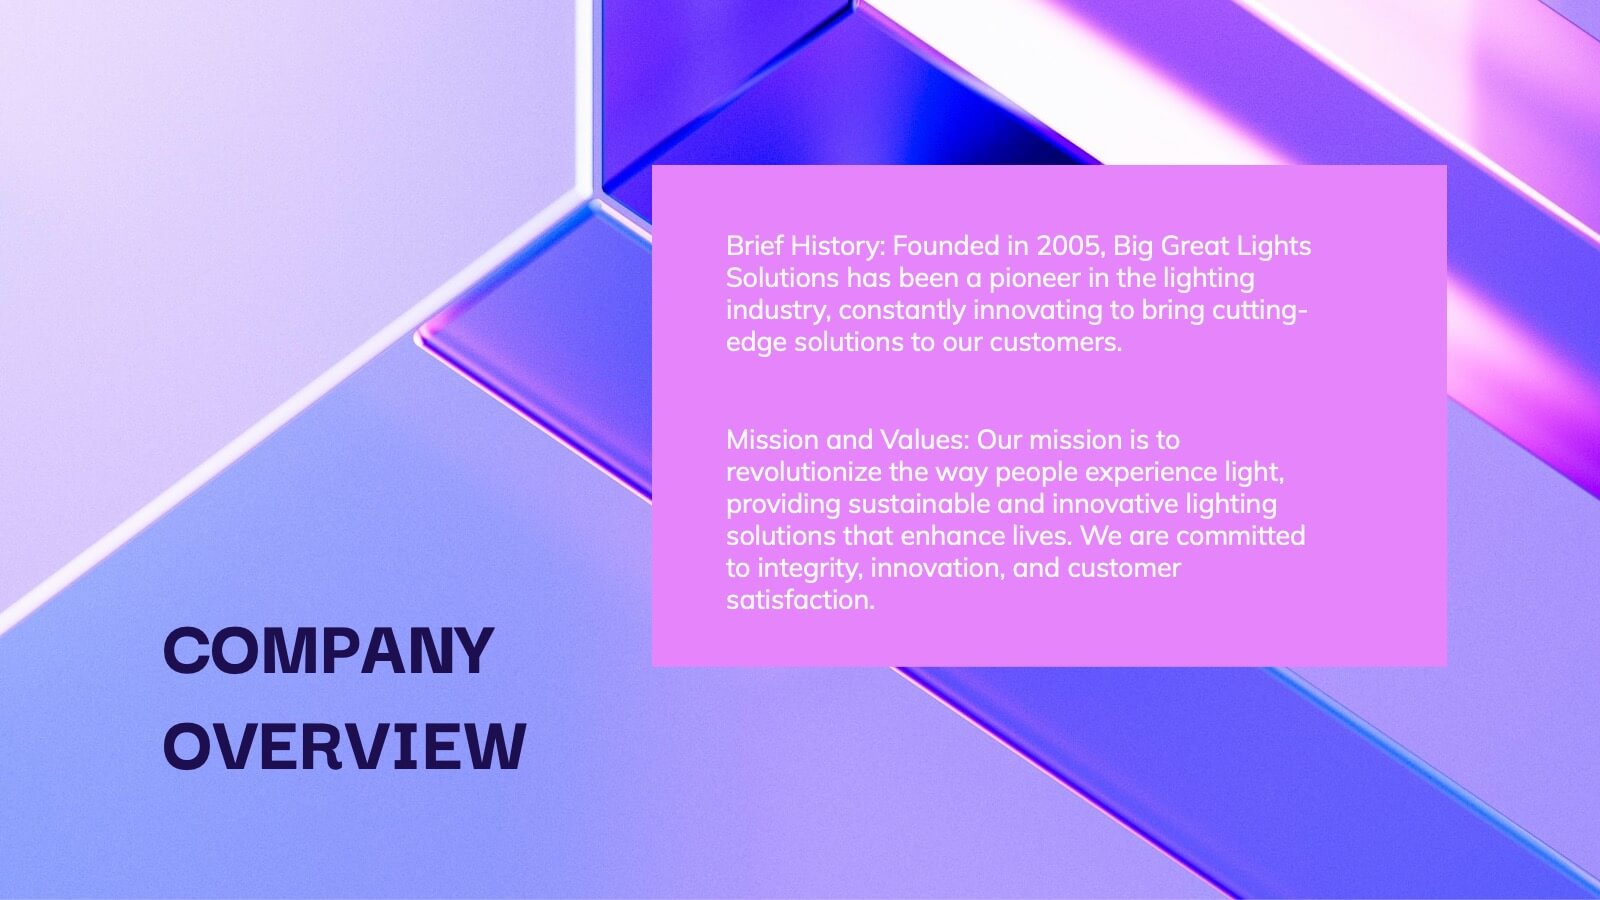
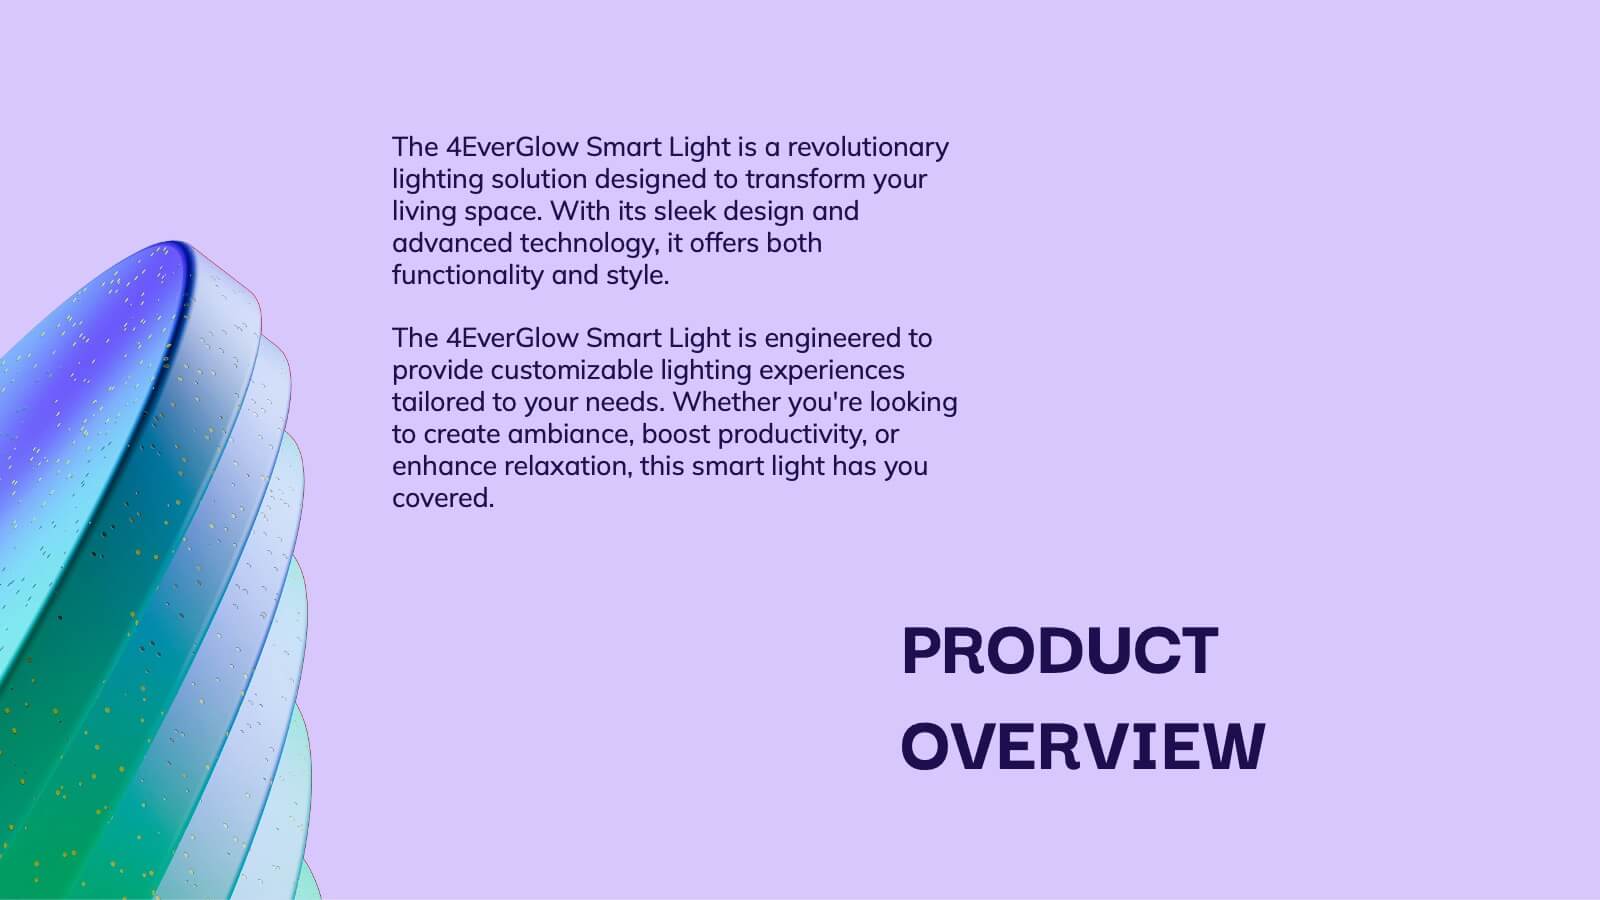
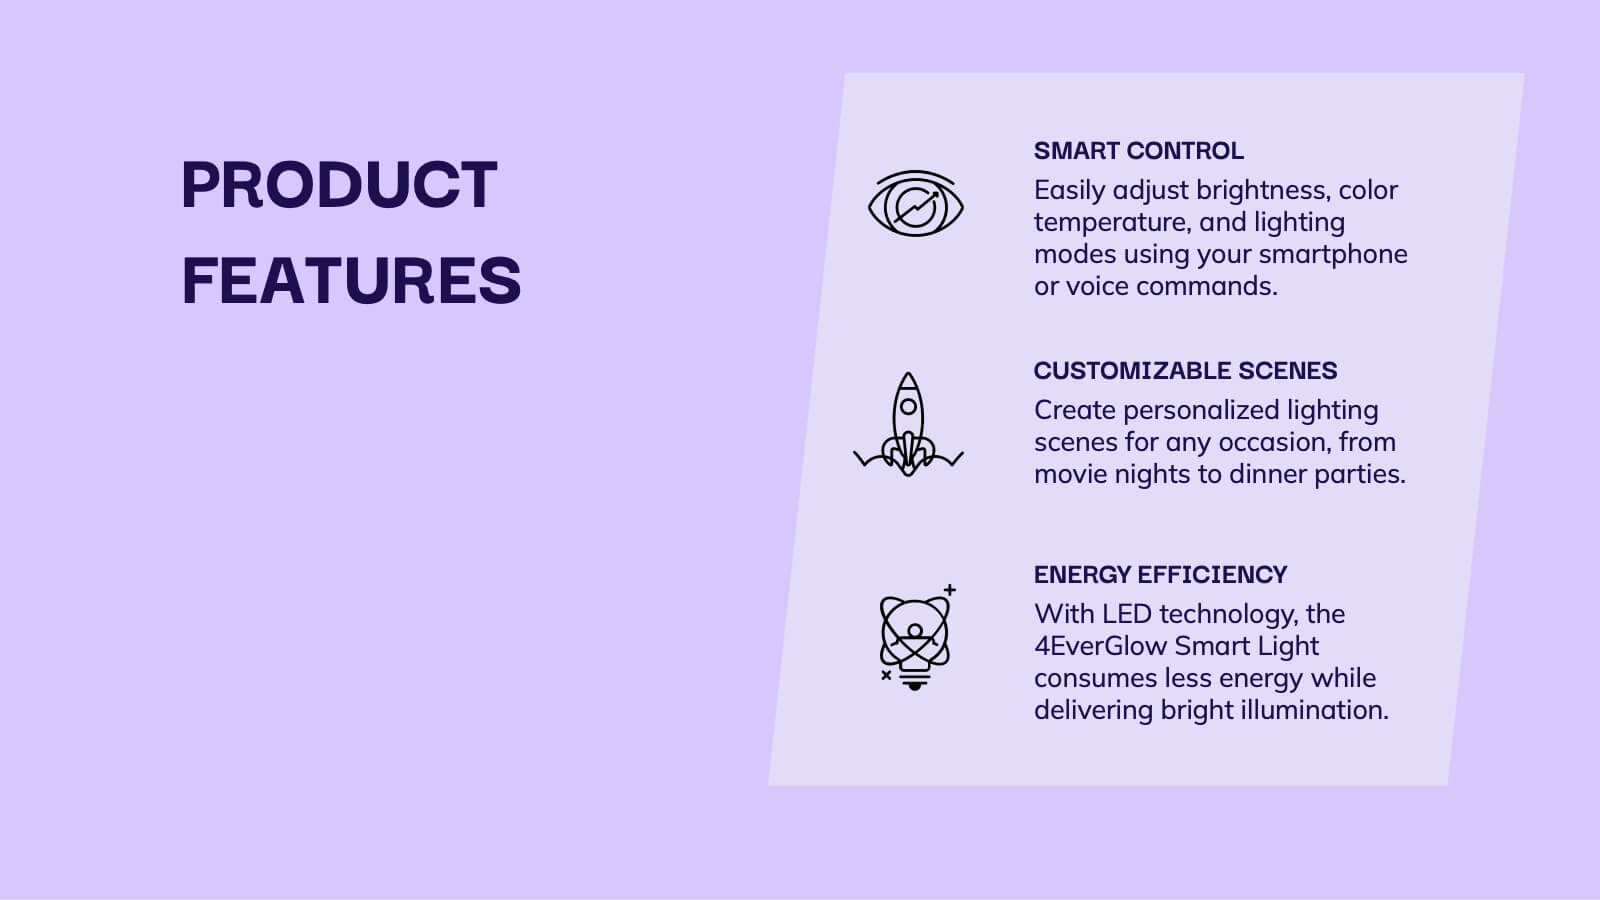
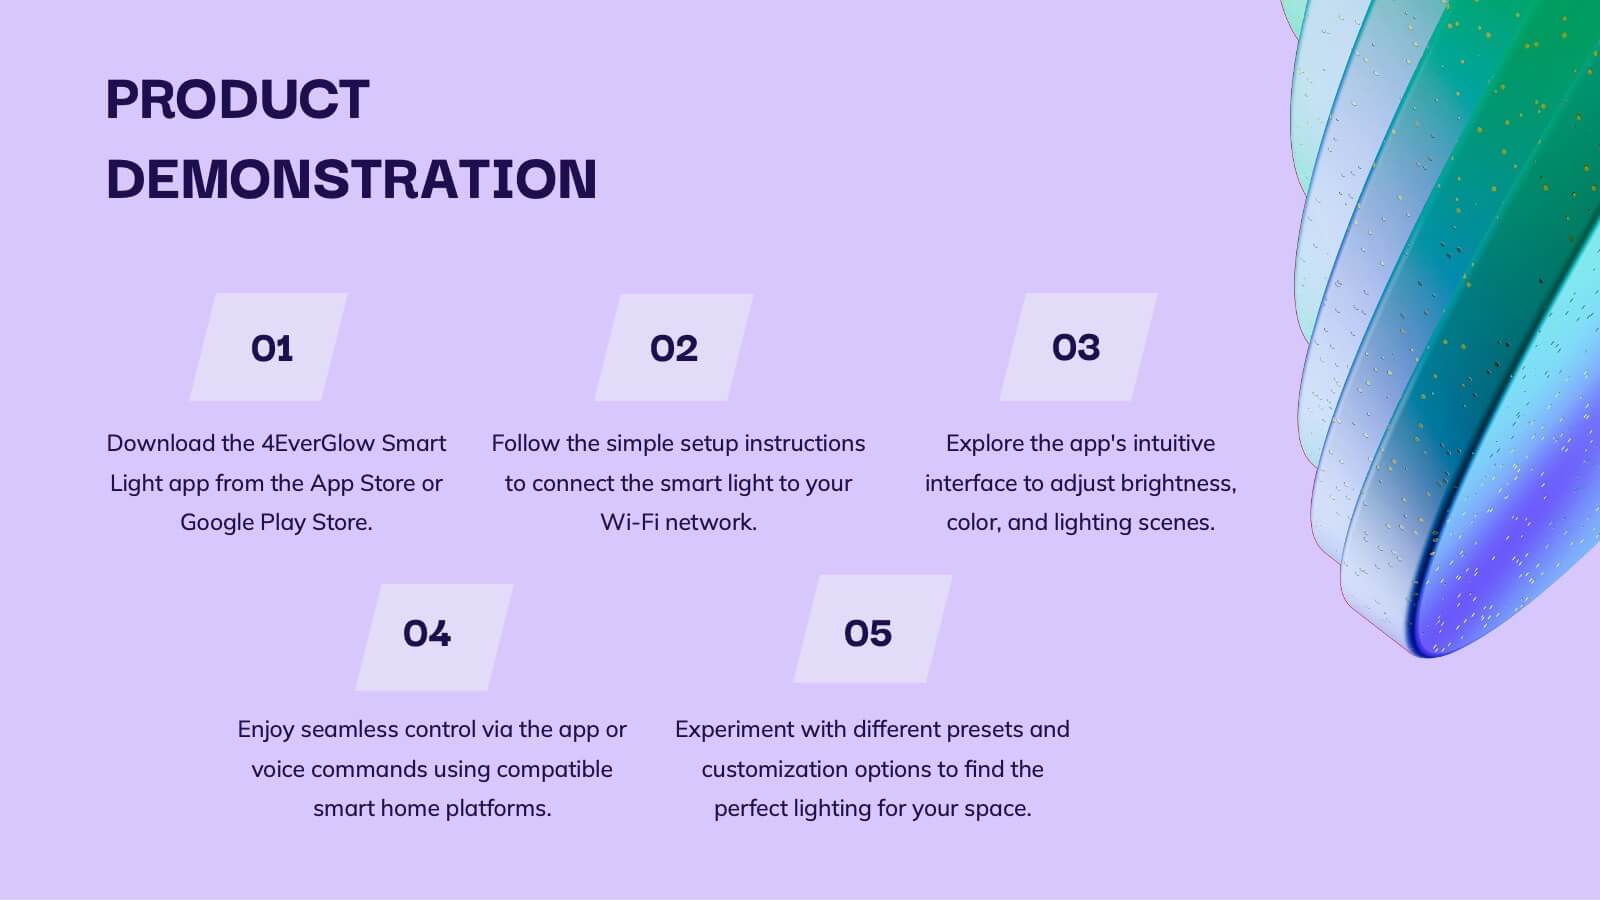
Glimmer Product Roadmap Presentation
Illuminate your product's future with this vibrant glimmer-themed presentation template! Perfect for outlining your product roadmap, it allows you to present key milestones, features, and timelines in a visually engaging way. Captivate your audience and keep them informed about your exciting journey ahead. Compatible with PowerPoint, Keynote, and Google Slides.


5 diapositivas
Business Gap Identification Presentation
Identify key performance gaps from point A to B with this step-based visualization. Each arch-shaped column represents a stage in the improvement process. Use it to highlight capability gaps, missed opportunities, or strategy breakdowns. Fully editable and compatible with PowerPoint, Keynote, and Google Slides—ideal for consulting, planning, and reporting.


5 diapositivas
European Countries Editable Map Presentation
Bring your data to life with a detailed and modern map layout that showcases insights across Europe. Perfect for visualizing country comparisons, regional statistics, or business expansion plans, this clean design ensures clarity and impact. Fully compatible with PowerPoint, Keynote, and Google Slides for easy editing and presentation.


6 diapositivas
Community Network Infographic
A community network is a localized, often root-driven, communication infrastructure that connects individuals, organizations, and institutions within a specific geographical area or community. This Infographic template visually represents the connections, relationships, and interactions within a community, often focusing on its members, resources, and activities. This template is a powerful way to showcase the dynamics and vitality of a community. This highlights the central theme or purpose of the community at the center of the infographic. This is fully customizable and compatible with Powerpoint, Keynote, and Google Slides.


4 diapositivas
Marketing Plan Overview
Visualize your marketing cycle with this clean, three-stage arrow diagram. Each segment—labeled A, B, and C—represents a key phase in your marketing strategy, making it ideal for campaign planning, product launches, or promotional timelines. Fully editable in PowerPoint, Keynote, and Google Slides for effortless customization.


7 diapositivas
Team Work Strategy Infographic
Harness the collective strength of your team with our team work strategy infographic. Set against a pristine white backdrop, this design is accentuated with vivid strokes of purple, blue, yellow, and orange, symbolizing the diverse skills and unity in a team. Crafted for seamless compatibility with Powerpoint, Keynote, and Google Slides, the template features versatile graphics, detailed icons, and adaptable image placeholders. Envisage the synergy, collaboration, and the strategic prowess of a unified team, all laid out in a visually appealing format.


8 diapositivas
Virtual Team Collaboration Presentation
The "Virtual Team Collaboration" presentation template is designed to highlight different facets of teamwork in a remote setting. Each slide features a central visual metaphor illustrated by connected circles, symbolizing the interconnected nature of virtual team activities and communication. The layout provides placeholders for titles and descriptive text, making it suitable for detailing various aspects of virtual collaboration such as project management, communication protocols, and role assignments. The design encourages a clear and organized presentation of information, facilitating discussions on best practices and strategies for effective remote teamwork.


6 diapositivas
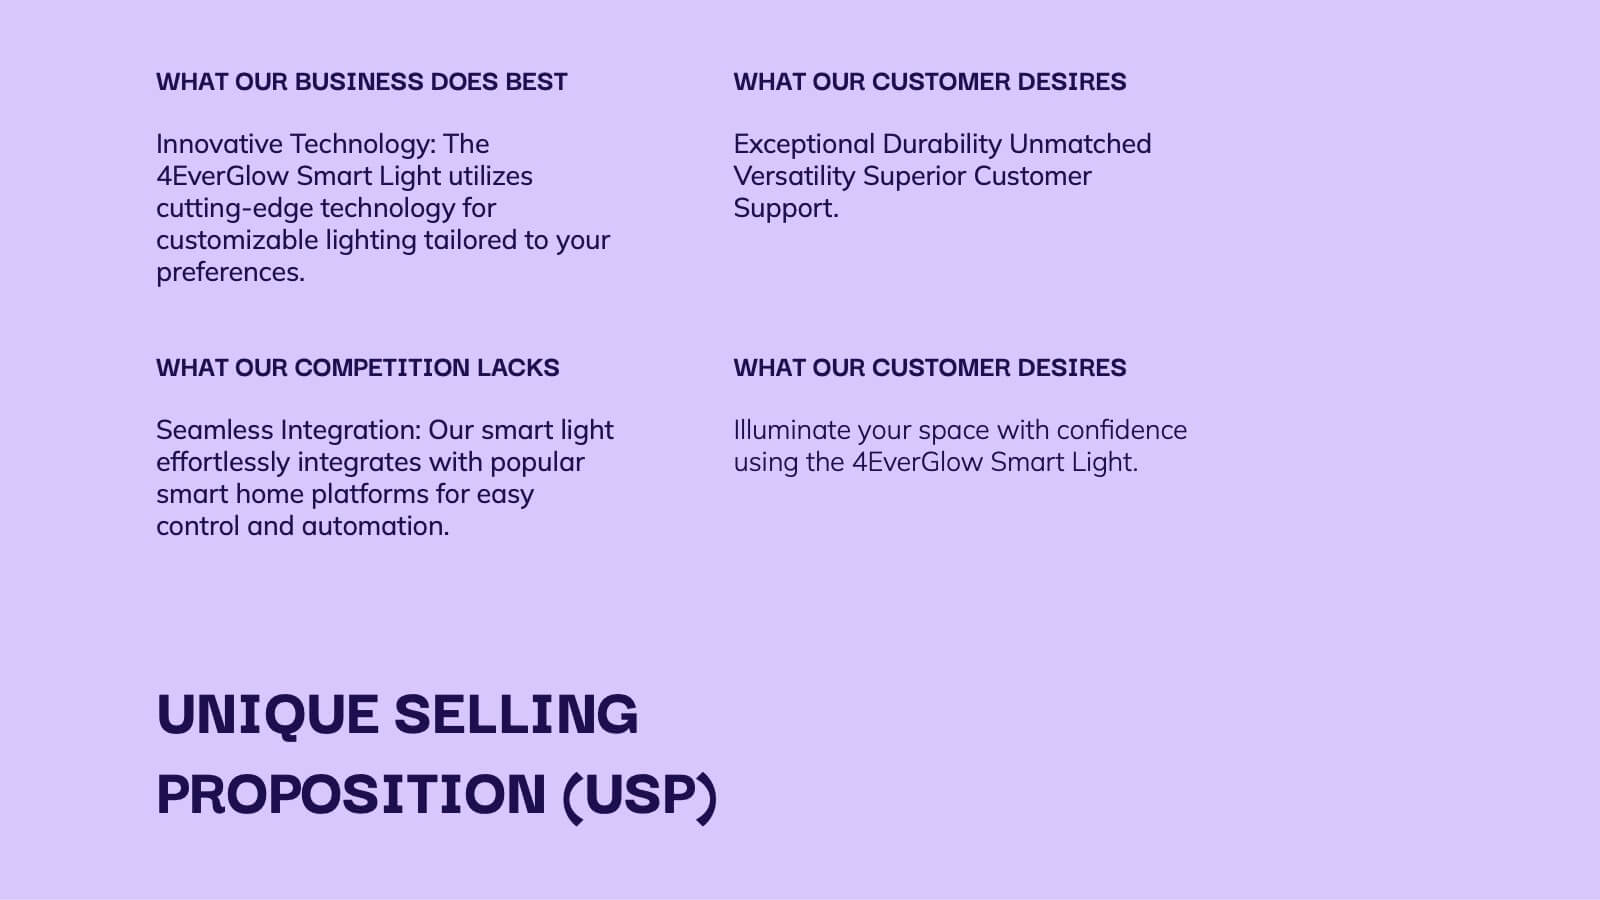
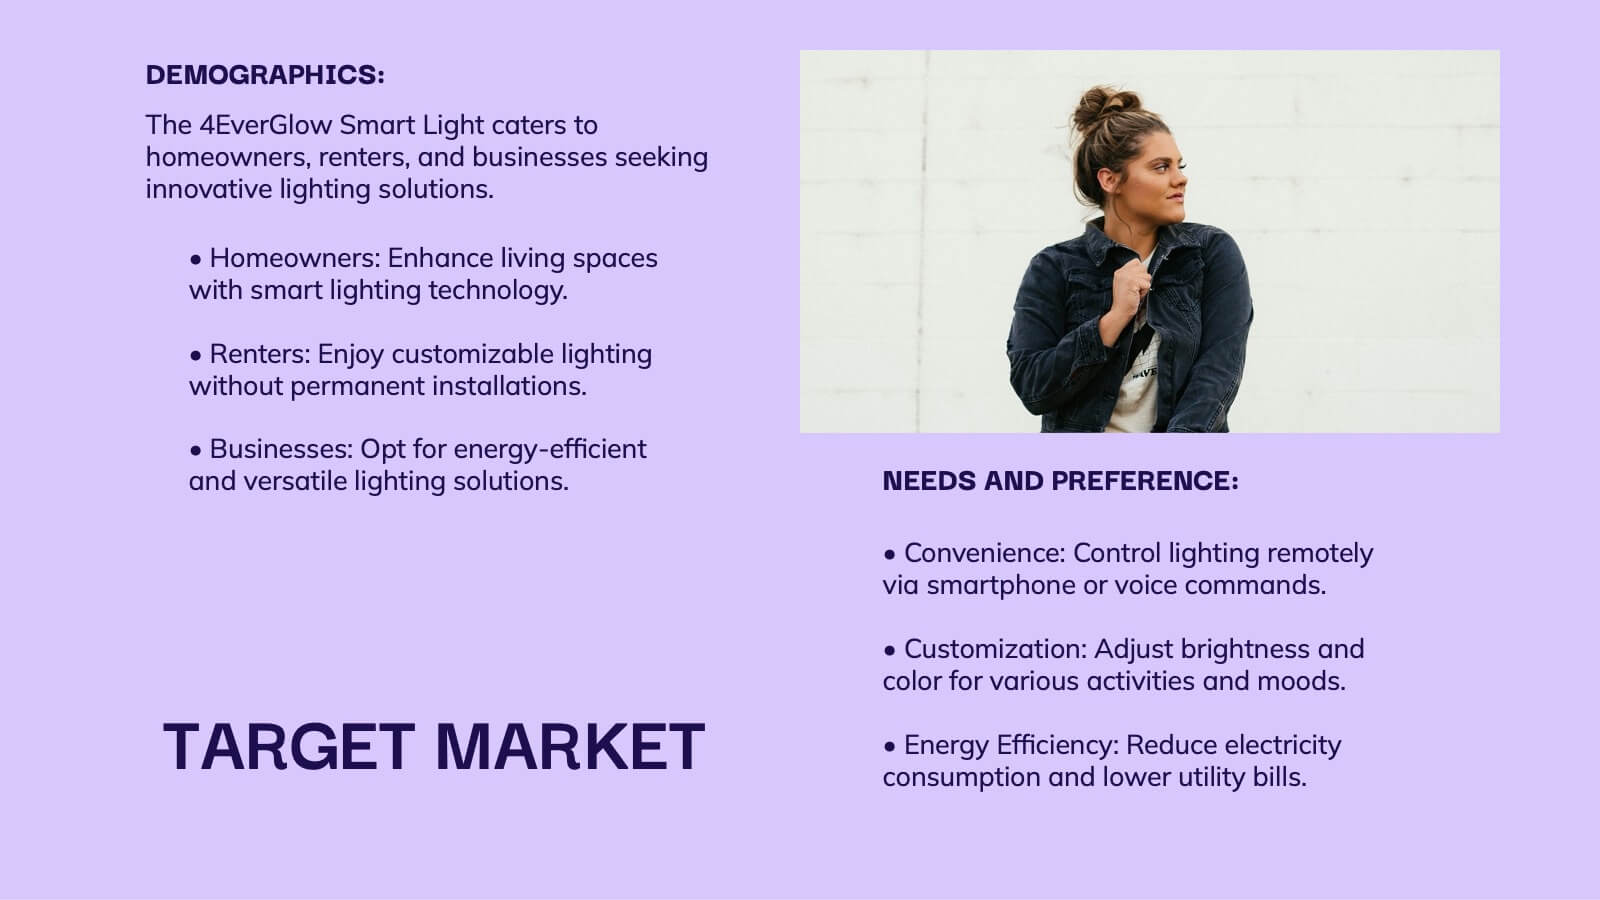
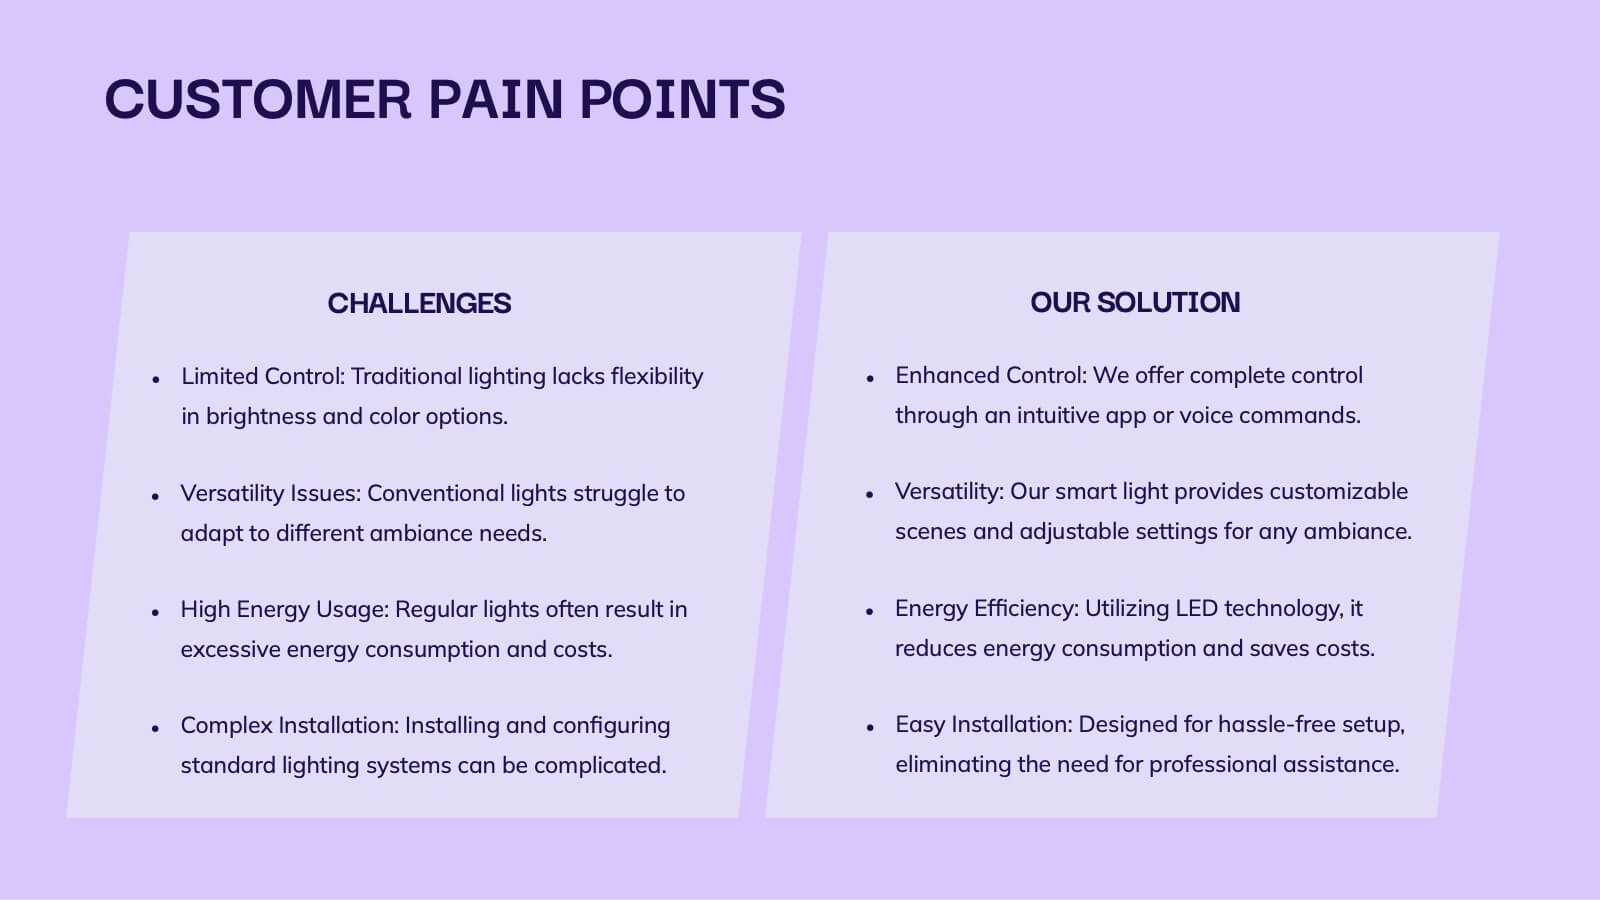
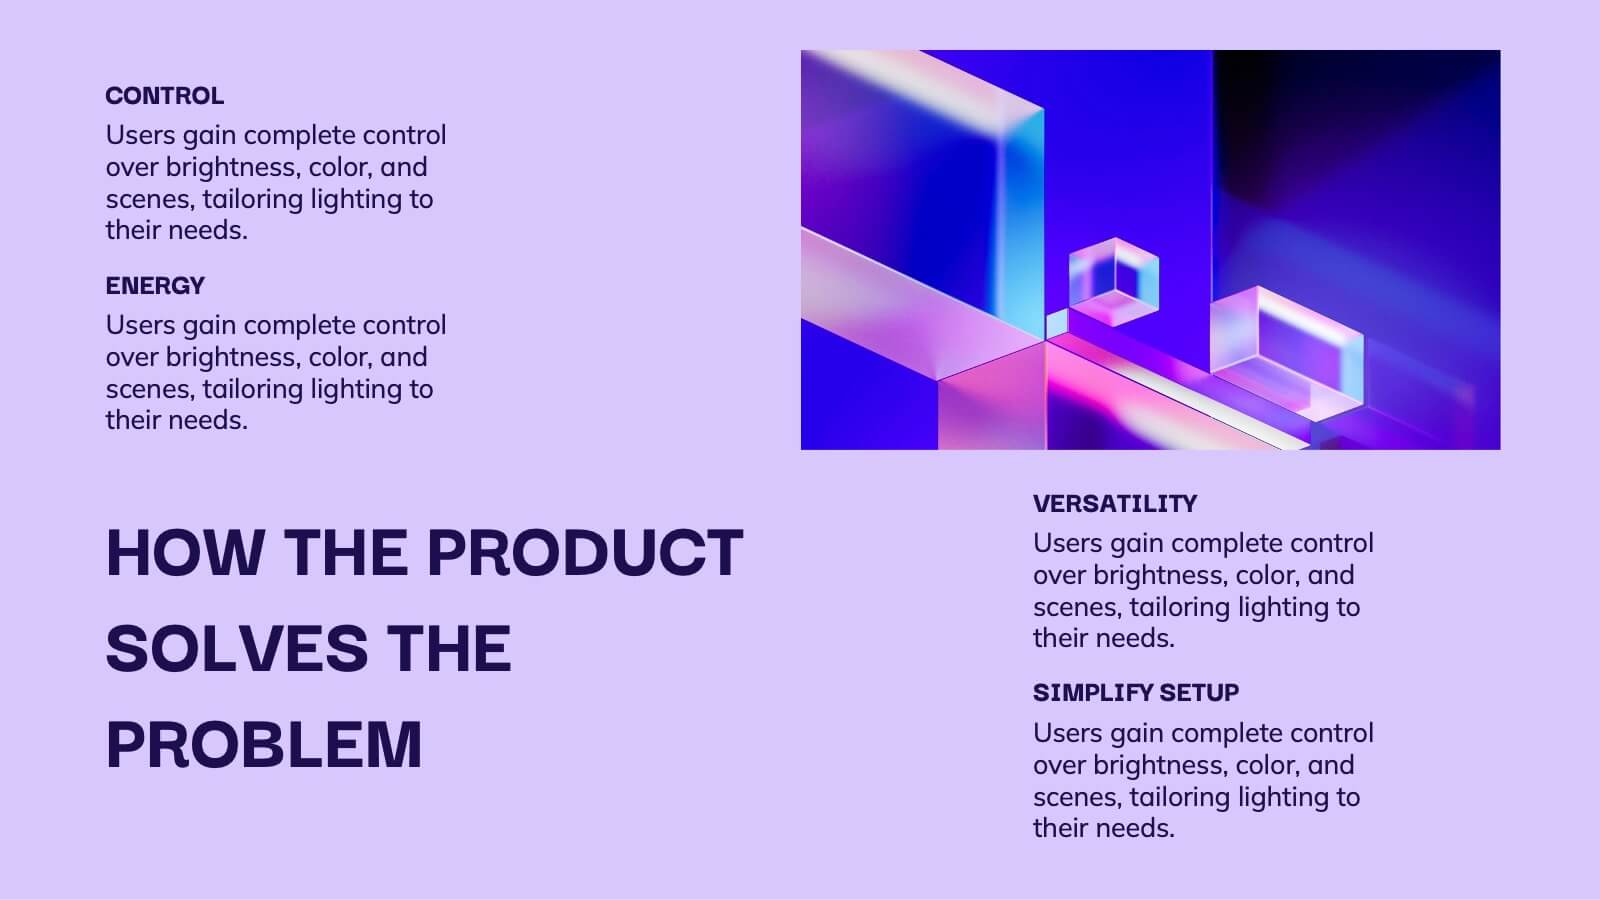
Customer Value Proposition Framework Presentation
Clarify your business offering with the Customer Value Proposition Framework Presentation. This template is designed to help you align your products or services with customer needs through a side-by-side visual of the Value Proposition Canvas. Highlight pain points, customer gains, and how your solution uniquely addresses them. Fully customizable in PowerPoint, Keynote, and Google Slides. Perfect for marketers, product managers, and strategic planning teams.


20 diapositivas
Earthsong UX UI Design Pitch Deck Presentation
This UX/UI Design Pitch Deck Template is a visually engaging and professional presentation designed to showcase your design process, from research and ideation to prototyping and final execution. It includes key sections such as design brief, target audience, design elements, project timeline, and implementation strategy, ensuring a comprehensive overview of your project. Fully customizable for PowerPoint, Keynote, and Google Slides, making it perfect for design agencies, freelancers, and creative professionals looking to impress potential clients and stakeholders.


5 diapositivas
Mission and Values Alignment
Align your purpose with progress using this clean, directional layout that maps your mission, core values, and strategic focus in a unified flow. Perfect for internal briefings or culture decks, this slide visually connects each value to your organizational journey. Fully compatible with PowerPoint, Keynote, and Google Slides.


7 diapositivas
Creative Timeline Infographic Presentation Template
A Timeline is an essential tool to illustrate the chronology of events; it also provides a method for organizing and summarizing material. With the timelines provided in this template you will be able to visualize the passage of time, so that you can better understand how influences from the past still impact your life today. This template is designed to assist you with crafting your timeline so that it can be easily understood. The color-coding makes it easy to see daily progress. Use the timelines in this template to create useful visualization, and convey the growth of your business or brand.


6 diapositivas
Sales Summary Infographic
Enhance your business presentations with our Infographic Templates! Designed specifically for professionals aiming to deliver impactful data insights, this collection provides an array of slides tailored to articulate complex information effortlessly. Crafted to showcase performance metrics, analyze market trends, and outline strategic directions, these templates turn data into narratives. Featuring unique designs ranging from sophisticated circular diagrams to innovative hexagonal lists and visually engaging photo integrations, each slide ensures your data is both comprehensive and compelling. You can customize colors and text to seamlessly align these designs with your corporate identity, enhancing brand consistency across all communications. Ideal for use in PowerPoint, Google Slides, and Keynote, these templates serve as essential tools for marketers, team leaders, and analysts. They facilitate clearer understanding, promote informed decision-making, and boost presentation impact, making them invaluable in any professional setting.


7 diapositivas
Social Media Infographic Presentation Template
Social media is an important business tool due to the fact that it allows you to reach, nurture, and engage with customers no matter where they are located. Additionally, it allows you to target new audiences, create brand awareness, and grow your following. This template features a clean, fun design that is easy to read. With a variety of slides and infographics, it makes it simple to create. This template will inform you how social media can be a powerful tool. This template is a great way to keep your information organized and includes tips that can be added at the bottom of each section.


8 diapositivas
Data Analytics Dashboard Slide Presentation
Turn raw data into visual insights with this clean and modern layout designed to simplify analytics reporting. Perfect for tracking performance metrics, KPIs, and progress updates, it helps make numbers easy to understand at a glance. Fully customizable and compatible with PowerPoint, Keynote, and Google Slides for effortless editing.


8 diapositivas
Team OKRs Planning and Monitoring Presentation
Foster alignment across teams with the Team OKRs Planning and Monitoring Presentation. This creative hand-shaped visual helps illustrate collaboration between objectives, key results, and responsibilities. Ideal for performance check-ins, OKR workshops, and team planning meetings. Fully customizable in PowerPoint, Canva, Keynote, and Google Slides for seamless integration.


10 diapositivas
Growth Strategy in Four Steps Presentation
Achieve sustainable business expansion with the Growth Strategy in Four Steps presentation. This structured template guides teams through progressive development phases, using clear visuals to illustrate key milestones and percentage-based improvements. Ideal for entrepreneurs, marketers, and business strategists, this slide layout is fully customizable and compatible with PowerPoint, Keynote, and Google Slides for seamless integration into your workflow.


5 diapositivas
4 Steps Travel Itinerary Slide Presentation
Plan every adventure with a slide that makes travel feel effortless and exciting. This presentation helps you map out destinations, activities, and budgets in four clear, intuitive steps—perfect for trip planning or presenting itinerary options. Designed for smooth customization and fully compatible with PowerPoint, Keynote, and Google Slides.