


Características


¿Tienes alguna pregunta?
Recomendar


5 diapositivas
Analytical Chimestry Infographics
Analytical Chimestry Infographics is a bold, colorful, and modern presentation


5 diapositivas
Iceberg Model Infographics
Introducing our Iceberg Model Infographic, this is a visual representation of the Iceberg Model which is a metaphor for understanding a problem or issue. It is based on the idea that just like an iceberg, only a small portion of the problem or issue is visible on the surface, while the majority of it lies beneath. In this vertical infographic use the top visible part of the iceberg to represent the things that are easily observed, and the larger hidden part of the iceberg can be the underlying causes or factors that are not easily visible. This is designed to help people understand the complexity of a problem and encourage them to look beyond the surface level.


5 diapositivas
Core to Outer Ring Concentric Planning Presentation
Present your strategy from the inside out with the Core to Outer Ring Concentric Planning Presentation. This layered, radial design guides viewers through a central concept outward into supporting elements—ideal for planning, process modeling, or decision frameworks. Fully customizable in PowerPoint, Keynote, and Google Slides.


4 diapositivas
Strategic Idea Pitch Presentation
Present your strategic ideas with clarity using this structured Strategic Idea Pitch template. Designed for business professionals and entrepreneurs, it simplifies complex ideas with a visual roadmap. Fully customizable and compatible with PowerPoint, Keynote, and Google Slides, it ensures a polished, persuasive presentation for pitching strategies and innovations effectively.


7 diapositivas
Africa Map Infographic Presentation Template
The African continent is home to a great deal of linguistic and cultural diversity. Africa has approximately one-third of the world's languages. There are at least seventy-five African languages with more than one million speakers. The diversity of Africa's languages is evidenced by their populations. This template features fully editable vector shapes of countries, national flags and lines to highlight routes across this diverse continent. Use this Africa map template to illustrate the countries of Africa and their borders. You can easily add information, such as other icons in the blank spaces.


2 diapositivas
Elegant Thank You Slide Presentation
Leave a lasting impression with this elegant thank-you slide template! Perfect for closing presentations with professionalism, this design features a modern layout with space for contact details and branding. Ideal for business meetings, pitches, and corporate events. Fully customizable and compatible with PowerPoint, Keynote, and Google Slides for seamless editing.


6 diapositivas
Student Success and Learning Programs Presentation
Showcase your academic initiatives with the Student Success and Learning Programs Presentation. Ideal for school boards, educators, or program leaders, this slide lets you highlight six key focus areas around student achievement. Fully editable in PowerPoint, Keynote, Google Slides, and Canva—making it easy to tailor to your curriculum goals.


6 diapositivas
Preventative Healthcare and Fitness Presentation
Promote wellness and proactive care with this colorful and clean slide layout. Featuring a clipboard-style design with stacked icons and aligned descriptions from A to E, it’s perfect for presenting fitness tips, health programs, or preventative strategies. The vibrant sections help guide viewers through key points at a glance. Fully editable and compatible with PowerPoint, Keynote, and Google Slides.


6 diapositivas
Managing Transition in Business Presentation
Make your next strategy session visually unforgettable with this clean, step-by-step layout. Designed to help explain transitional phases in business, this infographic template simplifies complex change processes into digestible segments. Ideal for professionals presenting transformation strategies. Fully editable and compatible with PowerPoint, Keynote, and Google Slides for easy use.


5 diapositivas
Customer Inquiry and Response Strategy Presentation
Streamline your communication flow with this step-by-step layout ideal for showcasing inquiry handling processes, customer service touchpoints, or lead response timelines. The linear design includes five fully editable stages with icons and text areas to clarify each phase of your strategy. Perfect for CRM teams, sales ops, and client support leaders. Fully customizable in PowerPoint, Keynote, and Google Slides.


5 diapositivas
Strategic Decision-Making Techniques Presentation
Communicate key business insights with clarity using this structured four-step layout. Each segment is aligned with an icon and space for concise text, making it ideal for presenting executive strategies, project evaluations, or decision pathways. The centered character adds a professional and engaging touch. Fully customizable in PowerPoint, Keynote, and Google Slides.


7 diapositivas
Dashboard Infographic Presentation Template
A Dashboard Infographic is a visual representation of important data or information that is organized in a way that is easy to understand. This template is perfect for getting your important information across in a way that's easy to comprehend. This template is designed to present your data in a concise and clear way and it can be used to track and monitor different metrics. This dashboard template has the ability to tell a story with a set of graphs and charts that can be customized in several different ways. You can use the graphs and charts and customize them according to your needs.


26 diapositivas
Remote Work Strategies Presentation
Enhance your team's flexibility with our Remote Work Strategies presentation template, designed for use with PowerPoint, Keynote, and Google Slides. This template is an invaluable asset for team leaders, HR professionals, and business consultants dedicated to cultivating a productive remote work culture. Our template is tailored to provide an in-depth analysis of remote work best practices, offering slides that cover essential strategies for communication, collaboration, and project management in a virtual environment. It also includes insights on setting up a successful home office, maintaining work-life balance, and leveraging technology for seamless remote operations. With customizable elements, you can illustrate the advantages of remote work, share success stories, and provide actionable tips to maximize team efficiency from afar. This template is SEO-optimized to ensure your presentation reaches those seeking to optimize their remote work operations and foster a thriving digital workplace.


5 diapositivas
5-Level Risk Management Plan Presentation
Turn complex strategies into clear, visual steps with this sleek layered layout designed for analyzing and mitigating potential risks. Each level helps you outline priorities, assess impact, and communicate safety measures effectively. Fully compatible with PowerPoint, Keynote, and Google Slides, making customization fast, professional, and presentation-ready.


8 diapositivas
Employee Performance Review Presentation
Assess and visualize team performance effectively with these "Employee Performance Review" presentation templates. Crafted to simplify performance analysis, these slides allow you to pinpoint strengths and areas for improvement through clear, sequential visual layouts. They are perfect for managers looking to foster growth and productivity, and are fully compatible with PowerPoint, Keynote, and Google Slides.


25 diapositivas
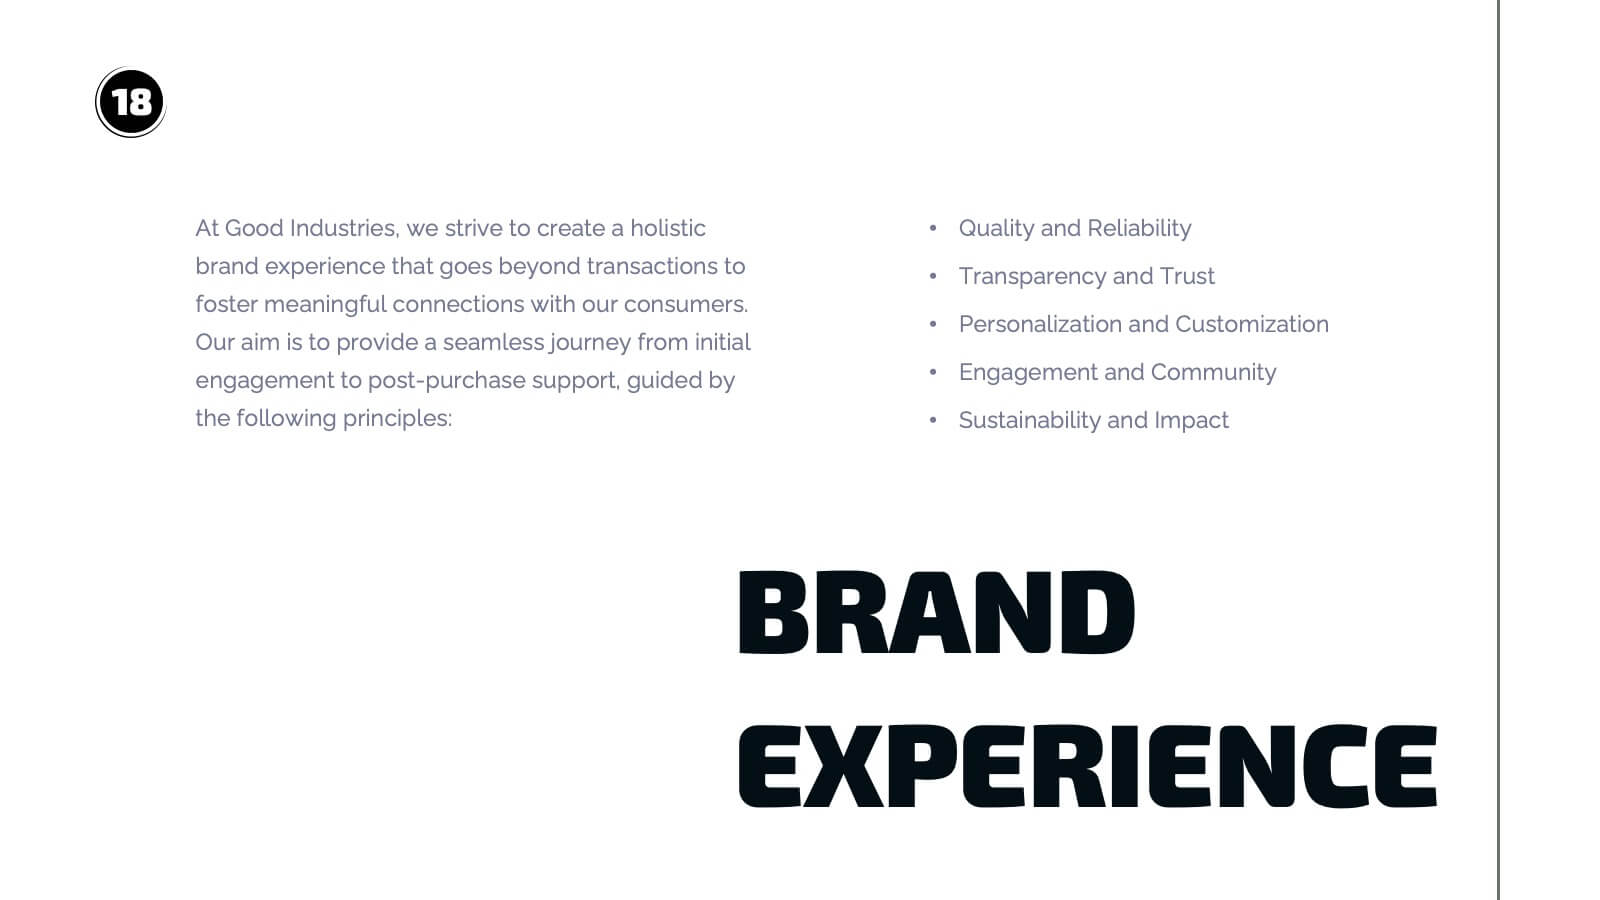
Zephyrion Brand Guidelines Proposal Presentation
Build and communicate your brand effectively with this comprehensive brand strategy presentation! It features sections like brand voice, positioning, competitive landscape, and performance metrics, helping you align your messaging and identity. Ideal for internal brand workshops or client presentations, this template works seamlessly with PowerPoint, Keynote, and Google Slides.


26 diapositivas
Leadership and Management Skills Presentation
Elevate your leadership and management training with a presentation template that's as organized and efficient as it is visually appealing. The design is tailored for clarity, with a clean, contemporary layout that speaks to professionals eager to enhance their skills. Each slide is crafted with purpose, using a smart blend of graphics and space to highlight key concepts in leadership and management. This template includes a variety of slides to cover all training aspects: from the core qualities of a leader to the intricacies of team management. Graphs and charts provide a clear representation of management theories, while comparison slides help illustrate different leadership styles. Whether for a corporate training session, a workshop for budding entrepreneurs, or a classroom lecture, this set is ready for use in PowerPoint, Keynote, and Google Slides, making it a valuable tool for any leadership development program.