


Características


¿Tienes alguna pregunta?
Recomendar


8 diapositivas
Company Achievements Year in Review Presentation
Highlight milestones with impact using the Company Achievements Year in Review Presentation. This dynamic slide uses a multi-layered, pyramid-style layout to showcase your organization’s key wins, progress, and stats throughout the year. Perfect for internal reviews, investor decks, or annual reports. Fully editable and compatible with PowerPoint, Keynote, and Google Slides.


12 diapositivas
Project Completion Checklist
Streamline project tracking with this clean and functional project completion checklist slide. Ideal for task management and progress reporting, it includes editable sections for task descriptions, process stages, current status, and additional notes. With toggles like “In Process,” “On Hold,” “Complete,” and “Overdue,” this layout is perfect for keeping teams aligned. Fully editable in PowerPoint, Keynote, and Google Slides.


23 diapositivas
Fama Business Idea Pitch Deck Presentation
Present your business idea with this impactful pitch deck, covering key areas like problem statement, solutions, competitive landscape, financials, and growth projections. With a bold design, it effectively showcases your startup’s value proposition. Compatible with PowerPoint, Keynote, and Google Slides for dynamic and professional investor presentations.


6 diapositivas
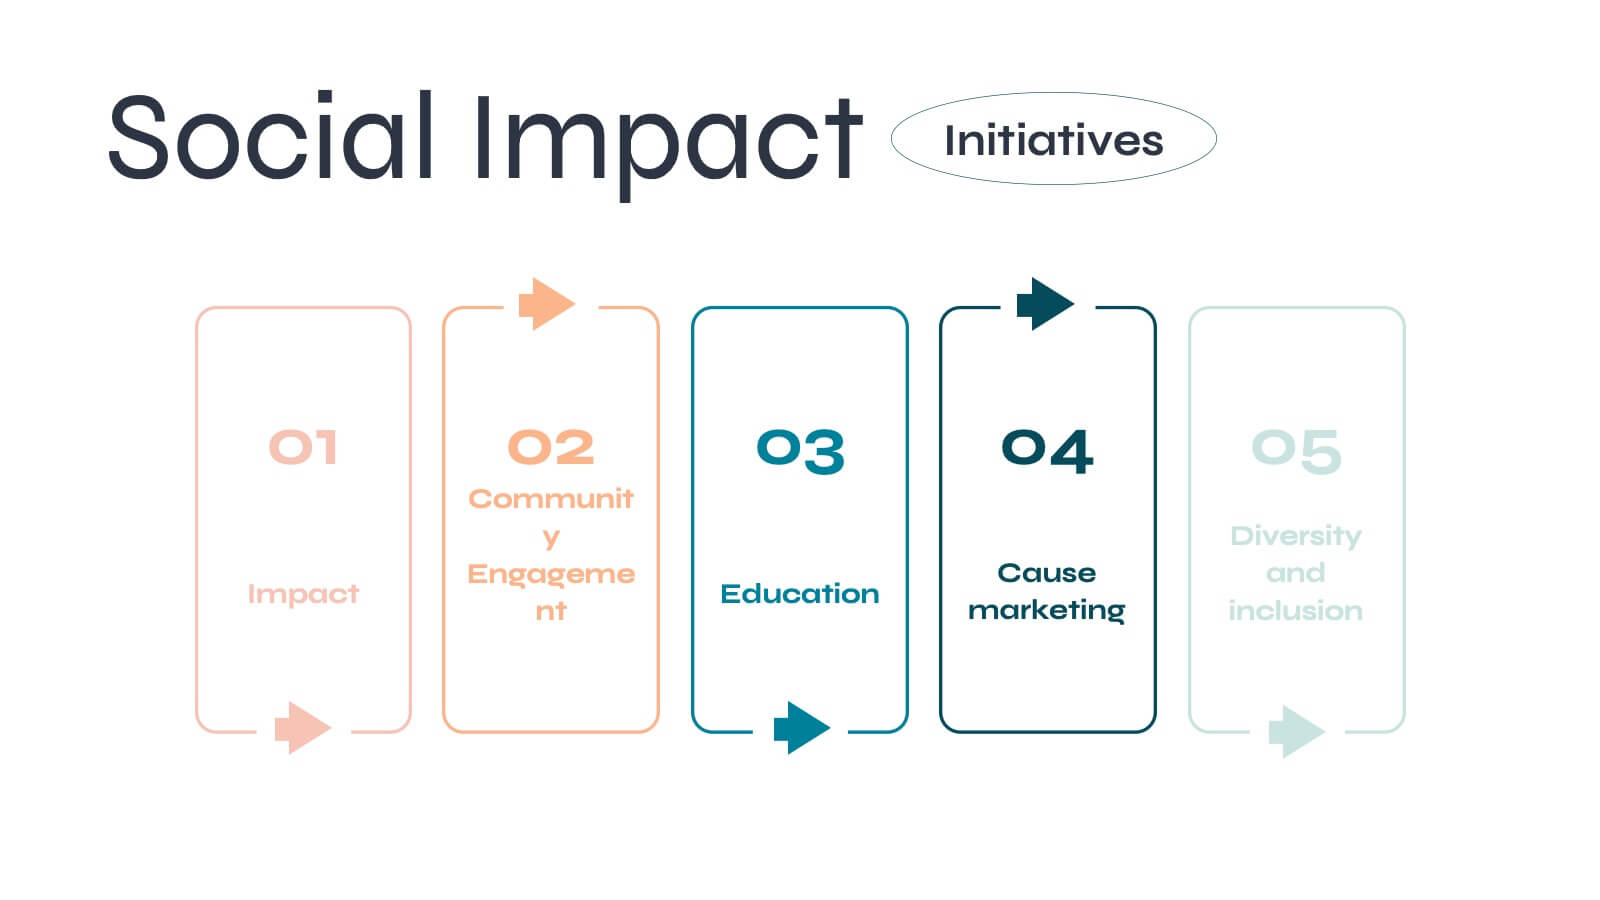
Creative 3D Elements Slide Presentation
Take your slides from flat to fantastic with this playful 3D layered design! This infographic template is perfect for visualizing multi-step processes, product stacks, or layered strategies in a modern and creative way. It’s fully editable and easy to customize in PowerPoint, Keynote, and Google Slides for any presentation need.


5 diapositivas
End-to-End Value Chain Map Presentation
Bring clarity to complex operations with a smooth, visual flow that makes every stage of your process easy to follow. This presentation maps activities from start to finish, helping teams understand dependencies, improve efficiency, and spot opportunities for optimization. Fully compatible with PowerPoint, Keynote, and Google Slides.


7 diapositivas
SWOT Analysis Marketing Infographic Presentation
SWOT Analysis is a simple, but powerful strategic planning method. It helps identify your company’s strengths, weaknesses, opportunities and threats as you plan a course for the future. This template includes everything you need for your next project, including data and insight about your business. This template comes with 7 slides. It includes a title for each infographic and allows you to build your swot charts, add icons and convert the text into bullet points. You have complete control over all elements within each slide and can easily add, delete or modify content at any time!


24 diapositivas
Gamma UX Design Presentation
Present your user experience design process with a sleek and modern template tailored for UX professionals. This template offers a cohesive flow of slides designed to illustrate your design journey, from user research to prototyping and final implementation. Highlight key aspects of your project with slides dedicated to user personas, wireframes, usability testing, and accessibility considerations. Showcase your team’s expertise and present project outcomes effectively with a clean and engaging layout. Visual elements and icons ensure your content is both informative and aesthetically pleasing. Compatible with PowerPoint, Google Slides, and Keynote, this fully customizable template allows you to personalize fonts, colors, and images to match your project’s branding. Impress stakeholders with a well-structured presentation that communicates your UX vision and expertise.


10 diapositivas
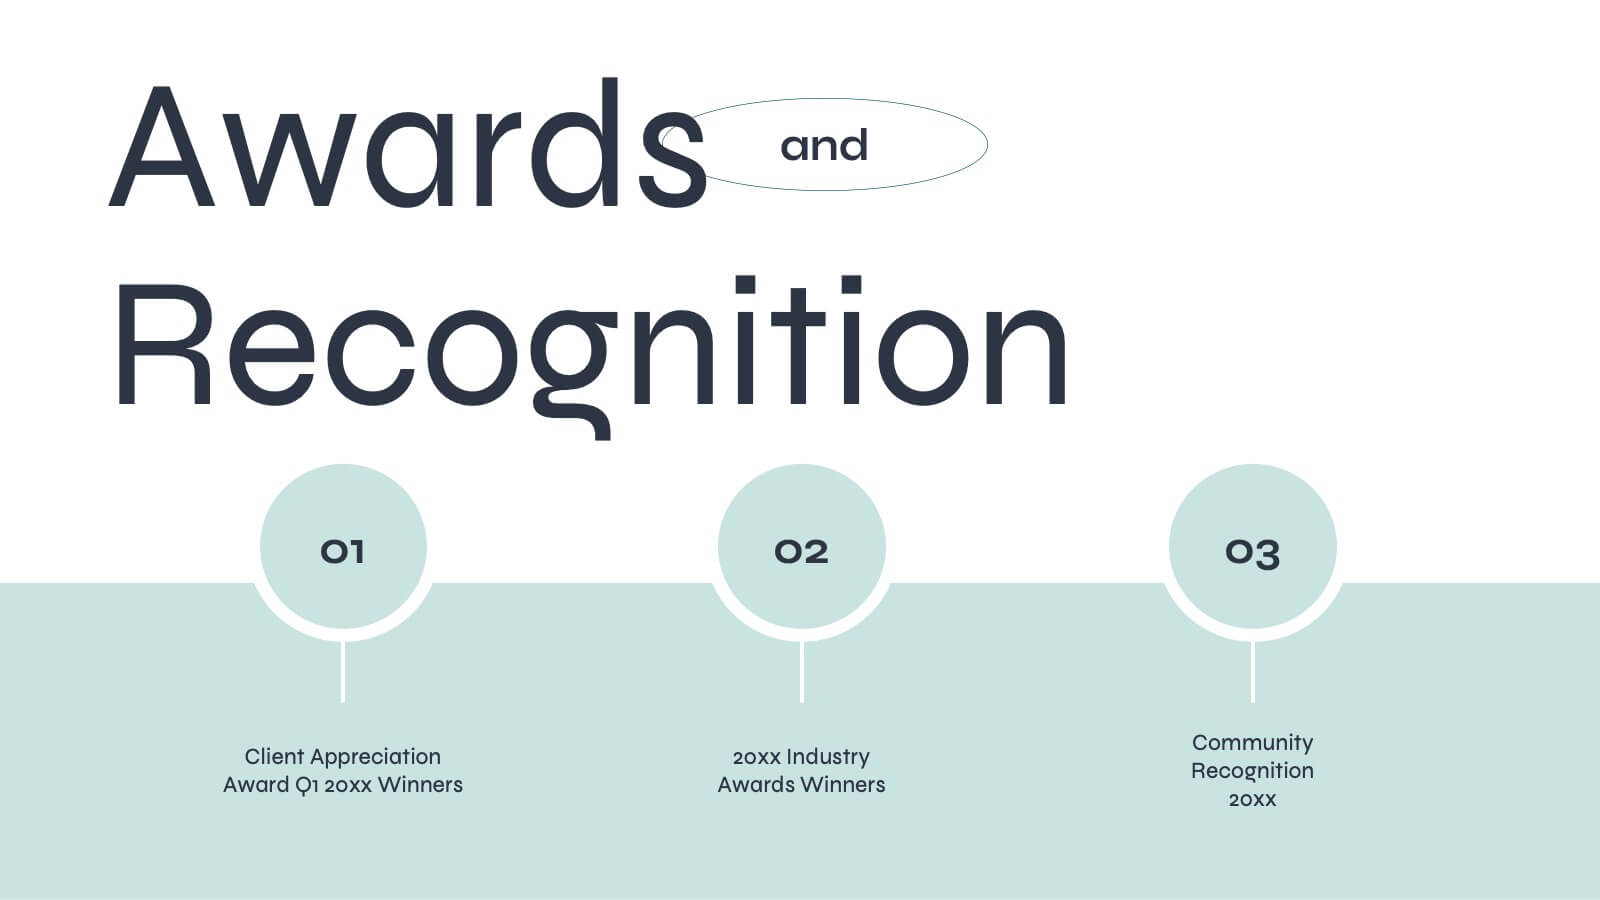
5-Level Circular Diagram Presentation
Visualize complex concepts with this professional 5-Level Circular Diagram template. Perfect for business strategies, project planning, and hierarchical structures, it provides a clear, layered approach. Fully editable and compatible with PowerPoint, Keynote, and Google Slides, this design ensures a polished, impactful presentation with structured, easy-to-understand visuals.


6 diapositivas
Business Process Flowchart Presentation
Streamline your workflow with the Business Process Flowchart presentation. This structured and visually engaging template helps you map out processes, optimize efficiency, and improve communication within your team. Designed for business analysts, managers, and strategists, this fully editable slide ensures clarity in decision-making and operations. Compatible with PowerPoint, Keynote, and Google Slides.


2 diapositivas
Introduction Slide for Professional Decks Presentation
Make a strong first impression with this clean and modern introduction slide. Designed to kick off your presentation with clarity, this template is ideal for professional decks, pitch presentations, and business briefings. Customize the layout with your visuals and text to align with your message. Fully compatible with PowerPoint, Keynote, and Google Slides.


6 diapositivas
Funnel Stages Infographic
In marketing and sales, the term "funnel stages" refers to the different stages or steps that a potential customer goes through in their journey from initial awareness of a product or service to making a purchase decision. These infographics visualize and help you understand the customer's progression through these stages. They aim to help businesses and professionals understand the customer journey and optimize their strategies for each stage of the funnel. Whether used in sales presentations, marketing workshops, or educational materials, this template helps businesses build successful sale funnels and maximize their revenue potential.


5 diapositivas
Website SEO Performance Analytics Presentation
Visualize your website’s performance data clearly and professionally with this structured SEO analytics slide. This template features a tiered layout with a central search bar icon and four vertically-aligned data sections—perfect for breaking down KPIs like traffic sources, bounce rates, keyword rankings, and conversion rates. Ideal for digital marketers, SEO analysts, and reporting presentations. Fully editable in PowerPoint, Keynote, and Google Slides.


22 diapositivas
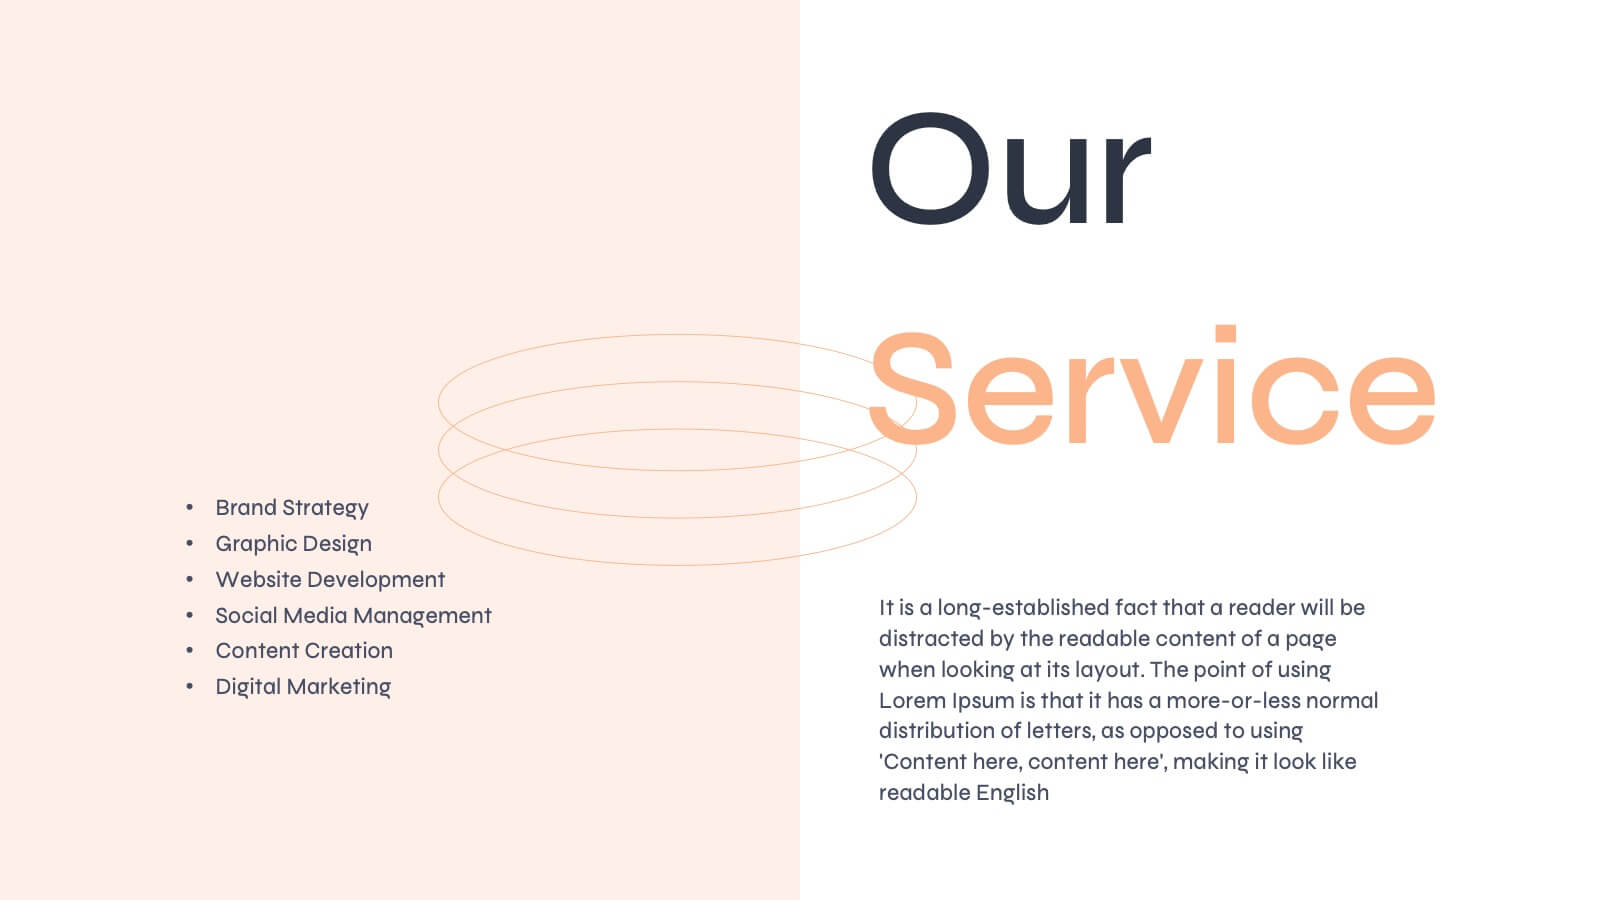
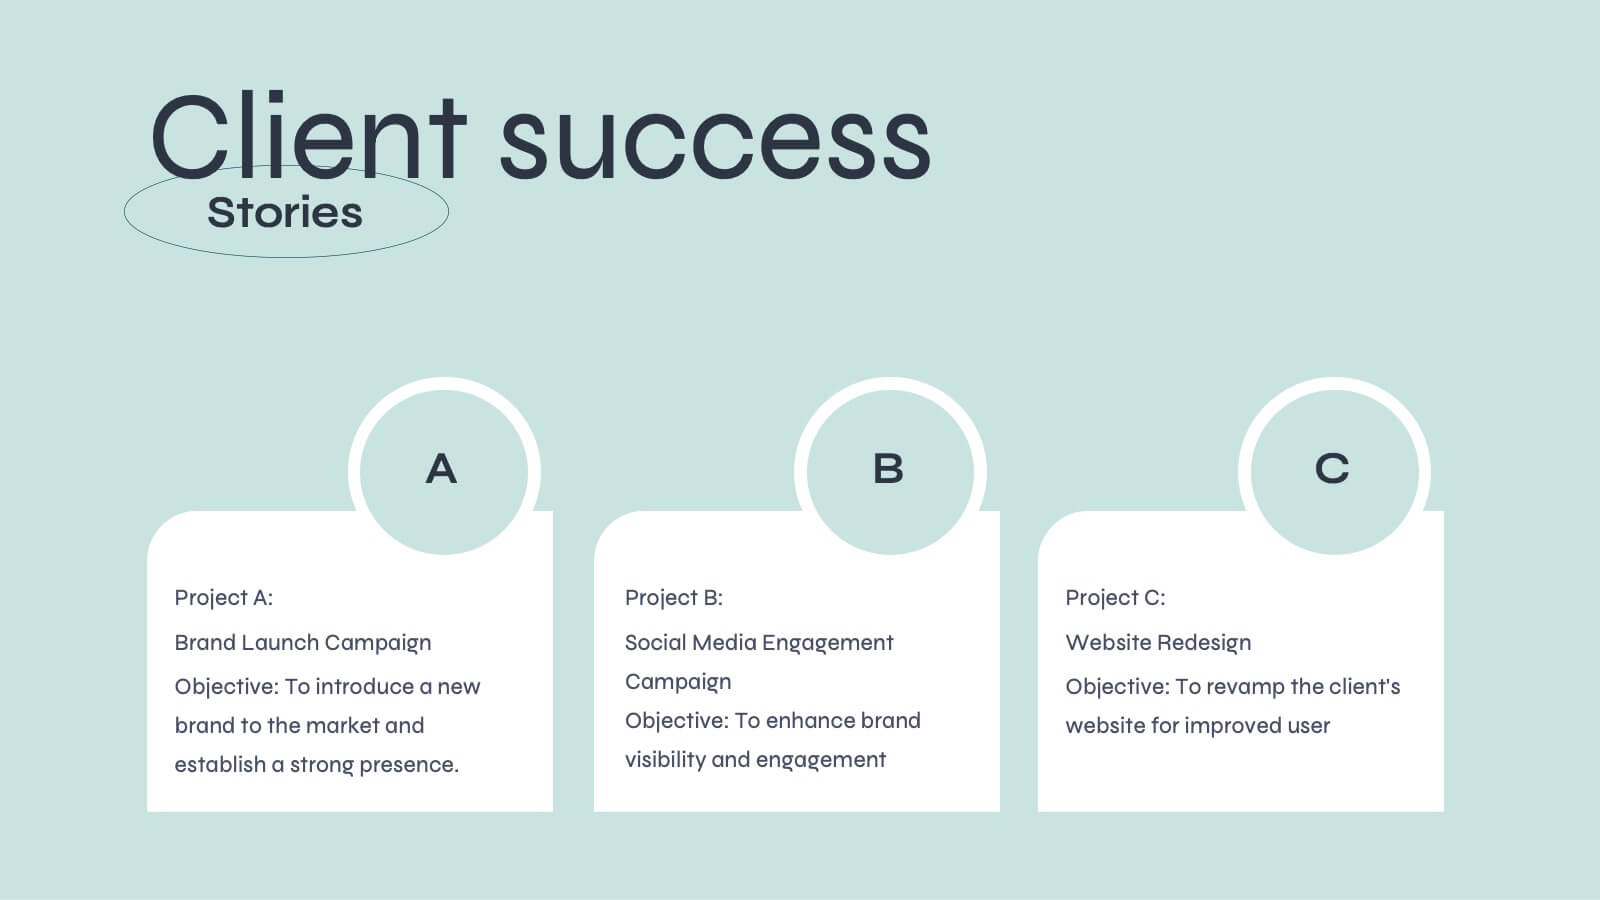
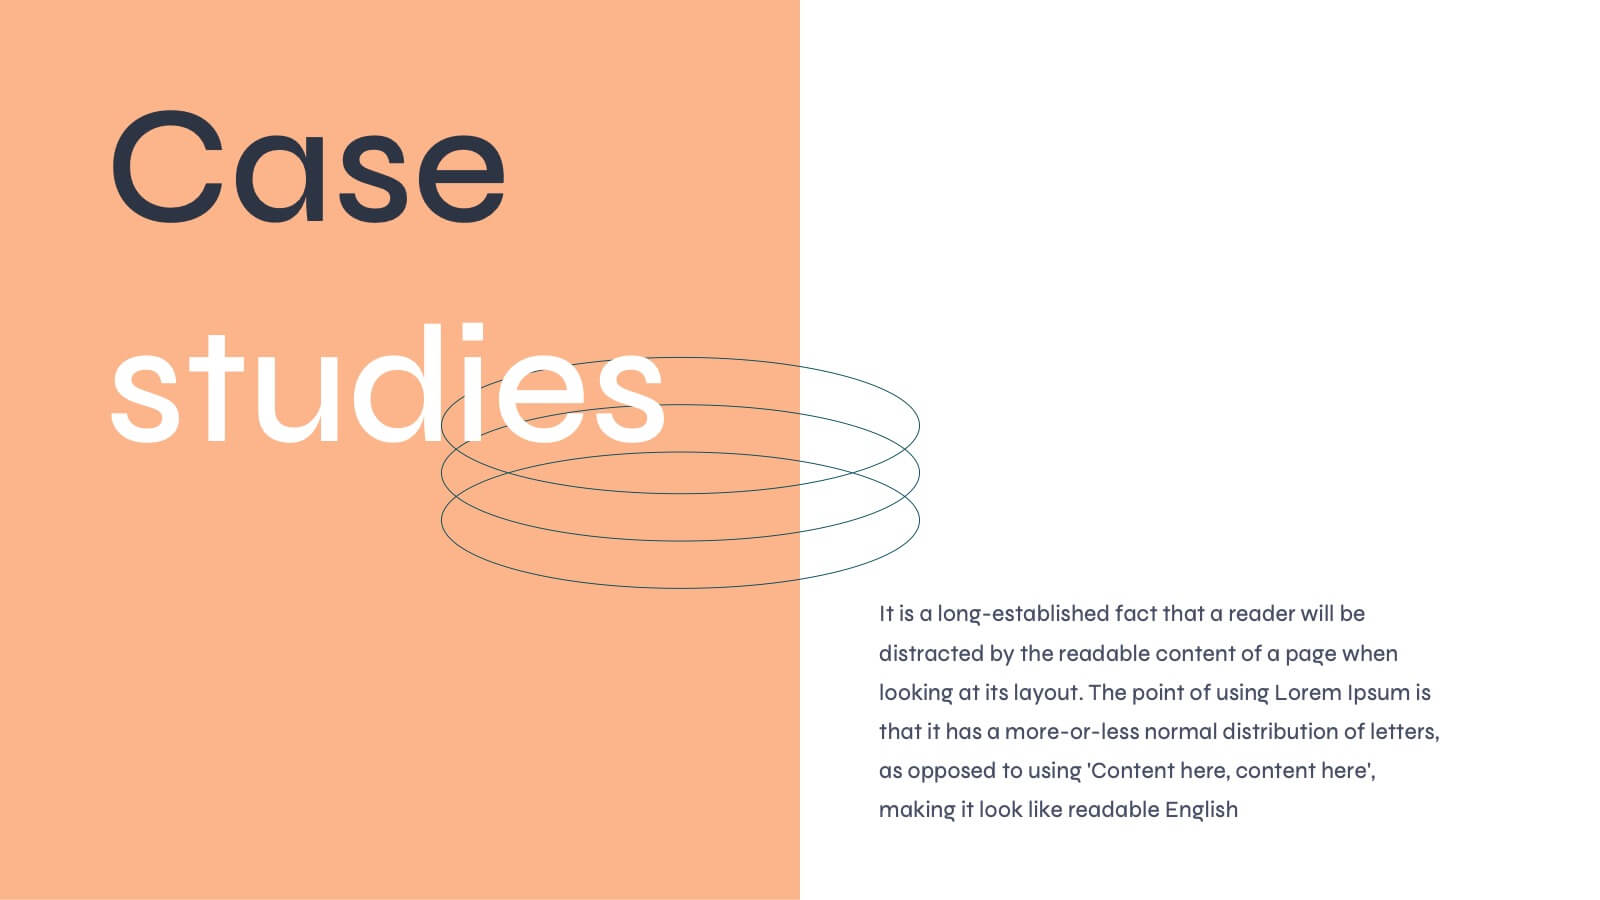
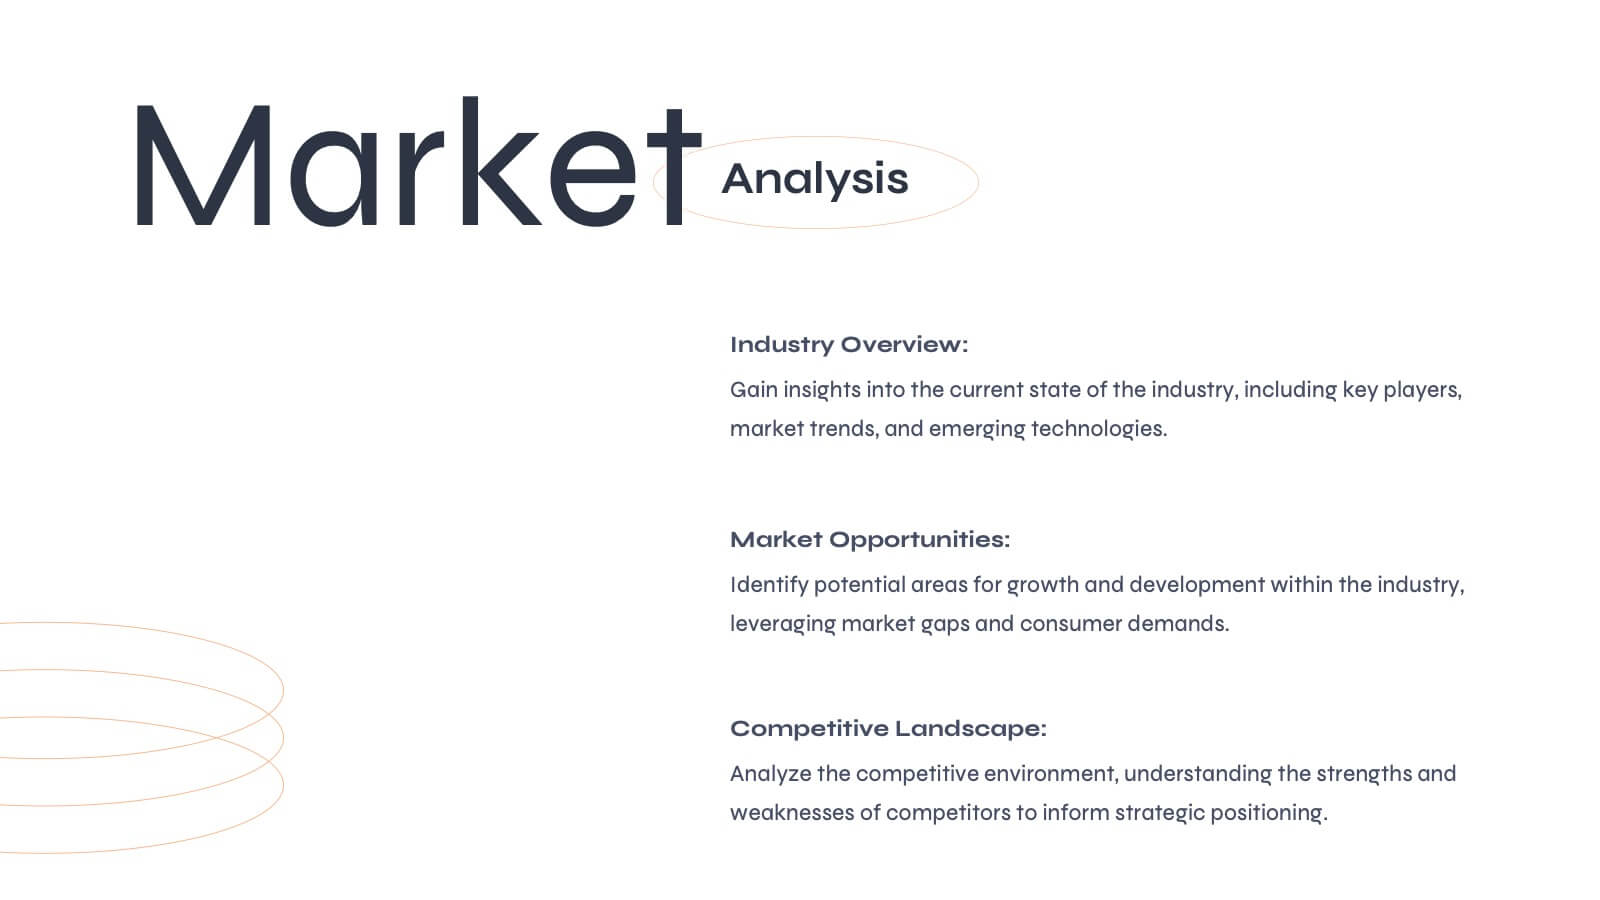
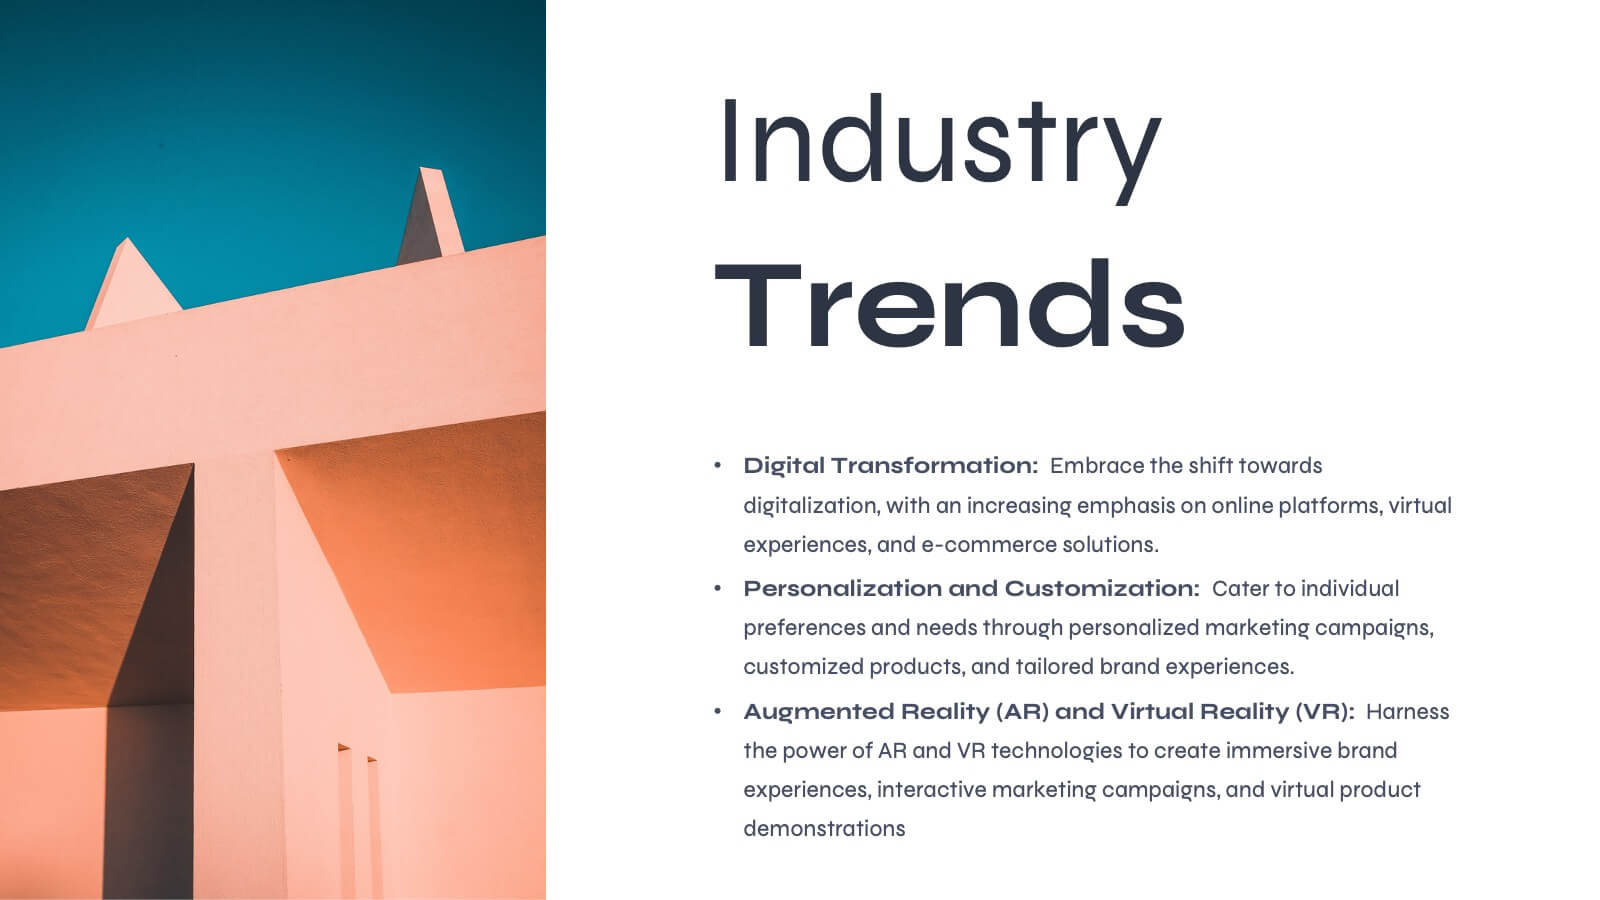
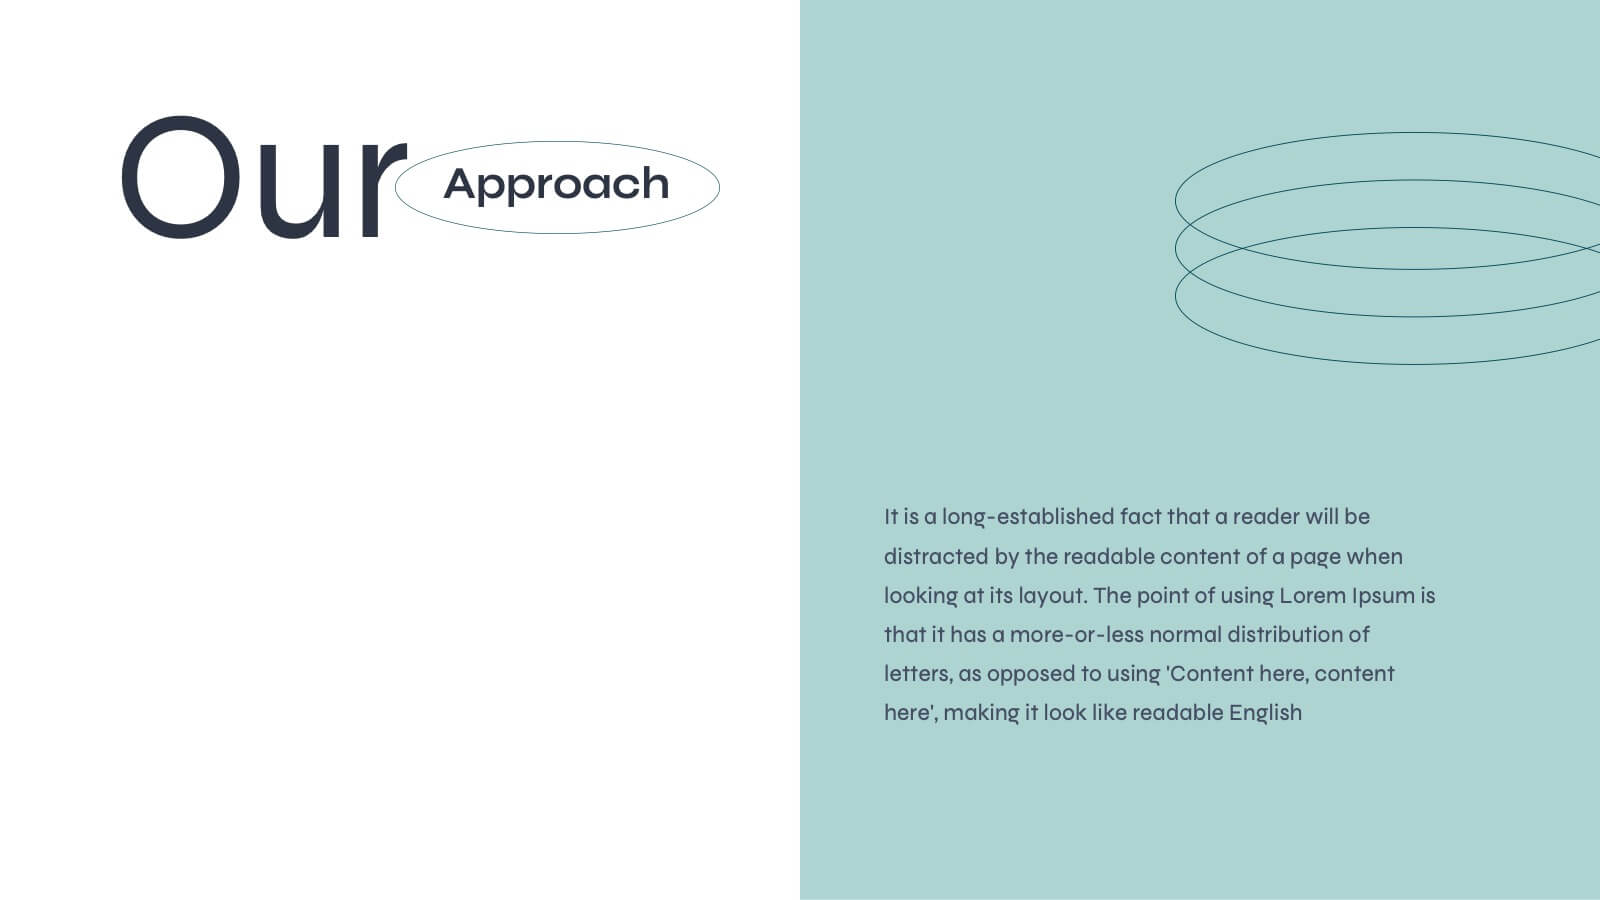
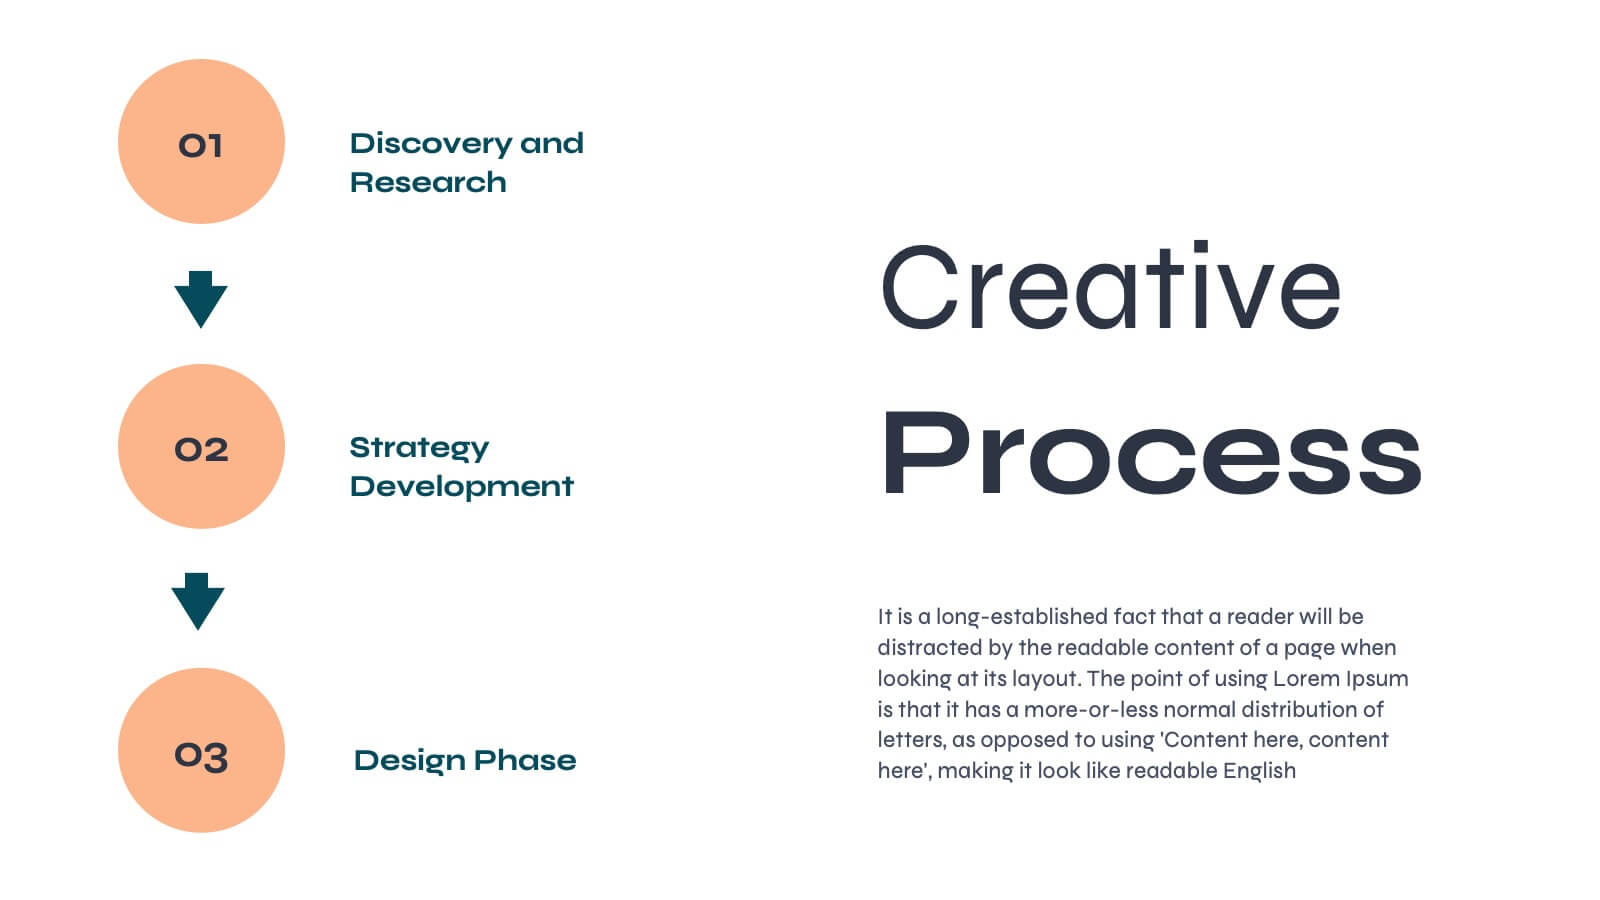
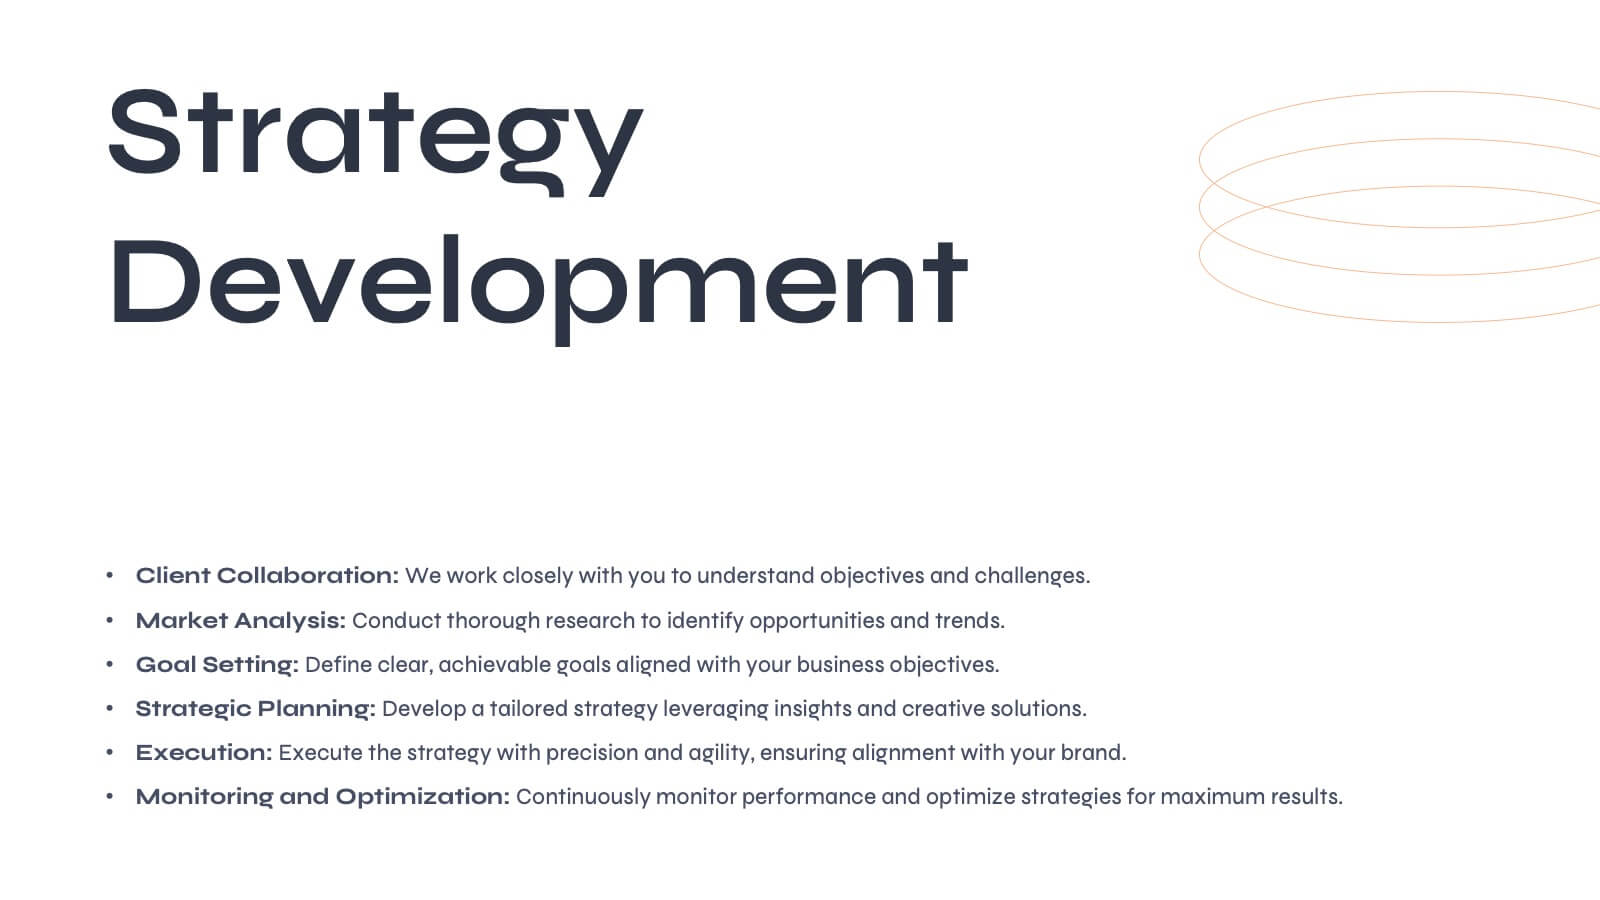
Aurora Agency Portfolio Presentation
Showcase your agency's strengths with this polished, modern presentation template. Perfect for presenting market analysis, client success stories, and creative processes, it features a clean and professional design. Highlight your team's expertise and strategic approach to impress potential clients. Compatible with PowerPoint, Keynote, and Google Slides, it ensures seamless presentations on any platform.


24 diapositivas
Blazewind User Experience Proposal Presentation
This UX Strategy Plan Presentation Template is a comprehensive and visually engaging solution for presenting user experience design strategies. Covering key elements such as research, wireframing, prototyping, user testing, and design principles, it ensures a structured approach to showcasing your UX process. Ideal for UX/UI designers, agencies, and businesses looking to communicate their design strategies effectively. Fully compatible with PowerPoint, Keynote, and Google Slides for seamless customization.


5 diapositivas
Crypto Investment Trends and Insights Presentation
Stay ahead of the digital asset curve with the Crypto Investment Trends and Insights presentation template. This slide features a visually compelling mining cart illustration filled with cryptocurrency symbols, perfect for presenting market data, blockchain innovations, or digital asset strategies. Highlight three core insights using customizable text areas and icons. Ideal for crypto analysts, fintech professionals, and investment briefings. Fully editable in PowerPoint, Keynote, and Google Slides.


7 diapositivas
Relationship Polices Infographic
Navigate the intricacies of interpersonal dynamics with our relationship policies infographic. Adorned in the purity of white, complemented by shades of understanding blue and harmonious green, this template elucidates the principles and boundaries that shape healthy relationships. Detailed with relevant infographics, symbolic icons, and illustrative image placeholders, it provides a visual roadmap to successful connections and interactions. Impeccably designed for Powerpoint, Keynote, or Google Slides. An essential tool for HR professionals, relationship counselors, team leaders, or any organization emphasizing healthy interpersonal dynamics. Foster connections; let each slide guide the way to relationship excellence.


6 diapositivas
Alphabet Learning Presentation
Make learning fun and engaging with this alphabet learning presentation template! Designed with vibrant visuals and a structured layout, this template helps educators, parents, and trainers introduce letters effectively. Perfect for early childhood education, homeschooling, and interactive lessons. Fully customizable and compatible with PowerPoint, Keynote, and Google Slides.