


Características


¿Tienes alguna pregunta?
Recomendar


6 diapositivas
Smile Book Rating Infographics
Discover the captivating world of book ratings with Smile! This infographic is your gateway to understanding how to assess and rate books, offering insights into why and how to share your opinions effectively. Delve into the process of rating books with Smile, grasping the importance of thoughtful and honest ratings. Learn how your ratings contribute to helping fellow readers find their next favorite book and provide valuable support to authors. Explore the art of crafting detailed and constructive book reviews. Dive into the elements of a compelling review, covering aspects like plot, characters, and the moments that brought a smile (or provoked other emotions) while reading. Equip yourself with the skills to articulate your thoughts effectively. With this engaging infographic, compatible with PowerPoint, Keynote, and Google Slides, sharing your book ratings and reviews is a breeze. Empower yourself with the knowledge to become an influential book reviewer. Immerse yourself in the world of book ratings with Smile, embarking on a journey of literary exploration and appreciation.

22 diapositivas
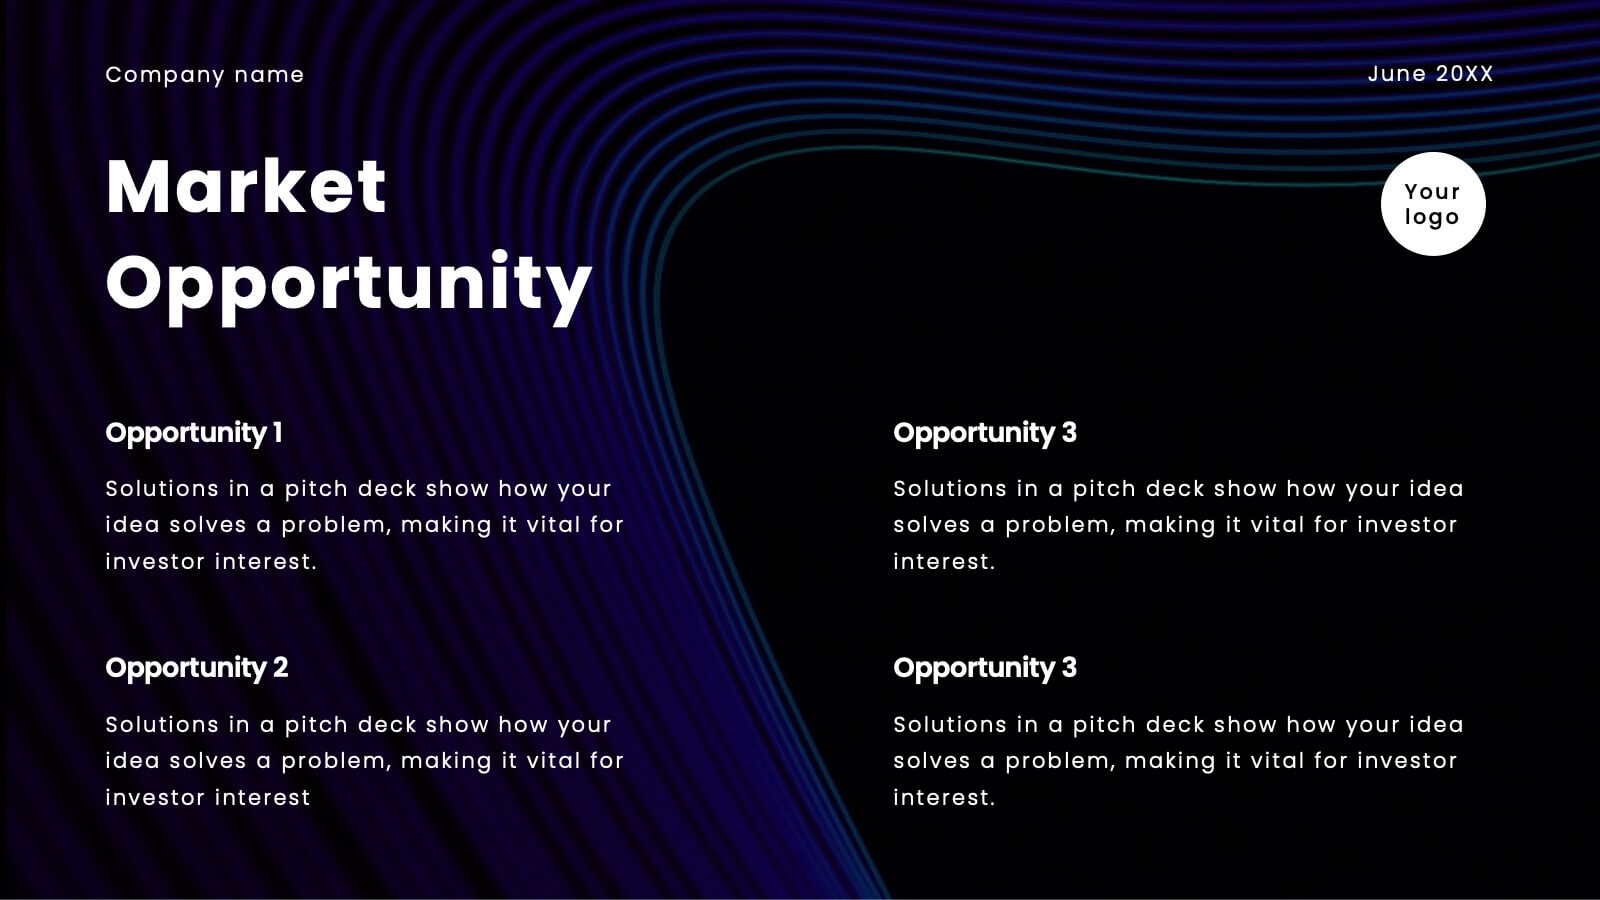
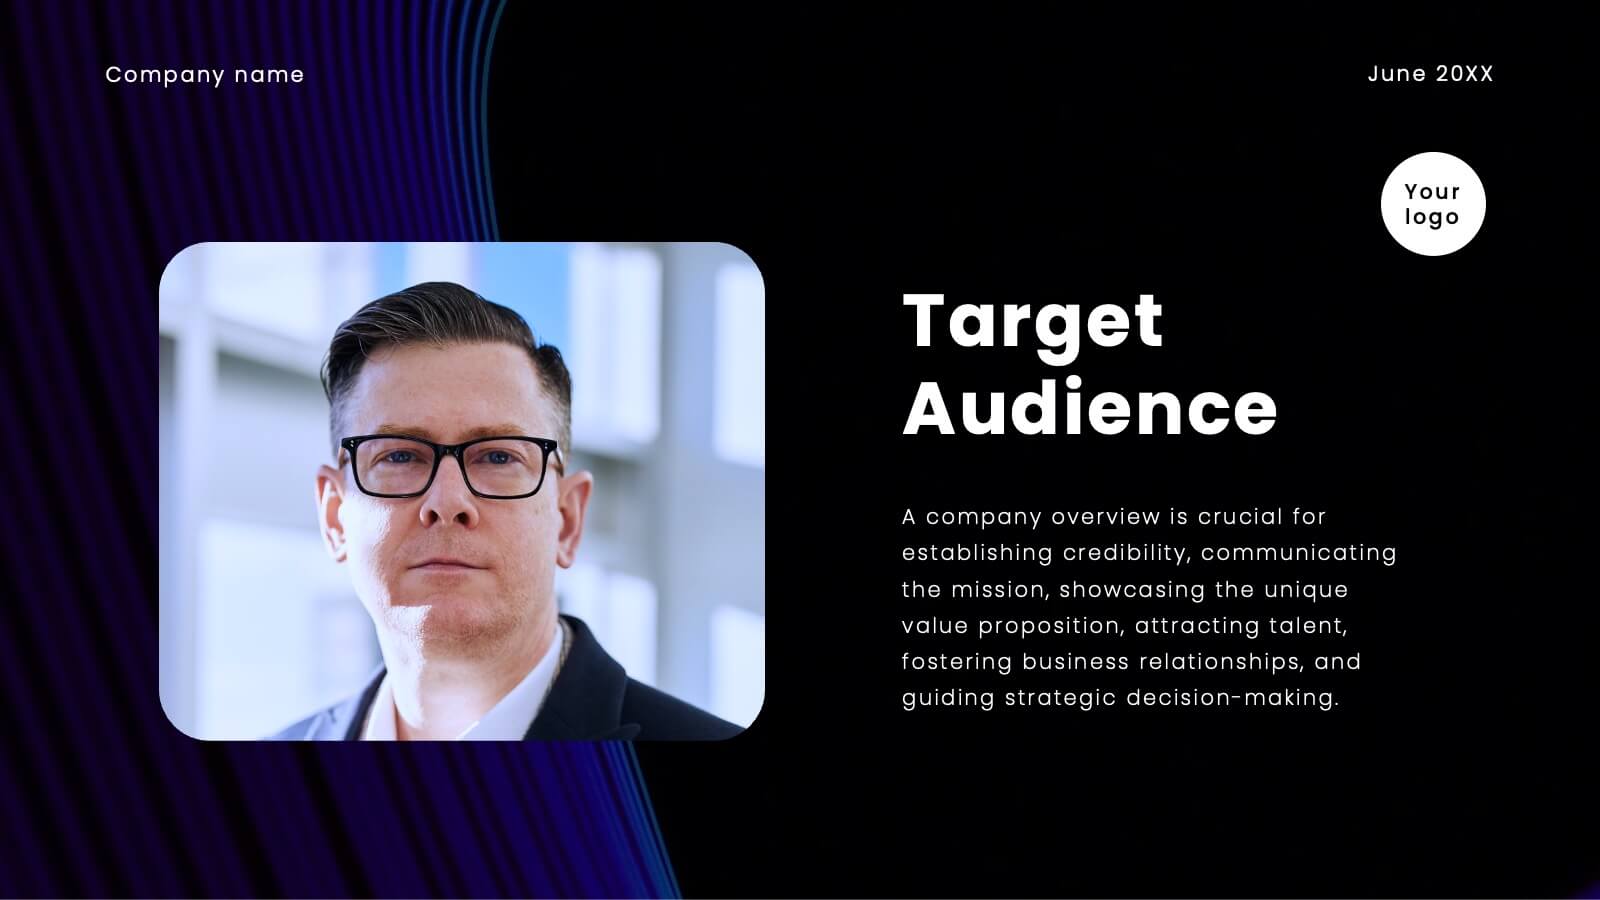
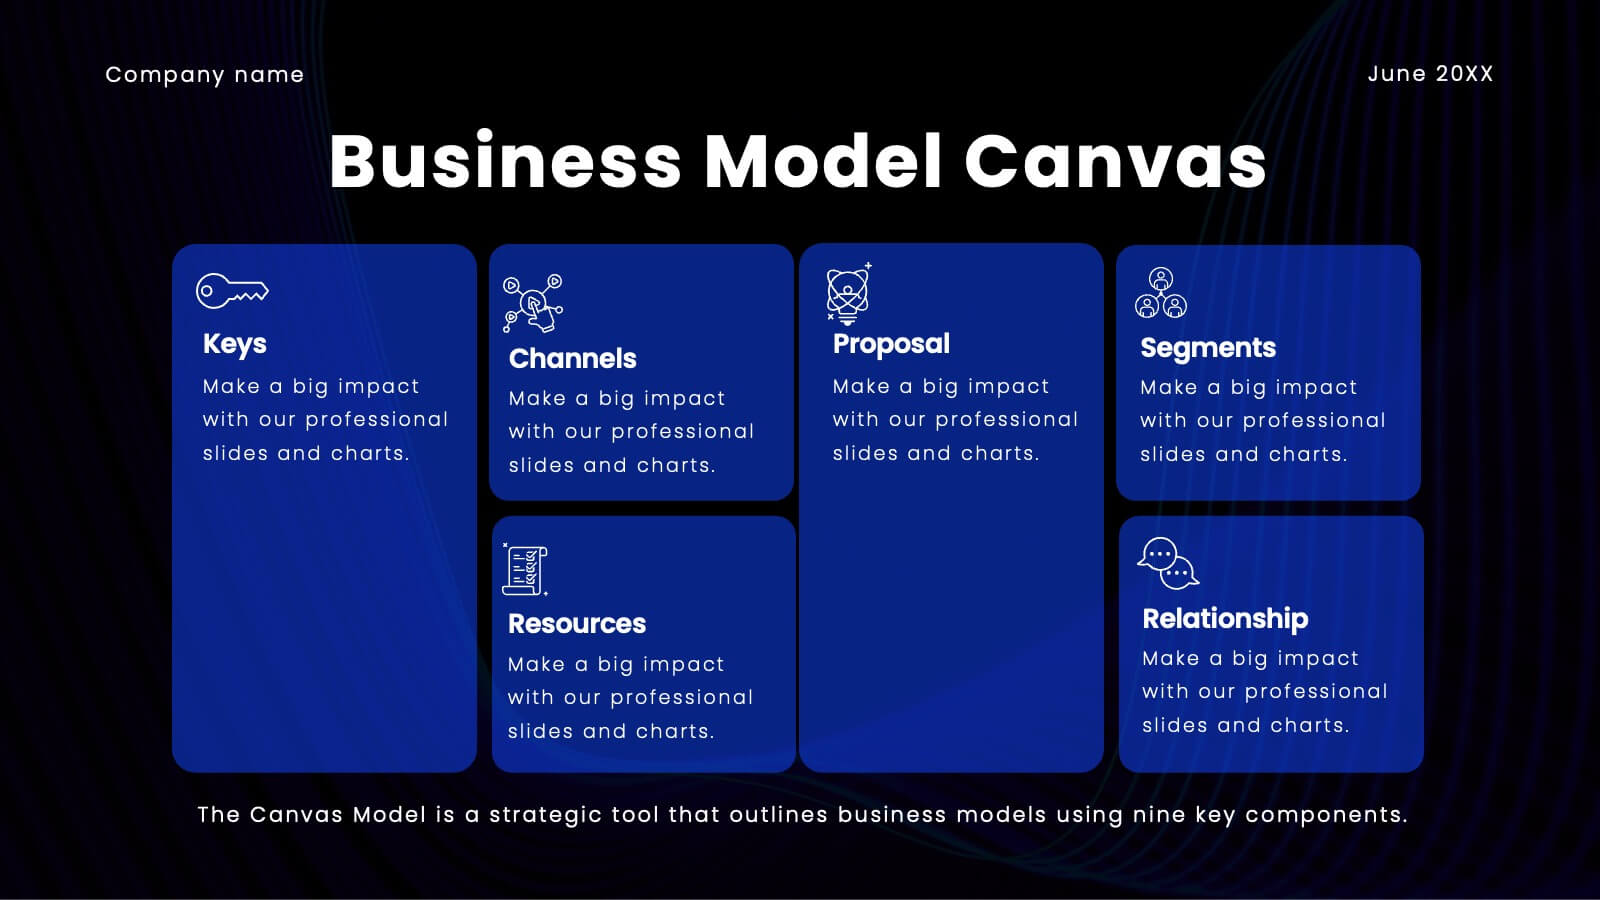
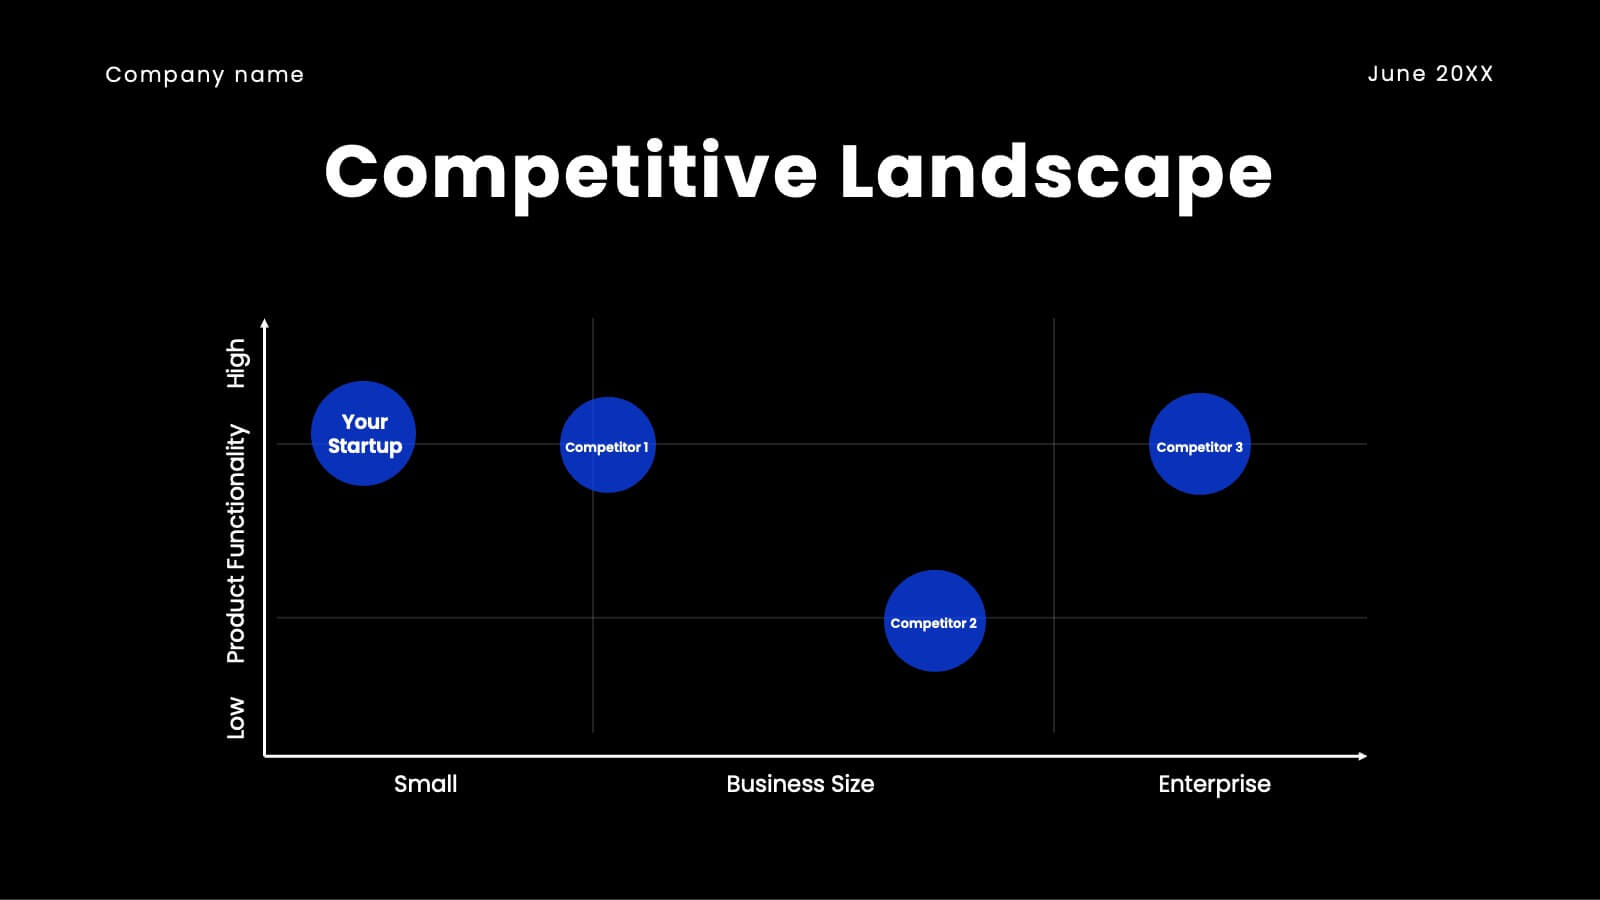
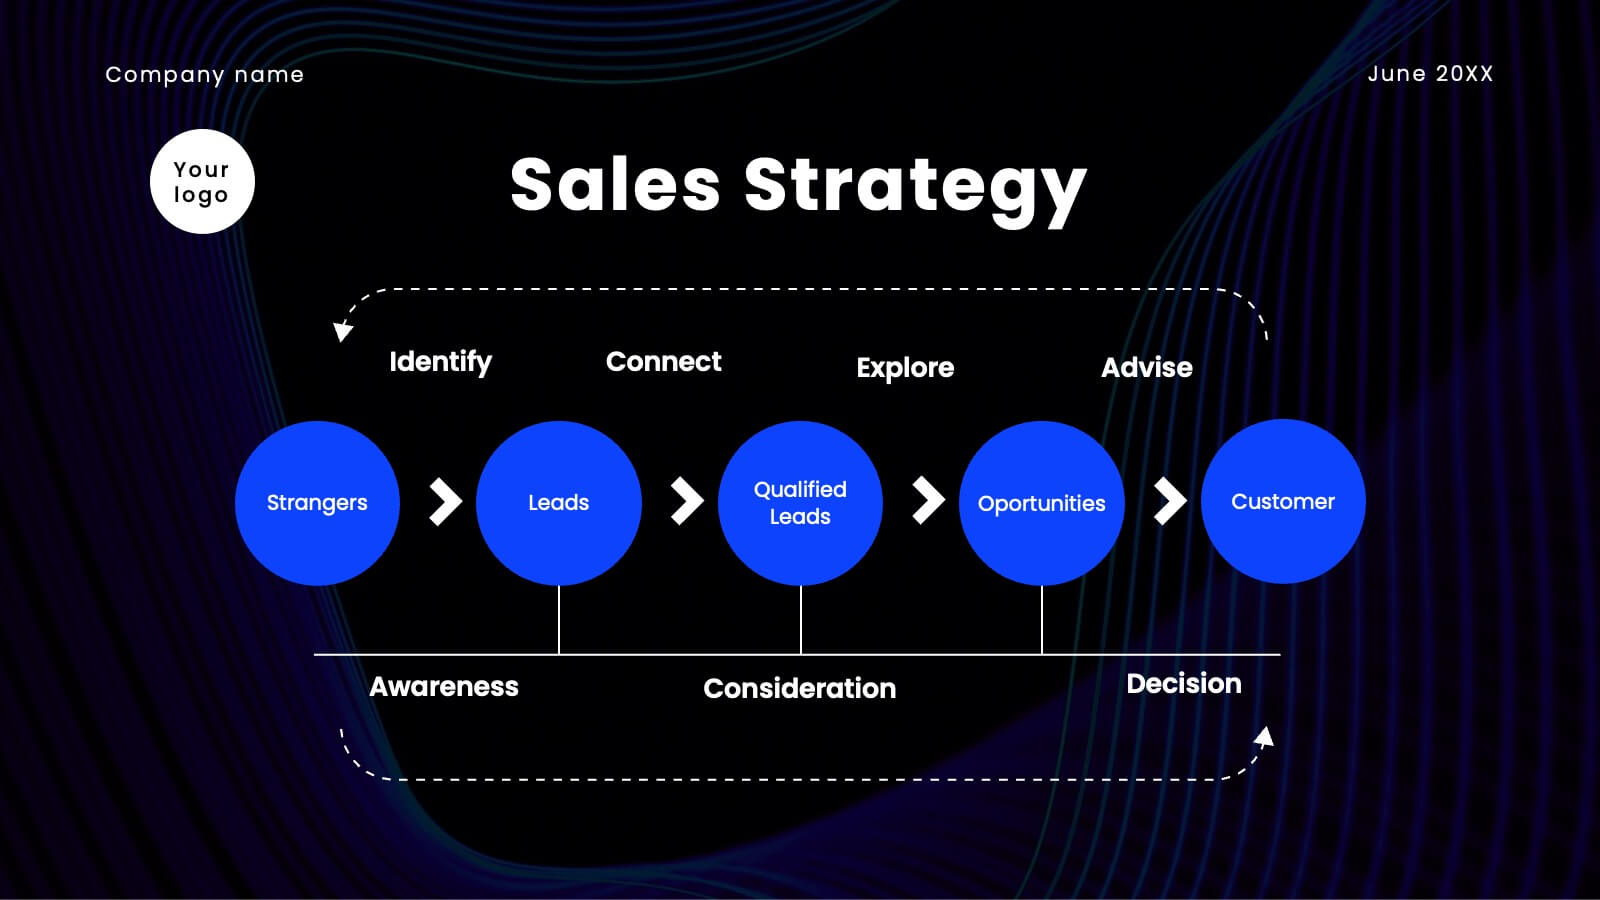
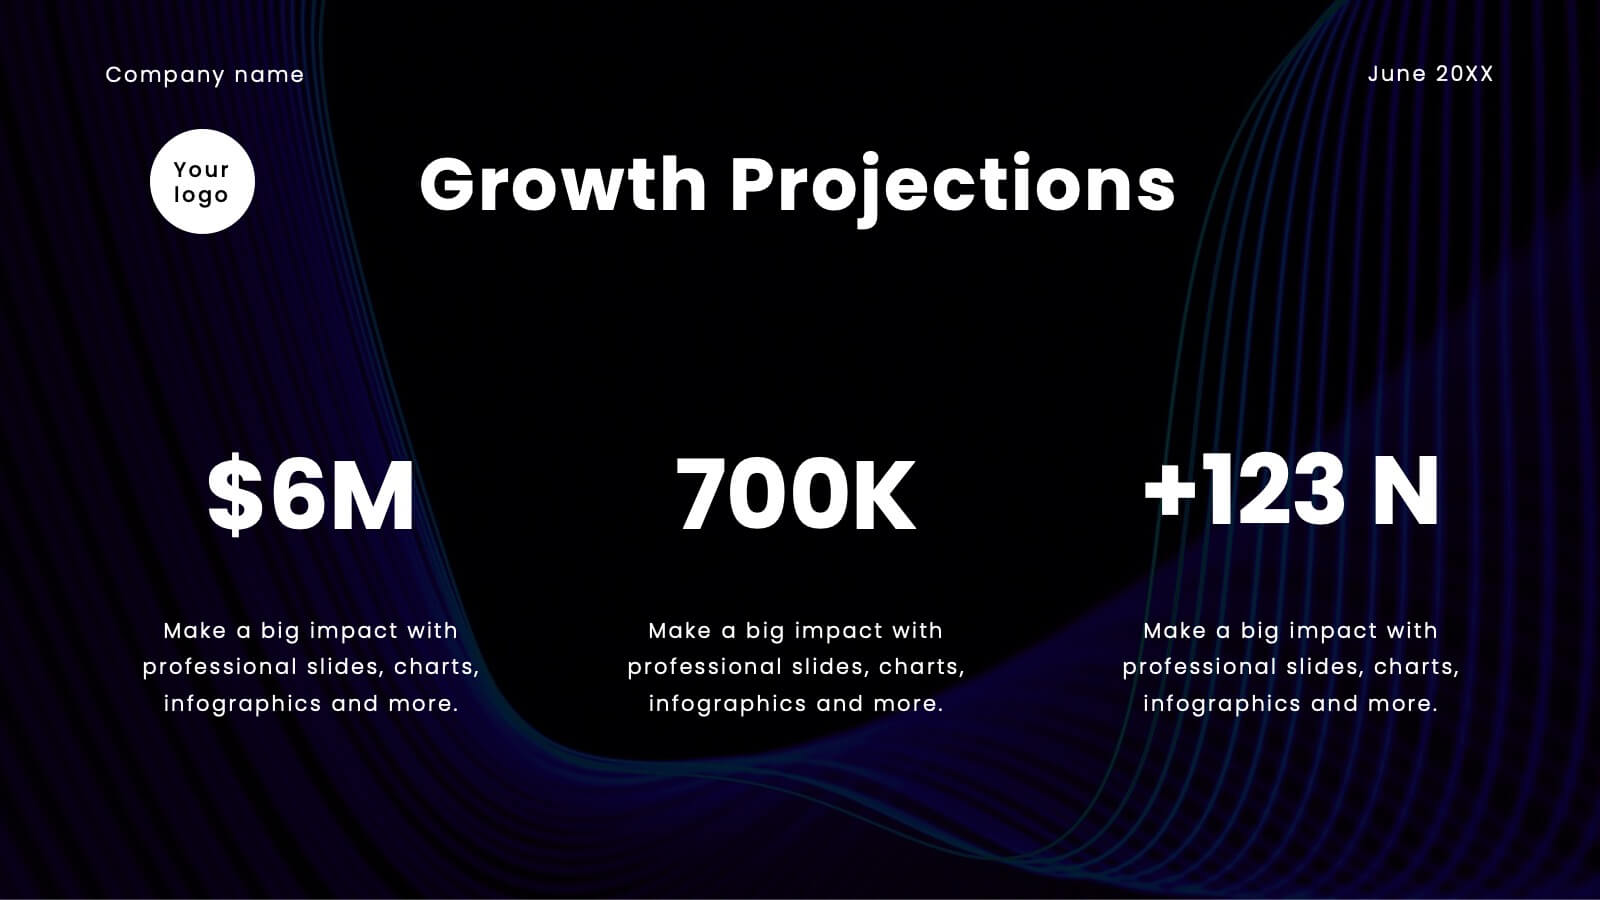
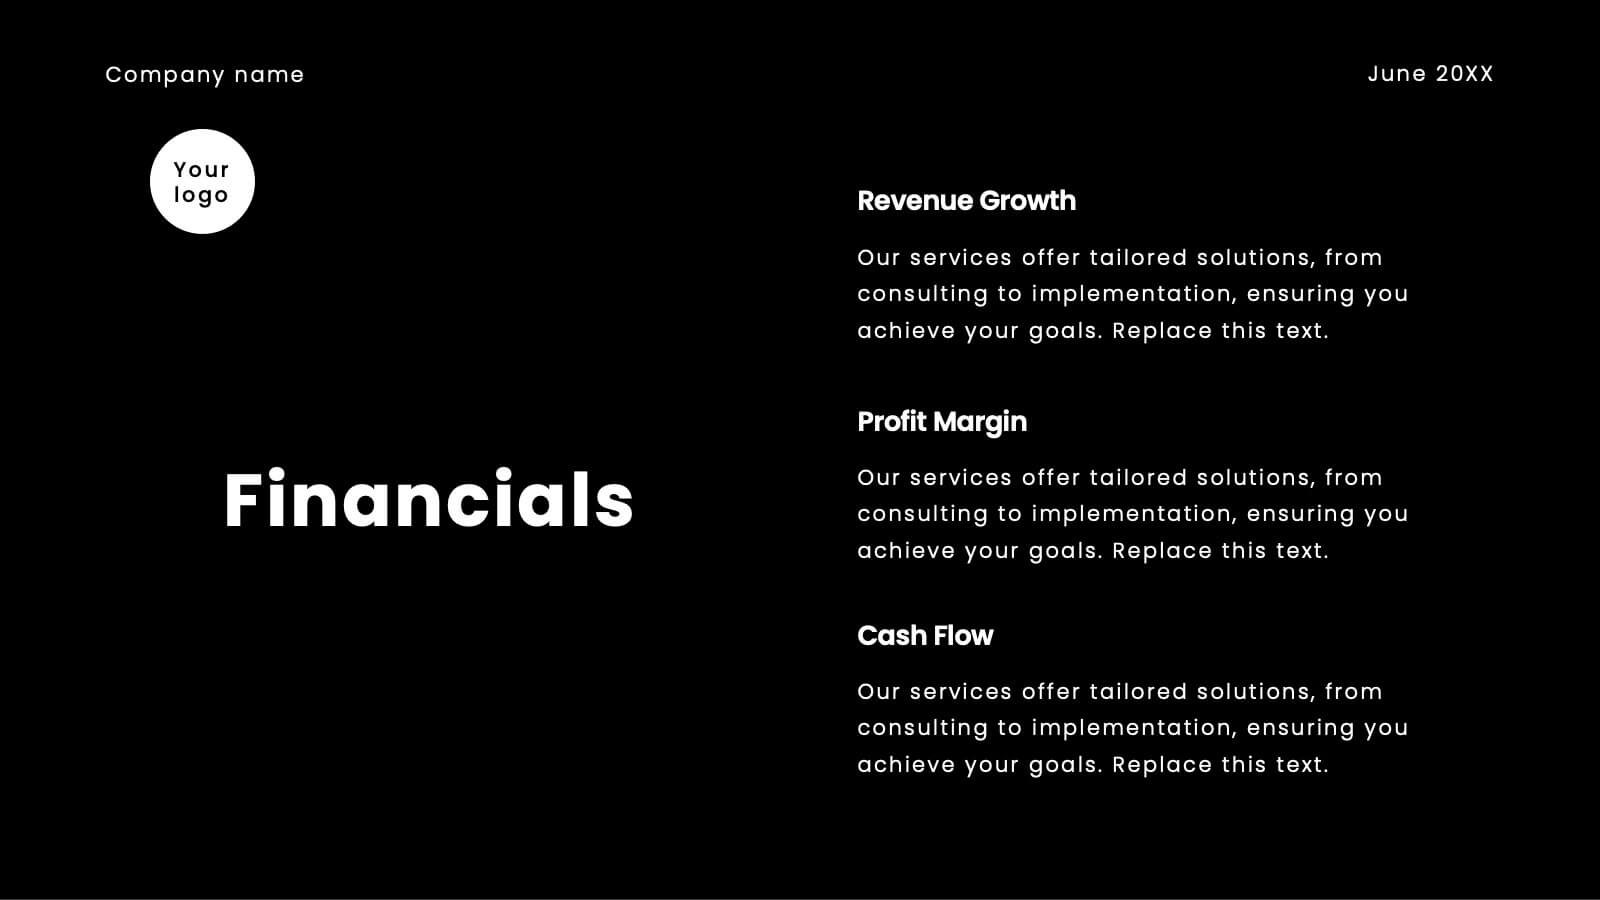
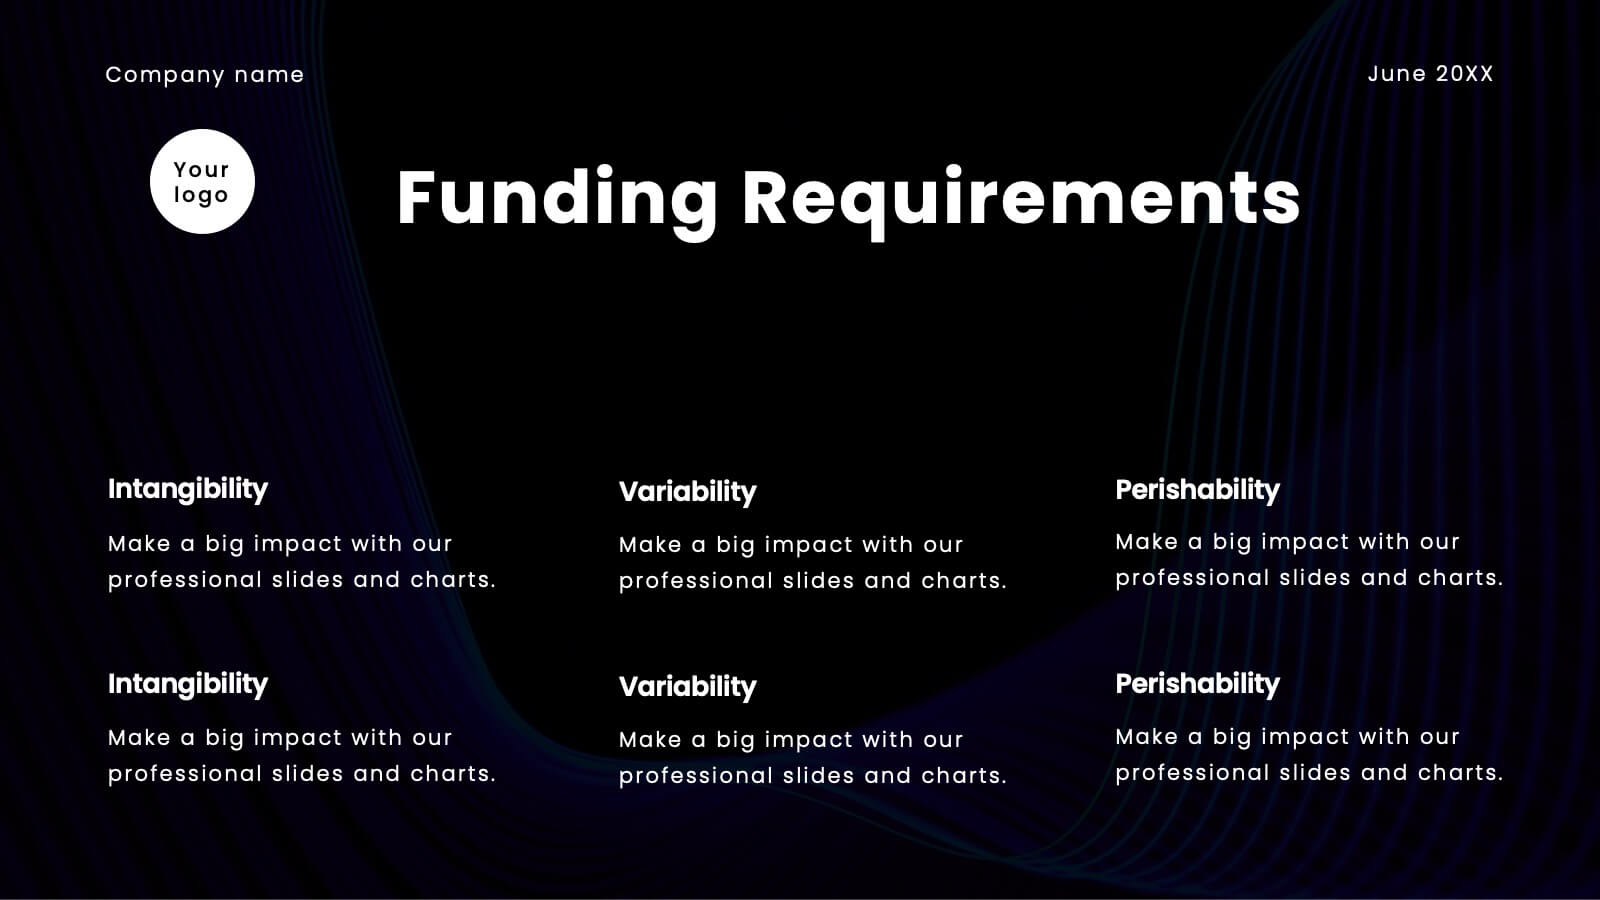
Jolt Business Idea Pitch Deck Presentation
Prepare to electrify your audience with a pitch deck that’s nothing short of spectacular! This high-impact template is designed to captivate, engage, and persuade your stakeholders with every slide. It’s more than just a presentation; it’s your gateway to showcasing your company’s unique value proposition, innovative solutions, and future growth potential in a way that’s visually stunning and incredibly compelling. From the moment you unveil your company overview to the final slide on financials and funding requirements, this template ensures your pitch is memorable, powerful, and impossible to ignore. The sleek, modern design highlights your strategic vision, competitive advantages, and market opportunities, making a bold statement that you’re ready to lead the future. Compatible with PowerPoint, Keynote, and Google Slides, this pitch deck template is your ultimate tool for turning heads and securing buy-in from investors, partners, and clients alike!


6 diapositivas
Strategic Business Case Study
Present detailed business case analyses with this layered castle-style layout, ideal for step-by-step storytelling. Each section visually represents a different stage or insight, helping you build a clear and convincing narrative. Fully editable and compatible with PowerPoint, Keynote, and Google Slides.


6 diapositivas
Demographic Transition Infographics
Embark on a journey through the fascinating concept of demographic transition! This infographic opens the door to understanding how societies evolve over time in terms of population growth and age structure. From the early stages of high birth and death rates to the advanced stages of low birth and death rates, we unveil the intricate phases of demographic transition that shape our world. Discover the profound impacts of demographic transition on societies and economies. Learn how changes in population structure affect labor markets, healthcare systems, and social welfare. Understand the opportunities for economic growth and development that can arise from a favorable demographic transition. With this engaging infographic, compatible with PowerPoint, Keynote, and Google Slides, sharing your understanding of demographic transition has never been more accessible. Empower yourself with the knowledge to comprehend and discuss this vital aspect of our world's development. Dive into the complexities of demographic transition and embark on a journey of exploration and enlightenment.


7 diapositivas
Pillar Infographics Presentation Template
Our Pillar Infographic will present your information in a hierarchical format, with a main "pillar" section at the center and supporting information or sections branching out from it like pillars or columns. This template is designed to provide a simple overview of your topic, while also allowing for more in-depth exploration of specific aspects. The central pillar featured may be used to contain a brief summary or key message, while the surrounding columns or sections may provide more detailed information, data, or visualizations. Grow your audience and increase sales with this template!


7 diapositivas
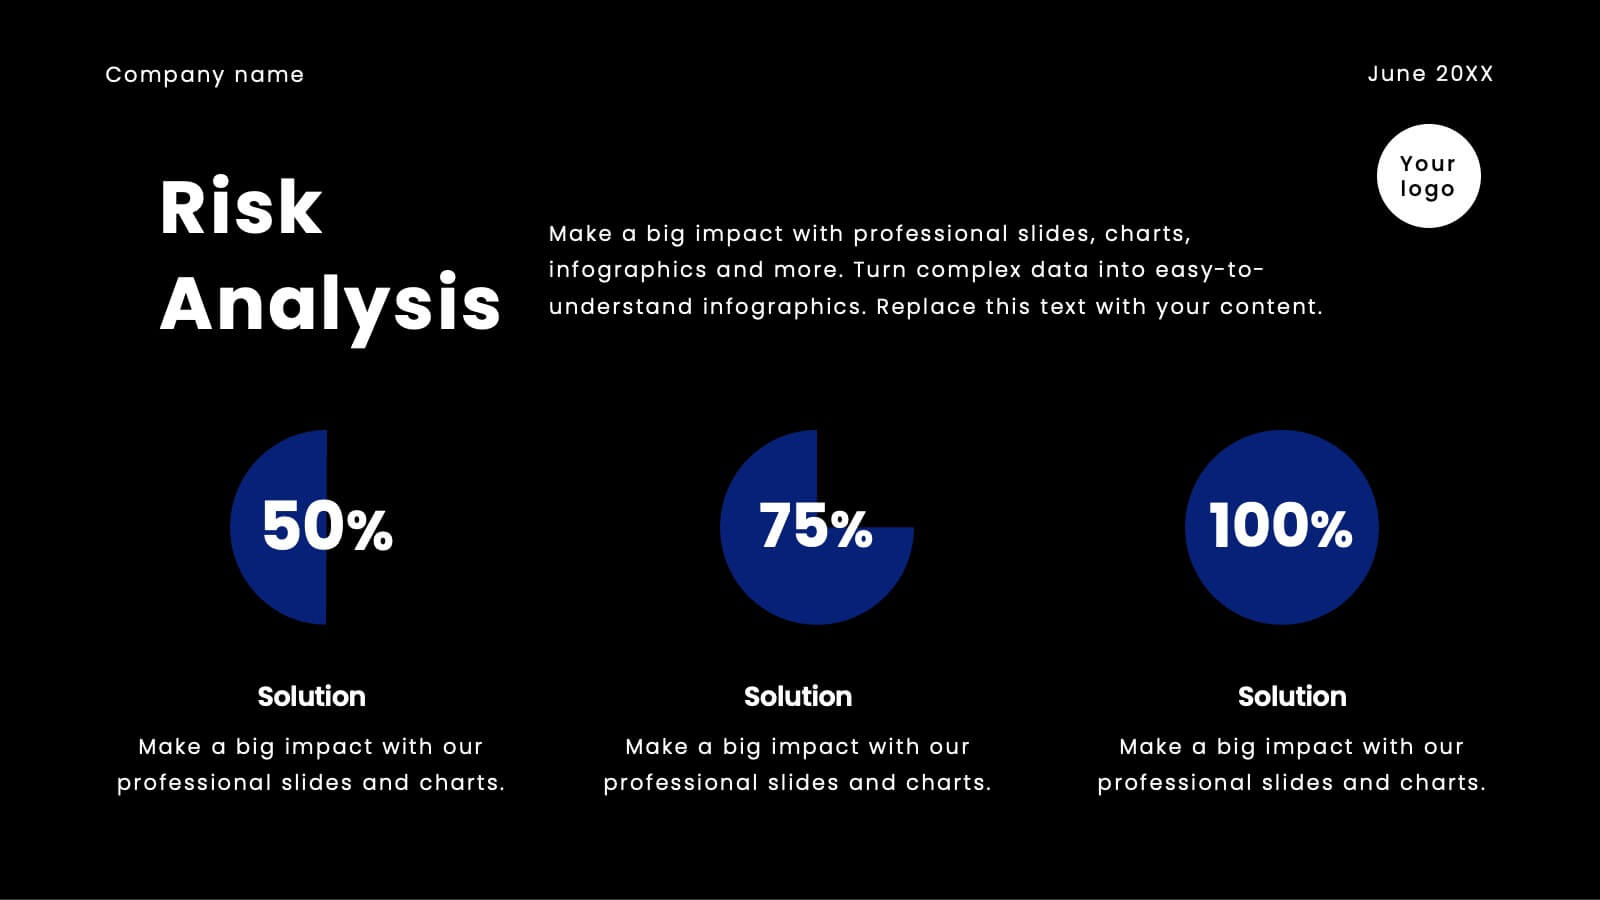
Operational Risk Management Infographic
Dive into the methodical domain of risk management with our sleek risk management infographic. Cloaked in varying blue tones, our template embodies the serenity and stability that effective risk management brings to operations. Enhanced with precise infographics, clear icons, and relevant image placeholders, it transforms complex risk analysis into easily comprehensible visual insights. Flawlessly crafted for Powerpoint, Keynote, or Google Slides. A pivotal tool for business strategists, operations managers, financial analysts, or any organization aiming to fortify its operational resilience. Strategize with clarity; let every slide be a shield against potential pitfalls.


7 diapositivas
Time Management Importance Infographic
Time management is a crucial skill that involves organizing and prioritizing tasks, activities, and responsibilities to make the most effective use of your time. Creating an infographic about the importance of time management is a valuable tool for conveying this critical skill visually and succinctly, let our template guide you. Customize the content, design, and visuals to create an engaging and informative infographic that effectively communicates the importance of time management. This presentation will inspire your audience to seize the day and make the most of their time!


12 diapositivas
Leadership Development and Growth
Highlight leadership skills with this dynamic radar chart template, ideal for tracking individual or team competencies across six core areas. Use this layout to visualize progress in communication, strategy, vision, influence, adaptability, and accountability. Great for HR reviews, training evaluations, or performance dashboards. Fully editable in PowerPoint, Keynote, and Google Slides.


5 diapositivas
The Future of Food Waste Infographics
Food Waste refers to the loss or disposal of food that is still edible or could have been consumed. These infographic template are designed with the aim of raising awareness, inspiring change, and empowering individuals and organizations to take action towards a more sustainable food system. These infographics are perfect for anyone interested in understanding the future trajectory of food waste and exploring potential solutions. With these infographic templates, create a presentation that inspires action and foster a collective commitment to combating food waste for a more sustainable future.


7 diapositivas
Relationship Infographics Presentation Template
Featuring our Relationship Infographic template, this provides the entire process of relationship building in its true form. This infographic will take you through the stages of building a relationship. This design is good for any purpose and can be used as a template for many presentations. Use this template to illustrate your ideas, put forward an argument, or make statistics and facts catchy. In this template, you’ll find everything you need to create a gorgeous relationship infographic. This is the perfect way to share your story and create an emotional connection with your audience.


4 diapositivas
Business Operations Office Theme Presentation
Make your workflow feel effortless with this sleek, illustrated office layout designed to simplify complex business operations. Ideal for presenting processes, responsibilities, or resource planning, the clean visuals and structured format help communicate your message clearly. Fully editable and compatible with PowerPoint, Keynote, and Google Slides for seamless customization.


5 diapositivas
Visual Differentiator Comparison Slide Presentation
Make your unique selling points stand out with the Visual Differentiator Comparison Slide Presentation. This slide is designed to highlight key advantages between two offerings or brands using side-by-side stacked bars and icons. Emphasize what sets you apart at a glance. Fully editable in Canva, PowerPoint, and Google Slides.


6 diapositivas
5-Step SEO Marketing Funnel Presentation
Ignite your marketing story with a bold, flowing visual that makes every step feel purposeful and easy to follow. This presentation breaks down each stage of the SEO funnel, helping you explain strategy, performance, and conversion paths with clarity. Fully compatible with PowerPoint, Keynote, and Google Slides.


4 diapositivas
Sustainable Farming Practices Presentation
Explore the essentials of sustainable farming with our visually engaging presentation template. Perfect for educational and advocacy purposes, it outlines key practices that promote environmental sustainability in agriculture. This template features easy-to-understand graphics and placeholders for comprehensive discussions on eco-friendly farming techniques.


8 diapositivas
Target Audience Segmentation Strategy Presentation
Refine your marketing approach with the Target Audience Segmentation Strategy presentation. This professionally designed slide helps you identify, analyze, and visualize key audience segments to enhance your outreach. Perfect for marketers, business strategists, and data analysts, this editable template ensures a clear, data-driven approach to customer targeting. Compatible with PowerPoint, Keynote, and Google Slides.


5 diapositivas
Asia Geographic and Business Analysis Map Presentation
Gain a strategic edge with the Asia Geographic and Business Analysis Map template, designed to visualize market trends and demographic data across the region. Ideal for businesses, investors, and academics, it supports PowerPoint, Keynote and Google Slides. This adaptable template is perfect for presenting geographic data analyses and exploring regional business potentials.


5 diapositivas
Business Insights Through Dashboard Visualization Presentation
Visualize key metrics with this Business Insights Through Dashboard Visualization presentation. The funnel chart layout is ideal for showcasing conversion rates, customer journeys, or sales processes. Each section includes clear labels and percentage indicators. Fully editable in Canva, PowerPoint, and Google Slides to suit your business reporting needs.