


Características


¿Tienes alguna pregunta?
Recomendar


3 diapositivas
Work from Home Setup and Productivity Plan Presentation
Ready to supercharge your productivity from your kitchen table to your couch office? This visual template helps you map out ideal remote work setups, task plans, and daily focus routines. Organize workspace essentials and time blocks in a clean, engaging format. Fully compatible with PowerPoint, Keynote, and Google Slides.


25 diapositivas
Jasper Rebranding Project Plan Presentation
Elevate your brand transformation with this sleek rebranding presentation template! It covers everything from mission and values to market analysis and brand positioning. Perfect for showcasing your brand guidelines and touchpoints. Fully customizable, and compatible with PowerPoint, Keynote, and Google Slides, making your rebranding process seamless and professional.
21 diapositivas
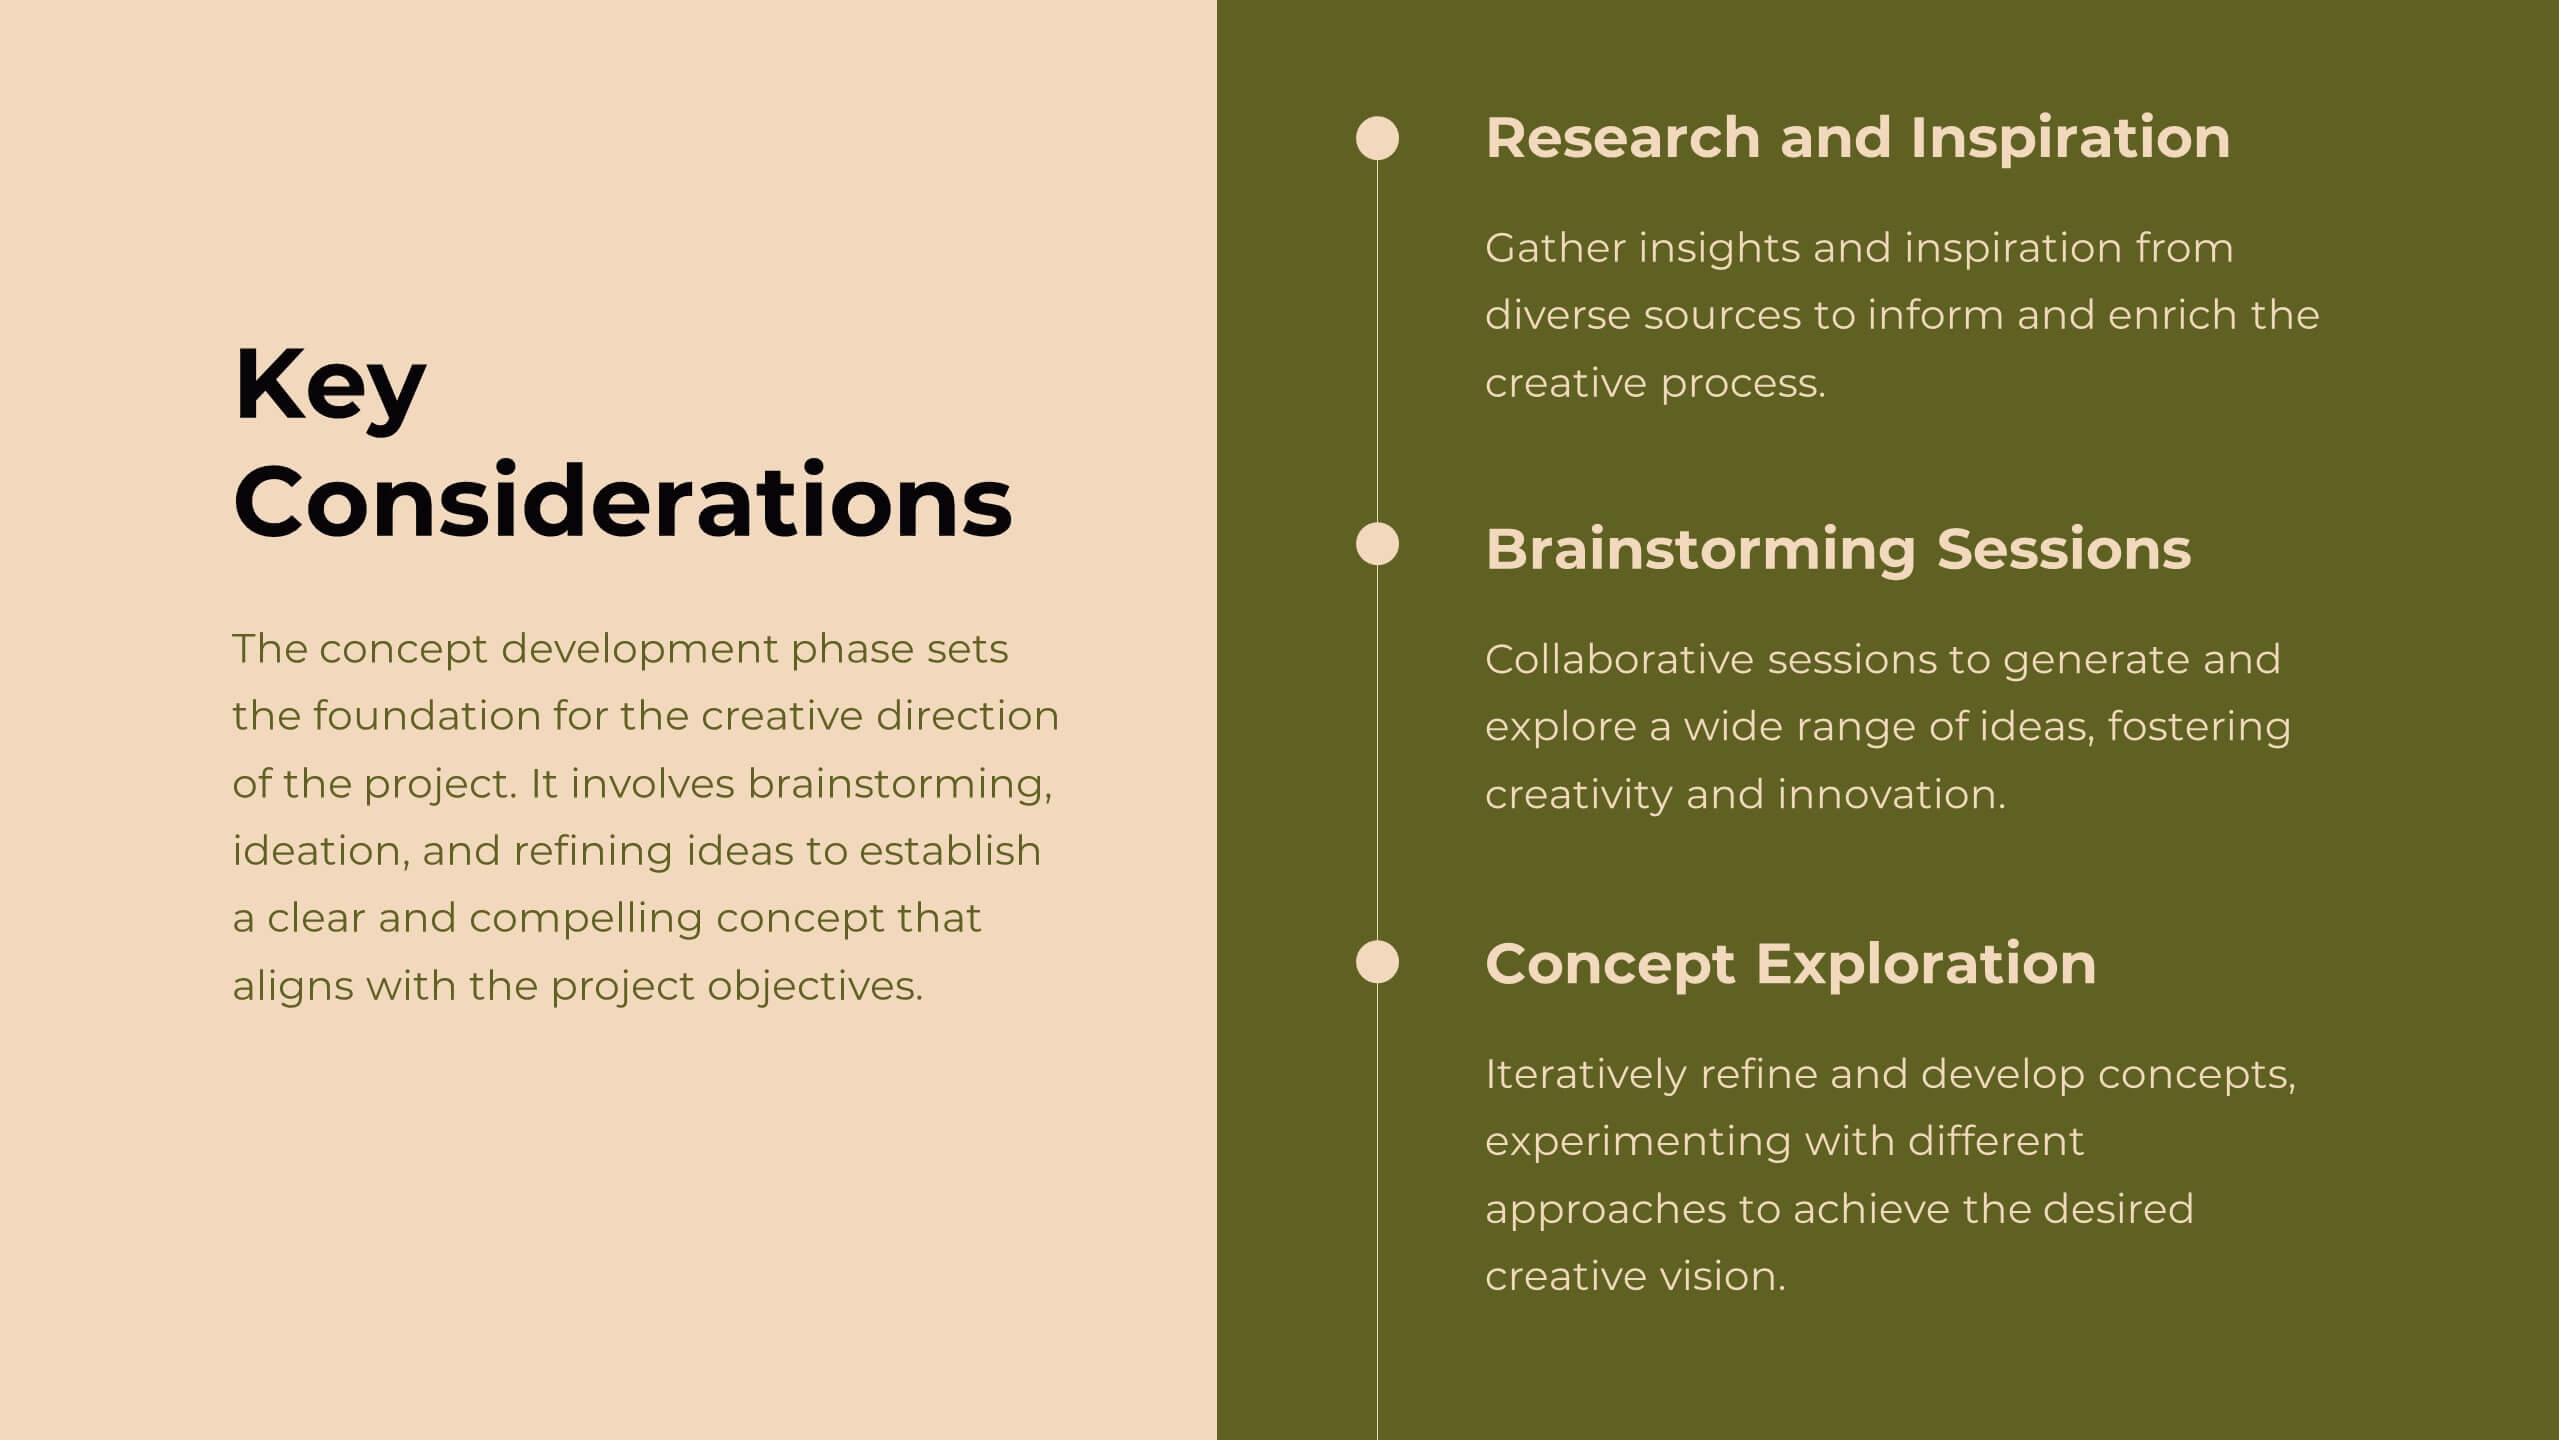
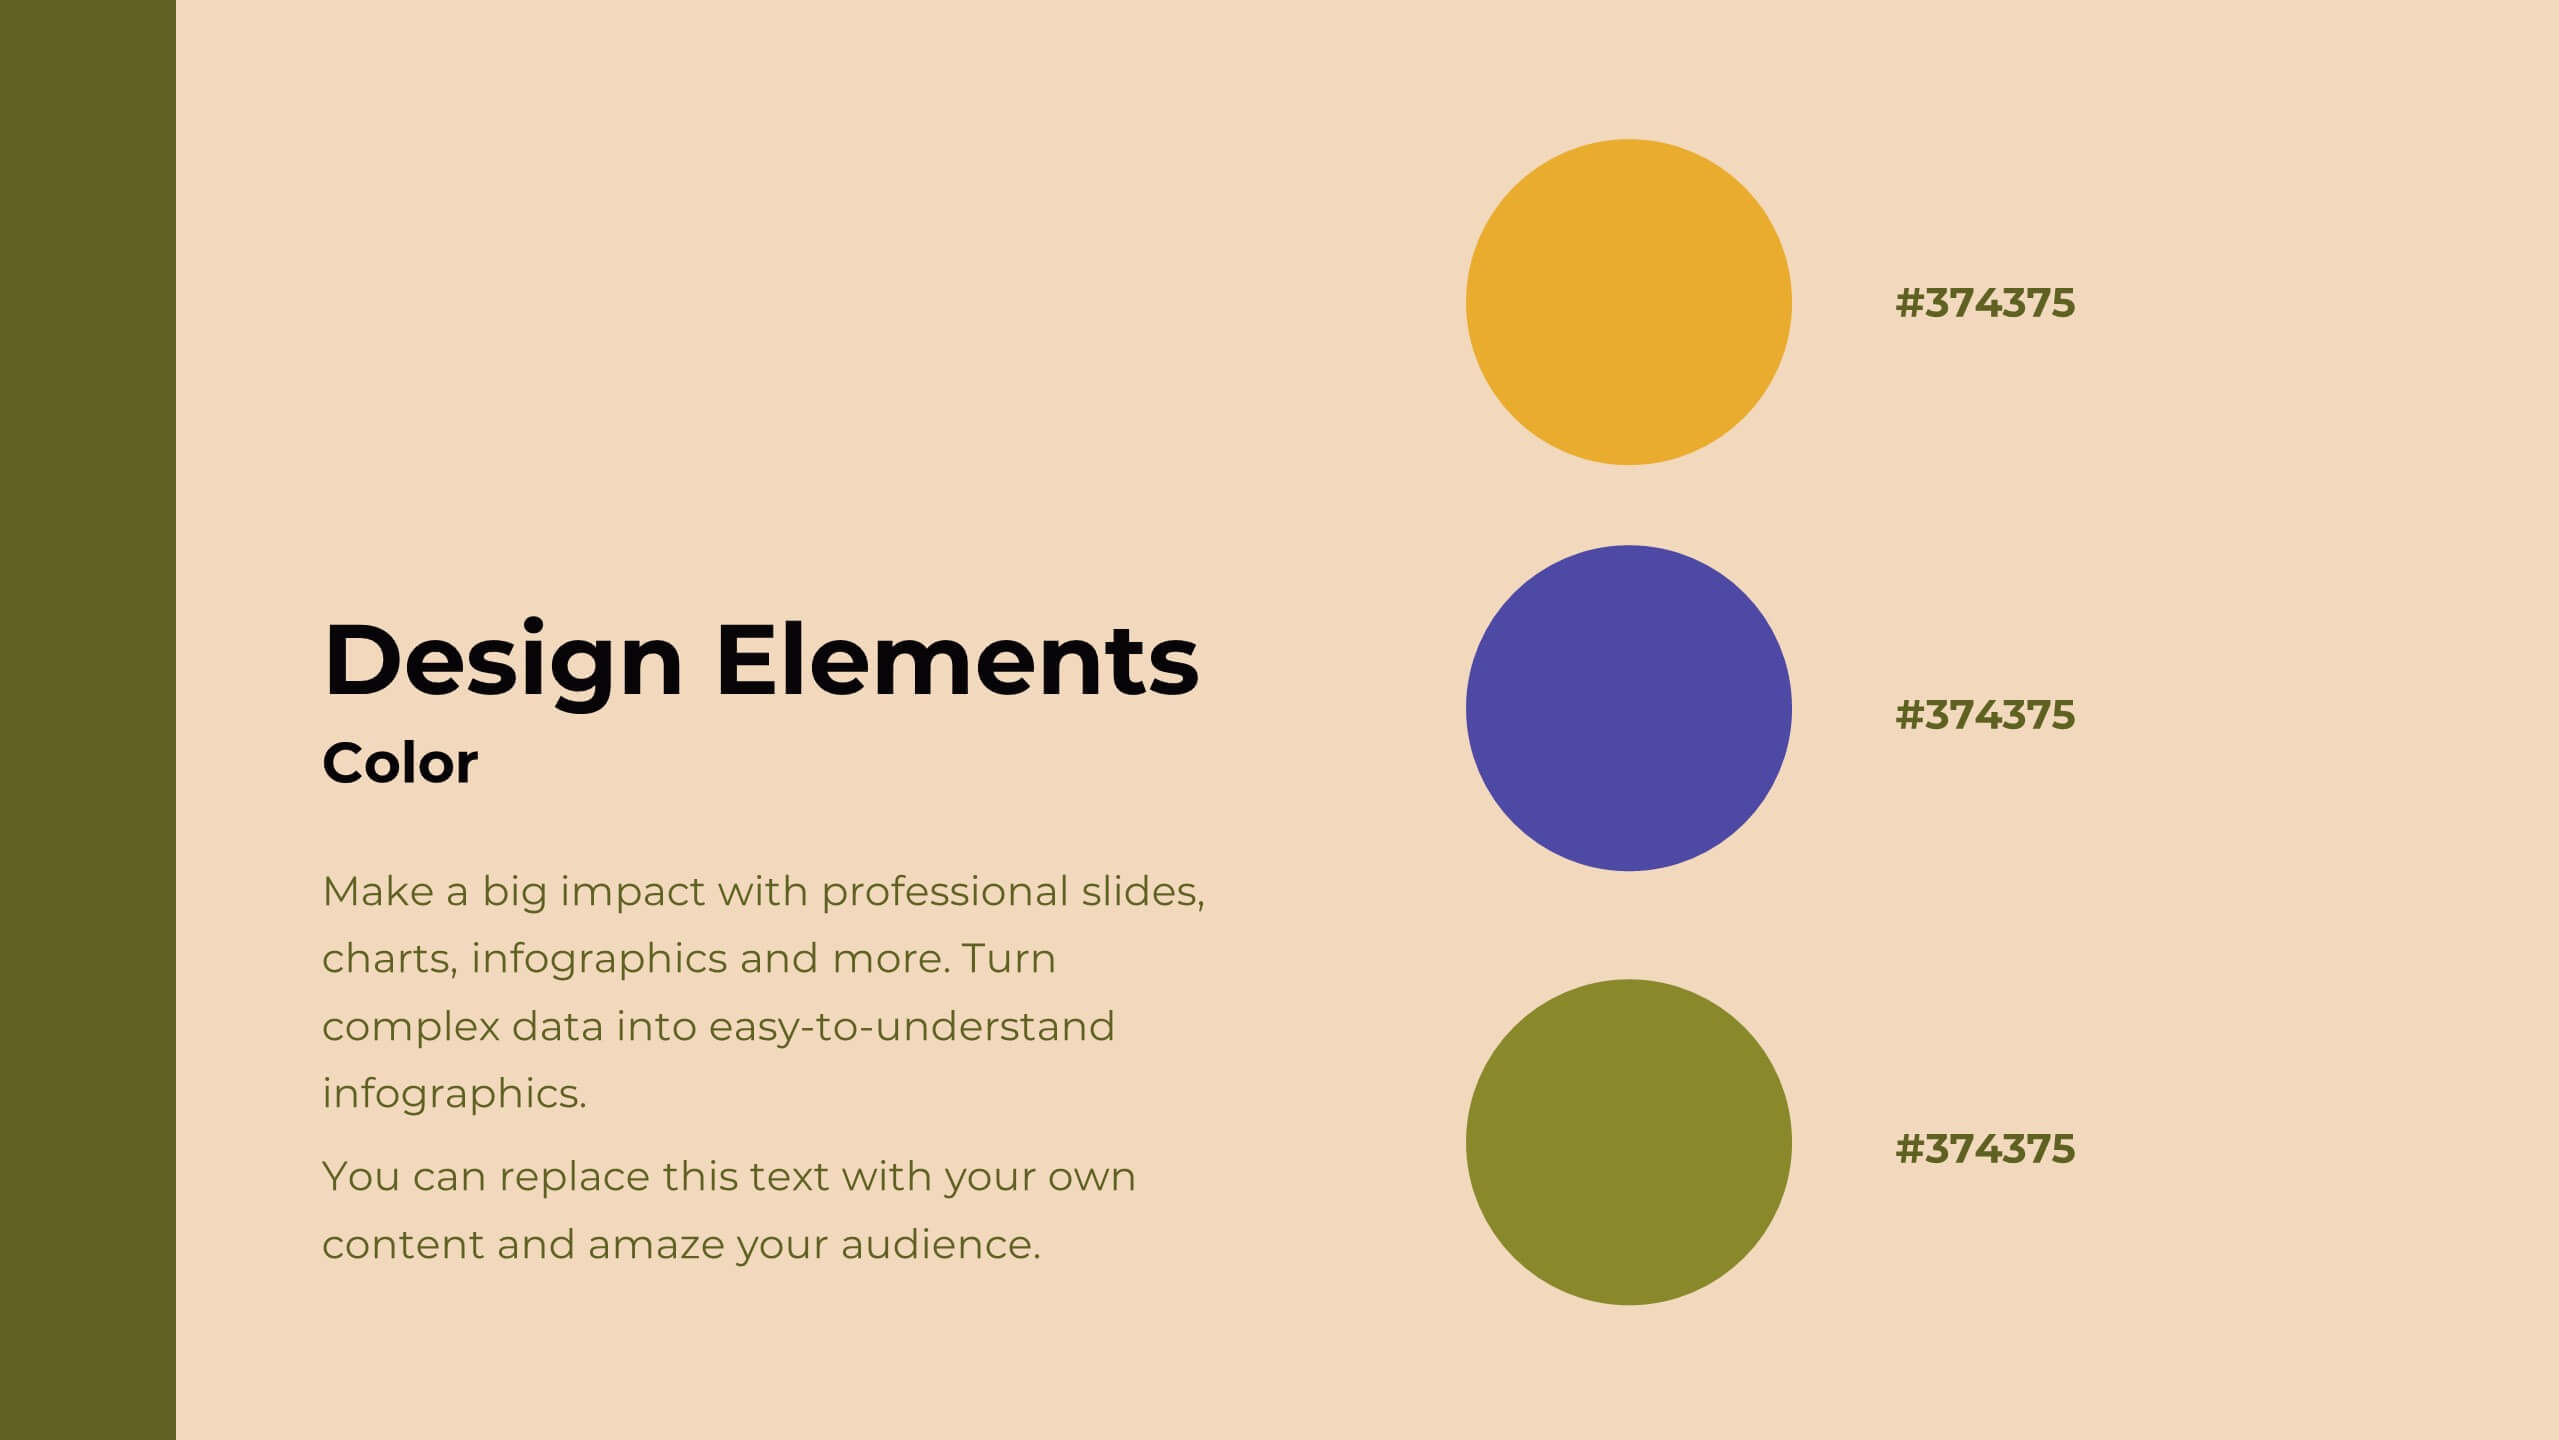
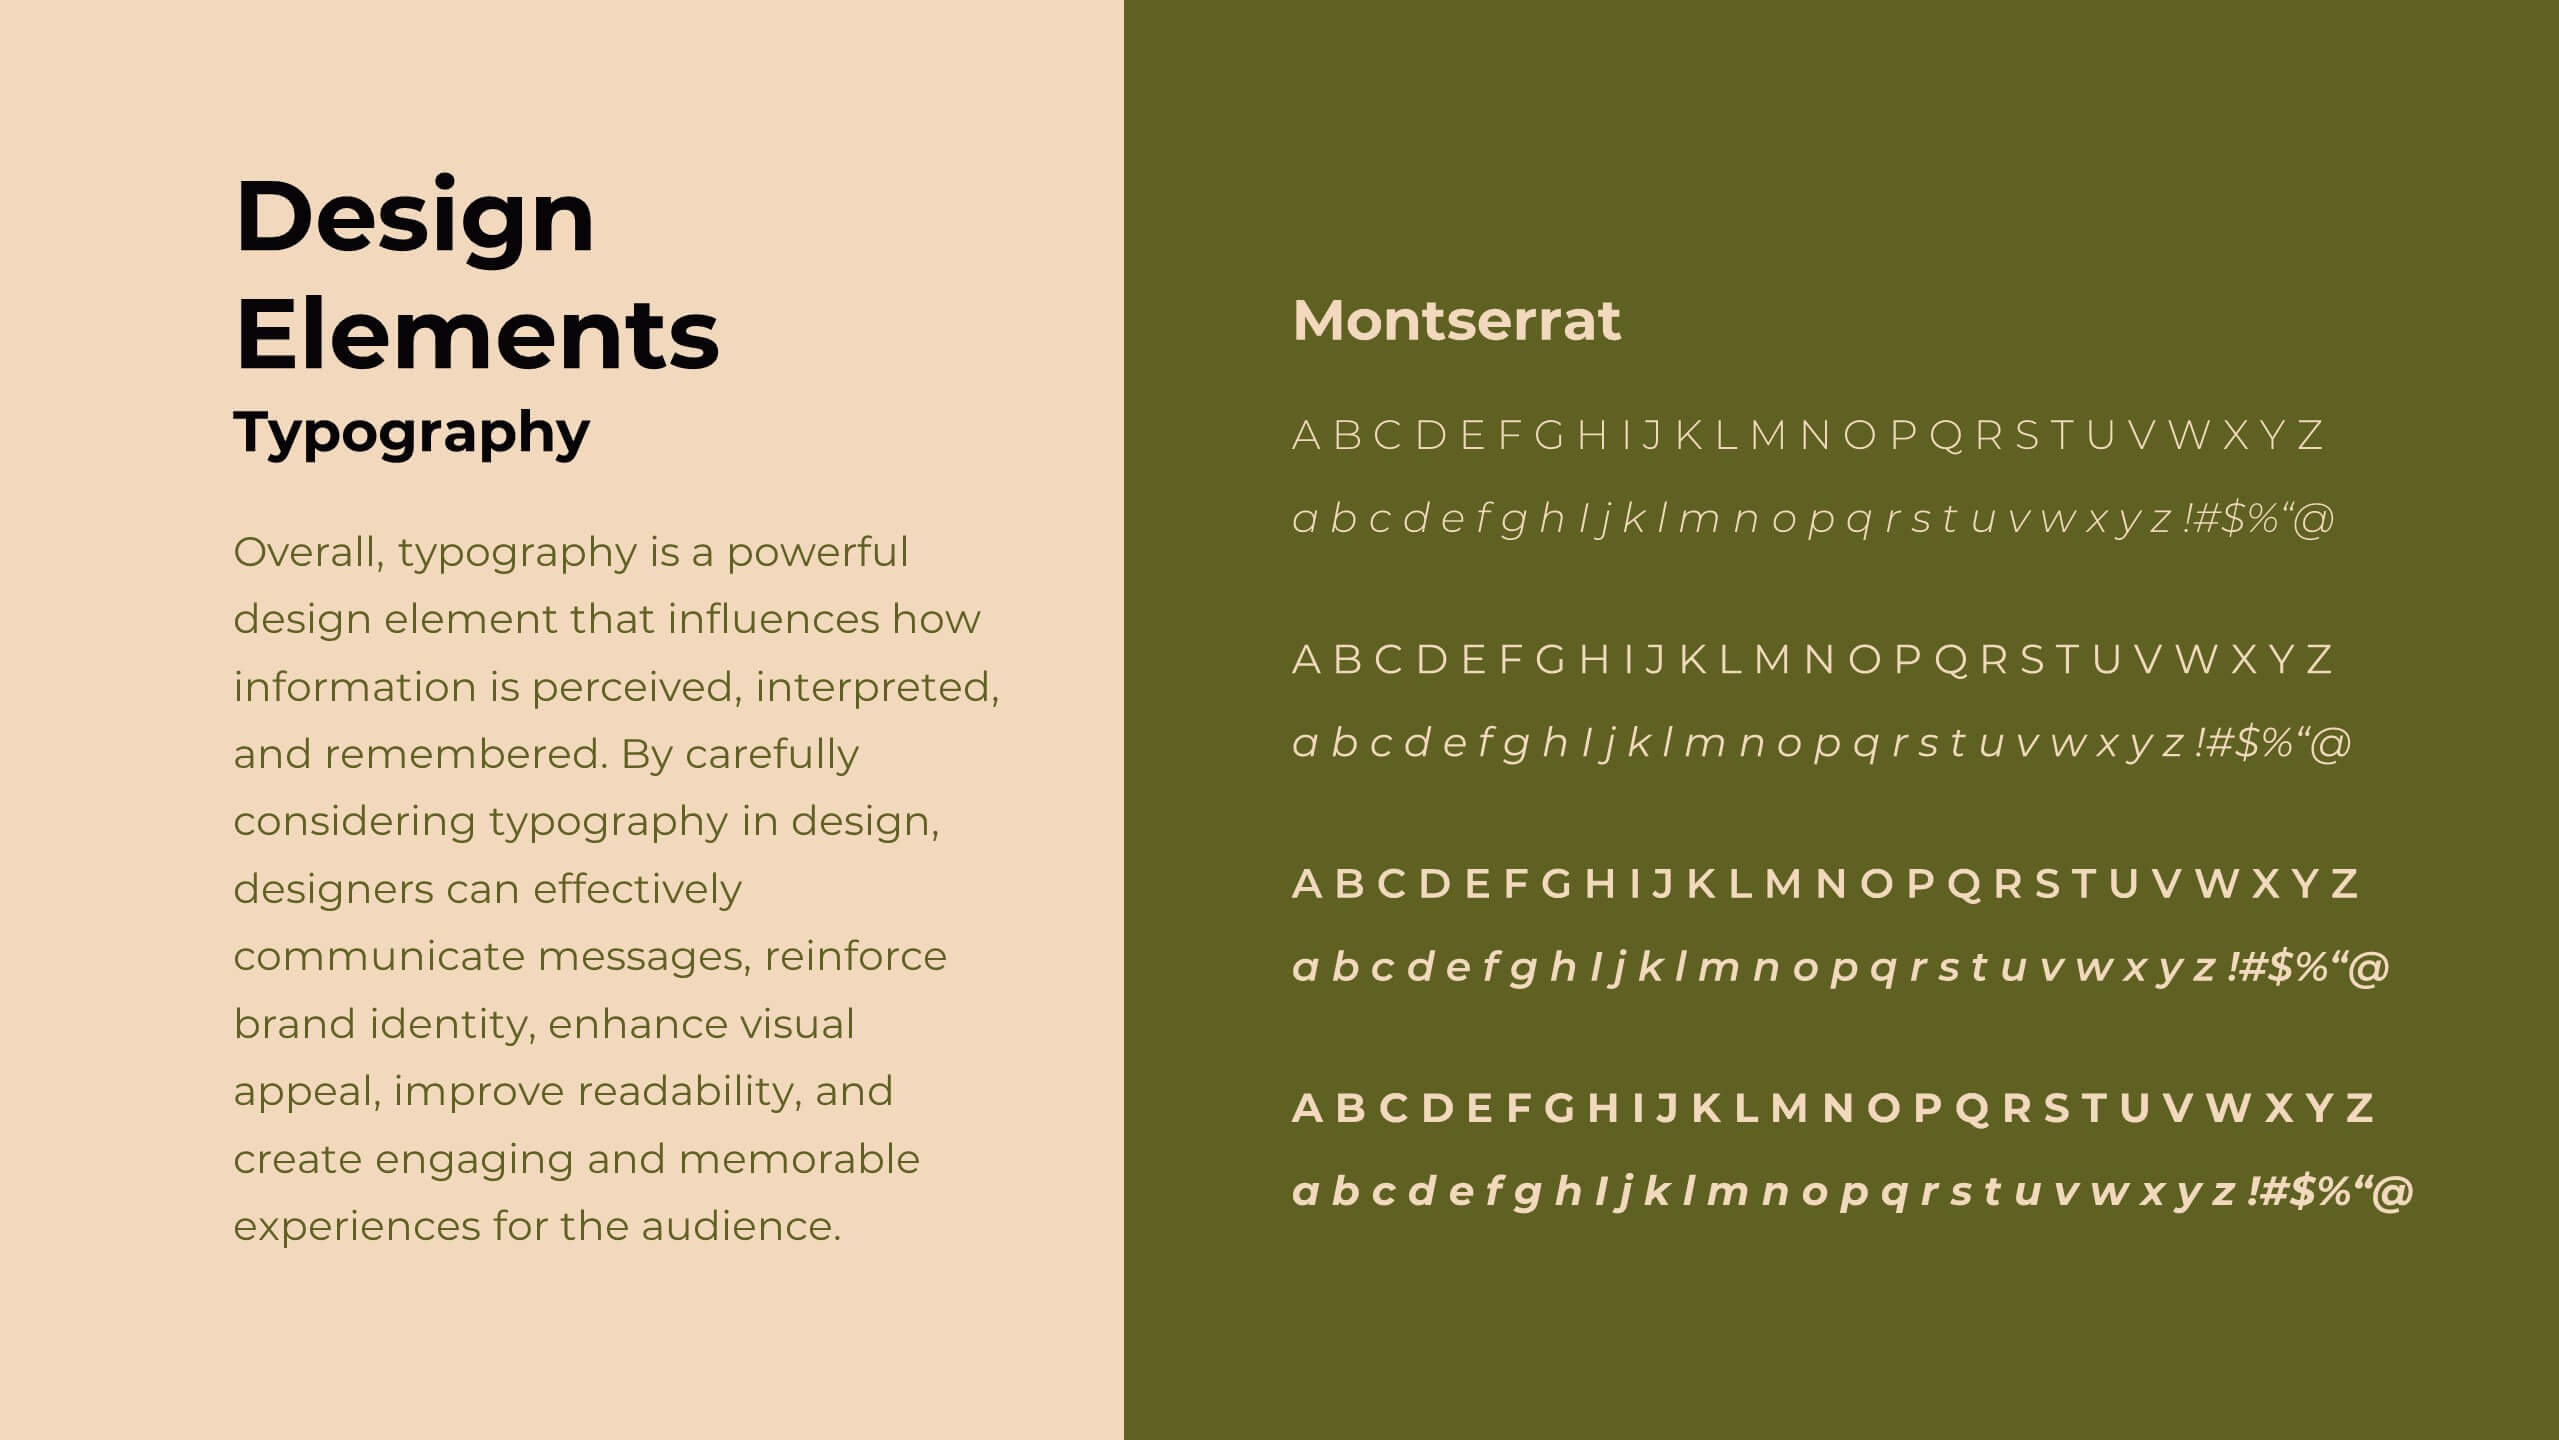
Delta Design Strategy Proposal Presentation
Transform your design strategy with this elegant proposal template! Perfect for presenting design briefs, target audience insights, and concept development. Ideal for designers and creative teams aiming to align vision and execution. Compatible with PowerPoint, Keynote, and Google Slides, this template ensures your design strategy is clear, professional, and compelling. Elevate your projects today!


4 diapositivas
Restaurant Menu Design Showcase Presentation
Showcase your food offerings with this stylish Restaurant Menu Design Template. Divided into clear sections—Menu, Drinks, and Desserts—it’s perfect for restaurants, cafés, or pop-up events. Fully editable in PowerPoint, Keynote, and Google Slides, this layout lets you present items cleanly with bold titles and organized structure for easy viewing.


7 diapositivas
Law Infographics Presentation Template
Featuring our Law Infographic template it is a modern and stylish template for making a presentation about law. It comes with a clean design, typography and plenty of space for annotations and is compatible with powerpoint. This template is suitable for a presentation about business, management, finance or marketing. It contains a one page design, illustrations and many different elements to help you build a strong and compelling presentation. Essential and easy to use, this law Infographic template is a great tool for anyone who wants to make an attractive and professional presentation.


4 diapositivas
Personal Finance and Money Management Presentation
Effectively present Personal Finance and Money Management insights with this clean and professional slide template. Designed with a minimalist stopwatch infographic, this template helps visualize key financial principles like budgeting, saving, and investing. Fully customizable with editable text, colors, and icons, it’s perfect for business reports, financial workshops, or personal finance presentations. Compatible with PowerPoint, Keynote, and Google Slides for seamless editing.


5 diapositivas
Target Audience Demographics
Present gender-based audience insights with this clean, dual-bar infographic slide. Ideal for showing comparative statistics between men and women across five demographic categories. Use this layout to support marketing analysis, campaign targeting, or consumer behavior reports. Editable in PowerPoint, Keynote, and Google Slides.


6 diapositivas
Tech Infrastructure Strategy Presentation
Build a smarter foundation for your tech-driven goals with a clear, layered design that showcases every stage of your technology roadmap. Perfect for presenting IT systems, cloud migration, or infrastructure planning, this presentation ensures clarity and impact. Fully compatible with PowerPoint, Keynote, and Google Slides for smooth customization.


7 diapositivas
5G Mobile infographic Presentation
5G technology is important because it has the potential to transform the way we live, work, and interact with the world around us. This template is designed to help you create an eye catching and informative infographic on the topic of 5G technology. With this template, you can easily showcase the benefits and capabilities of 5G in an easy to understand way. This template features a vibrant and clean design, with uniquely selected color schemes and fonts to ensure that the content is visually appealing. It includes a variety of slide layouts, including text slides, images, charts and graphs!


7 diapositivas
Decision Points Infographic
Decision points are specific moments or junctures within a process, project, or any situation where a decision needs to be made. This infographic template is designed to illuminate the path of choices, empowering you to make informed decisions and steer towards success. Compatible with Powerpoint, Keynote, and Google Slides. This infographic symbolizes the diverse options one encounters in their journey, and the importance of choosing wisely. The graphs and charts depicting the dilemmas encountered, emphasize the analytical process of weighing pros and cons to arrive at the best decision.


6 diapositivas
Demographic Transition Infographics
Embark on a journey through the fascinating concept of demographic transition! This infographic opens the door to understanding how societies evolve over time in terms of population growth and age structure. From the early stages of high birth and death rates to the advanced stages of low birth and death rates, we unveil the intricate phases of demographic transition that shape our world. Discover the profound impacts of demographic transition on societies and economies. Learn how changes in population structure affect labor markets, healthcare systems, and social welfare. Understand the opportunities for economic growth and development that can arise from a favorable demographic transition. With this engaging infographic, compatible with PowerPoint, Keynote, and Google Slides, sharing your understanding of demographic transition has never been more accessible. Empower yourself with the knowledge to comprehend and discuss this vital aspect of our world's development. Dive into the complexities of demographic transition and embark on a journey of exploration and enlightenment.


21 diapositivas
Logos Content Marketing Pitch Deck Presentation
The Marketing Presentation Template is designed for impactful business storytelling. With 20+ slides, it features sections for company history, core values, target audience, competitive analysis, growth plans, and testimonials. Ideal for agencies and brands, it's fully customizable and compatible with PowerPoint, Keynote, and Google Slides. Perfect for pitching ideas effectively!


6 diapositivas
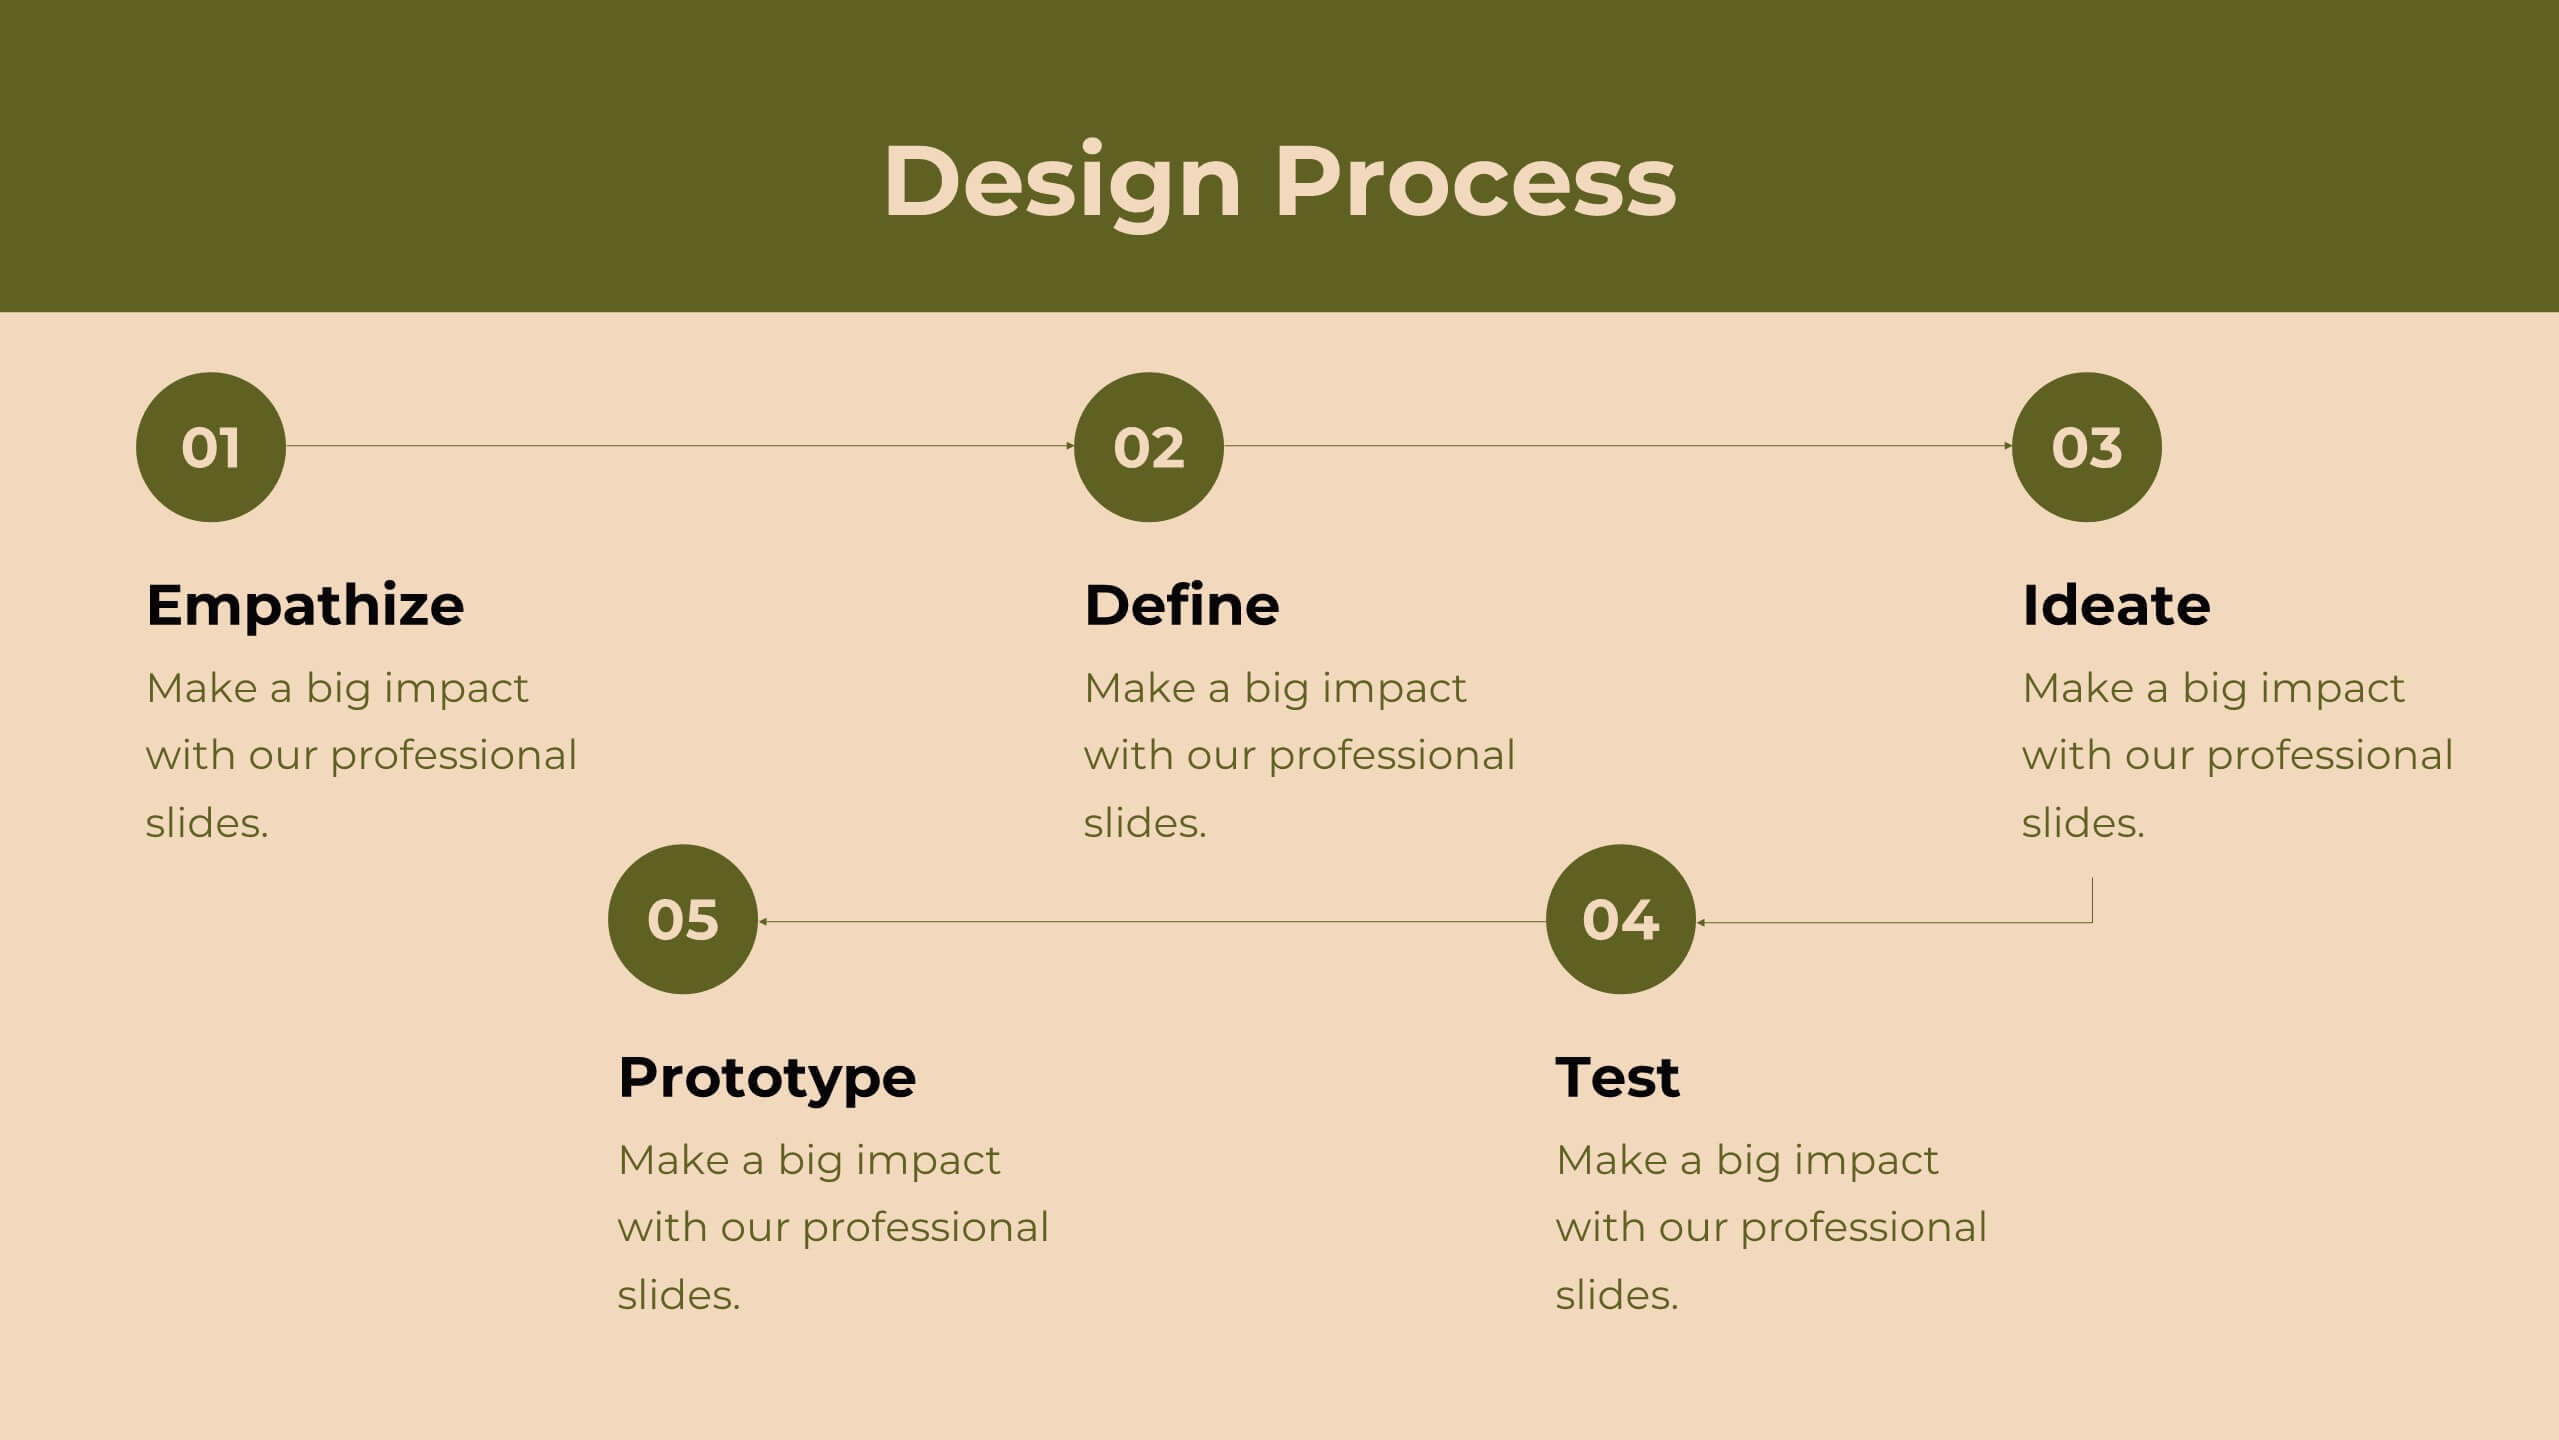
Organized Table of Content Layout Presentation
Introduce your presentation with structure and flow using this Organized Table of Content Layout. With six clearly numbered sections, connected through a dynamic flowchart design, this slide helps guide your audience through your key topics. Each section includes a title and space for a short description. This layout is ideal for reports, proposals, workshops, or strategy decks. Fully editable in PowerPoint, Keynote, and Google Slides.


5 diapositivas
Sustainable Fashion Infographics
Sustainable fashion, also known as eco-fashion or ethical fashion, is an approach to clothing and accessories that aims to minimize the negative environmental and social impacts of the fashion industry. These vertical templates are designed to raise awareness about sustainable practices in the fashion industry. They aim to educate viewers about the environmental and social impacts of fast fashion and highlight the importance of adopting sustainable fashion choices. The template incorporates relevant statistics and facts about the fashion industry's impact on the environment and society. Compatible with Powerpoint, Keynote, and Google Slides.


21 diapositivas
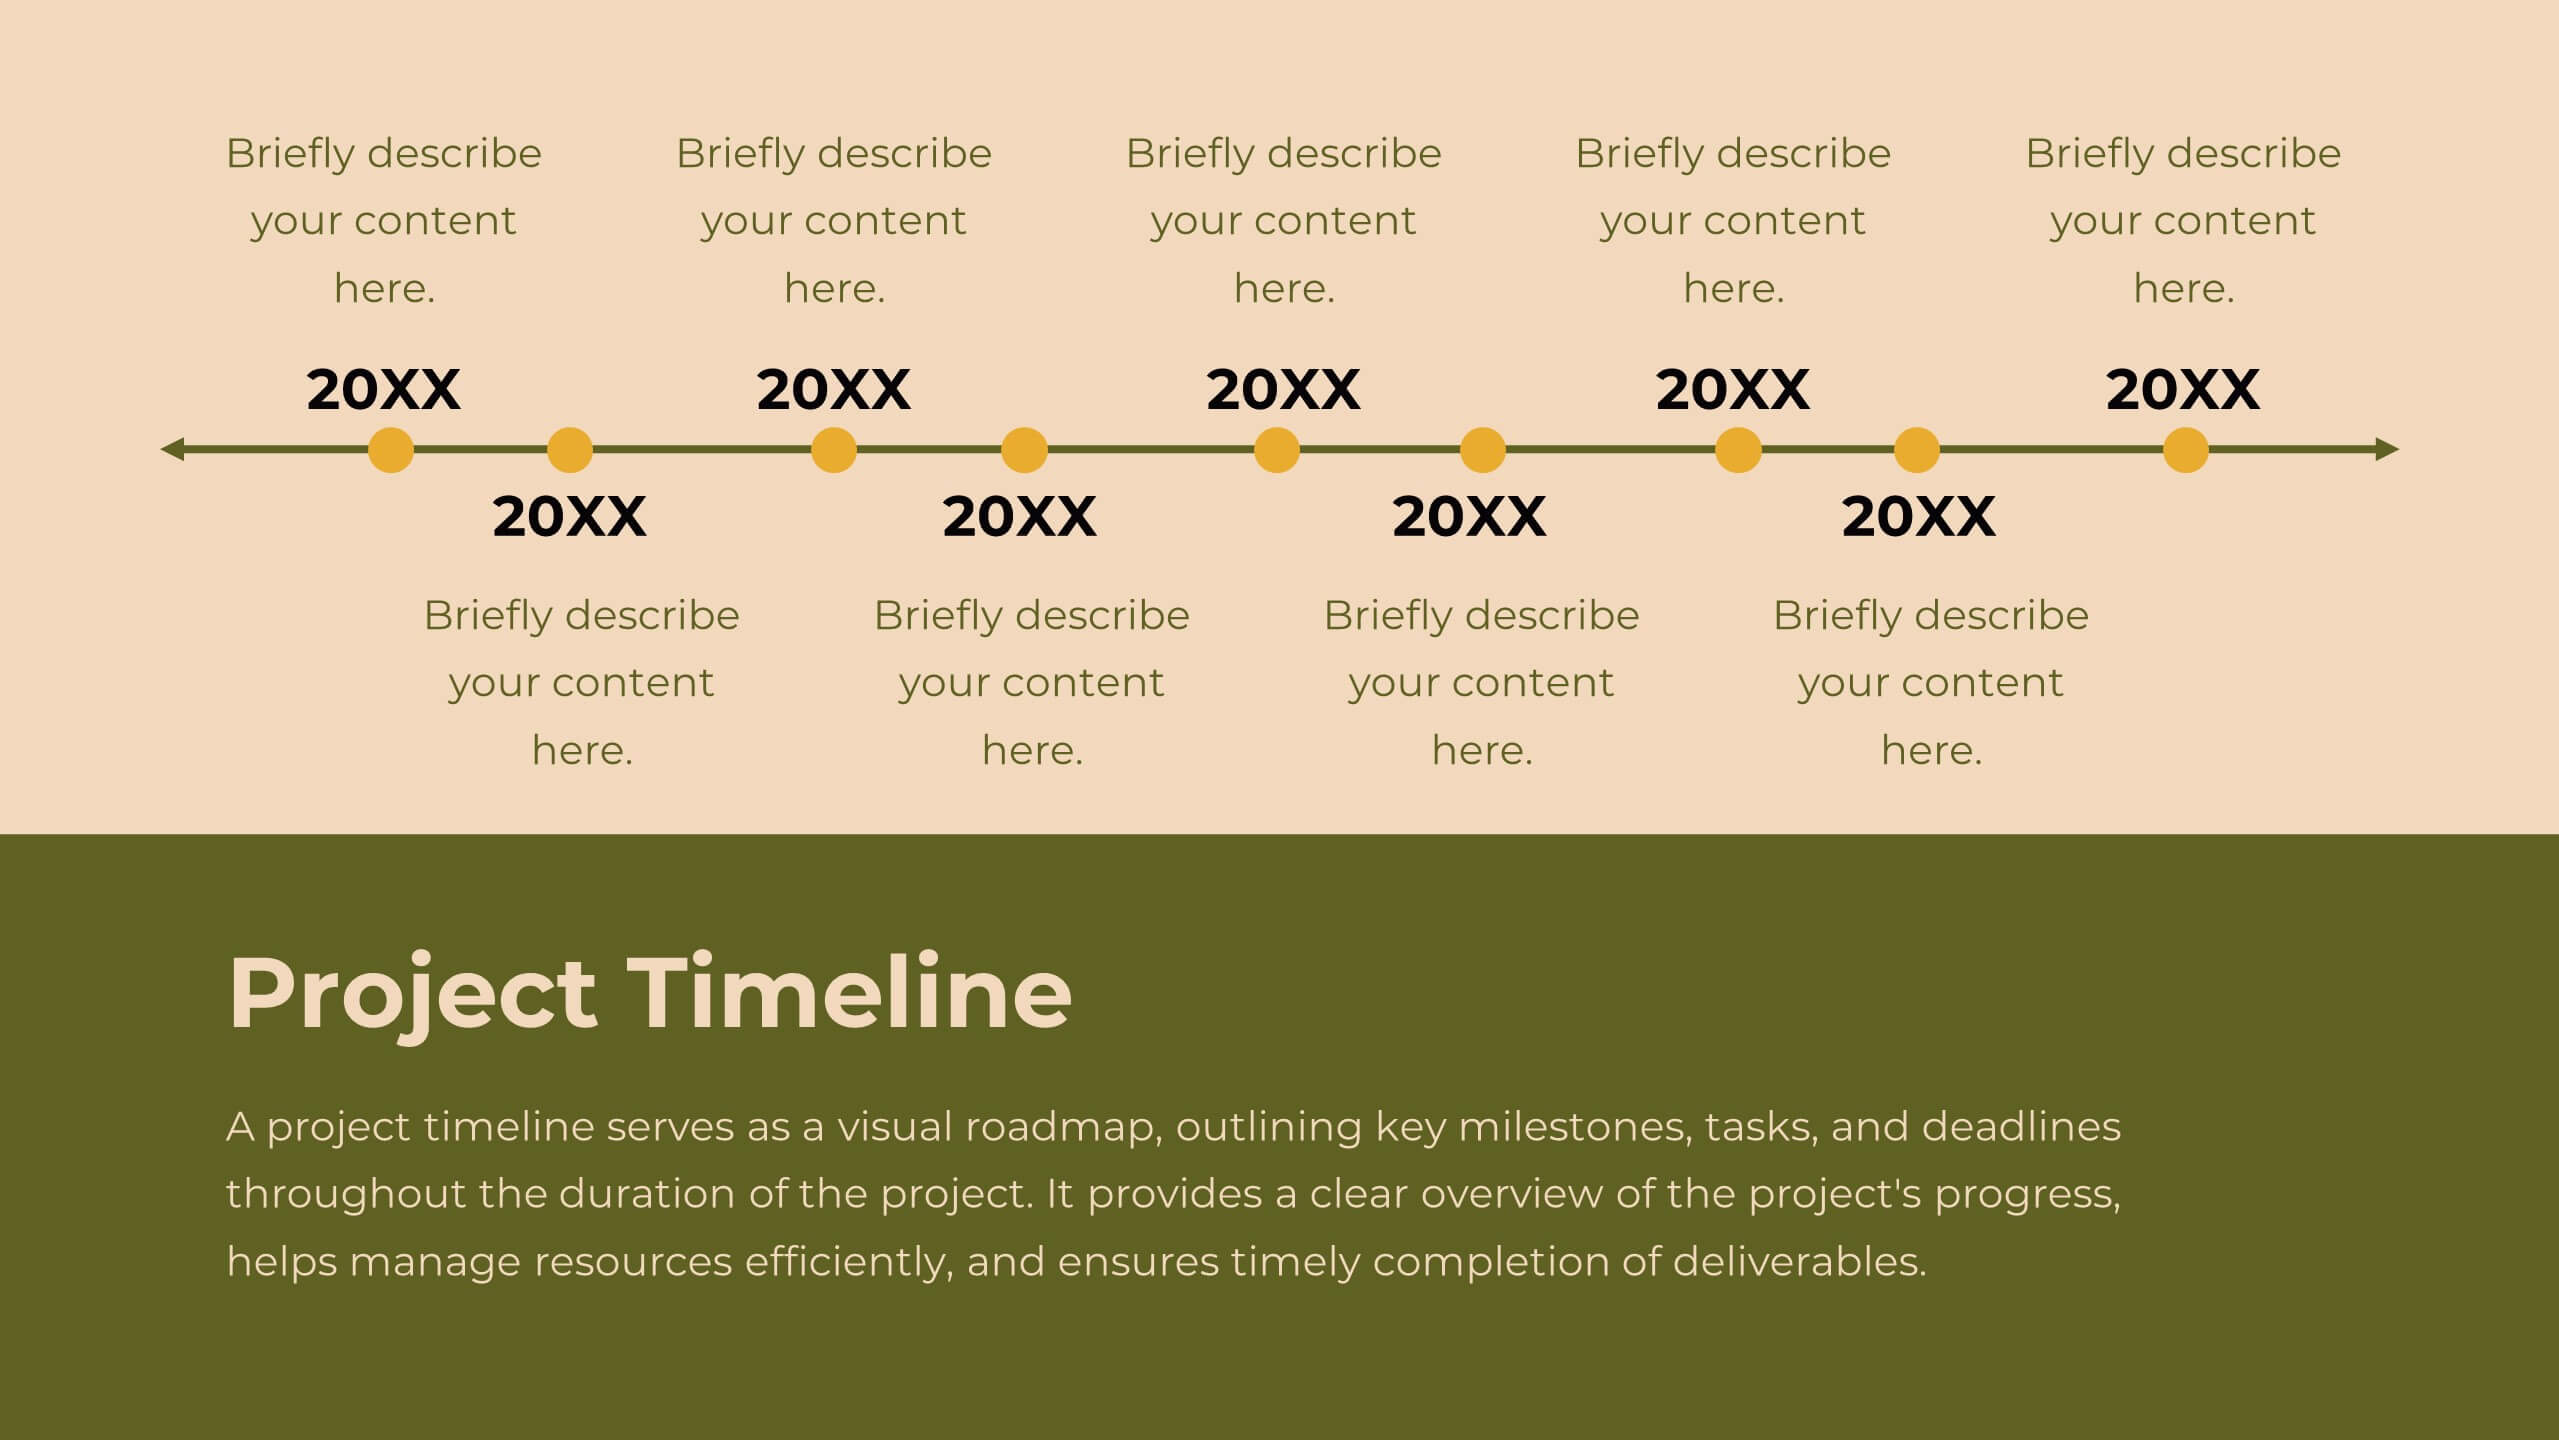
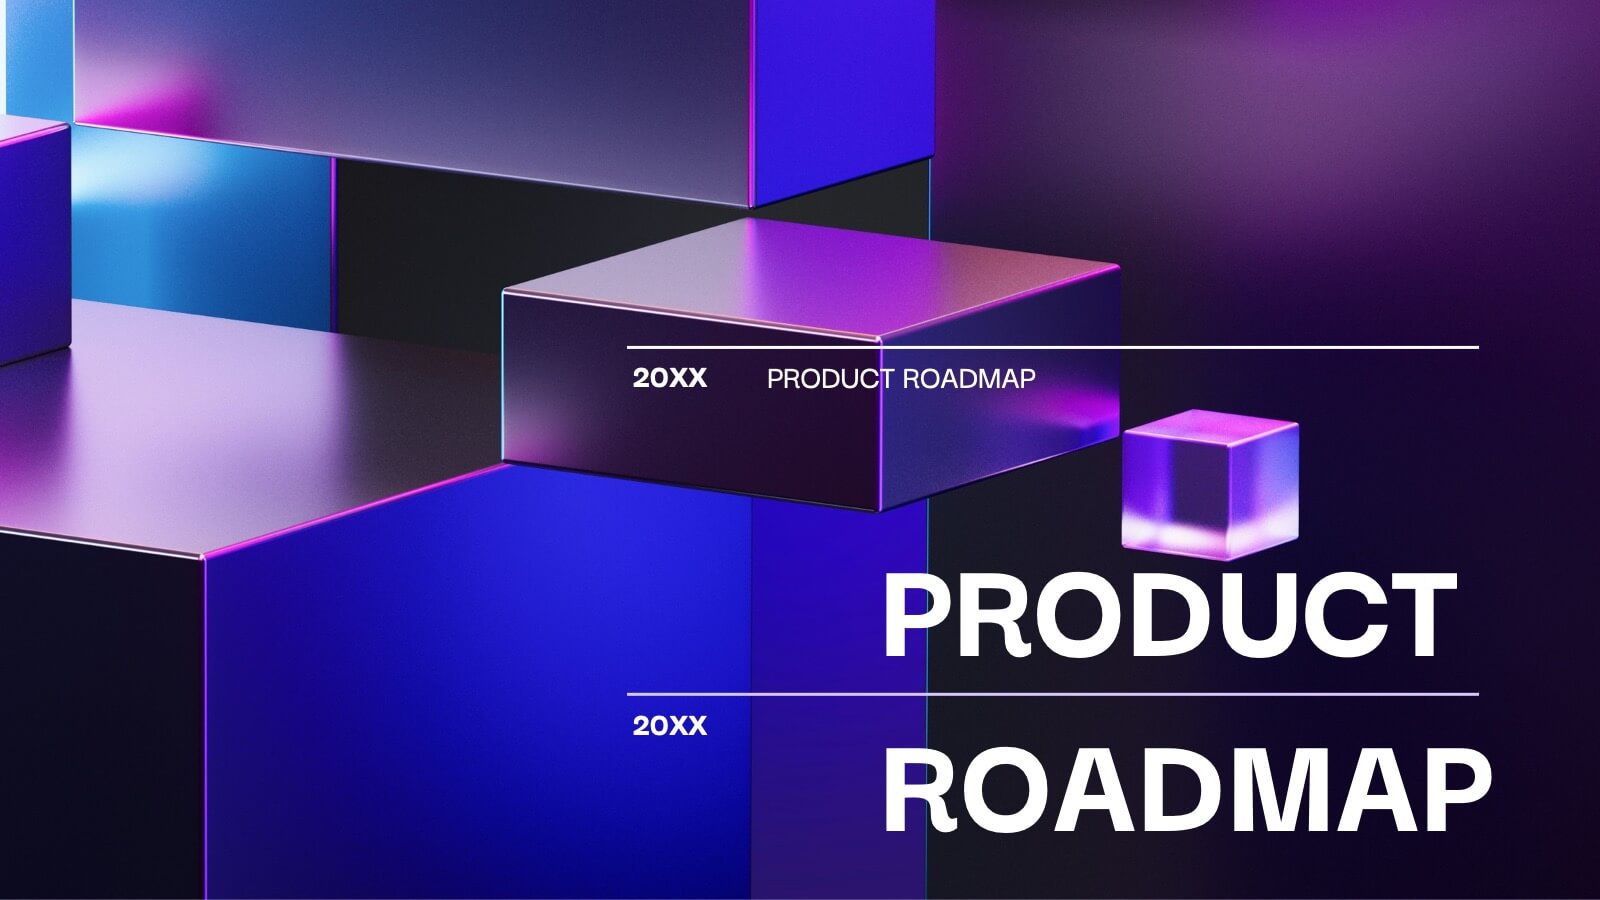
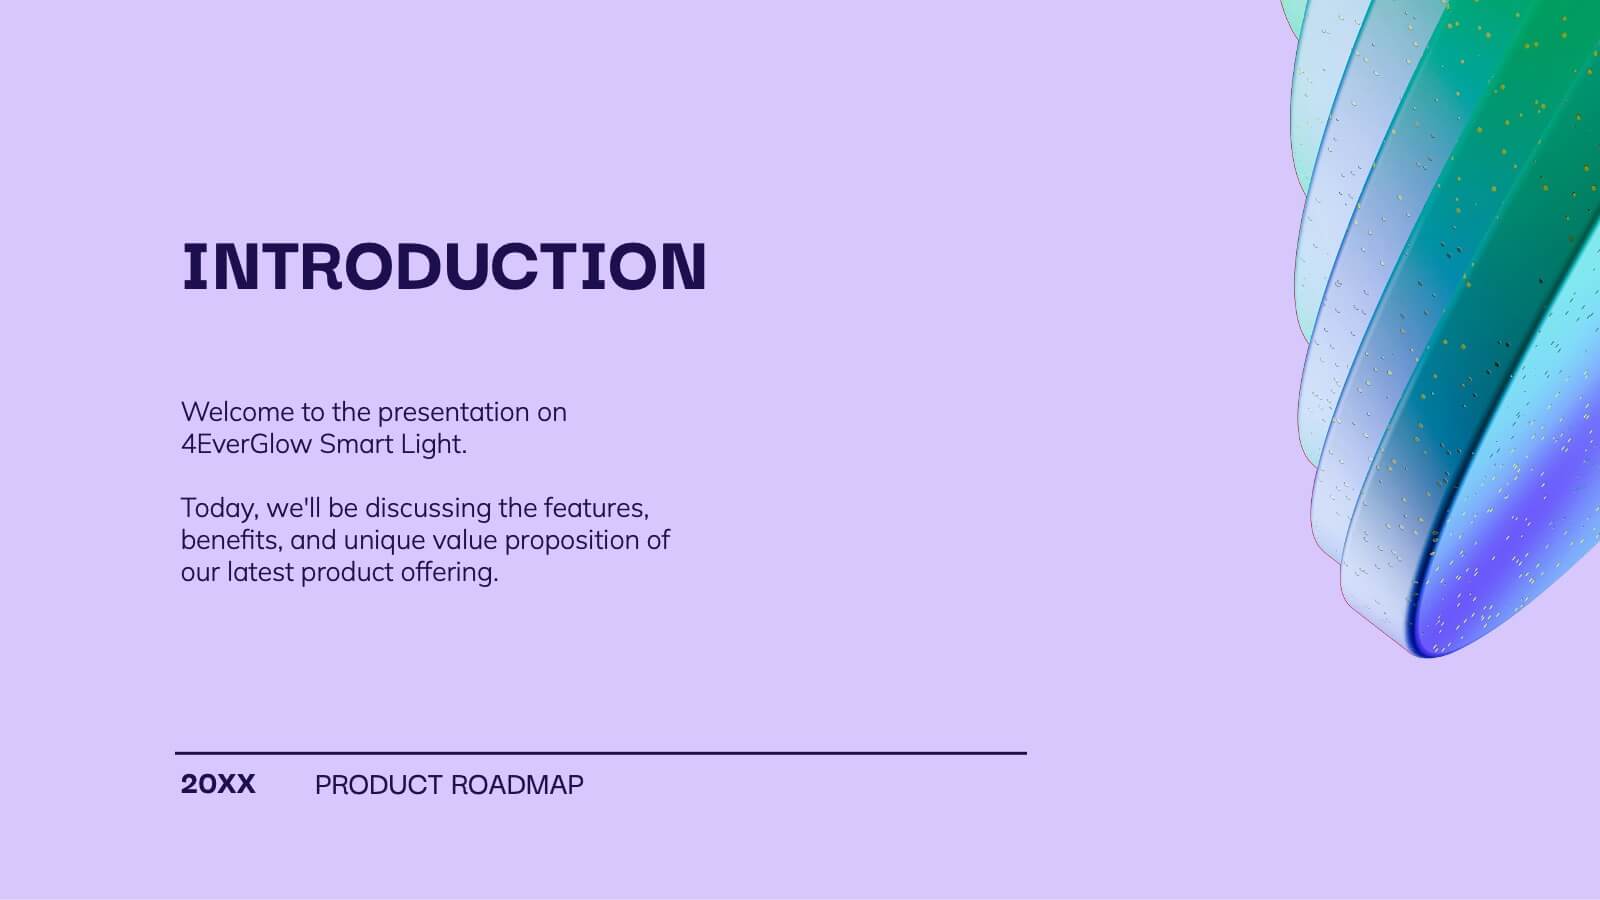
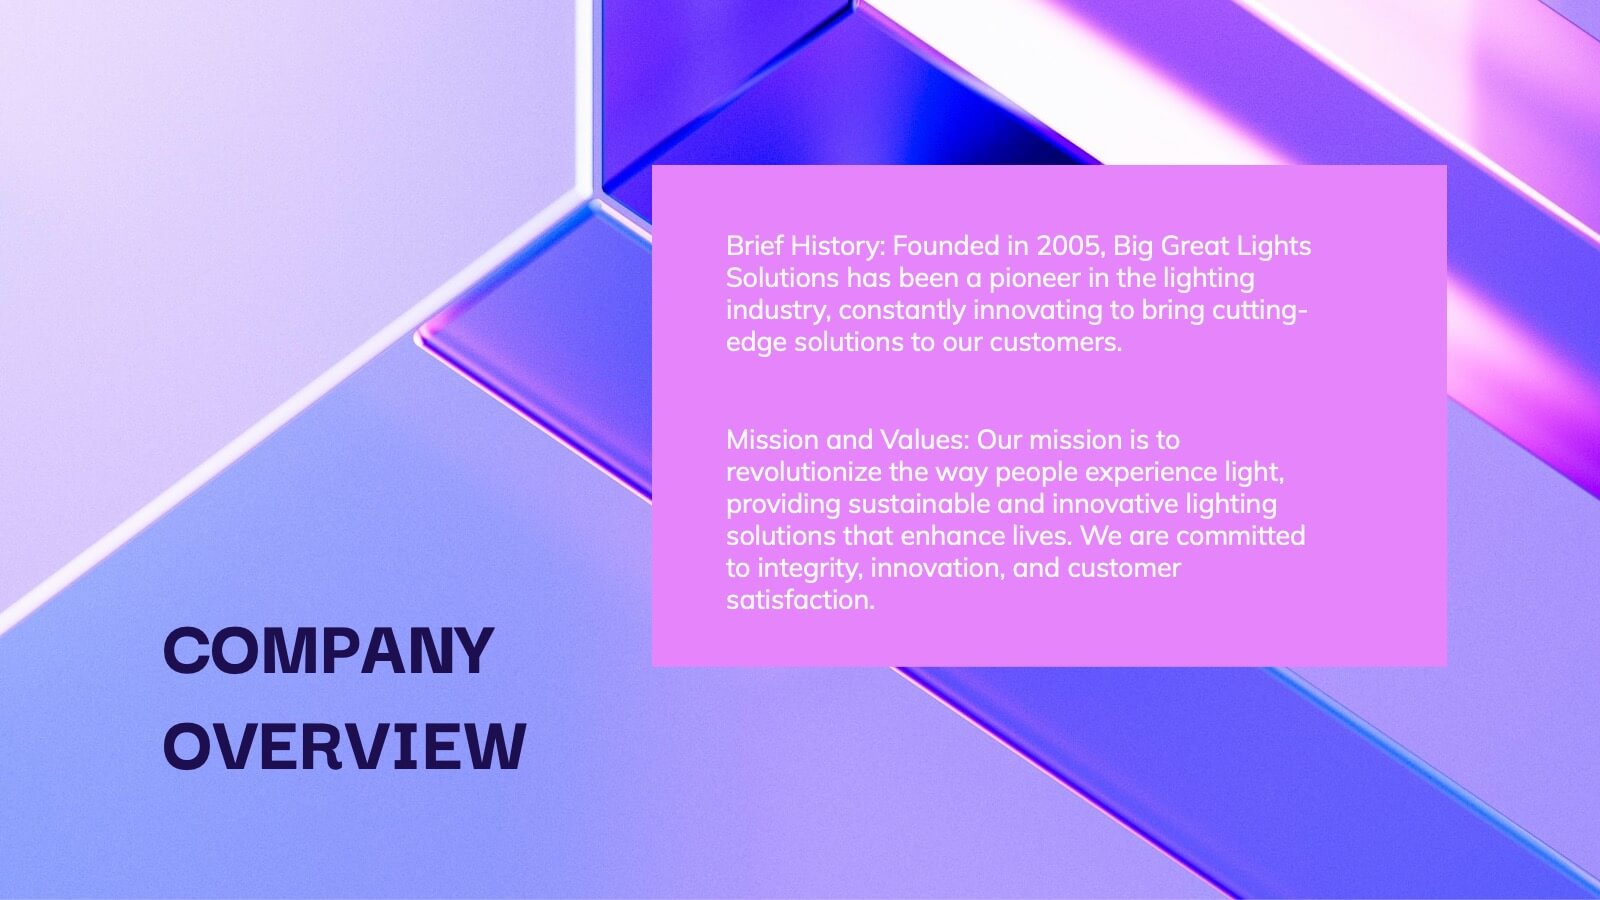
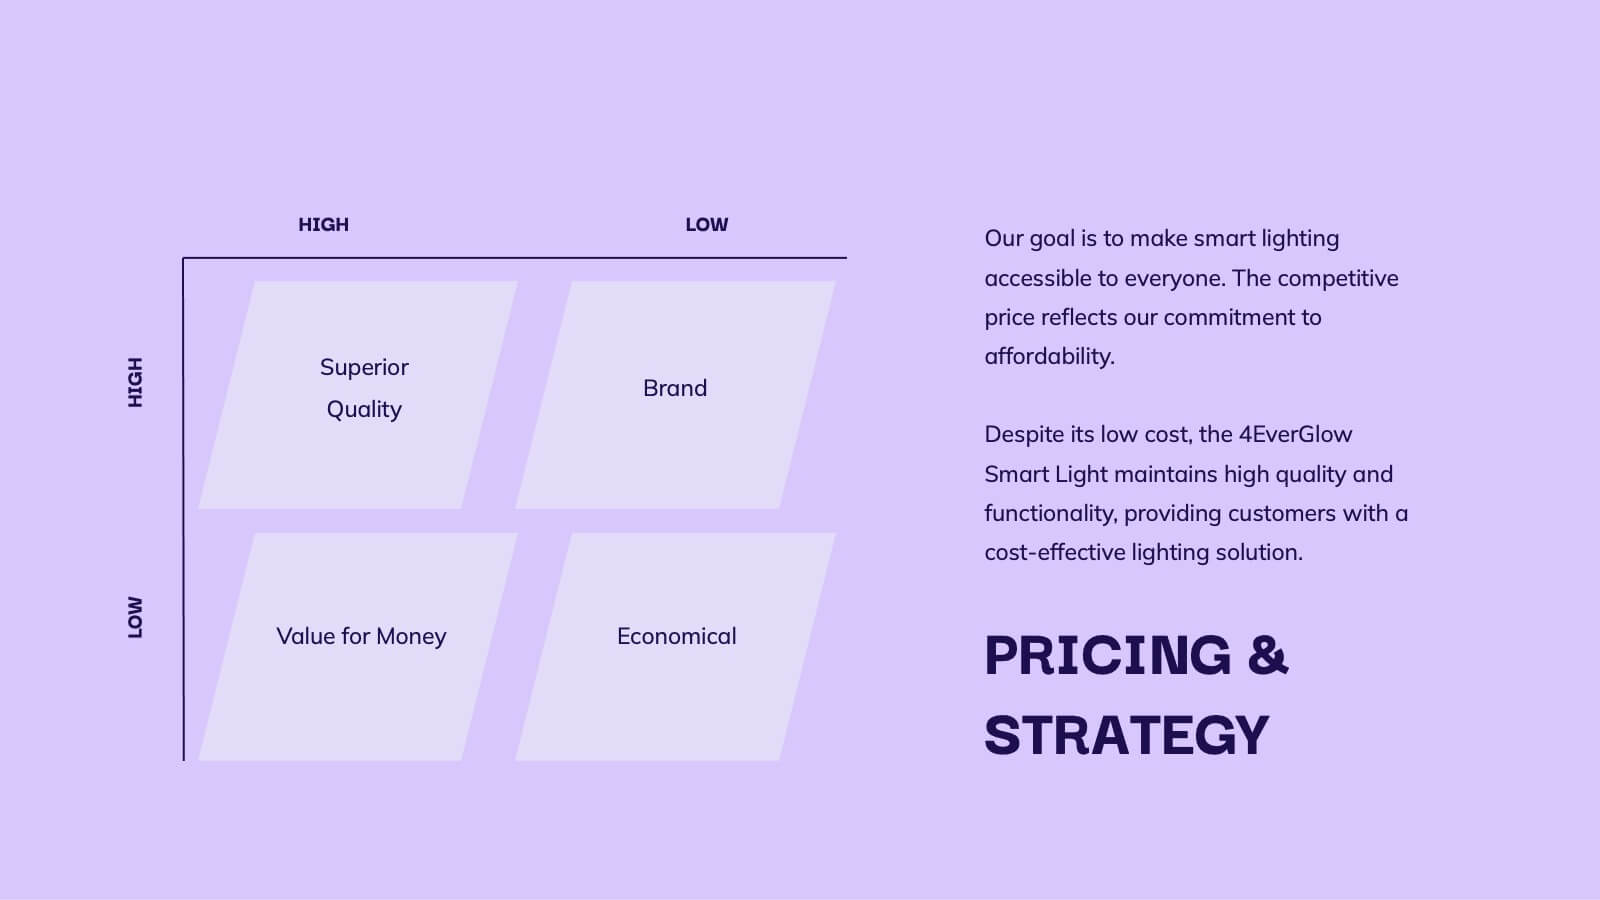
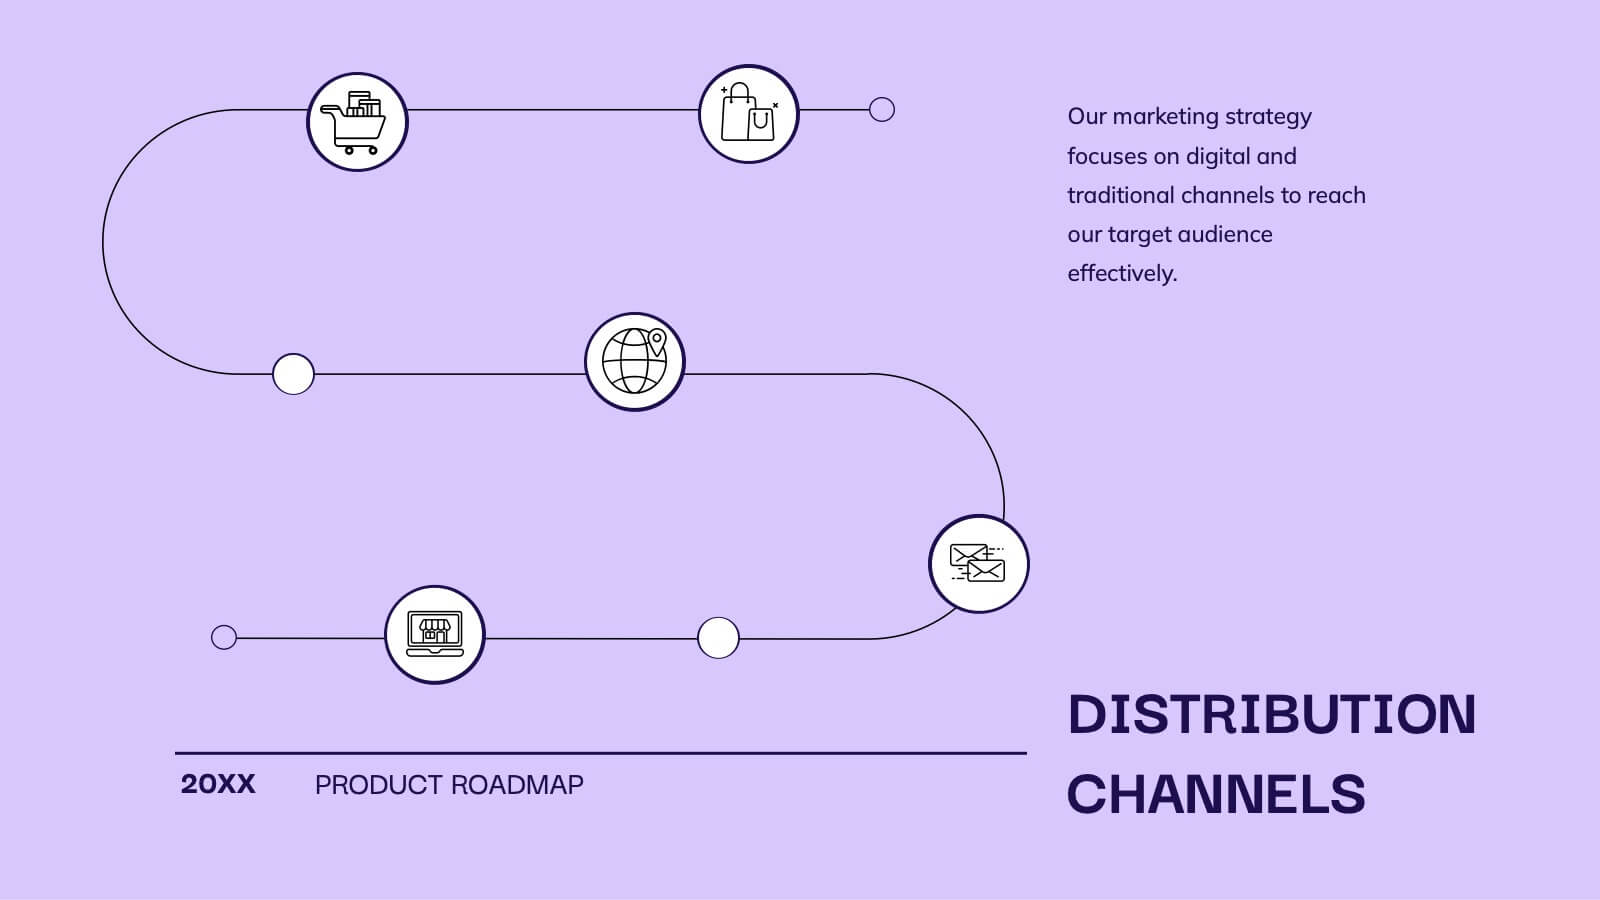
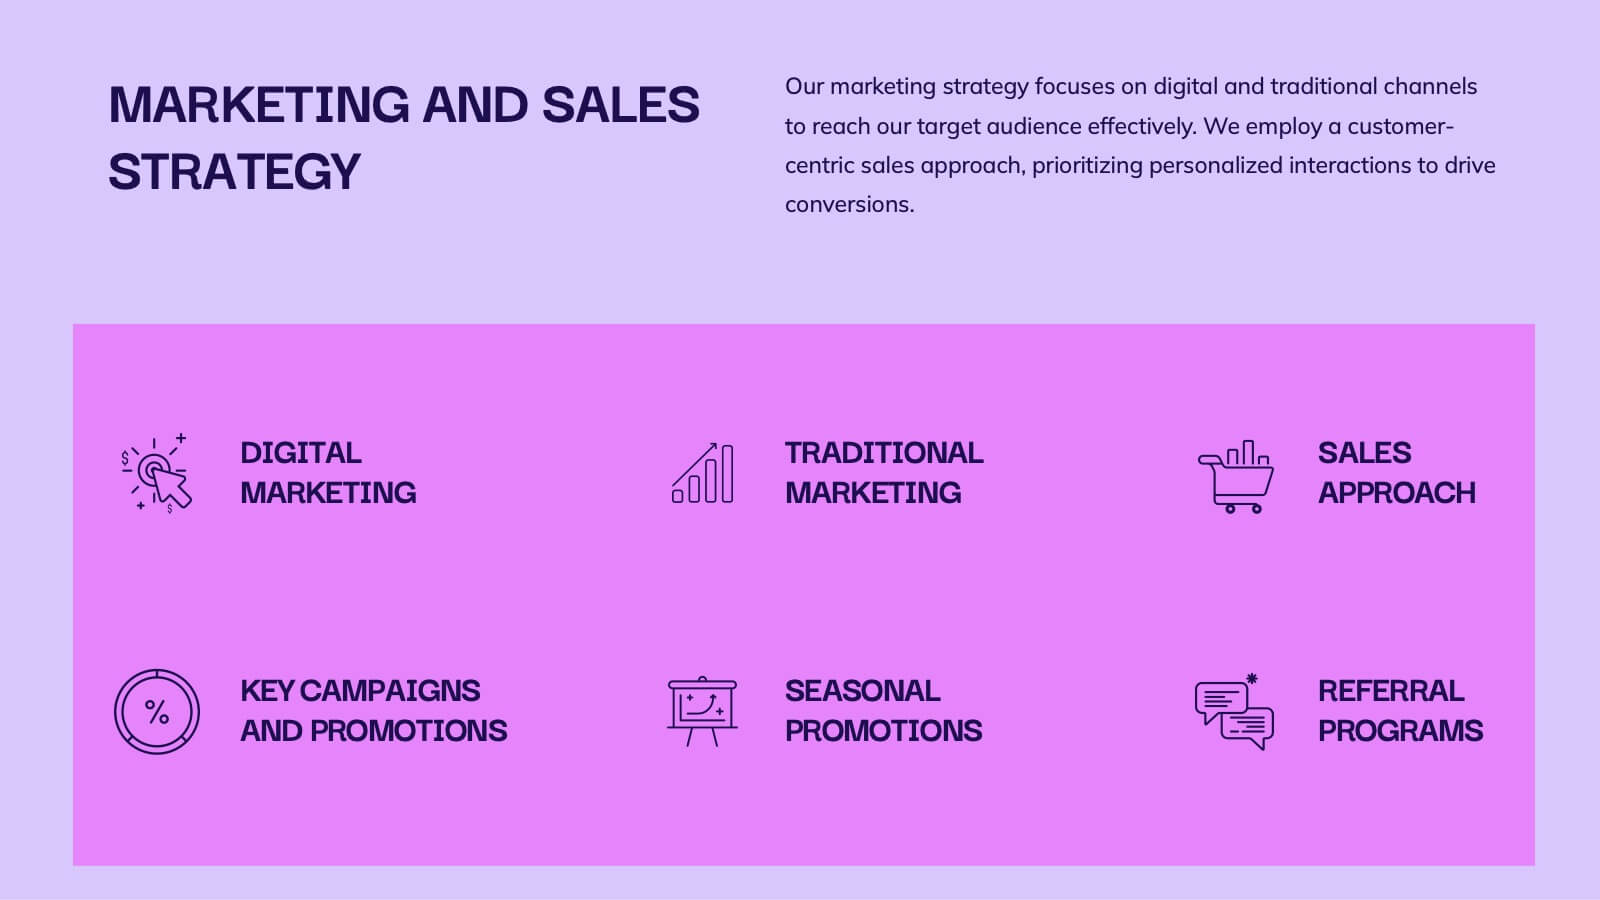
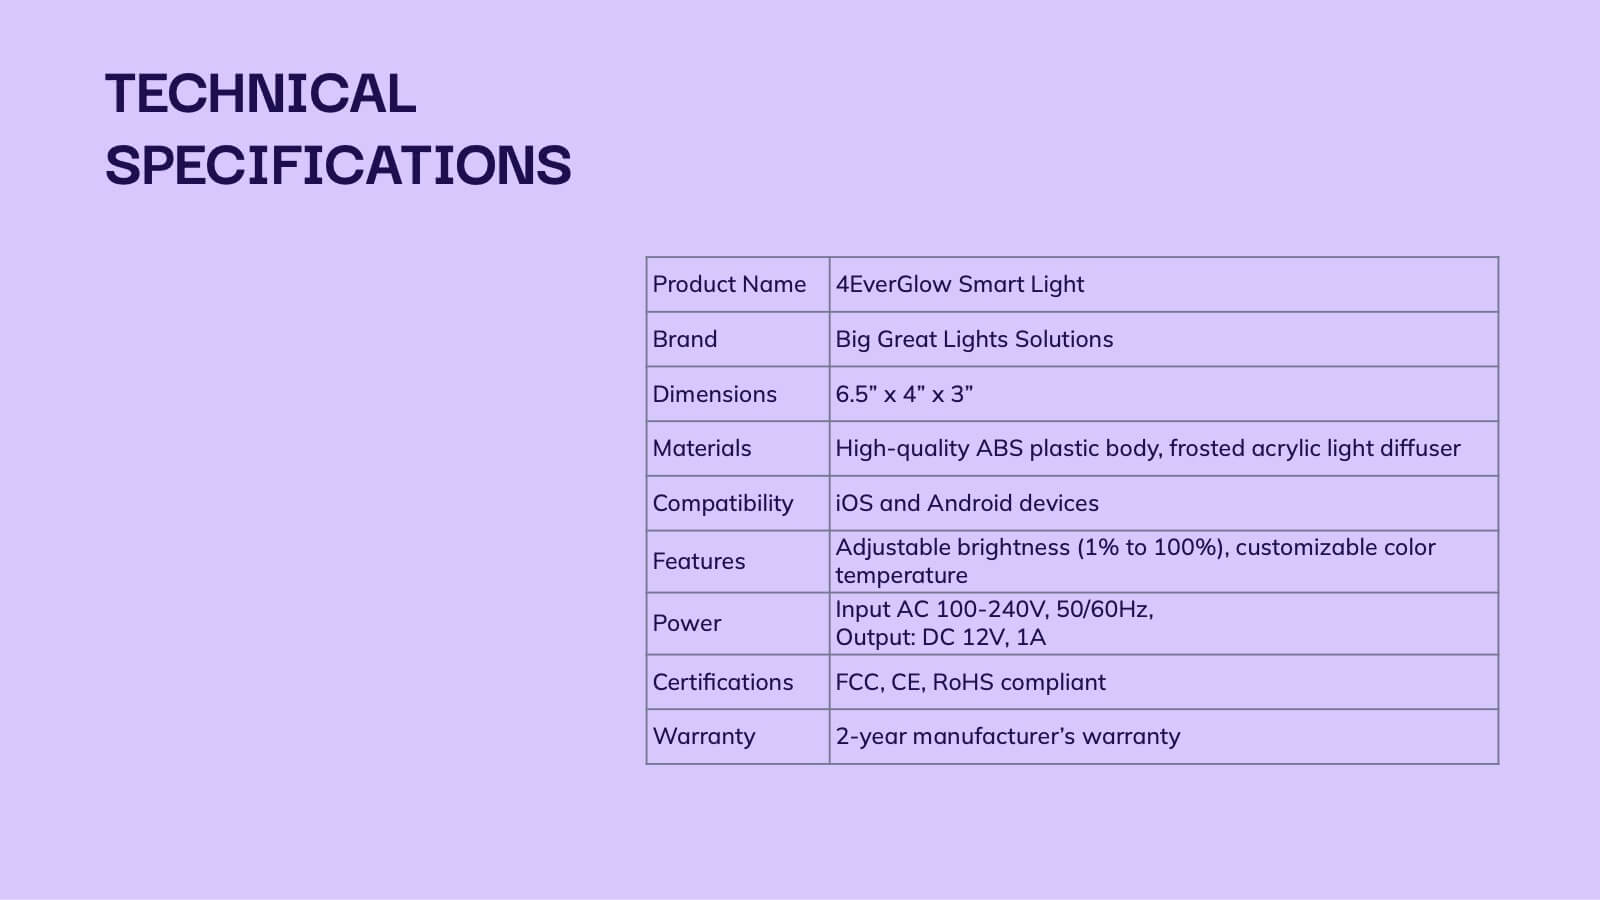
Glimmer Product Roadmap Presentation
Illuminate your product's future with this vibrant glimmer-themed presentation template! Perfect for outlining your product roadmap, it allows you to present key milestones, features, and timelines in a visually engaging way. Captivate your audience and keep them informed about your exciting journey ahead. Compatible with PowerPoint, Keynote, and Google Slides.


4 diapositivas
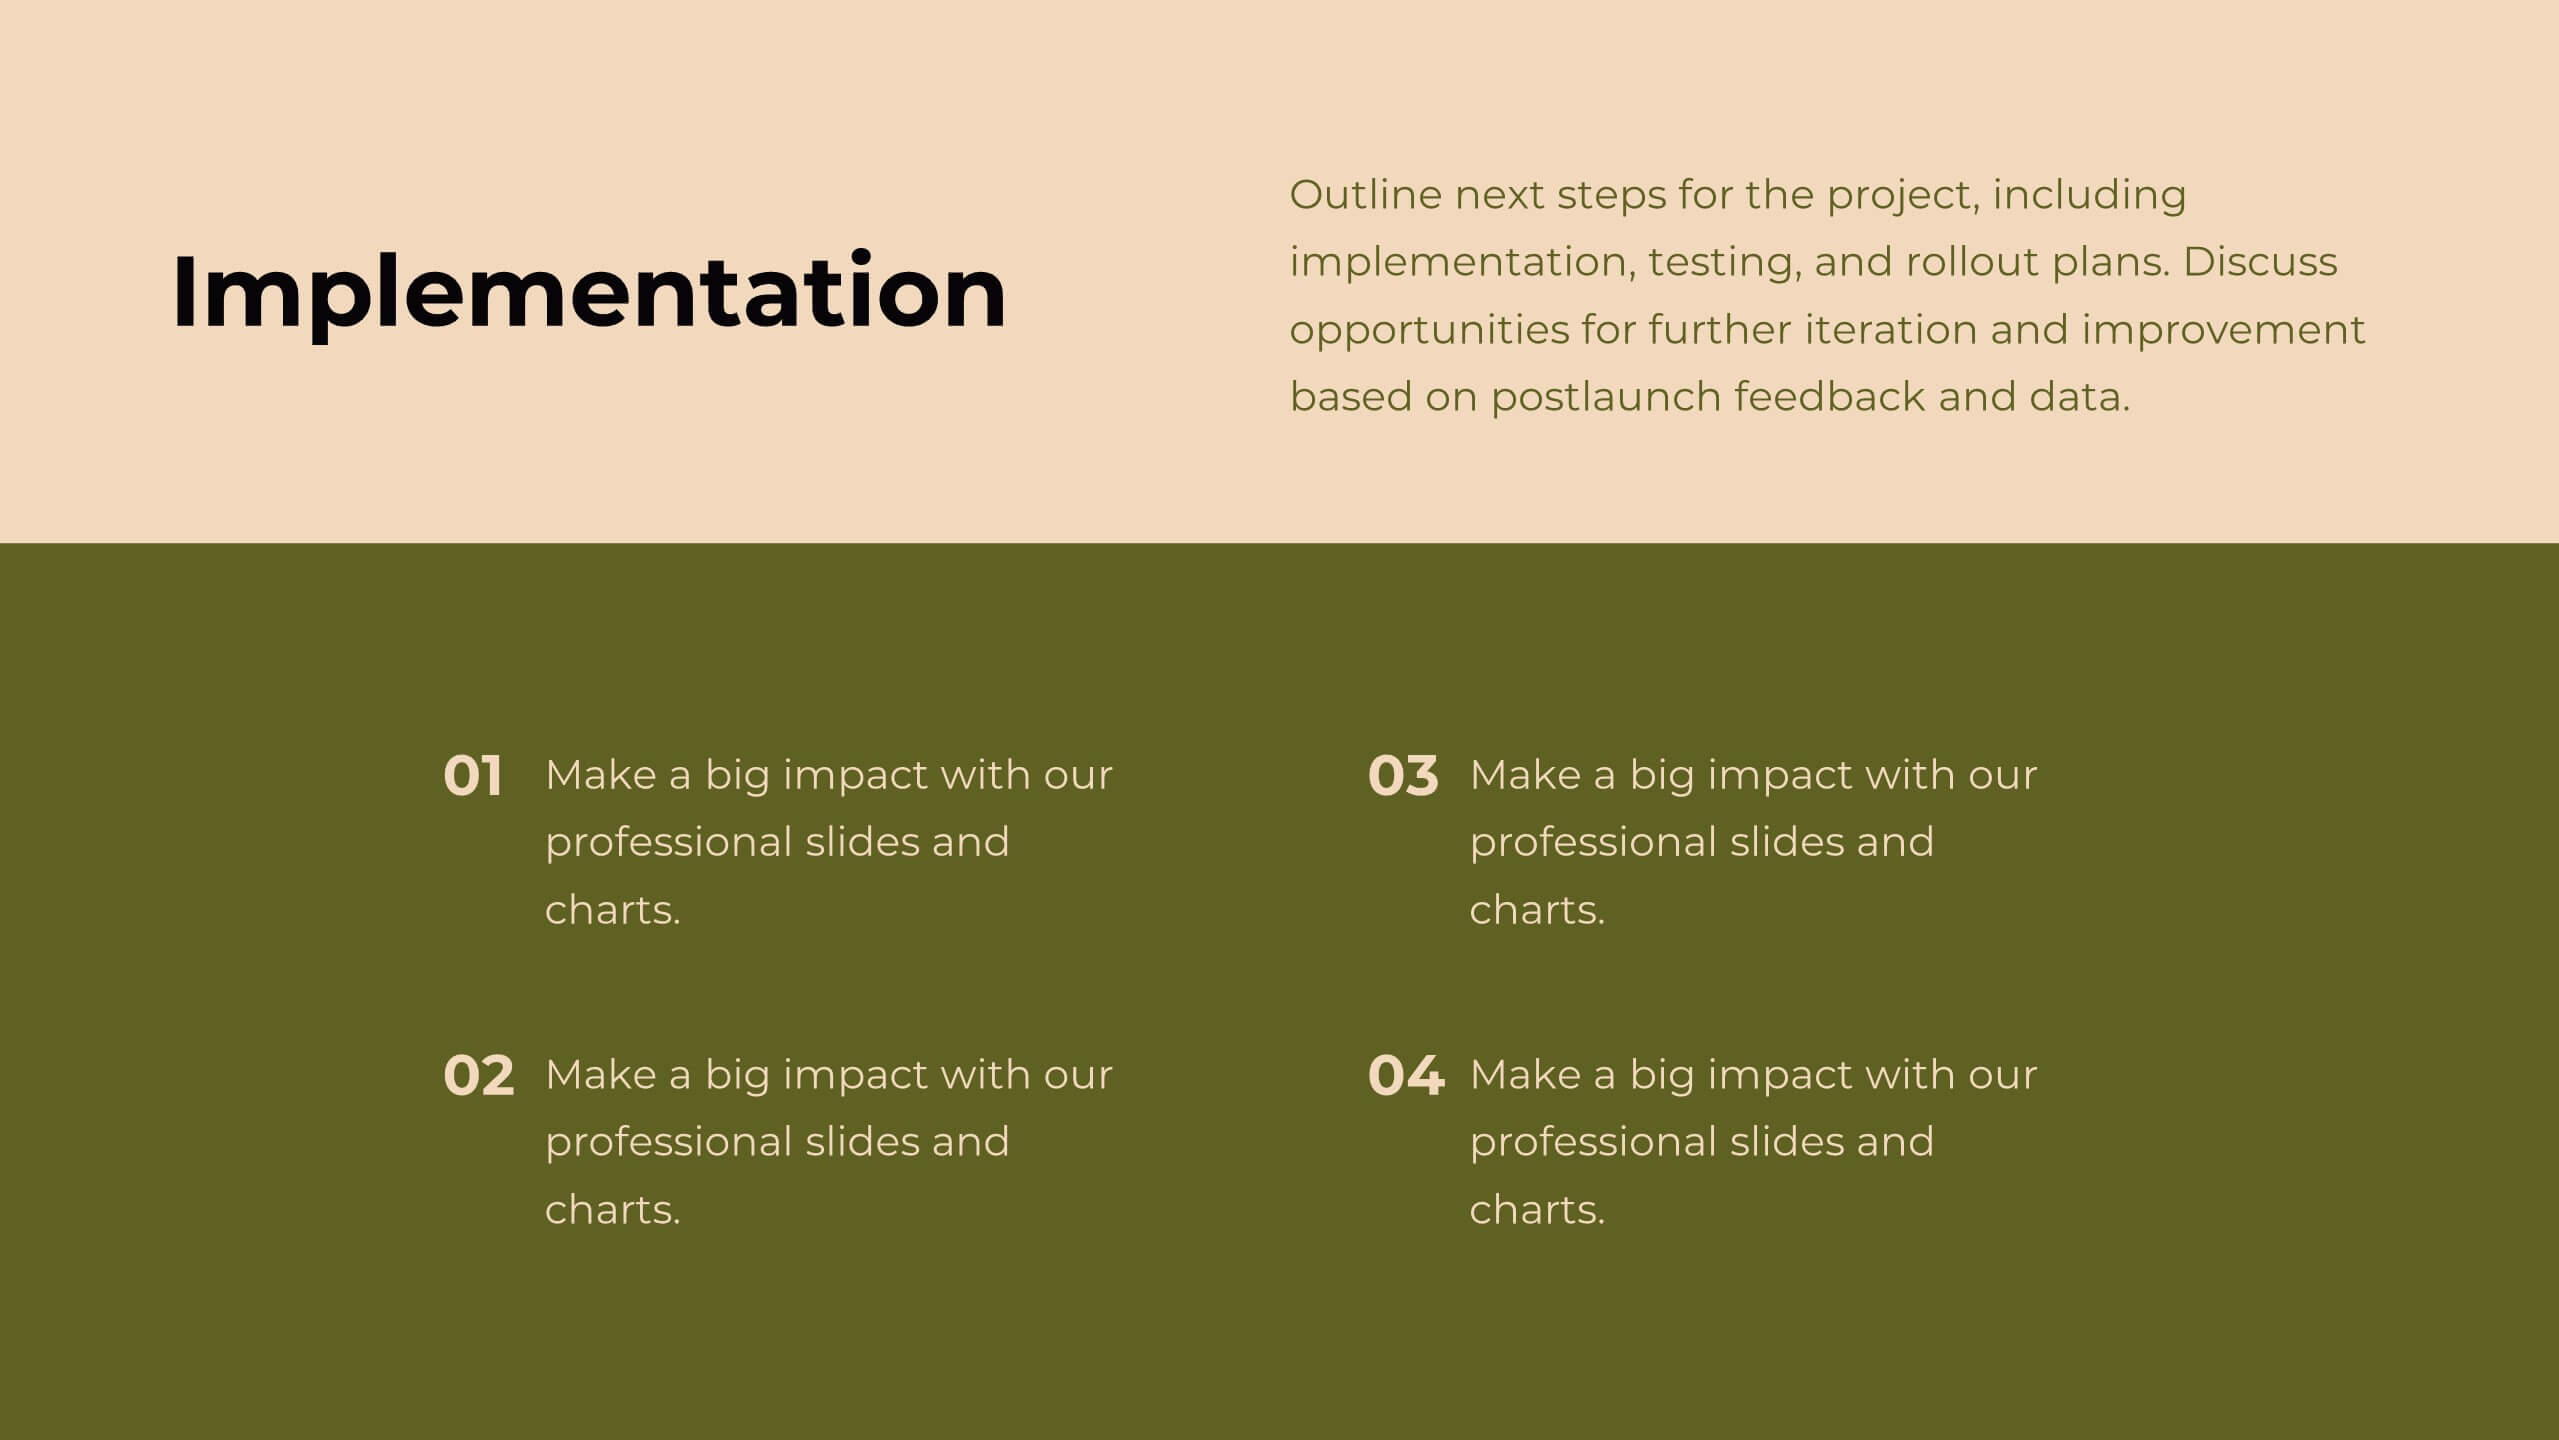
Project Responsibility Assignment Matrix Presentation
Visualize team roles and task accountability at a glance with this Project Responsibility Assignment Matrix. This structured layout categorizes assignments using the RACI model—Responsible, Accountable, Consulted, and Informed—organized by team and position. Ideal for project managers, team leads, and operations planners, it helps ensure clarity, reduce overlap, and promote accountability across departments. Easily editable in PowerPoint, Keynote, and Google Slides for seamless customization and cross-platform use.


4 diapositivas
HR Workflow and Policy Overview Presentation
Streamline organizational processes with the HR Workflow and Policy Overview template. Featuring a clear flowchart design, this layout is ideal for mapping HR procedures, compliance steps, and policy implementation. Fully customizable in Canva, PowerPoint, and Google Slides to align with your company’s branding and human resources management needs.