


Características


¿Tienes alguna pregunta?
Recomendar

21 diapositivas
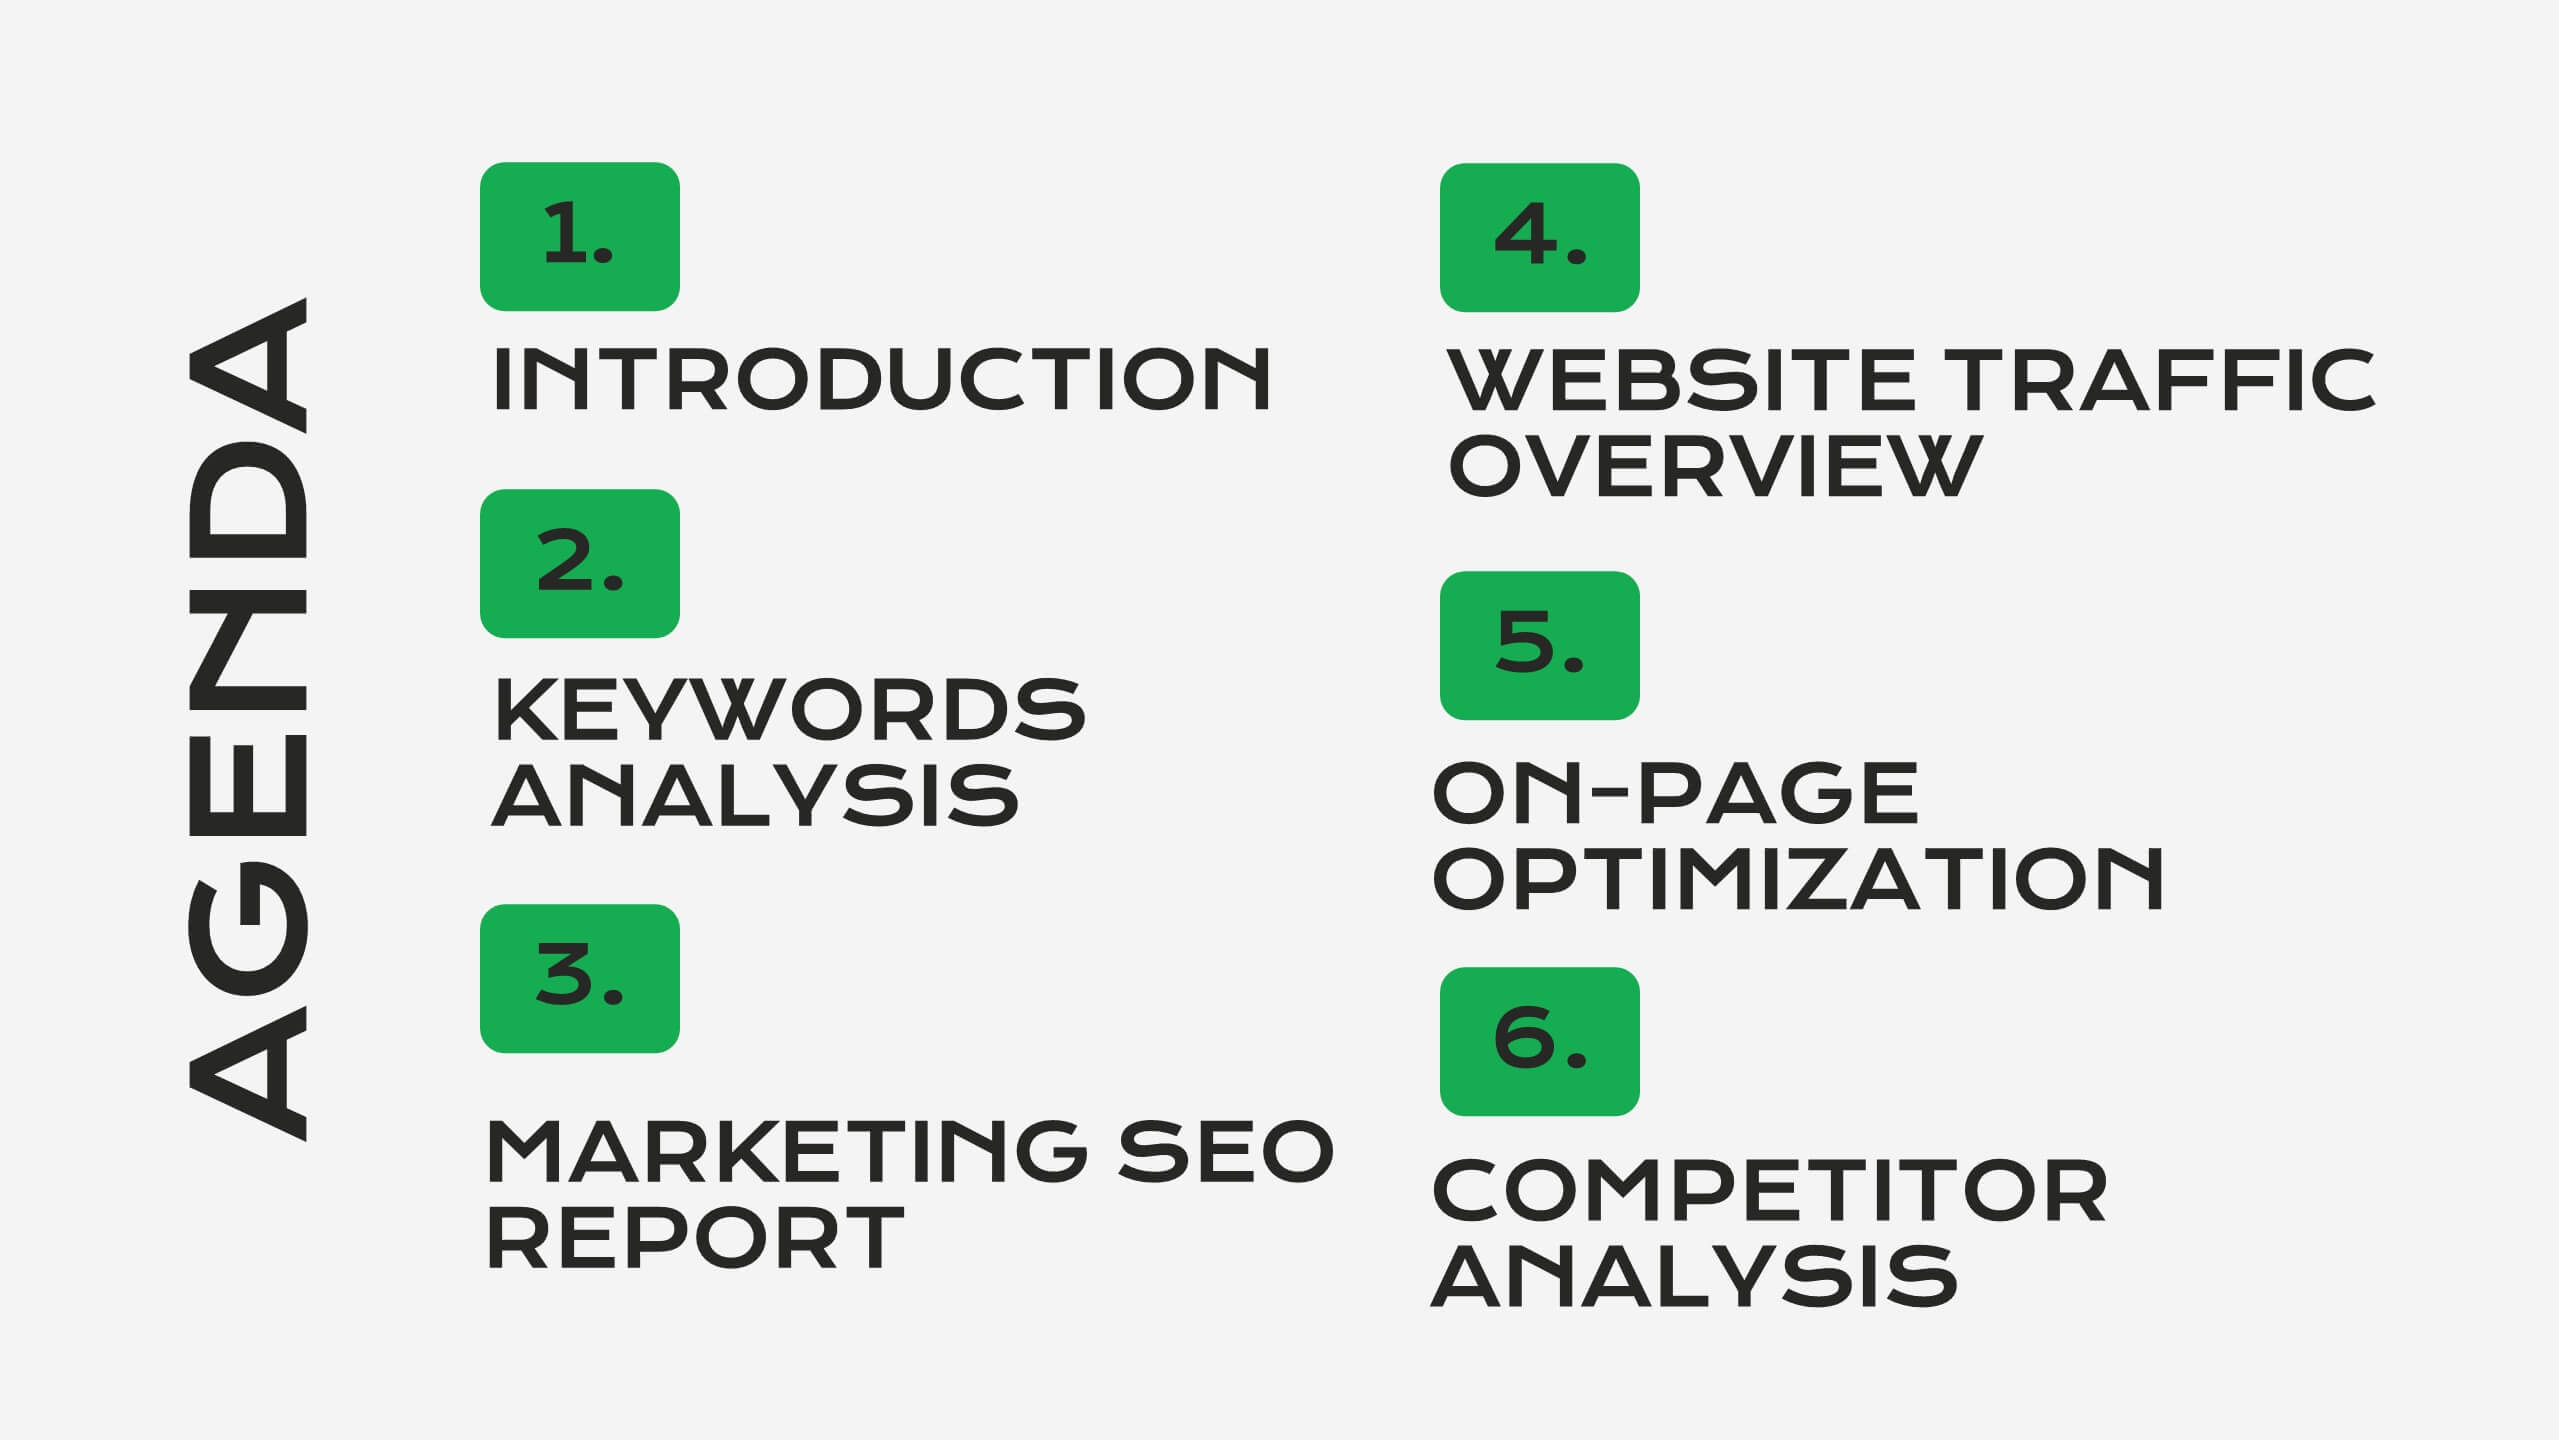
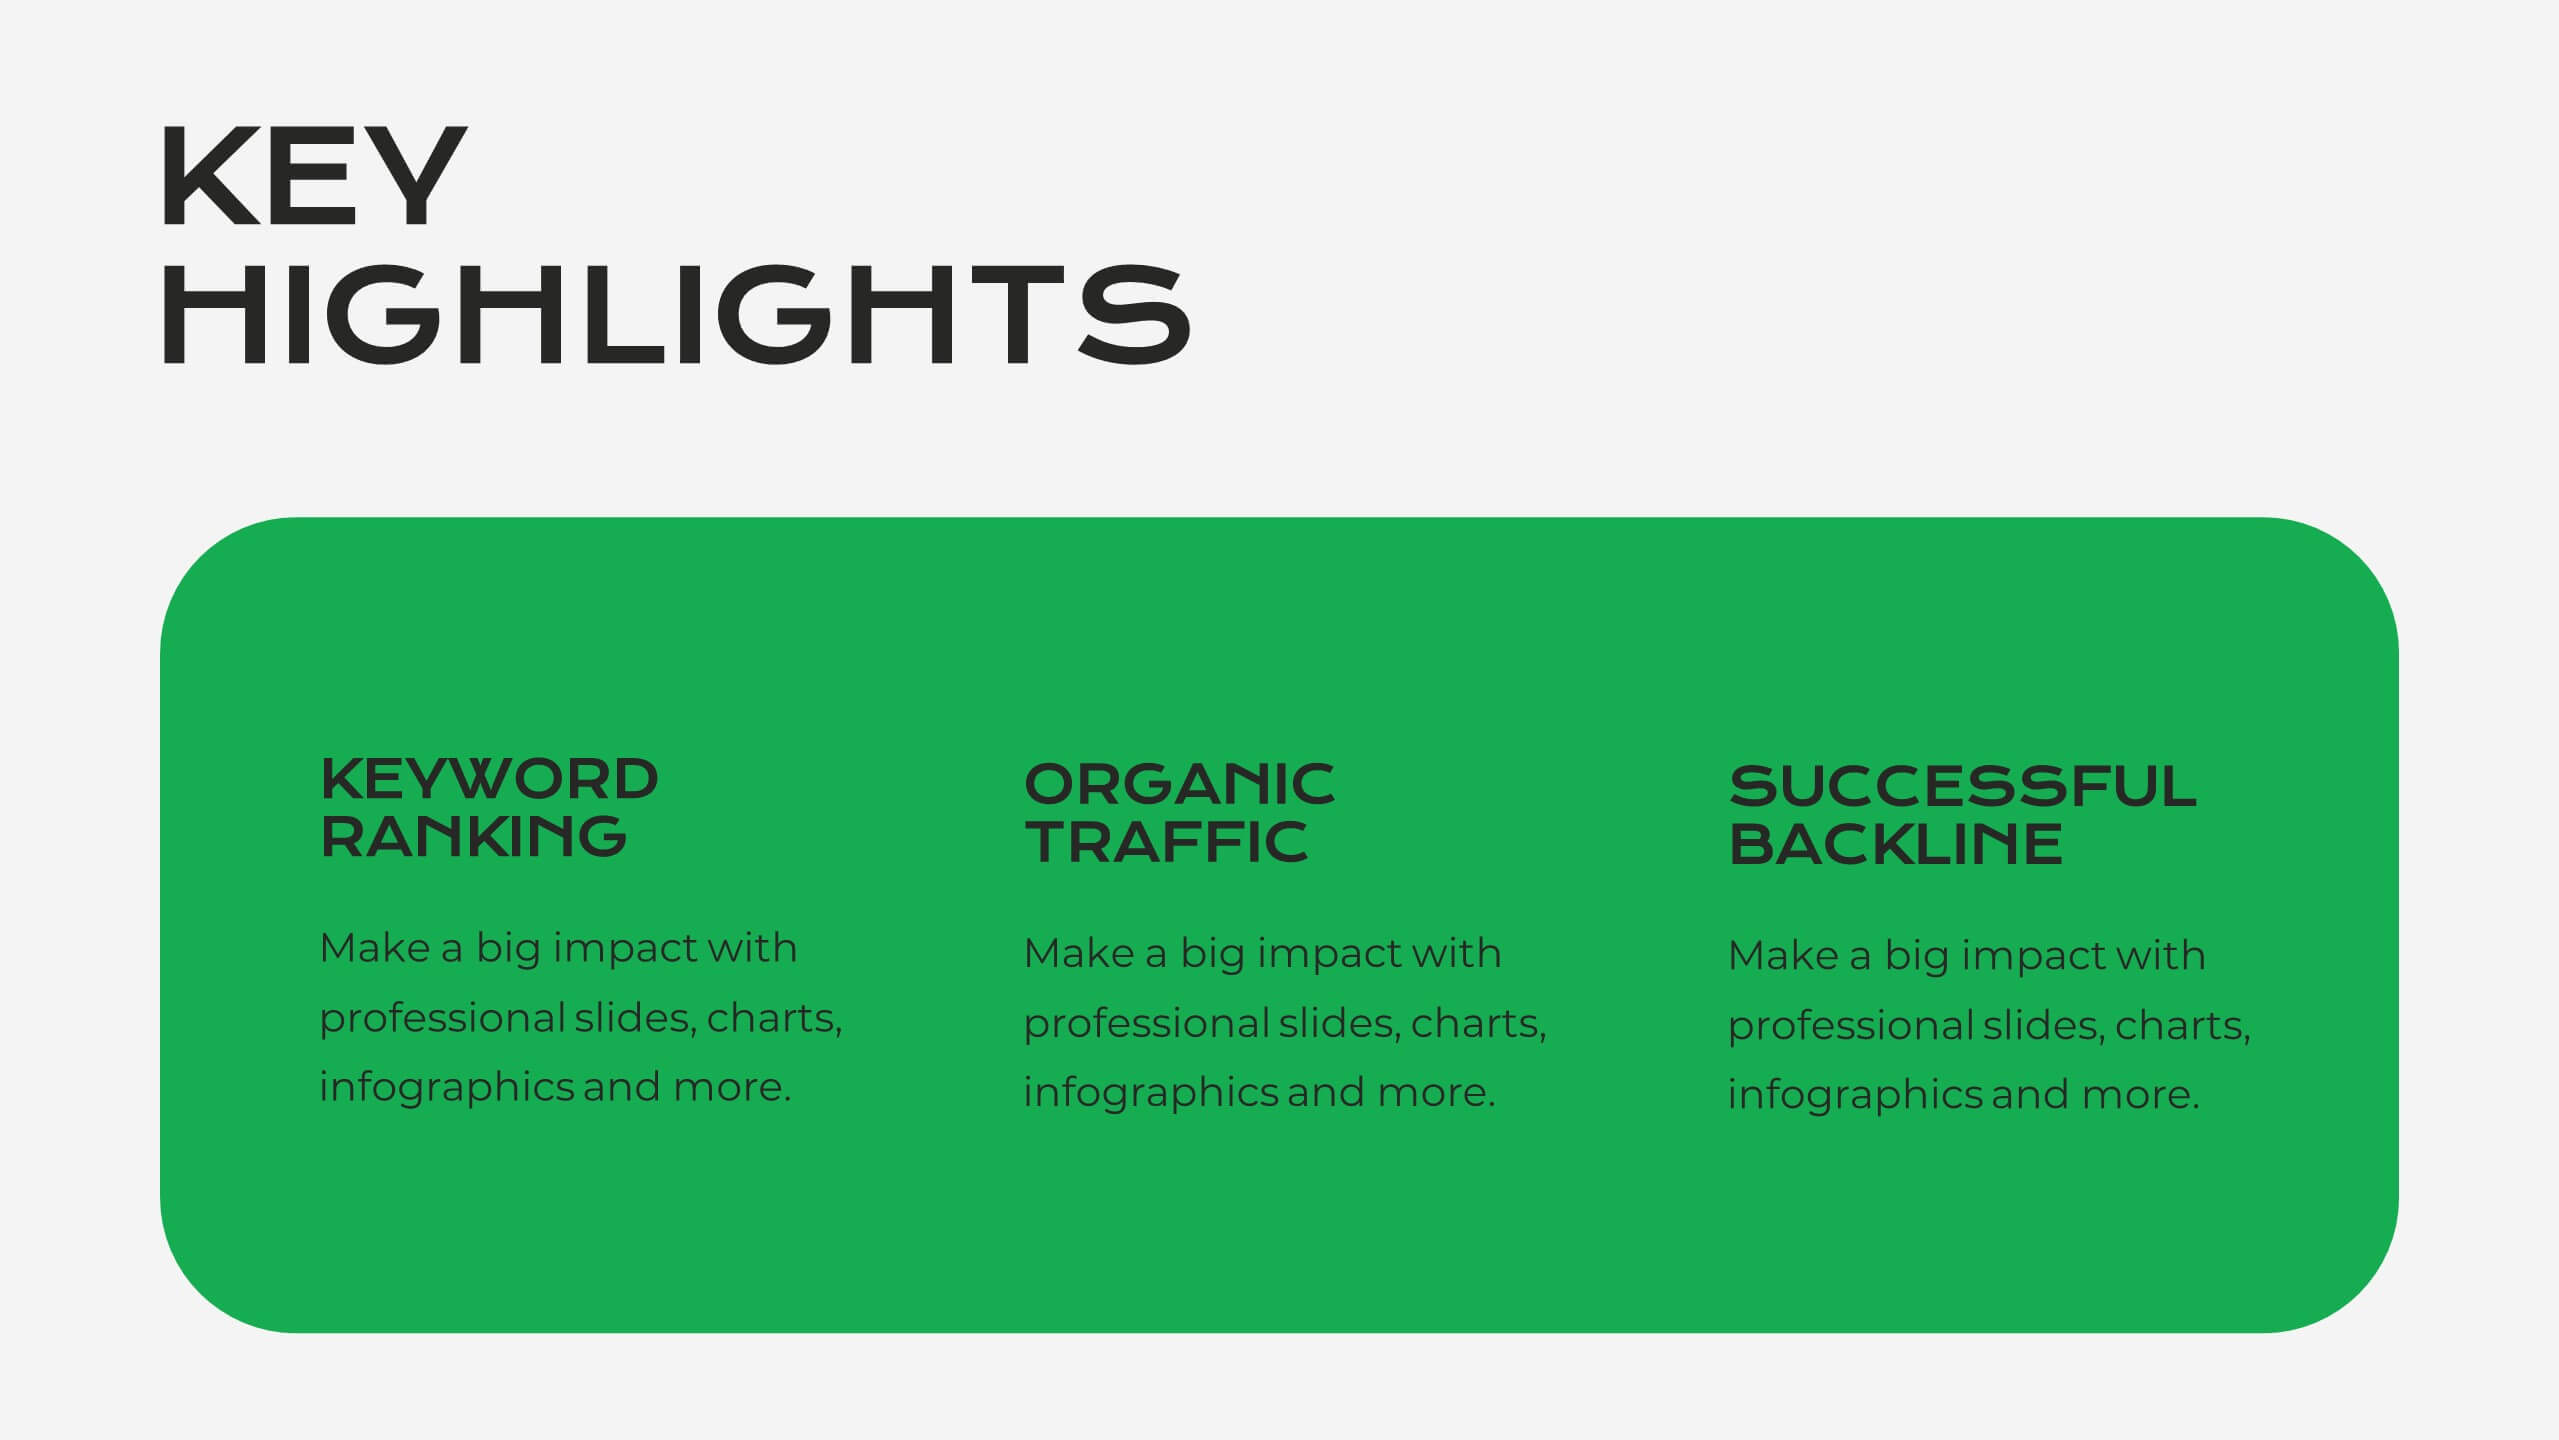
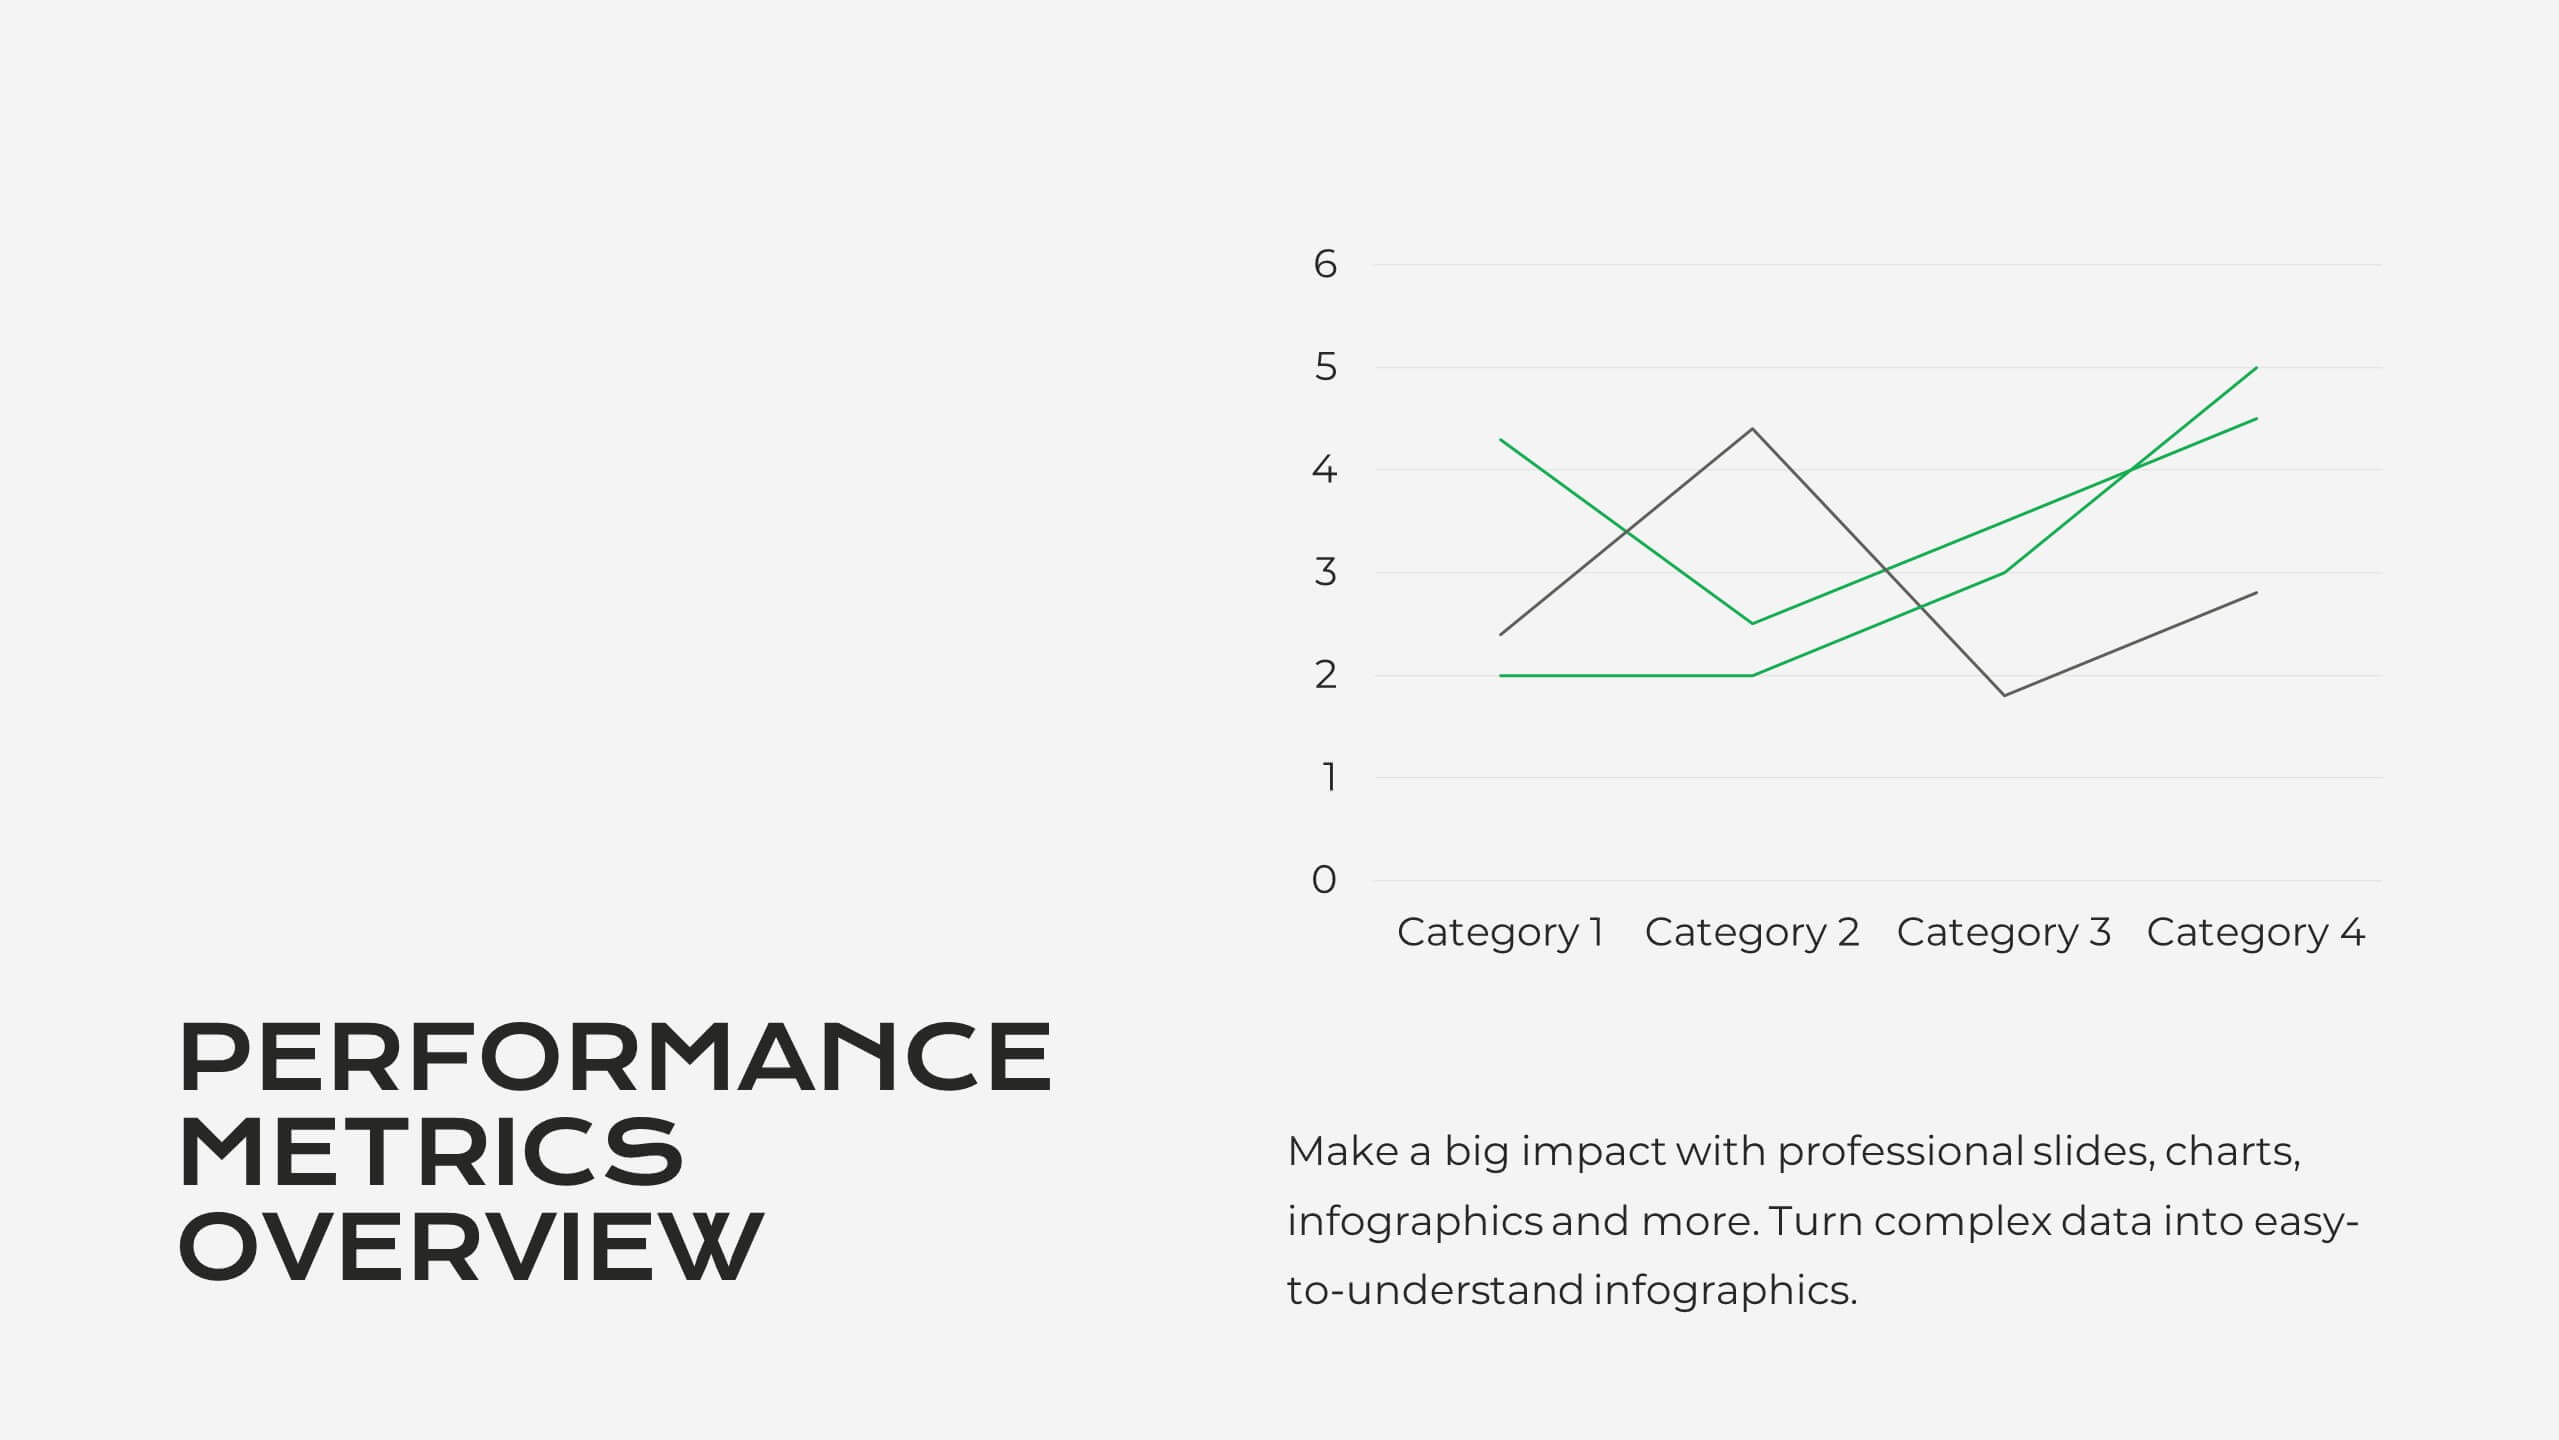
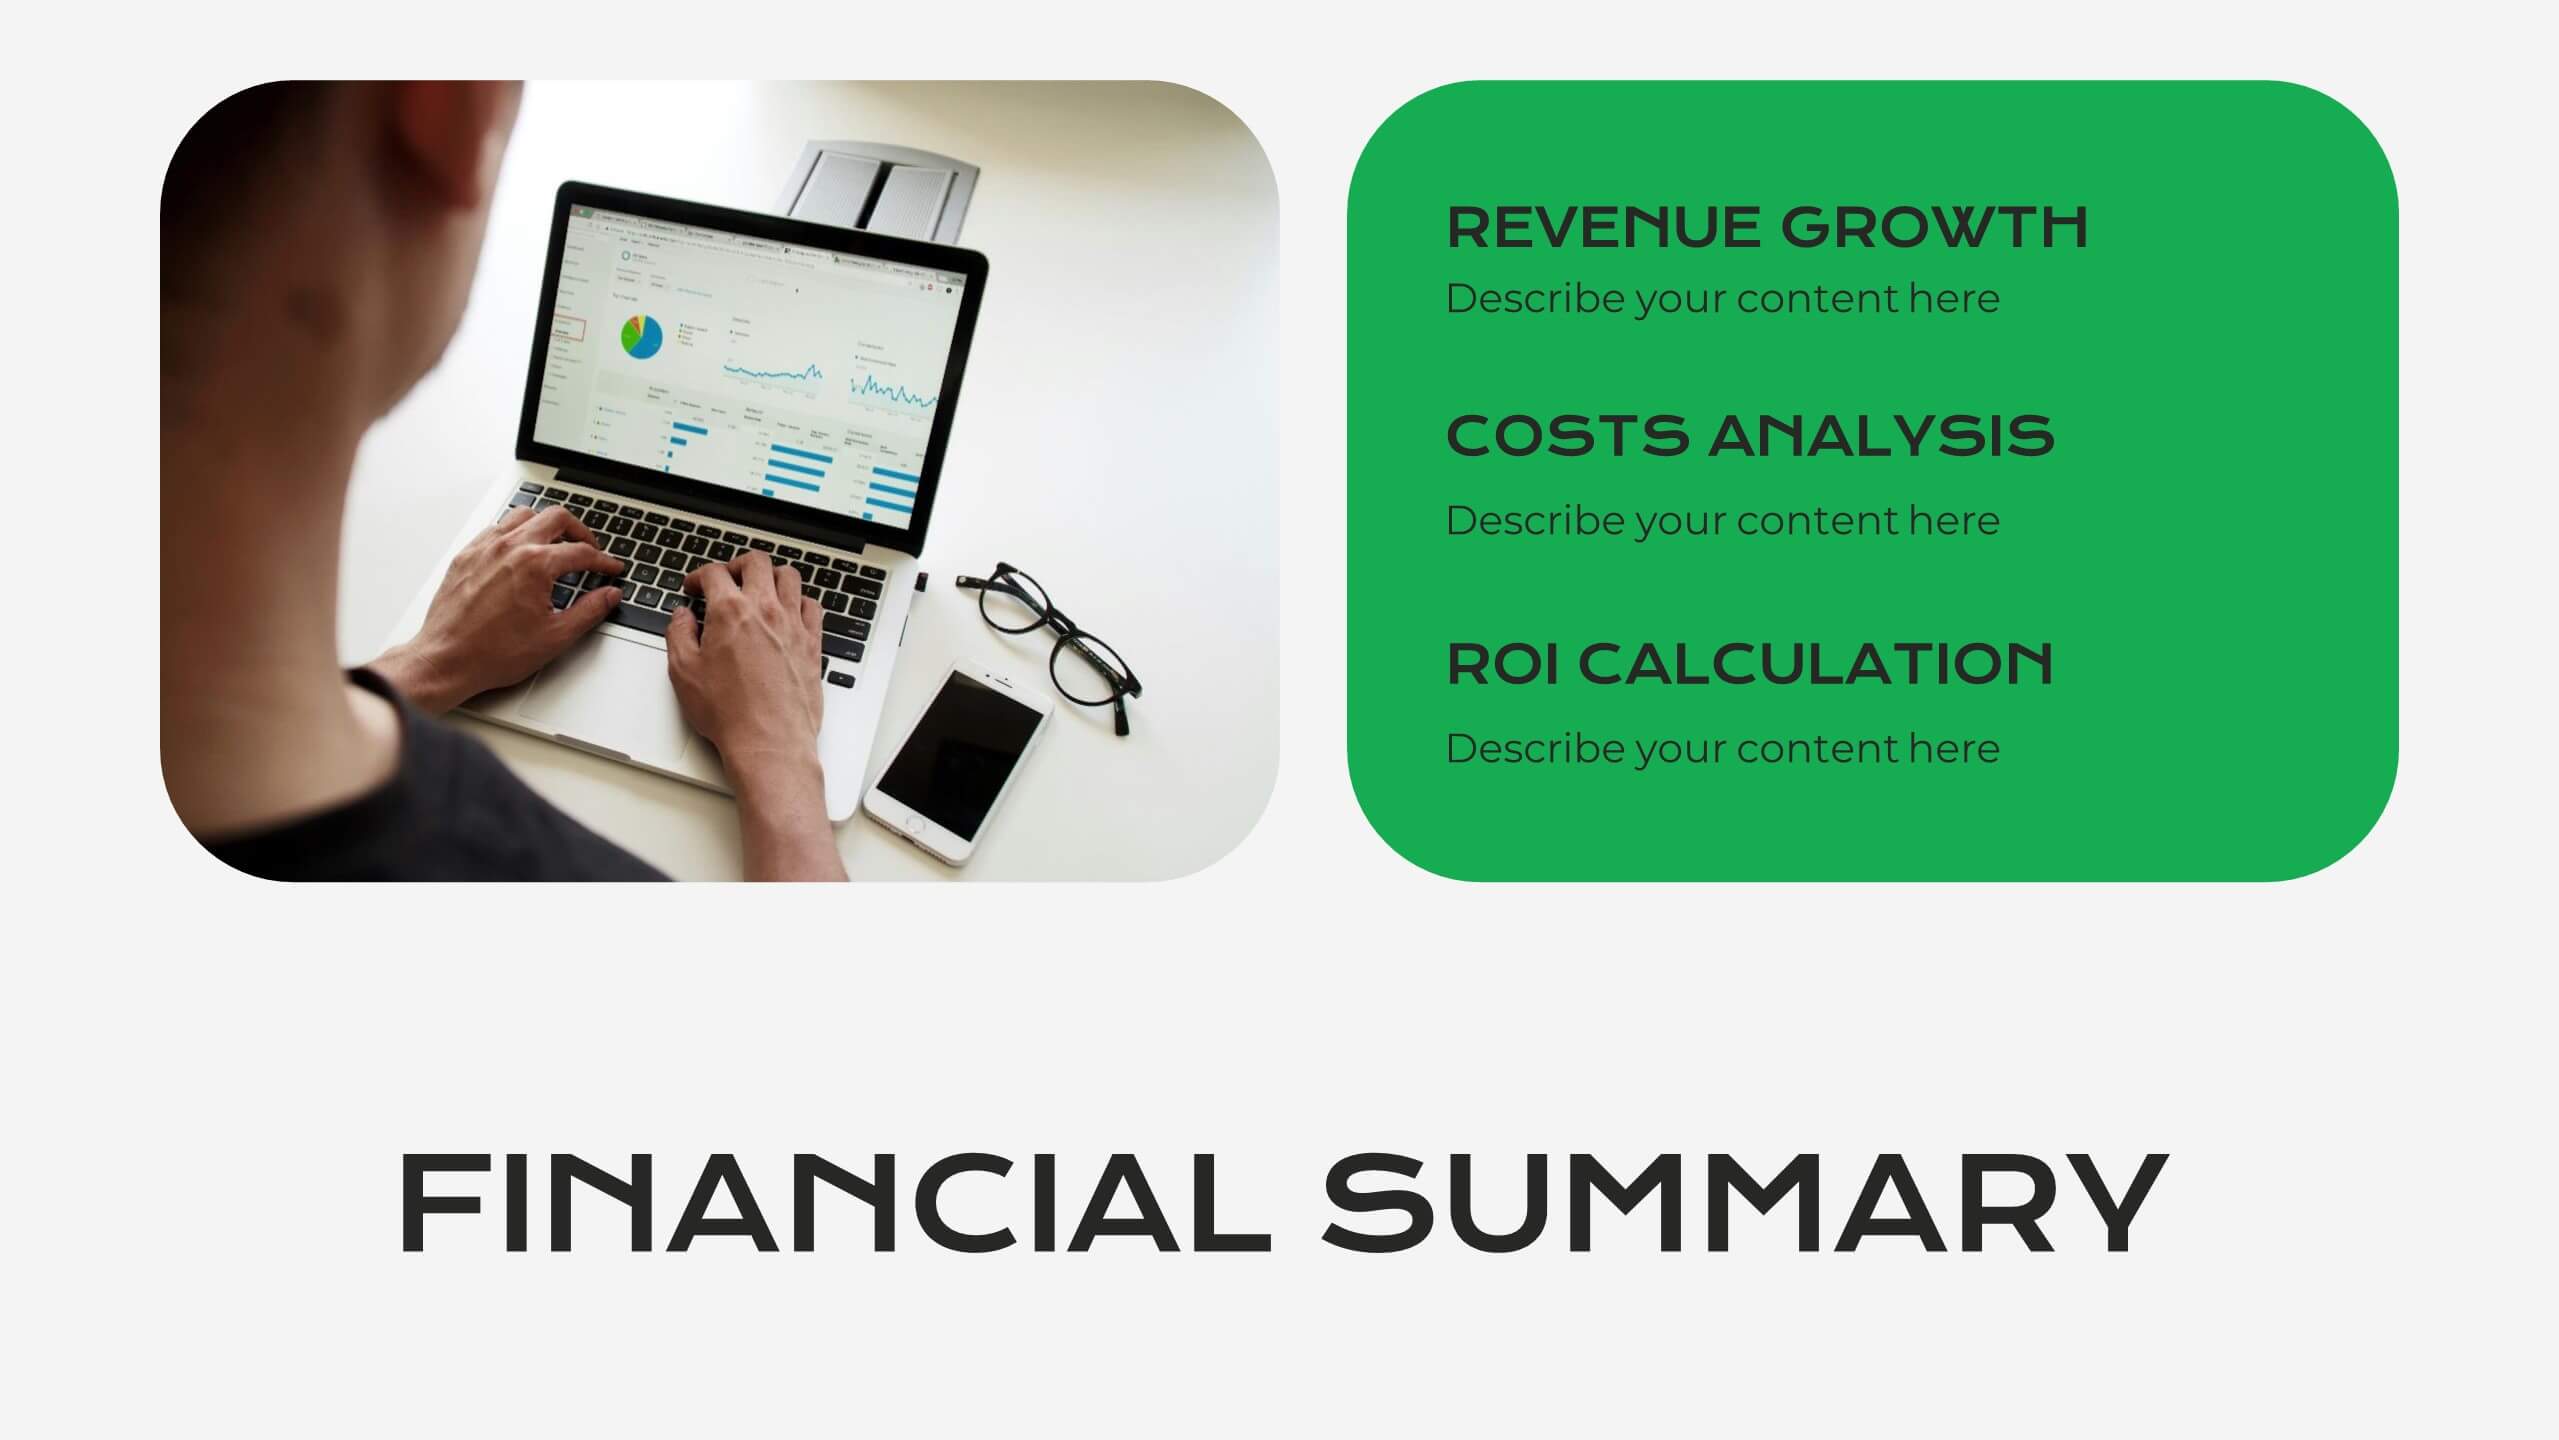
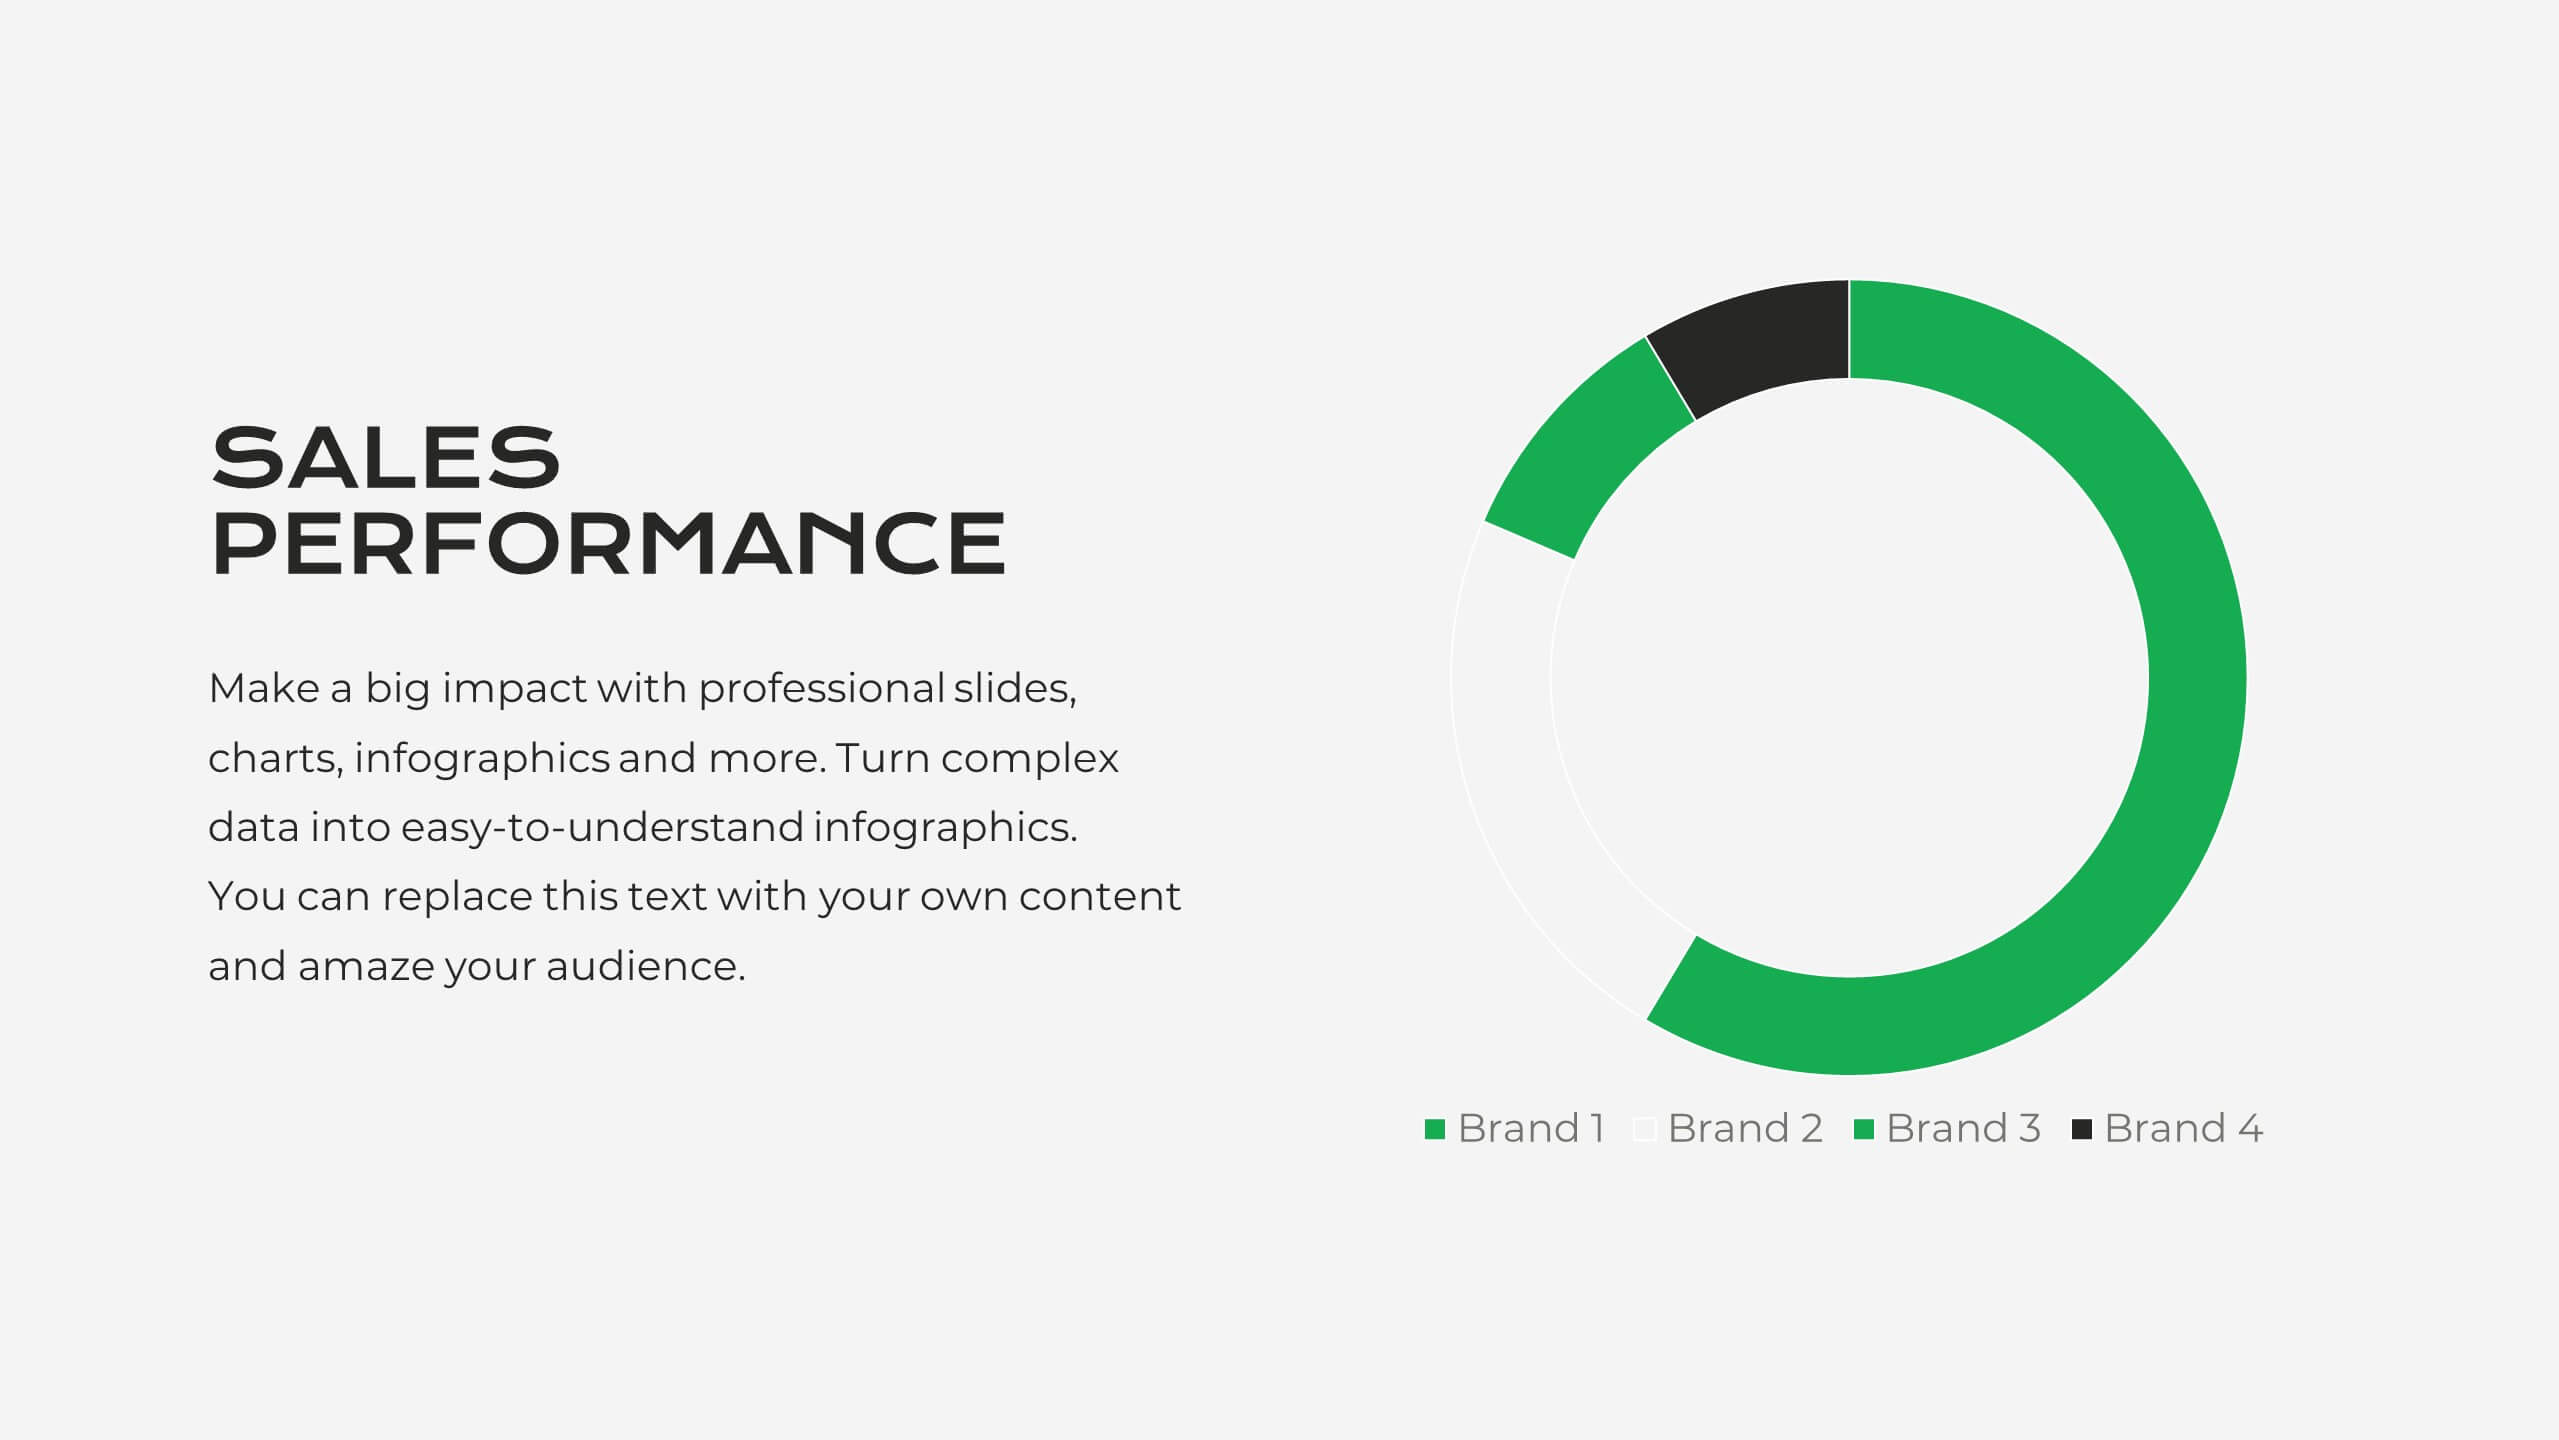
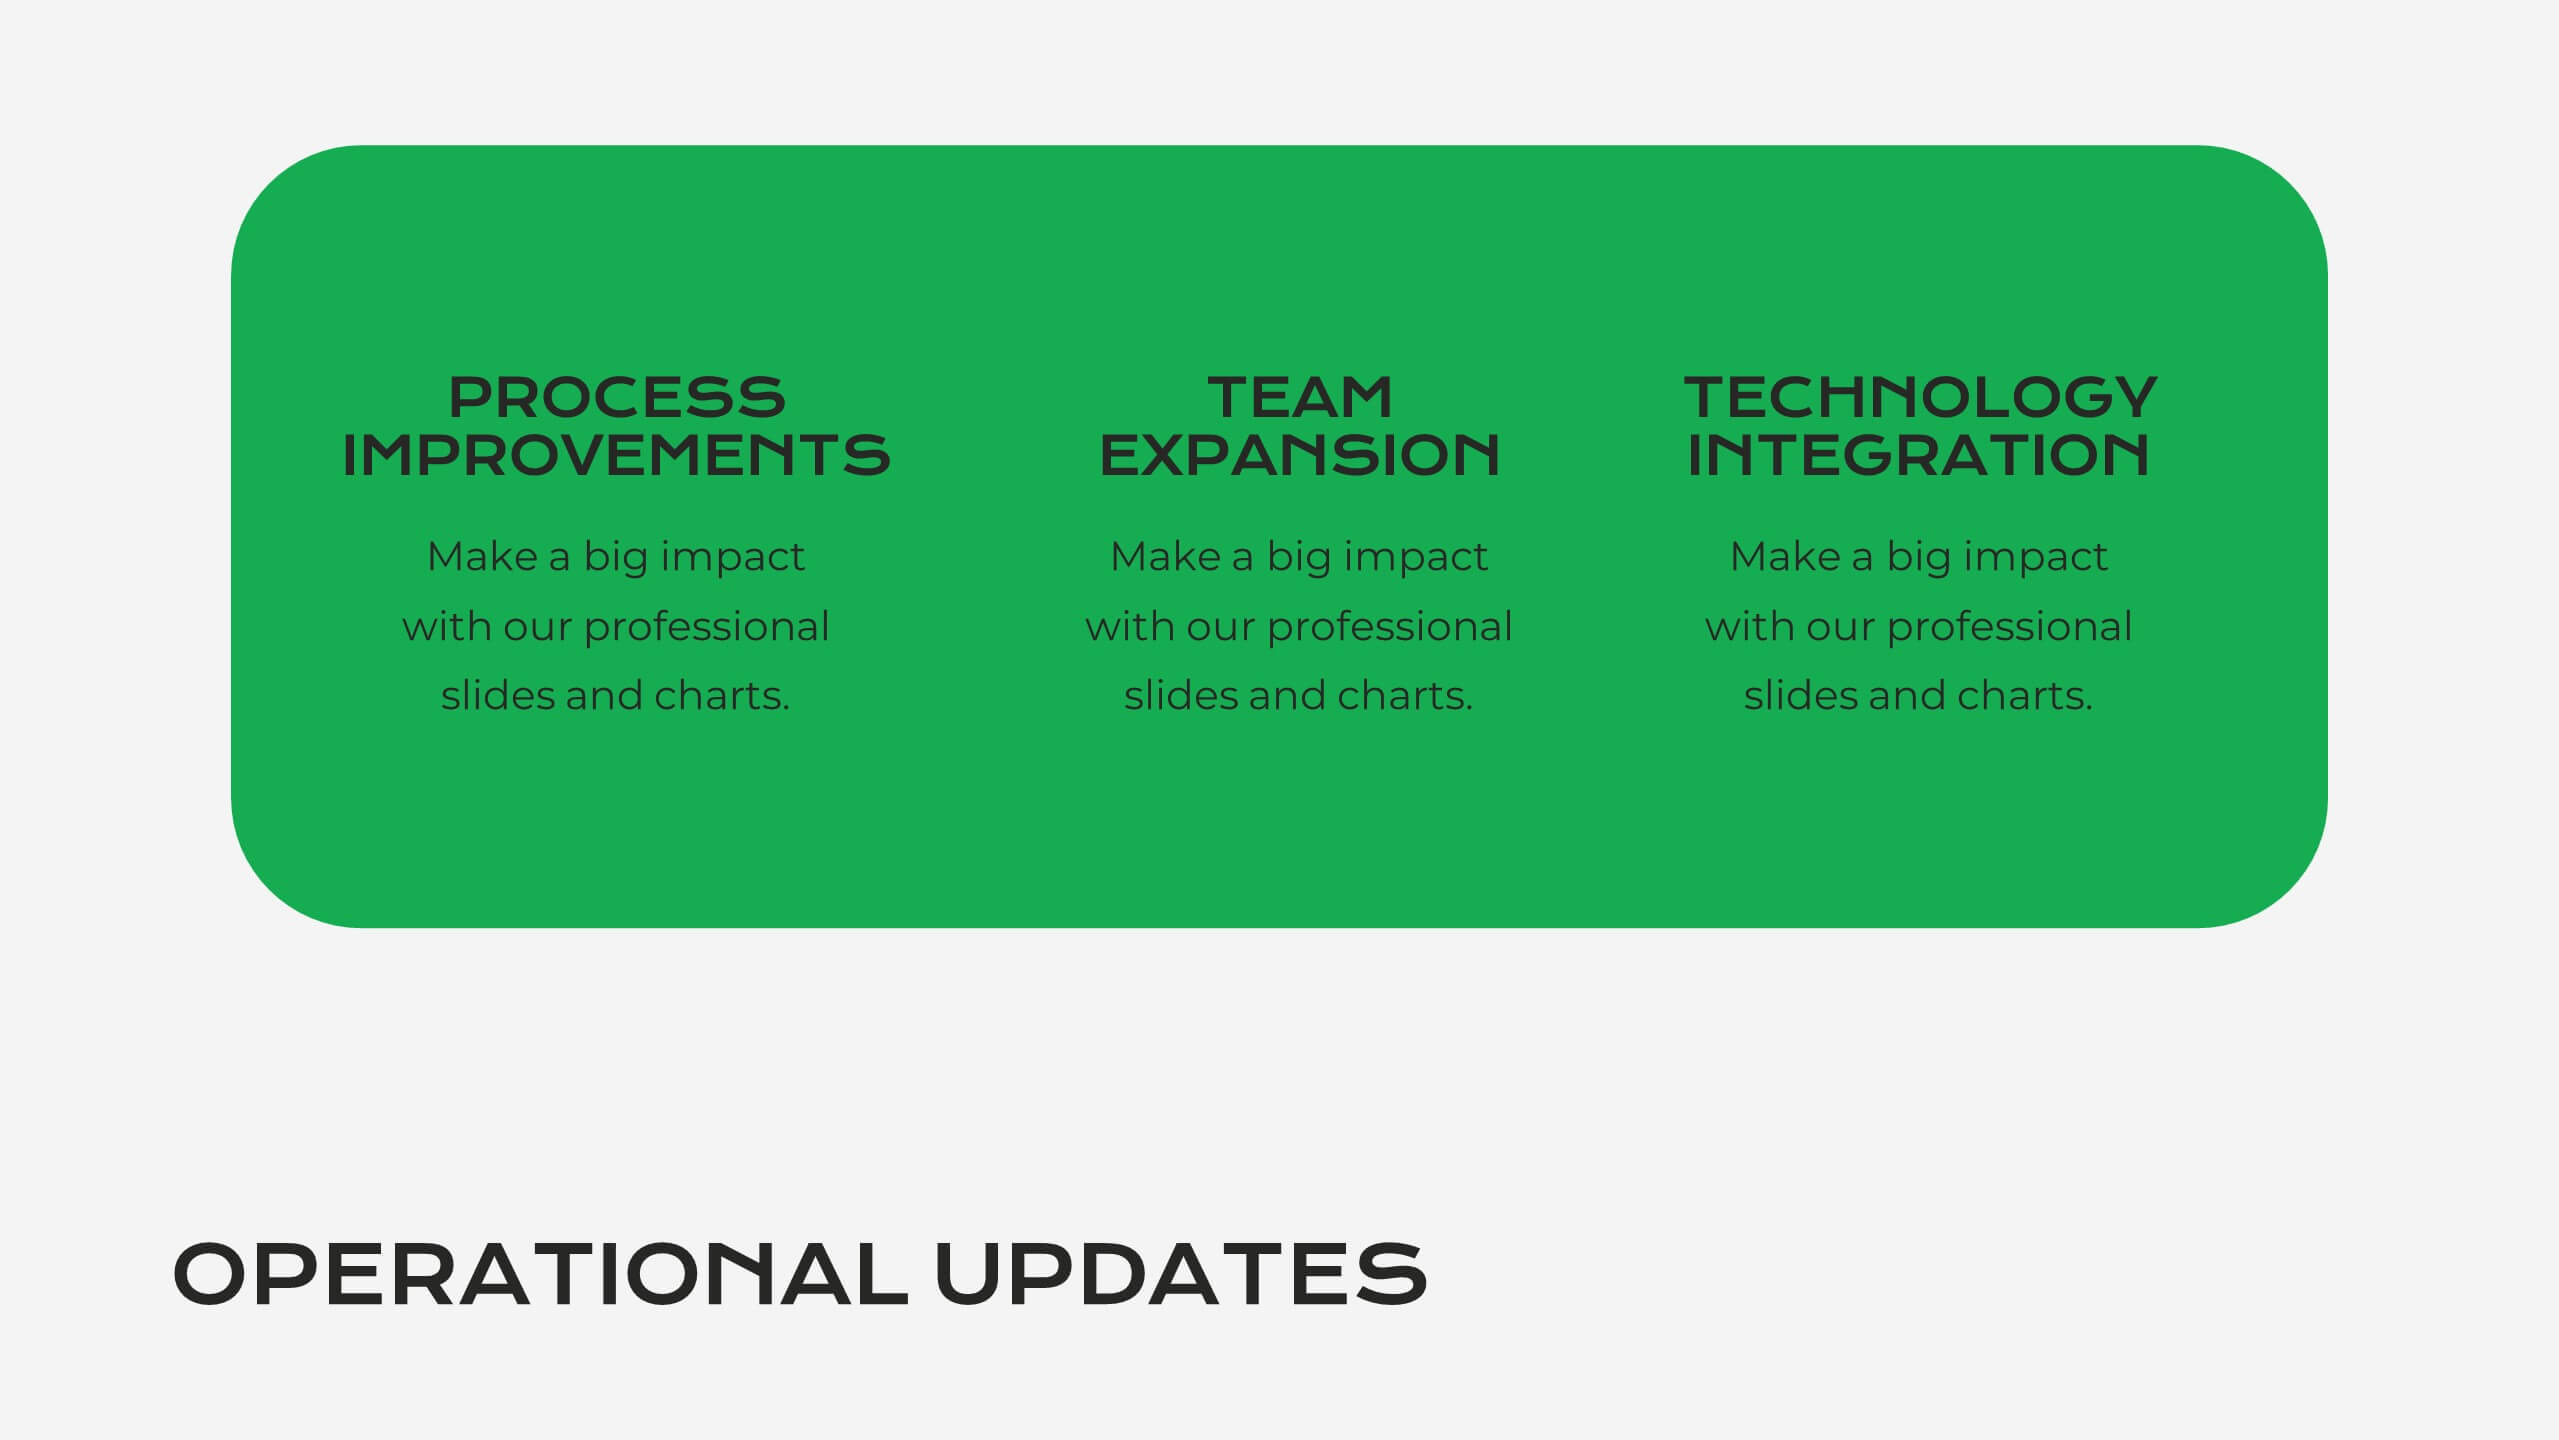
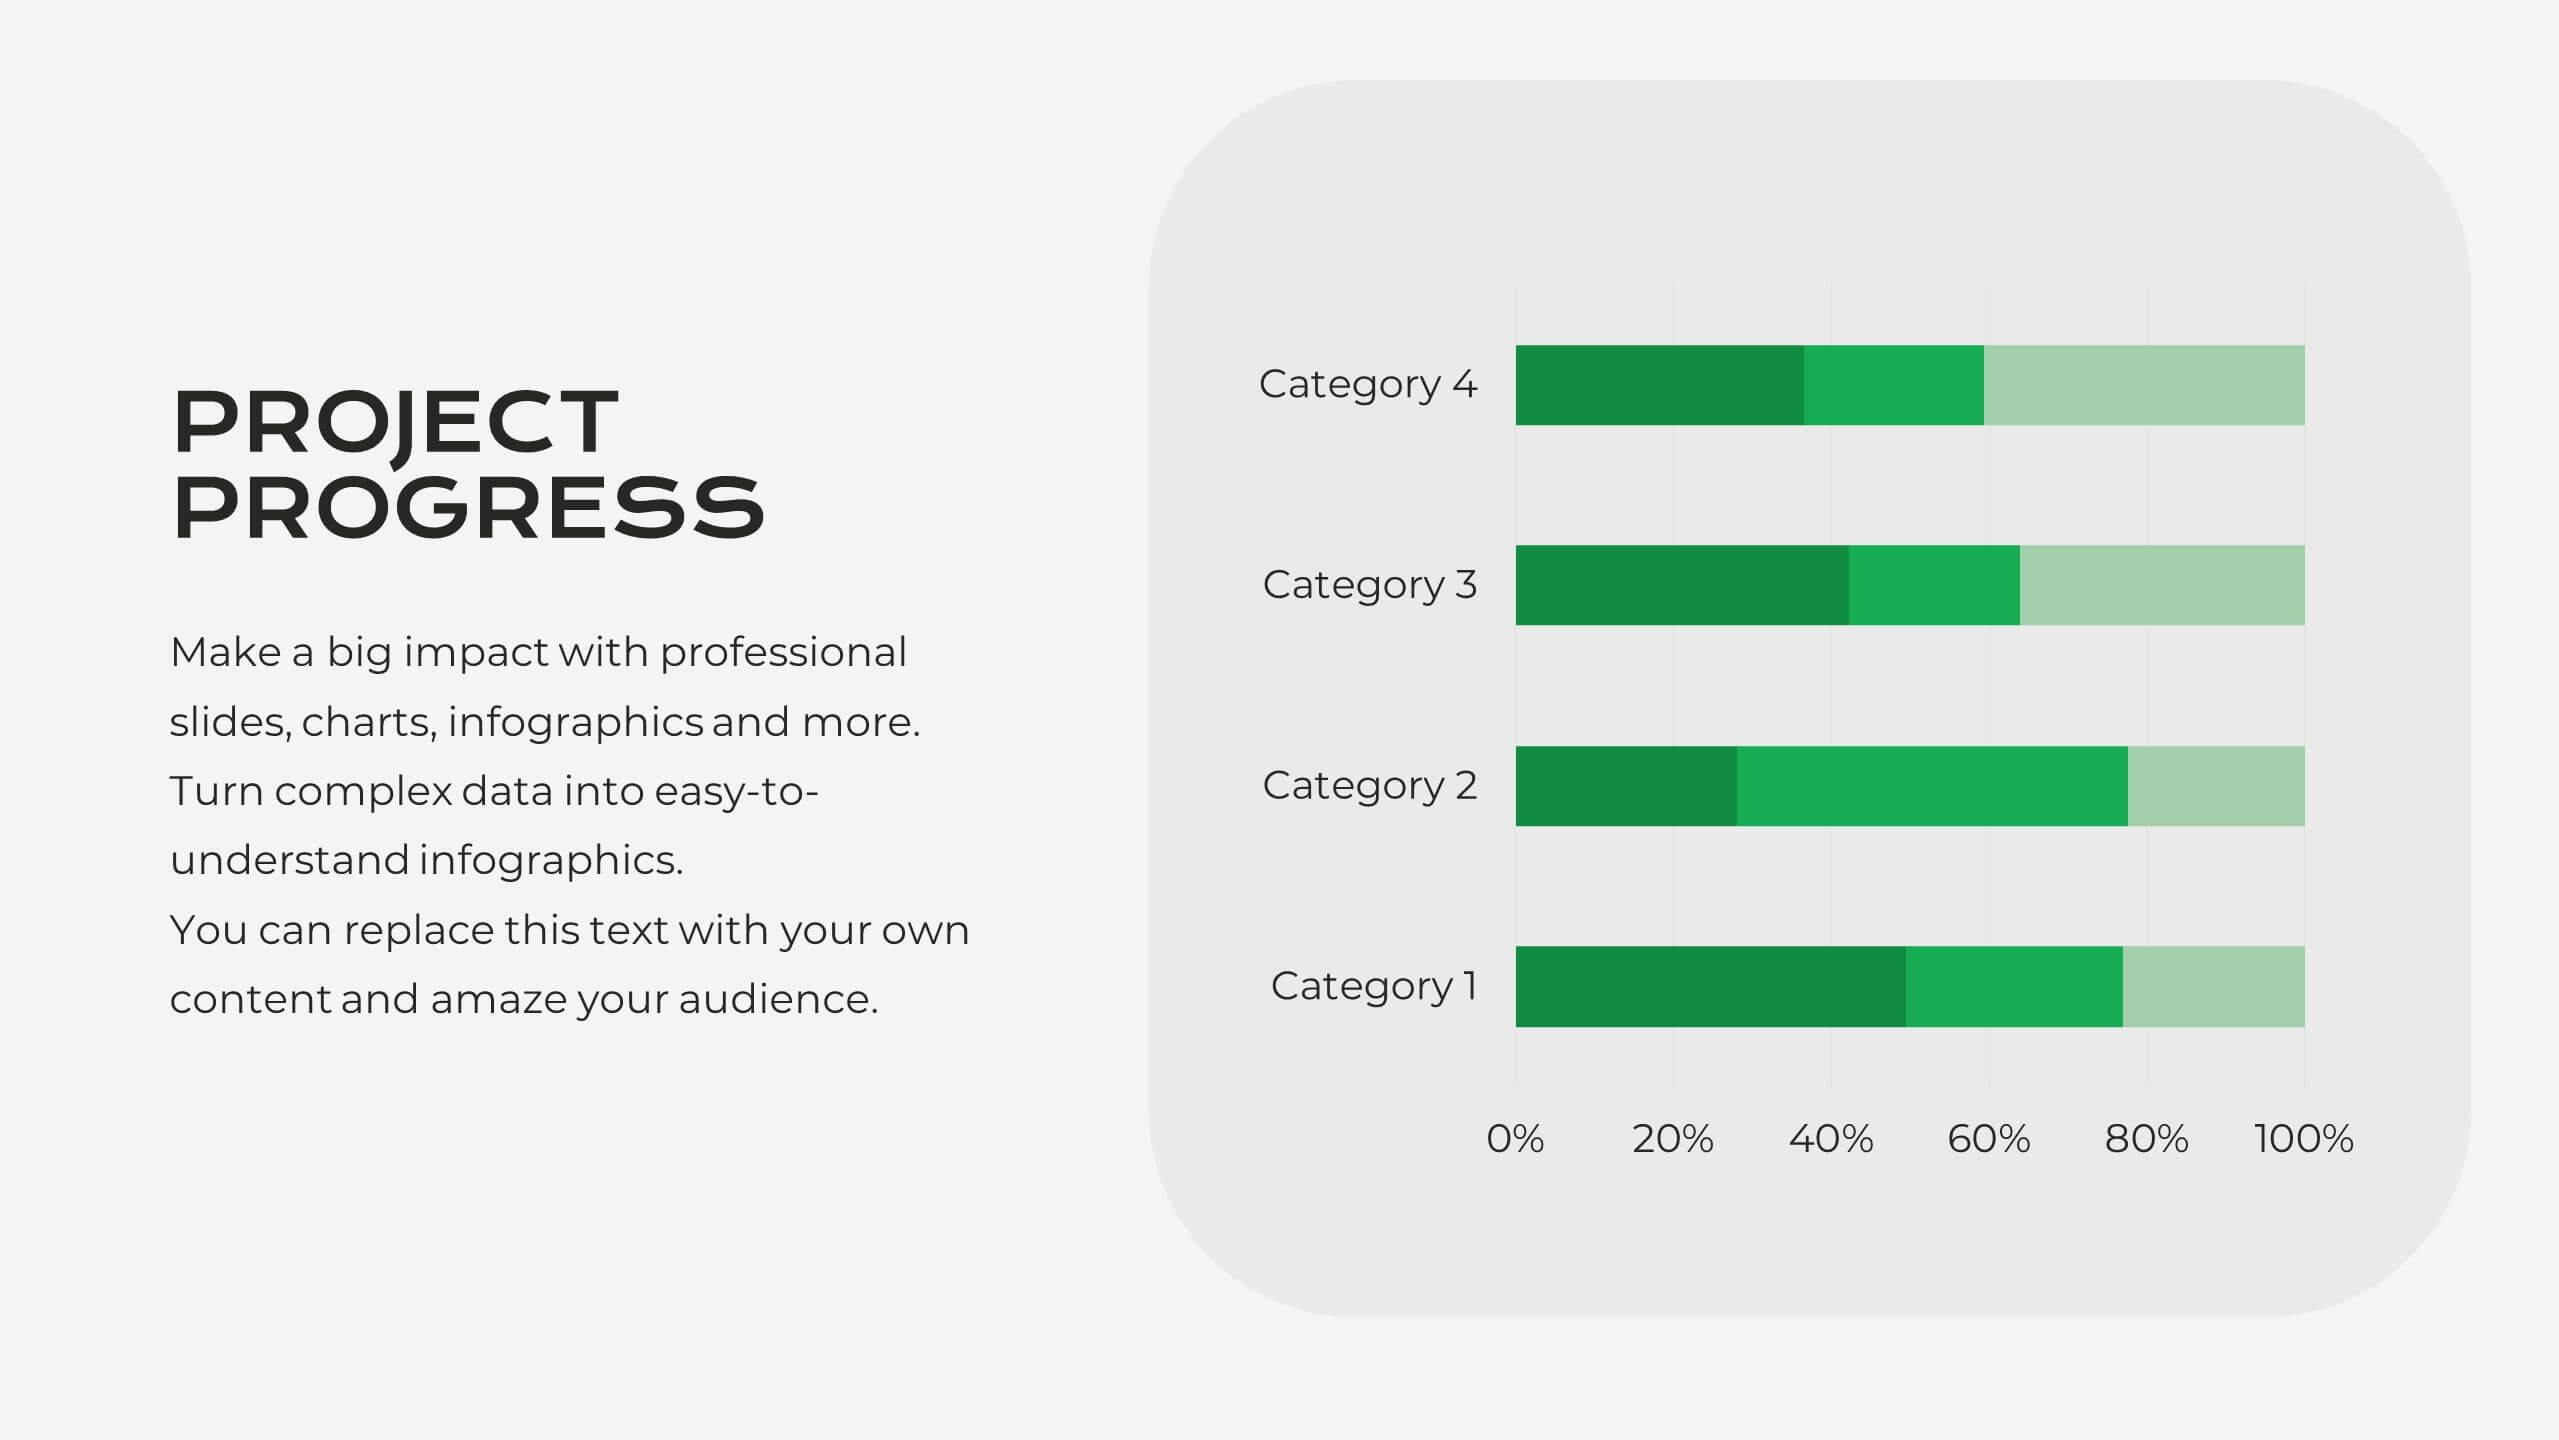
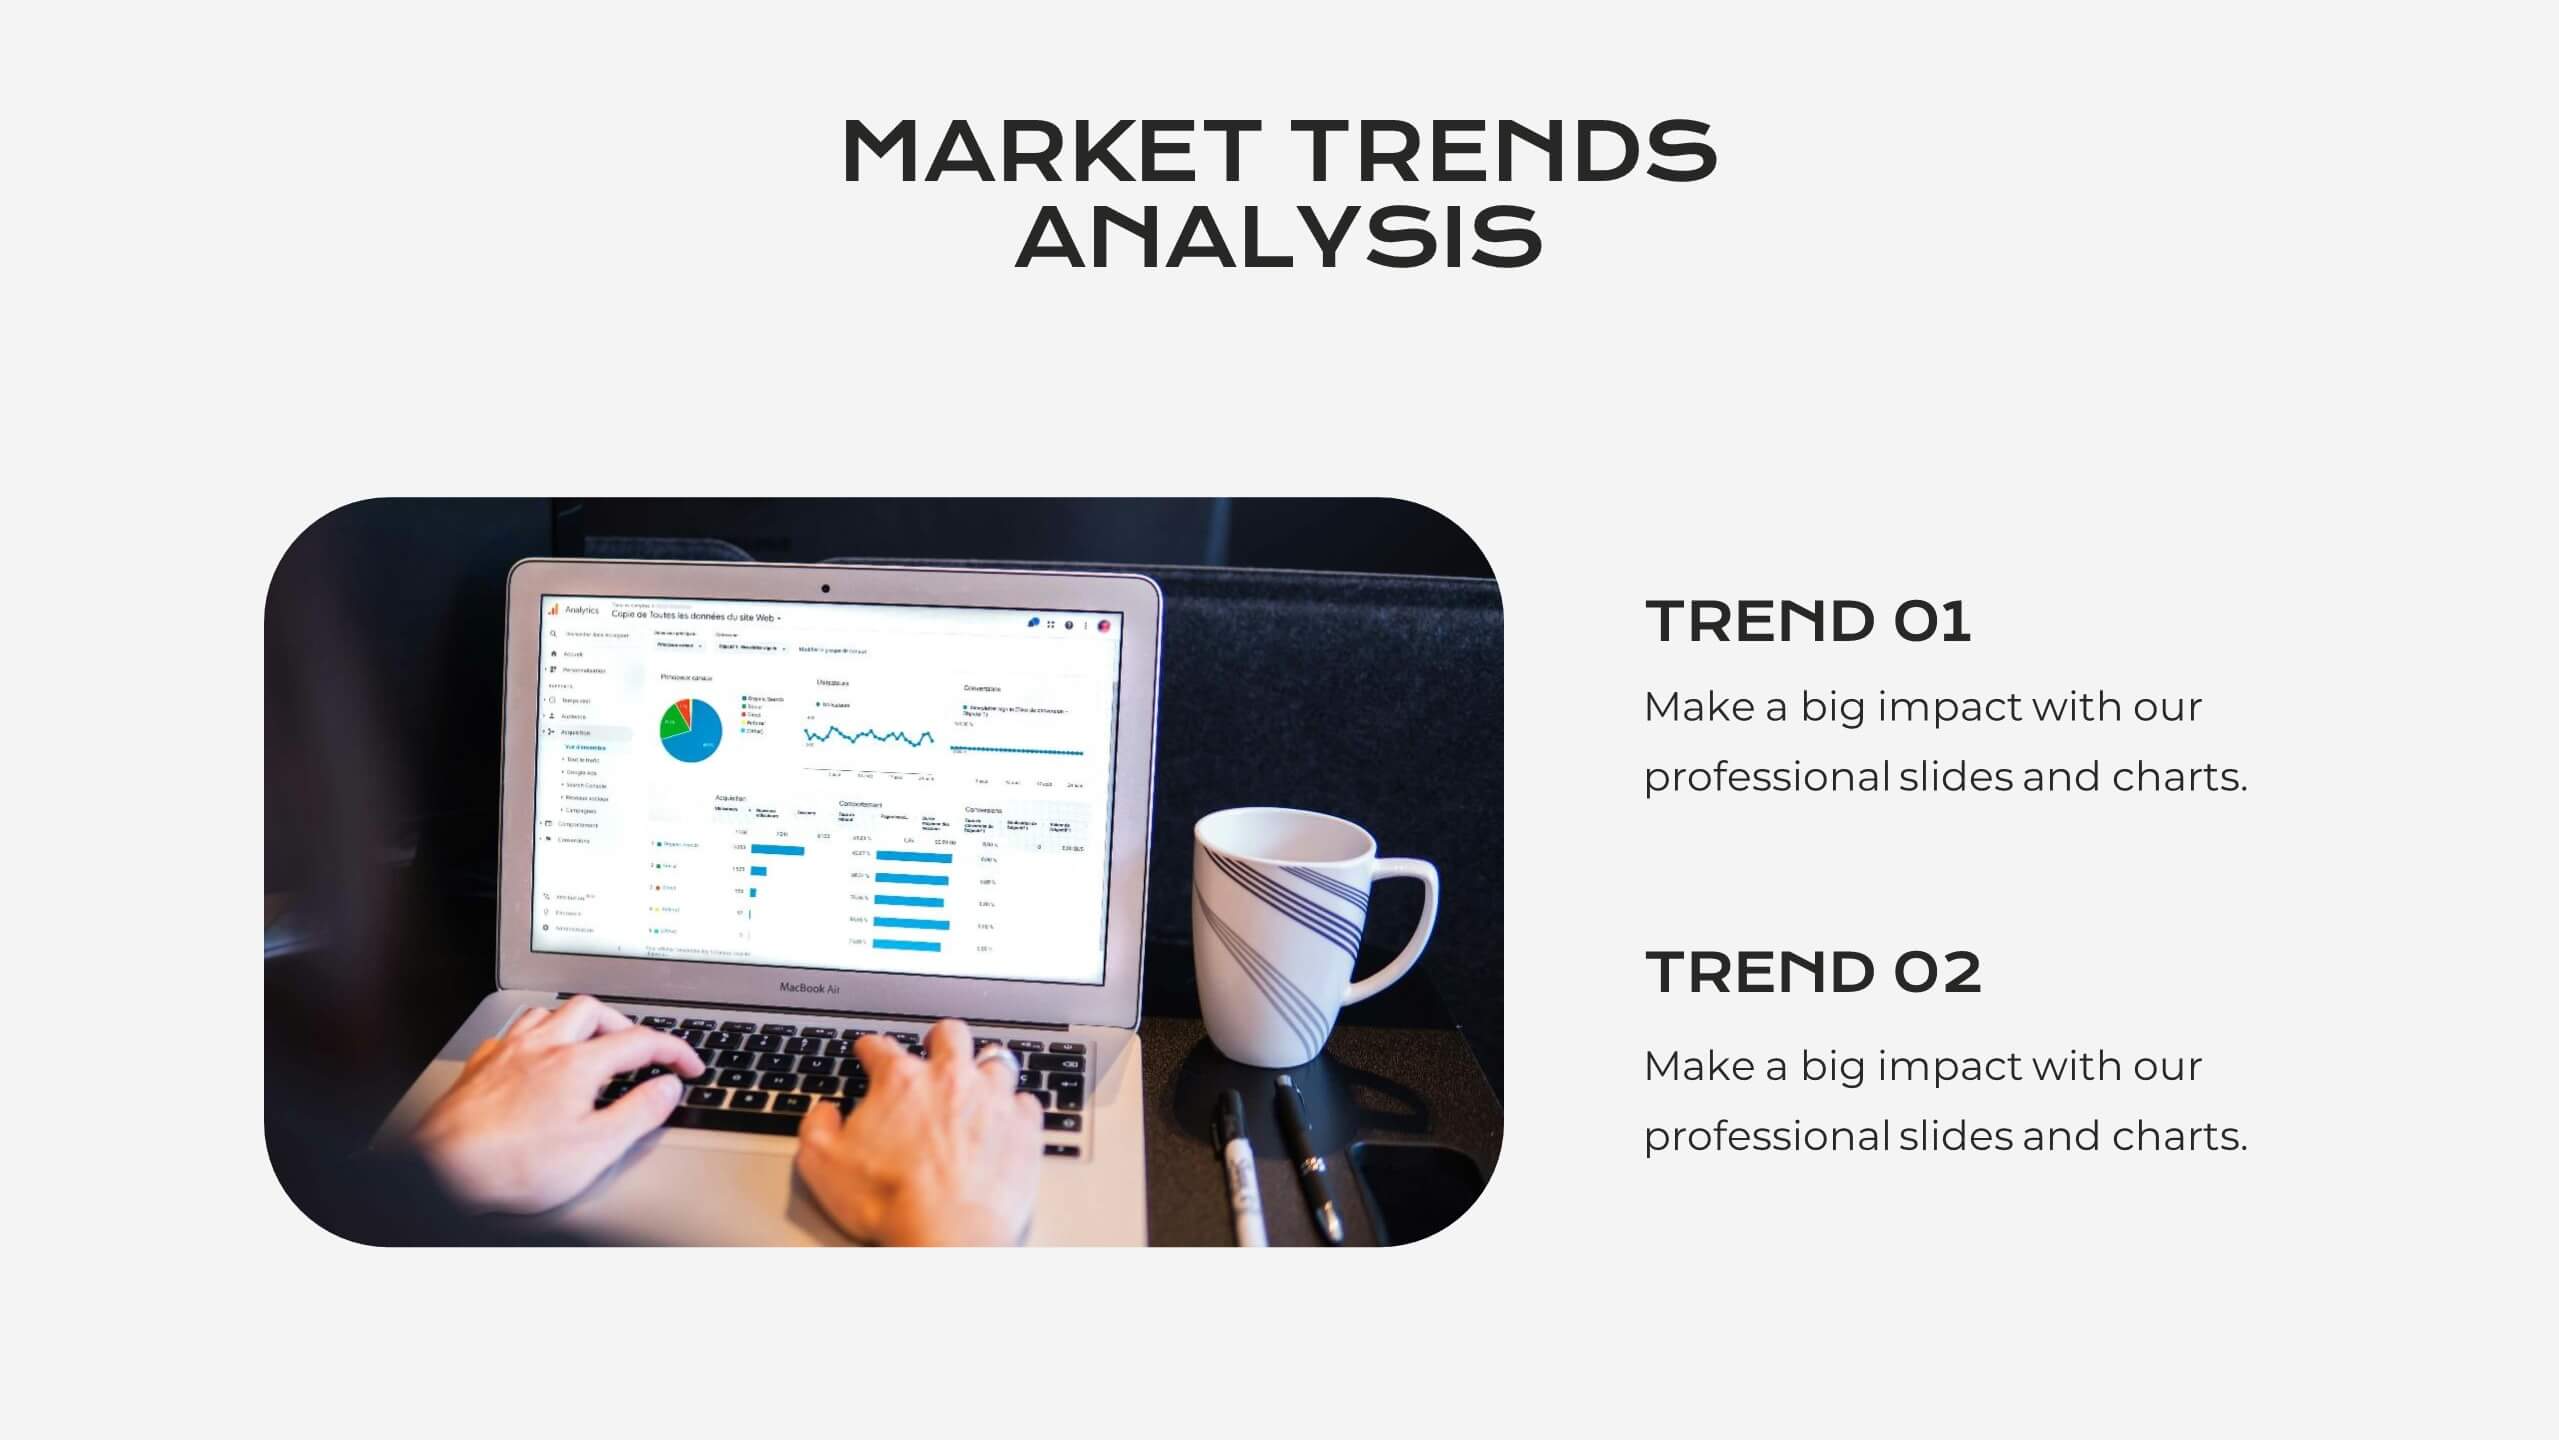
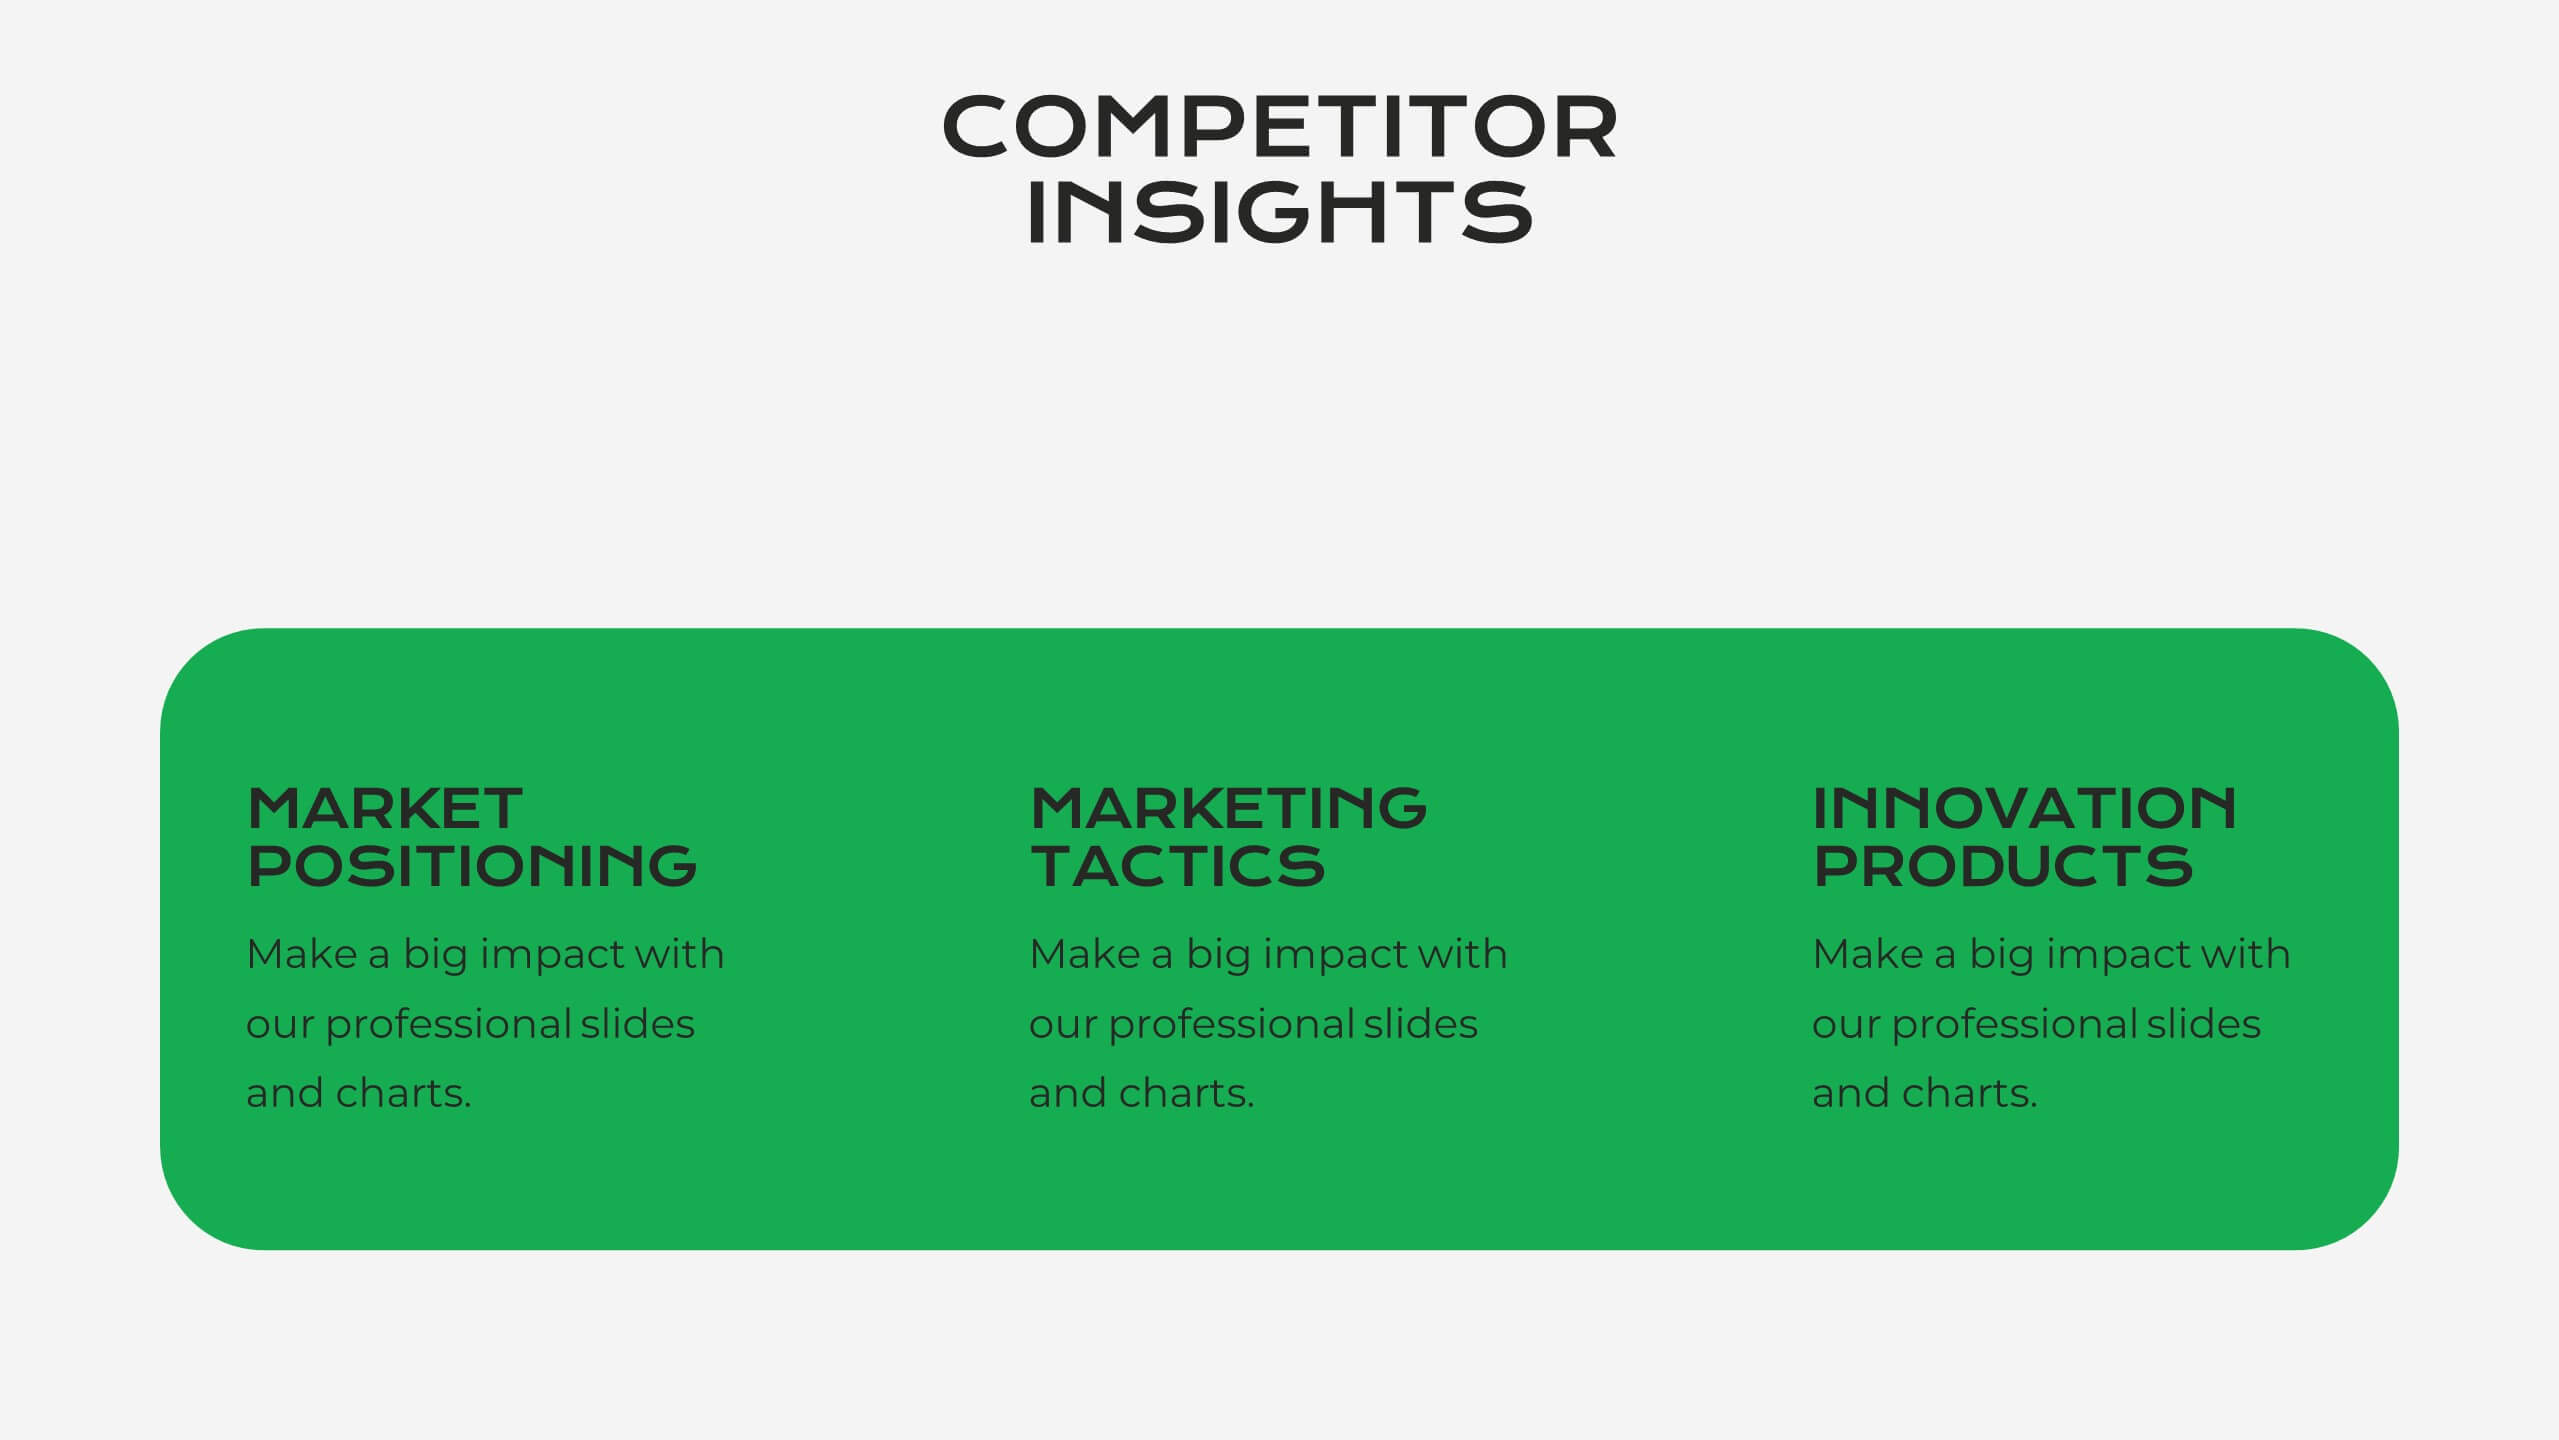
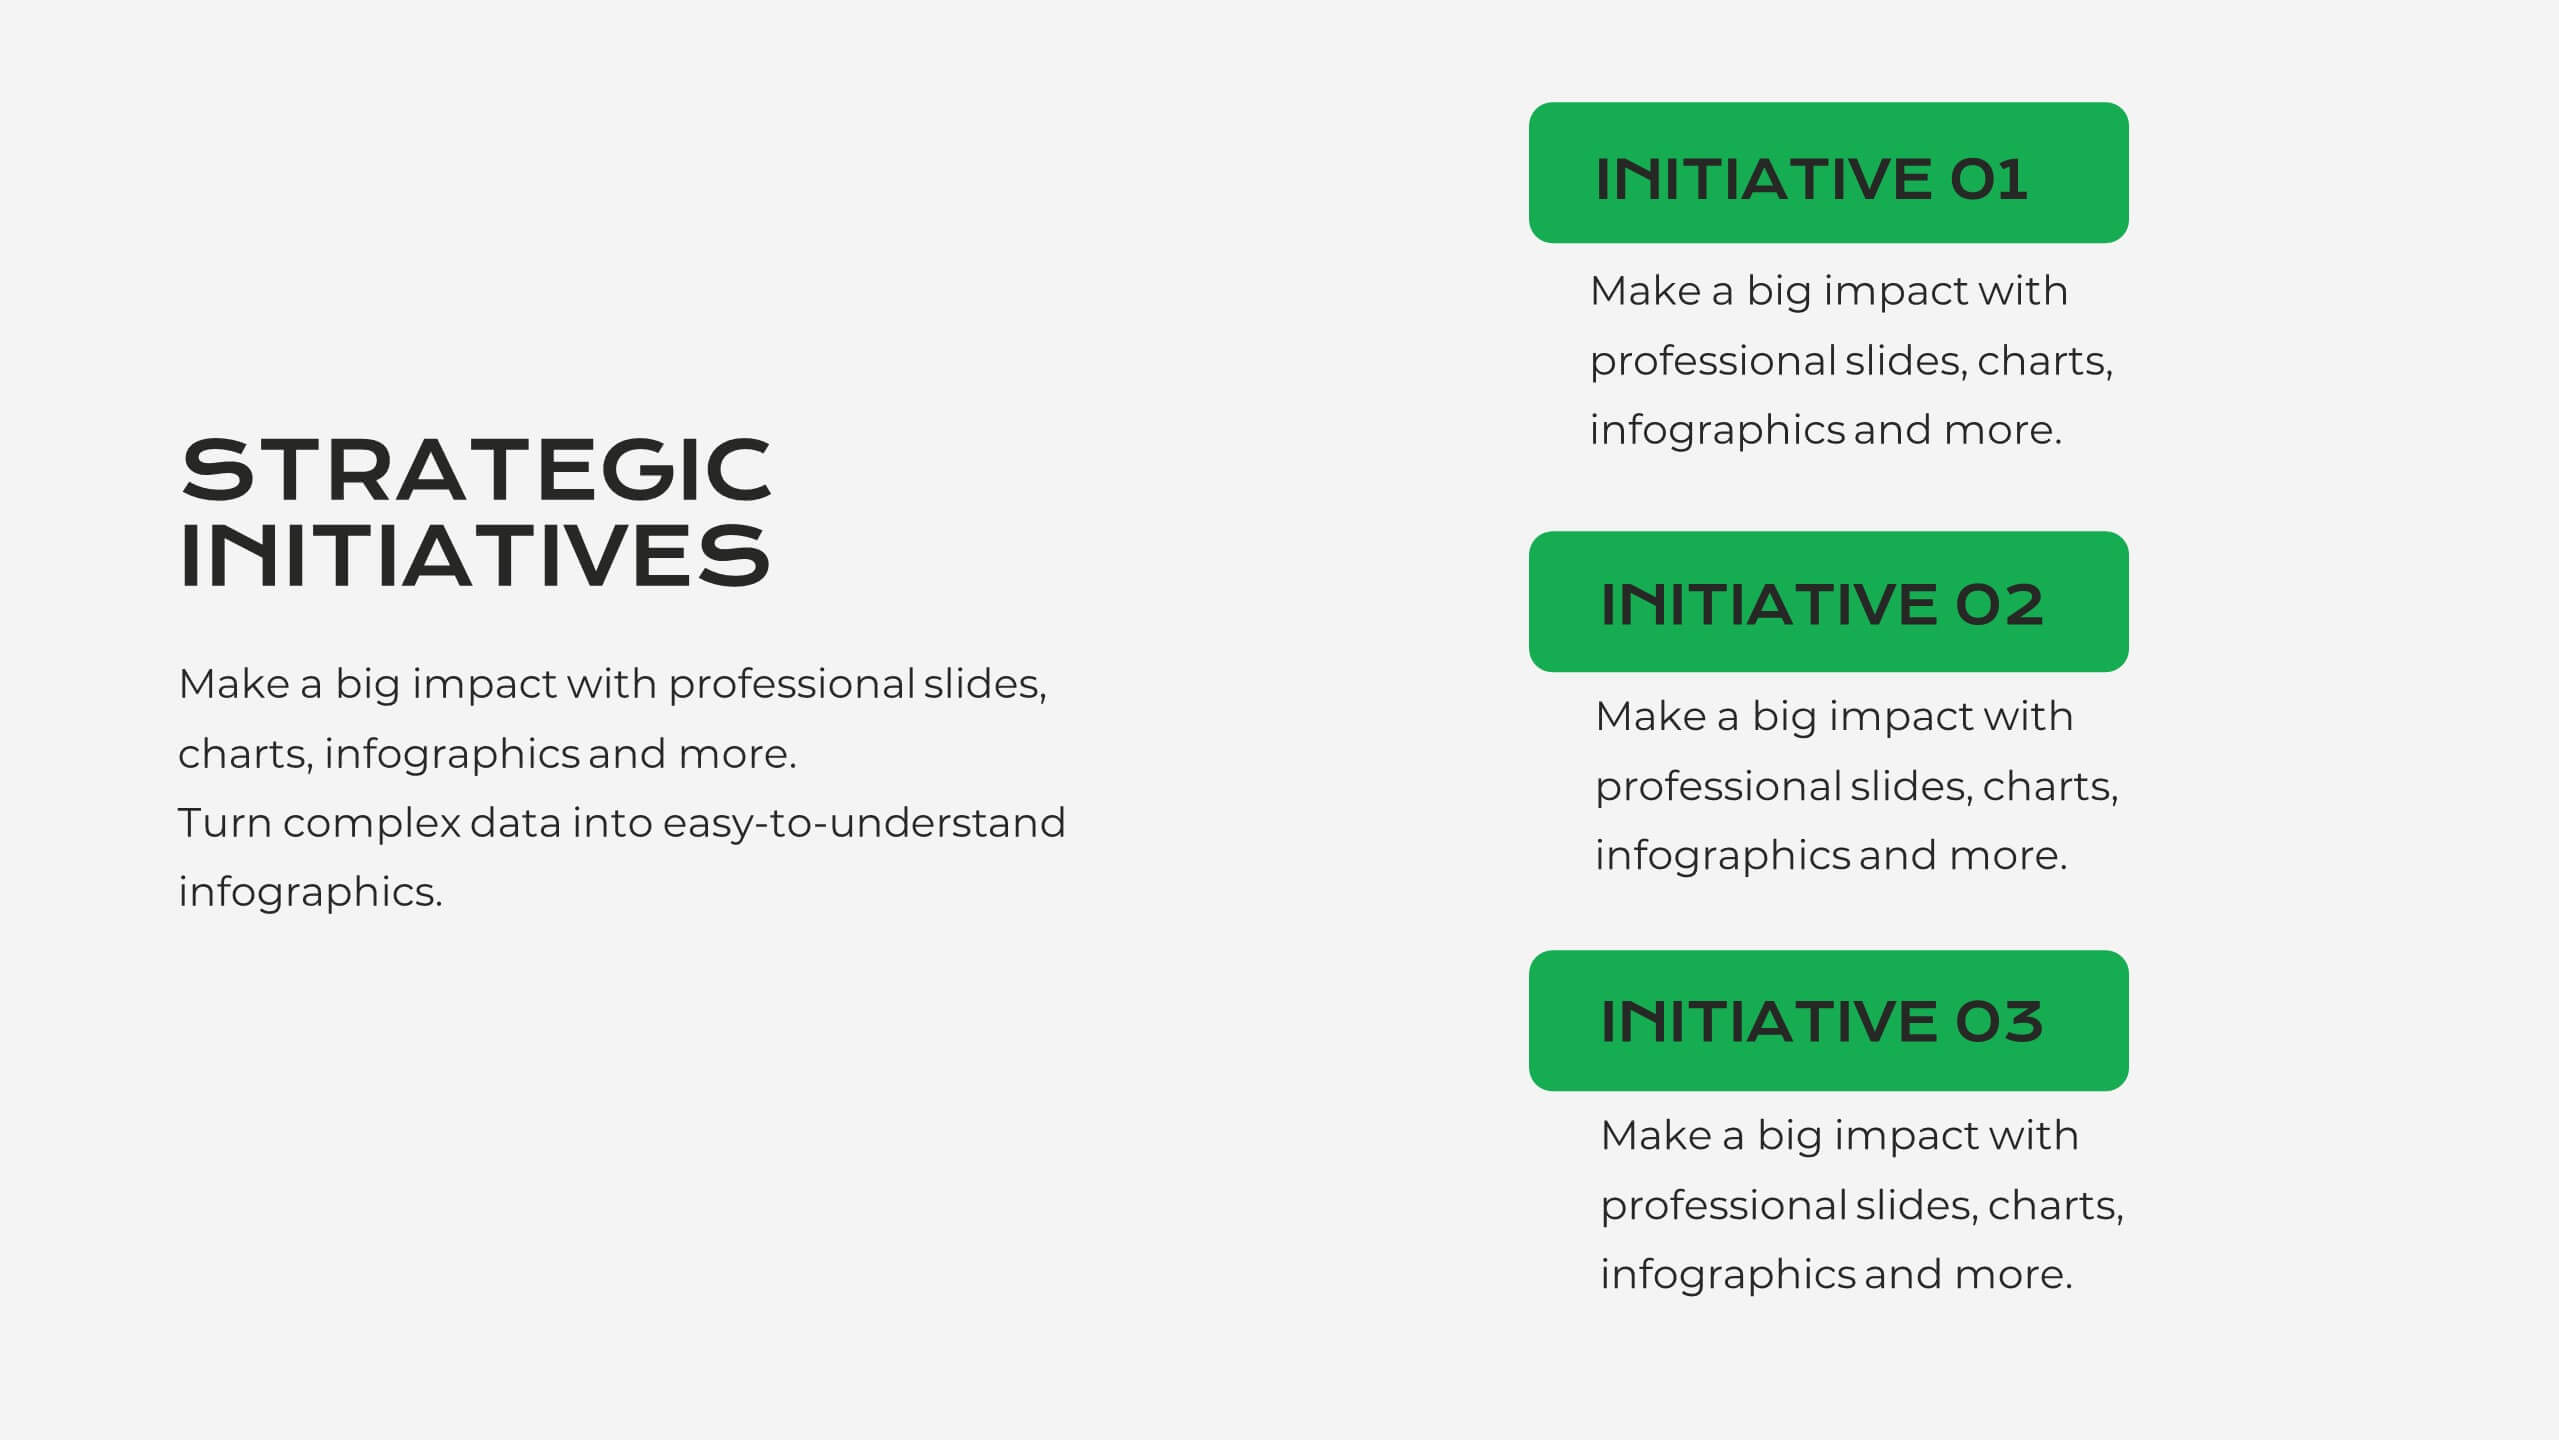
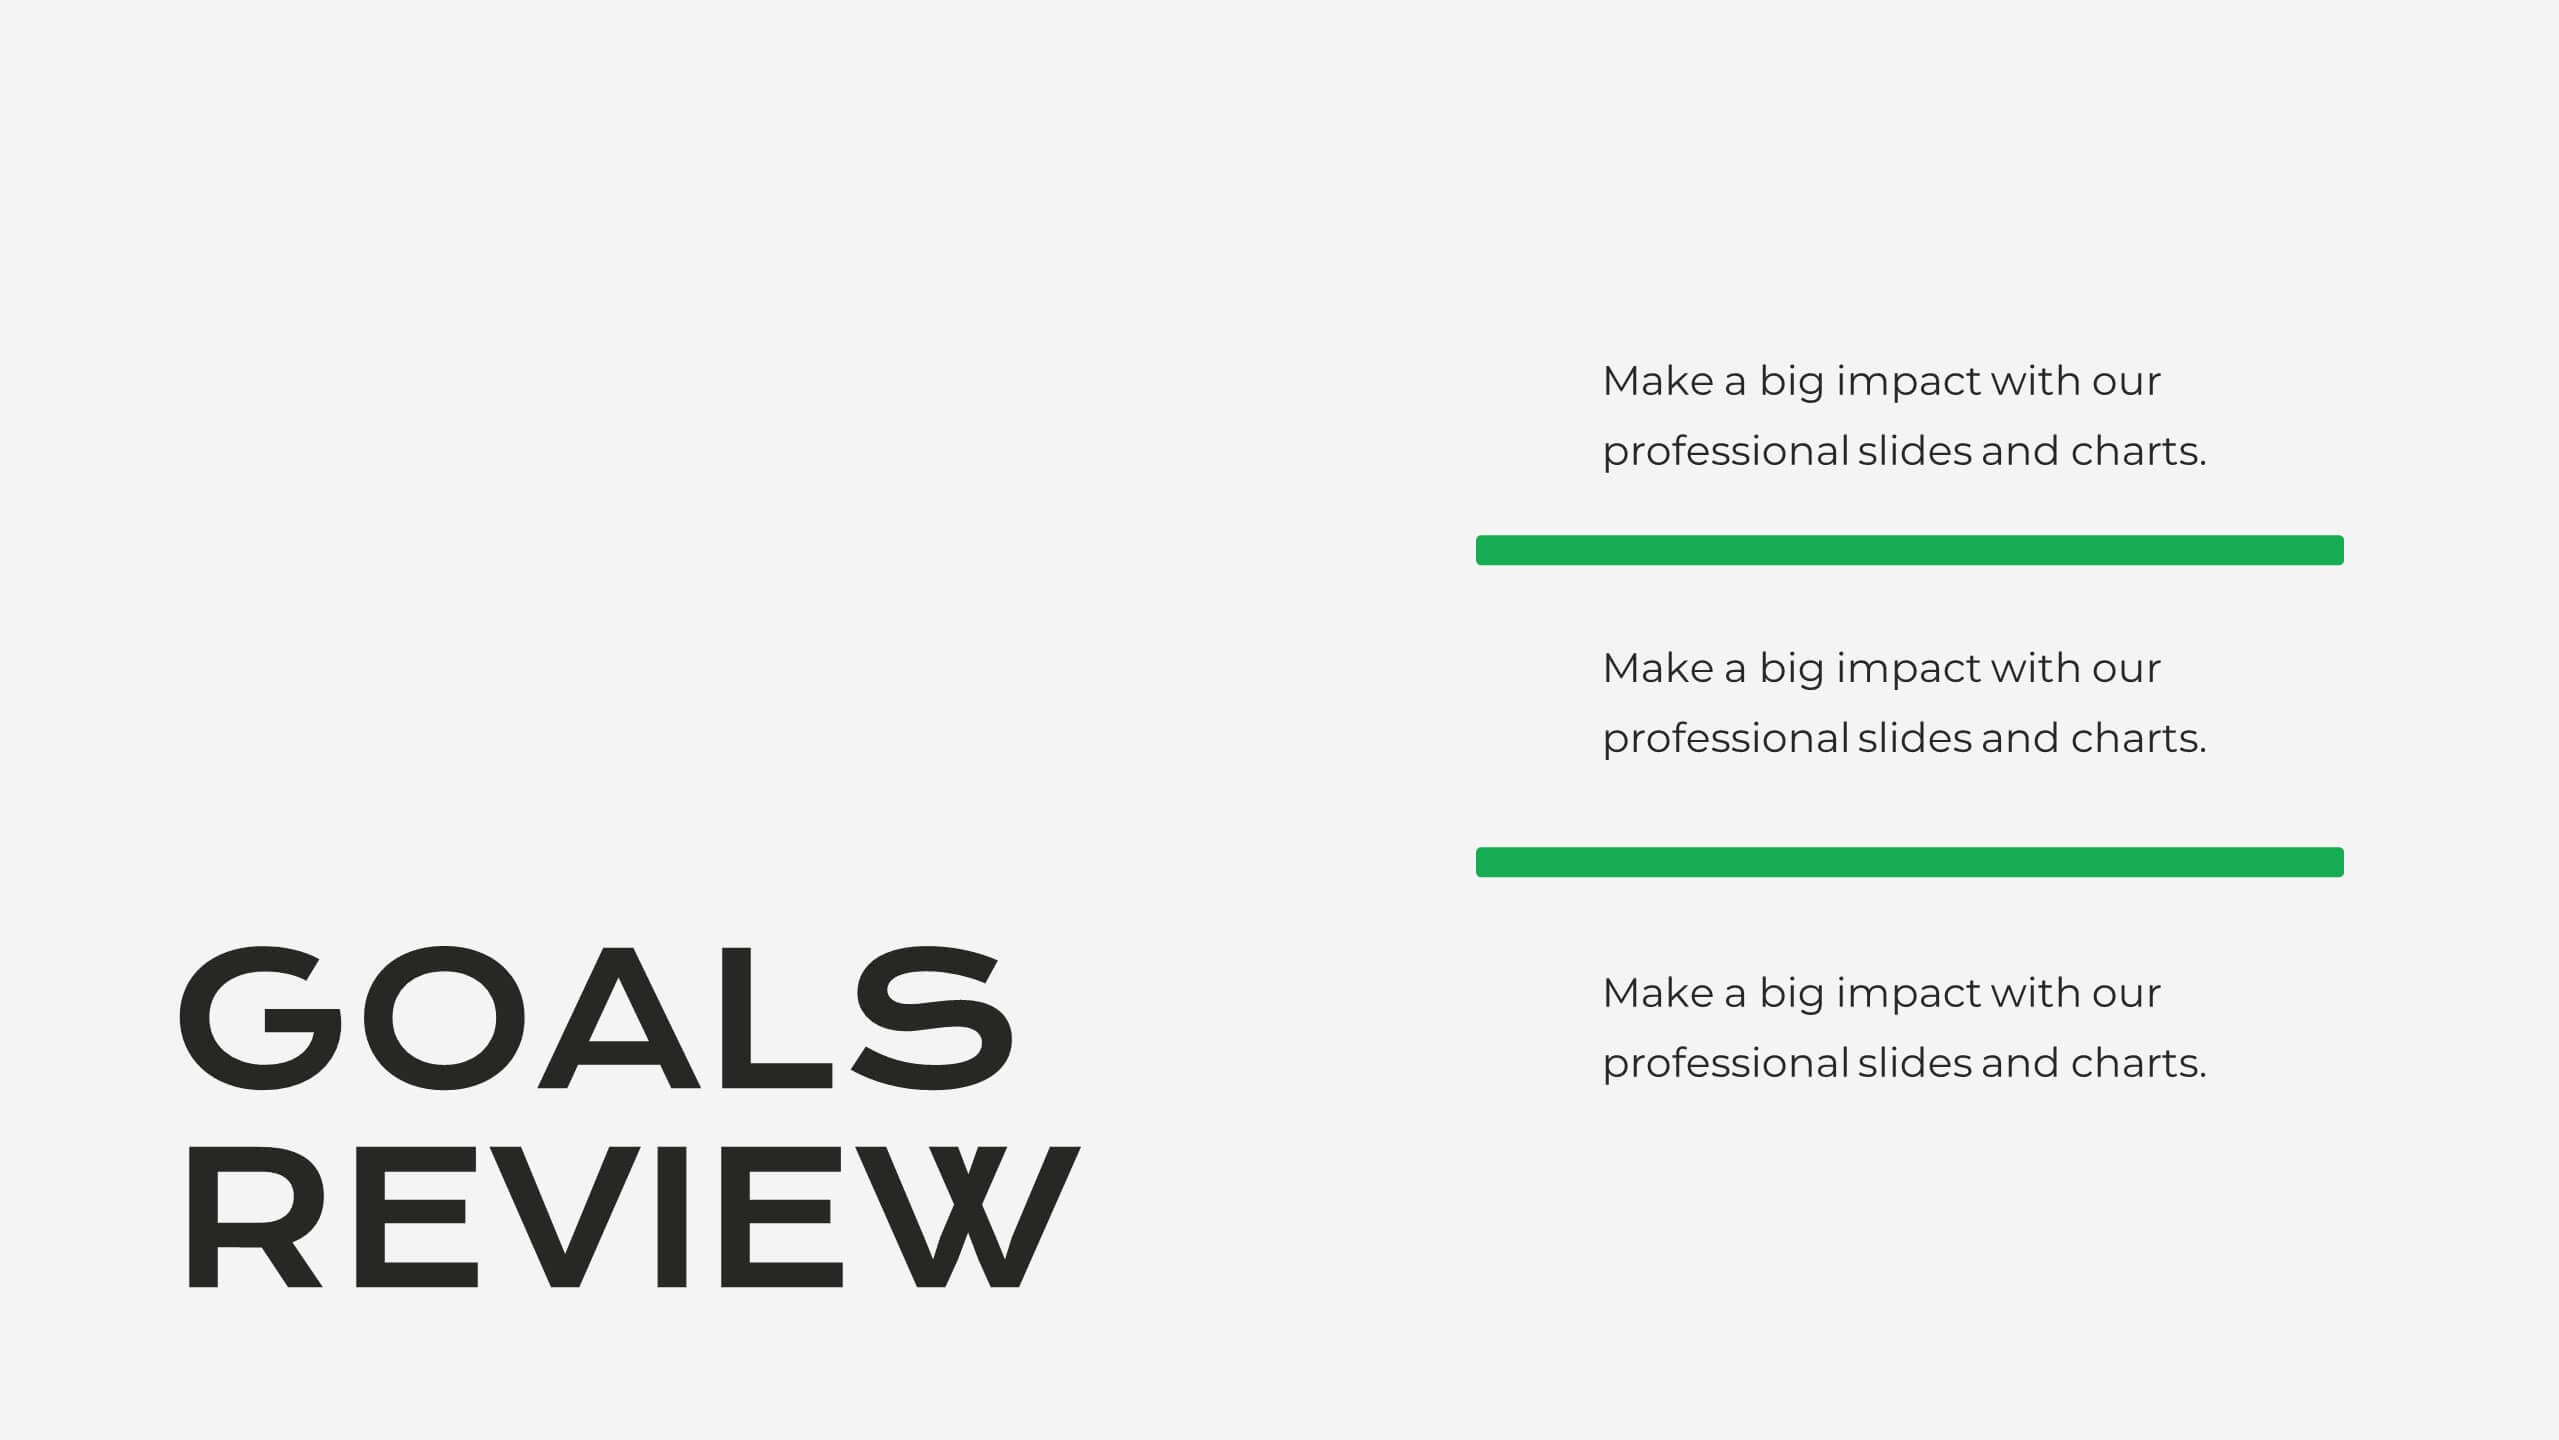
Serene Market Analysis Report Presentation
This modern and clean Market Analysis Report template is designed to help you present key data and insights with clarity and impact. Ideal for business professionals and analysts, it includes slides for key highlights, performance metrics, financial summaries, competitor insights, and strategic initiatives. The template's sleek layout ensures that your data is easy to understand and visually appealing, making it perfect for internal reports or client presentations. Customize it effortlessly in PowerPoint, Keynote, or Google Slides, and impress your audience with a polished and professional report.


21 diapositivas
Ember Agile Project Plan Presentation
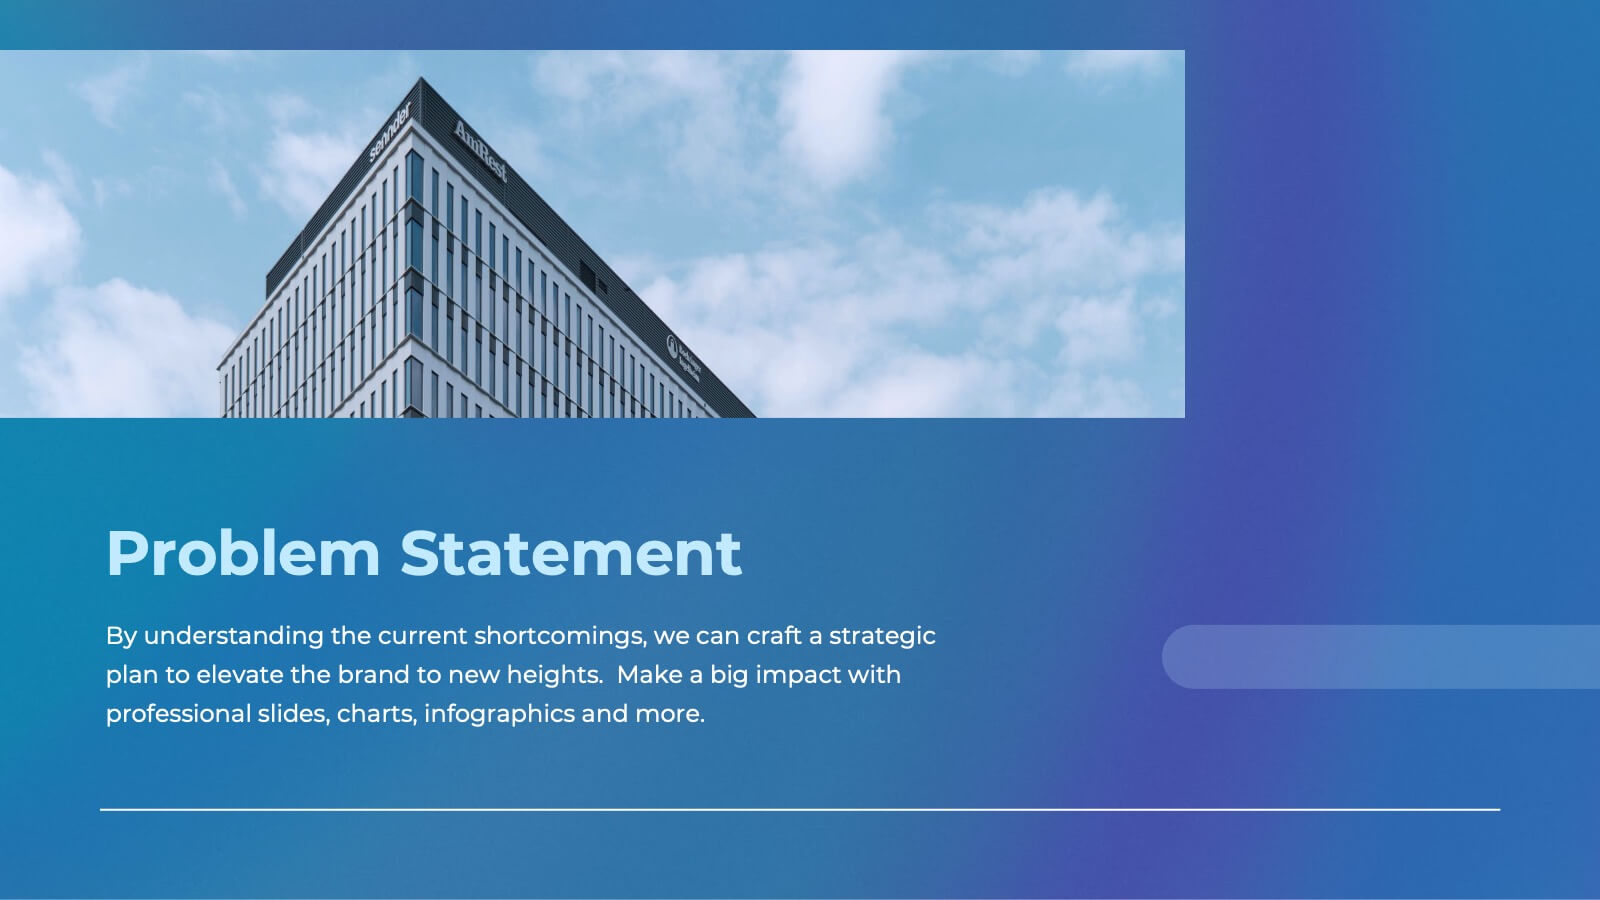
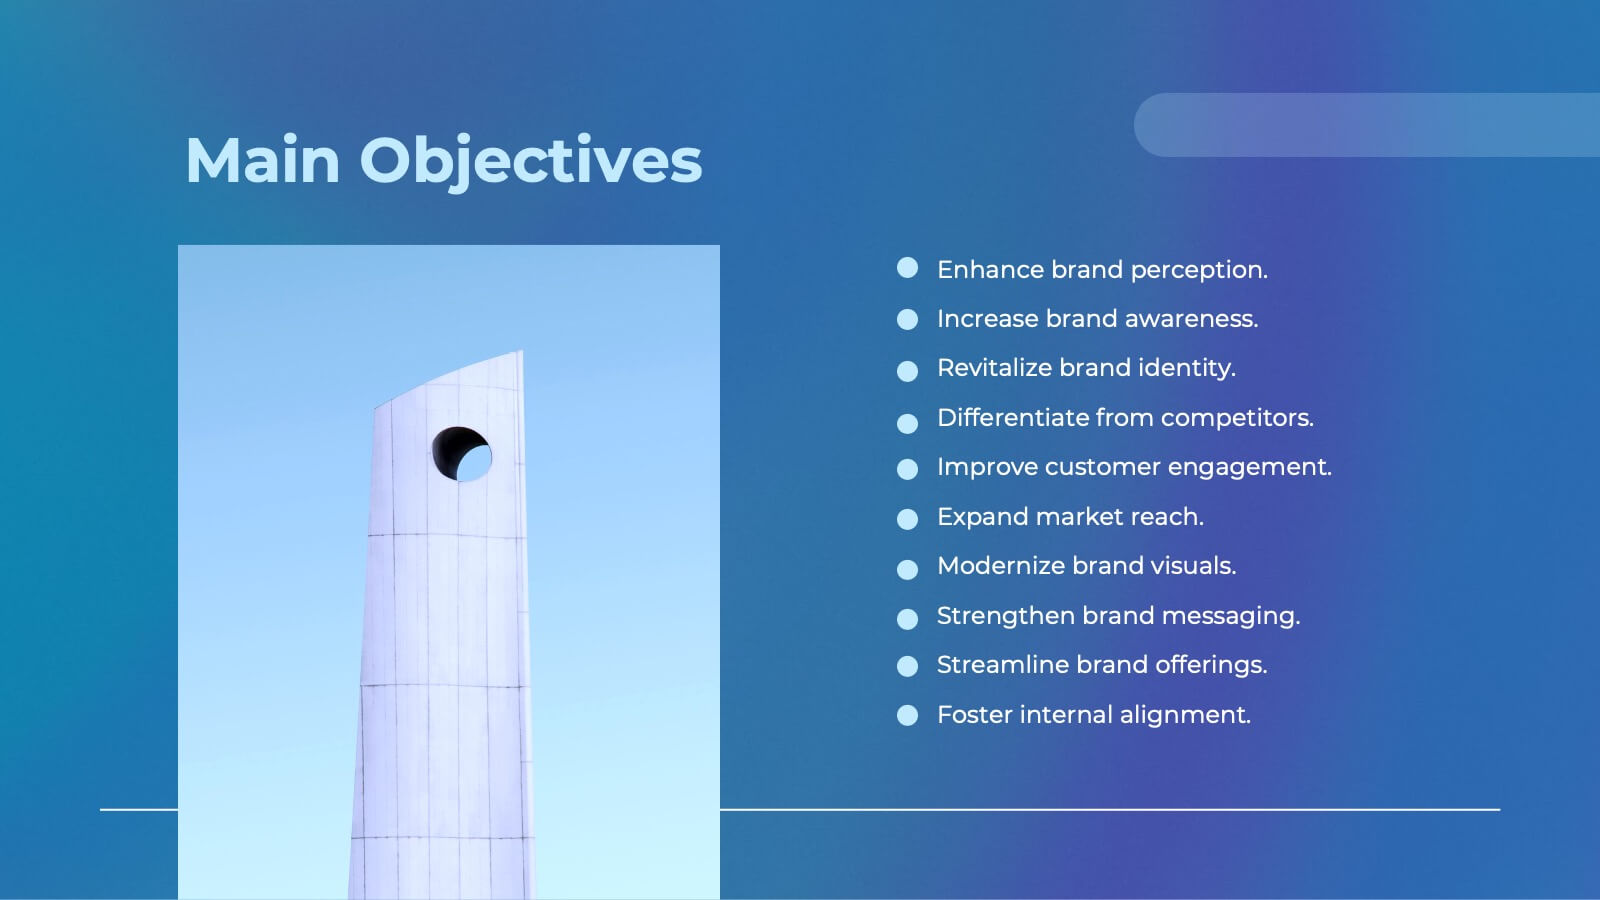
Ready to ace your next project proposal? This sleek presentation template is perfect for outlining objectives, timelines, and budgets. Designed for professionals aiming to impress stakeholders and secure approvals. Compatible with PowerPoint, Keynote, and Google Slides, it ensures a smooth and professional presentation every time. Ideal for project managers and business leaders.


6 diapositivas
Circular Motion Business Wheel Diagram Presentation
Showcase continuous processes or interconnected strategies with the Circular Motion Business Wheel Diagram Presentation. This visually engaging template features a six-part circular layout, ideal for illustrating business cycles, project workflows, or recurring tasks. Each segment includes customizable titles, icons, and content areas to support clarity and impact. Fully compatible with PowerPoint, Keynote, and Google Slides.


4 diapositivas
Property Investment and Housing Report Presentation
Present your Property Investment and Housing Report with this structured real estate-themed presentation template. Featuring a house-shaped design with ascending financial metrics, this layout is perfect for illustrating market trends, investment growth, and housing analysis. Ideal for real estate agents, property developers, and financial analysts, this template makes data visually engaging and easy to understand. Fully customizable and compatible with PowerPoint, Keynote, and Google Slides.


4 diapositivas
Real Estate and Housing Market Presentation
Turn market insights into visual stories that captivate investors and clients alike. This sleek and modern presentation helps you illustrate property trends, housing data, and real estate growth with clarity and confidence. Fully customizable and compatible with PowerPoint, Keynote, and Google Slides for easy editing and professional results.
5 diapositivas
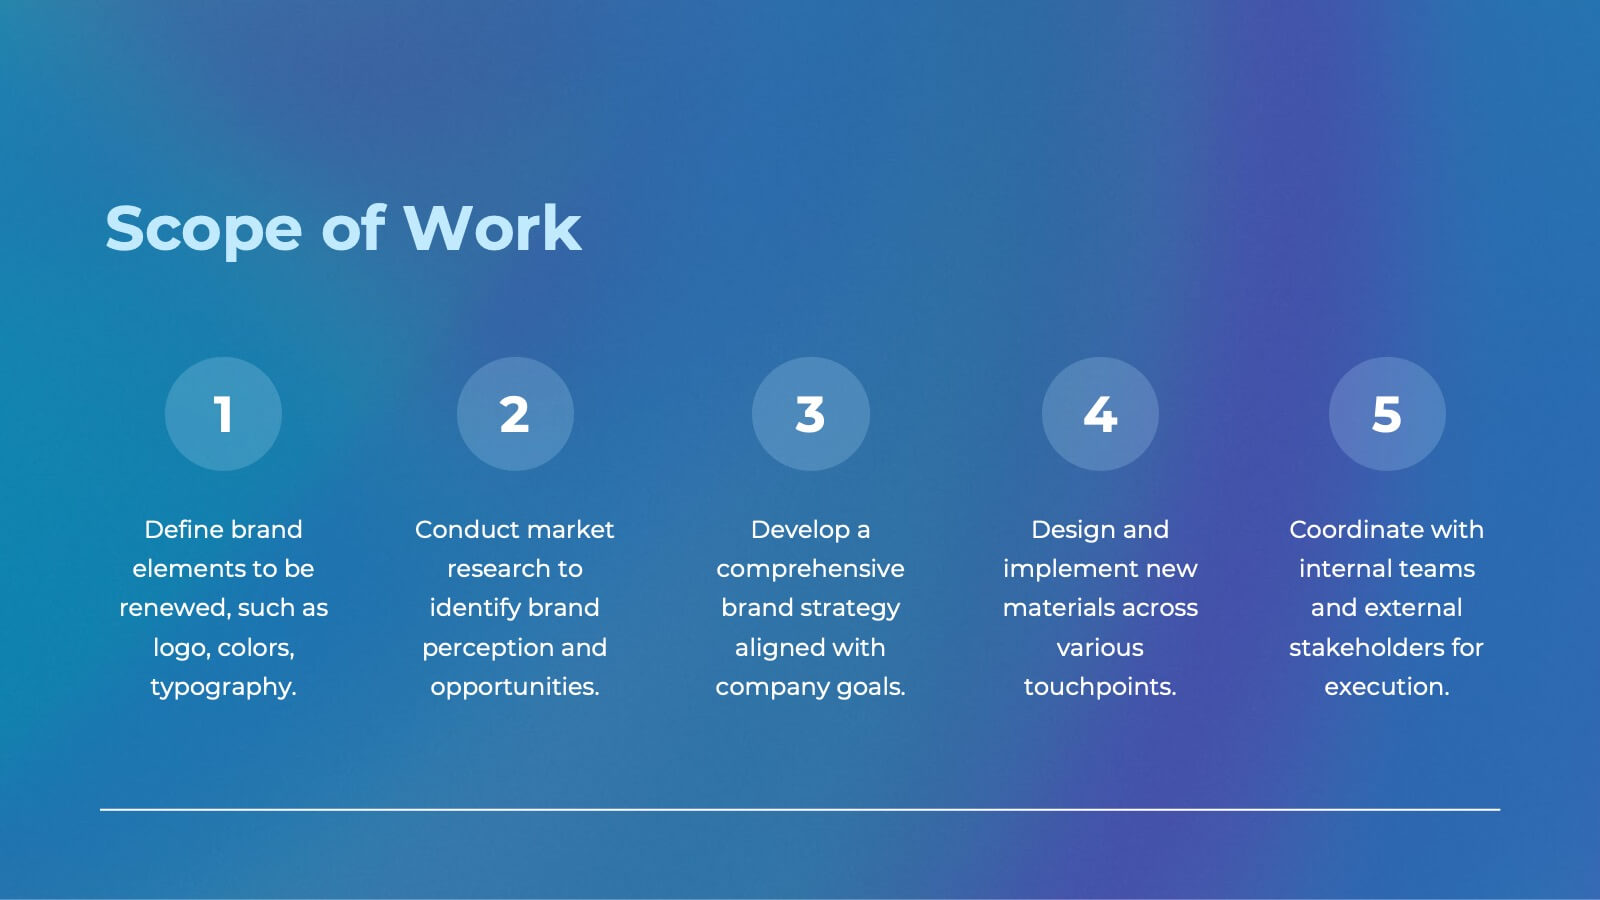
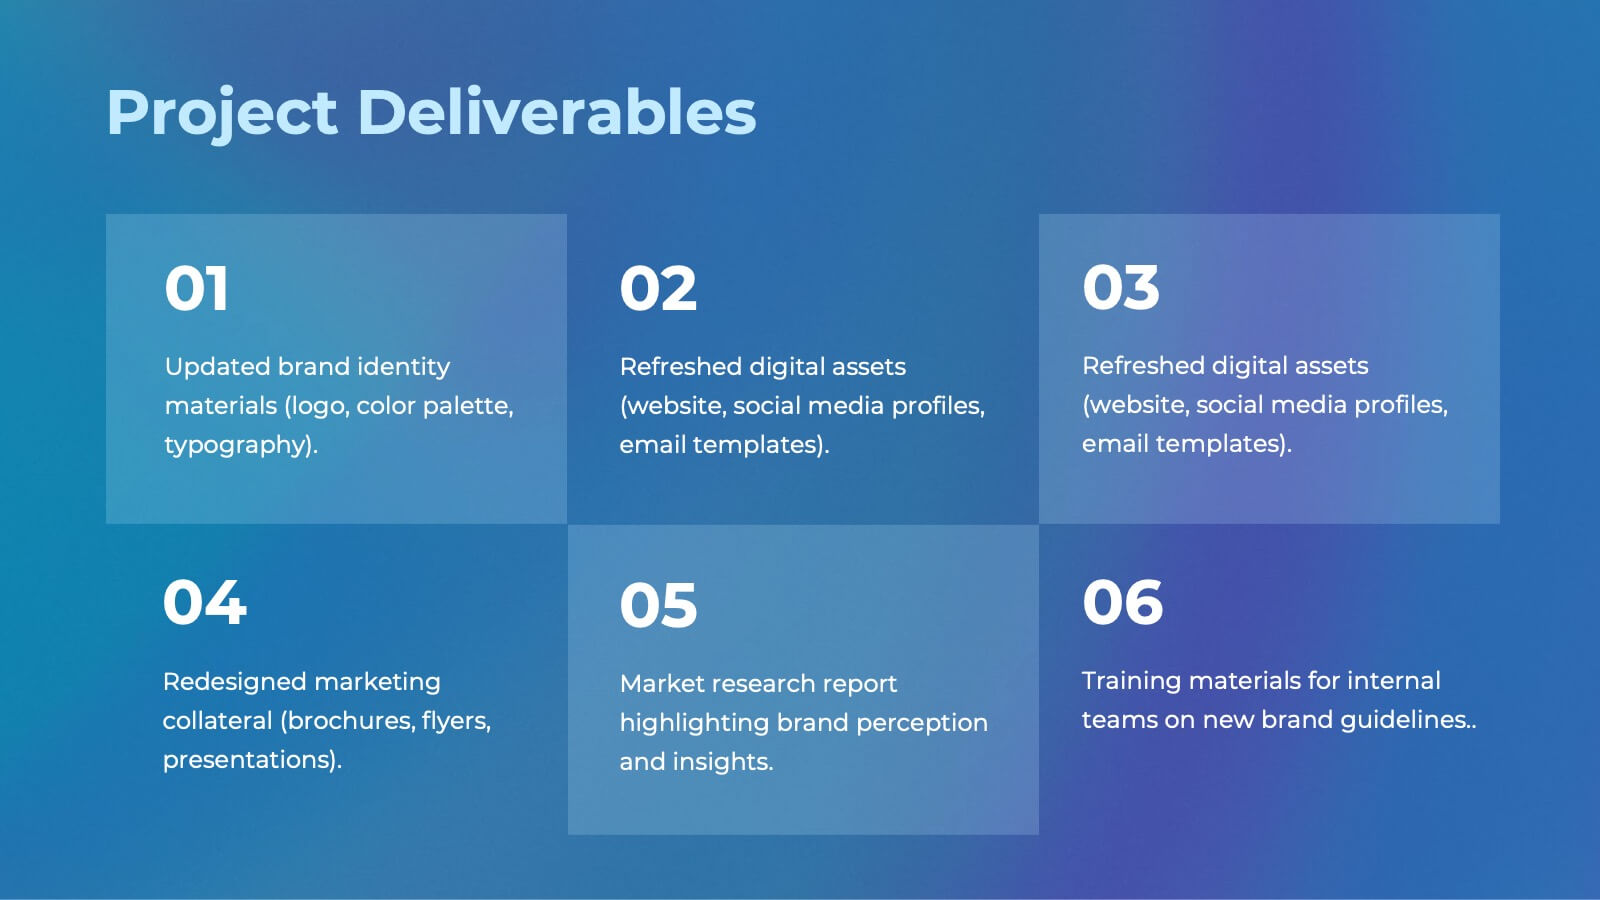
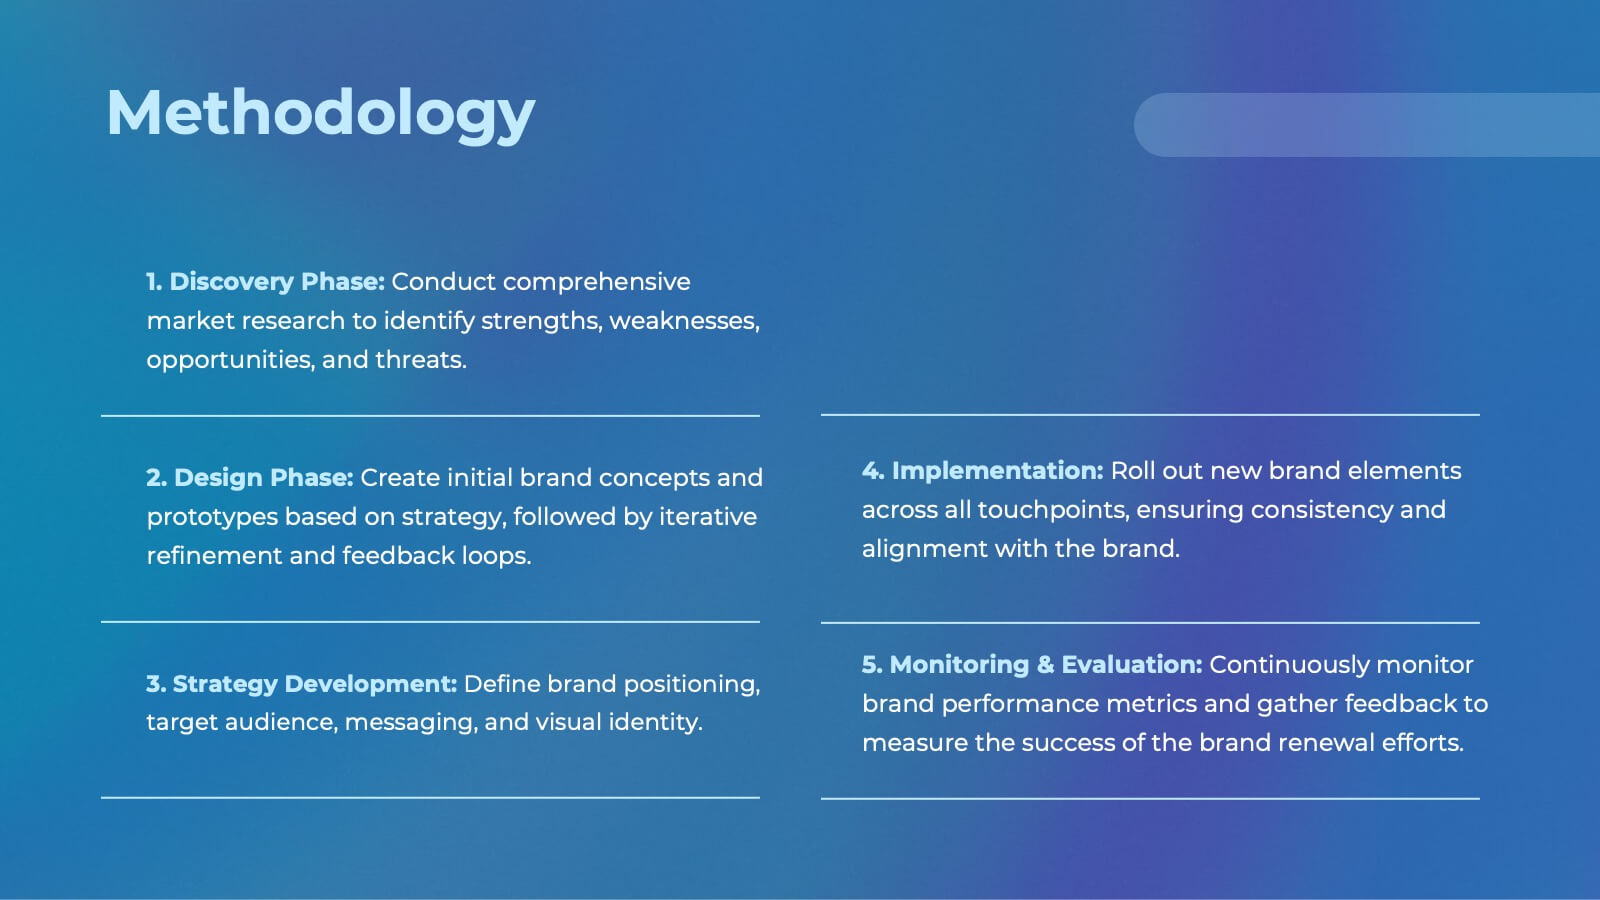
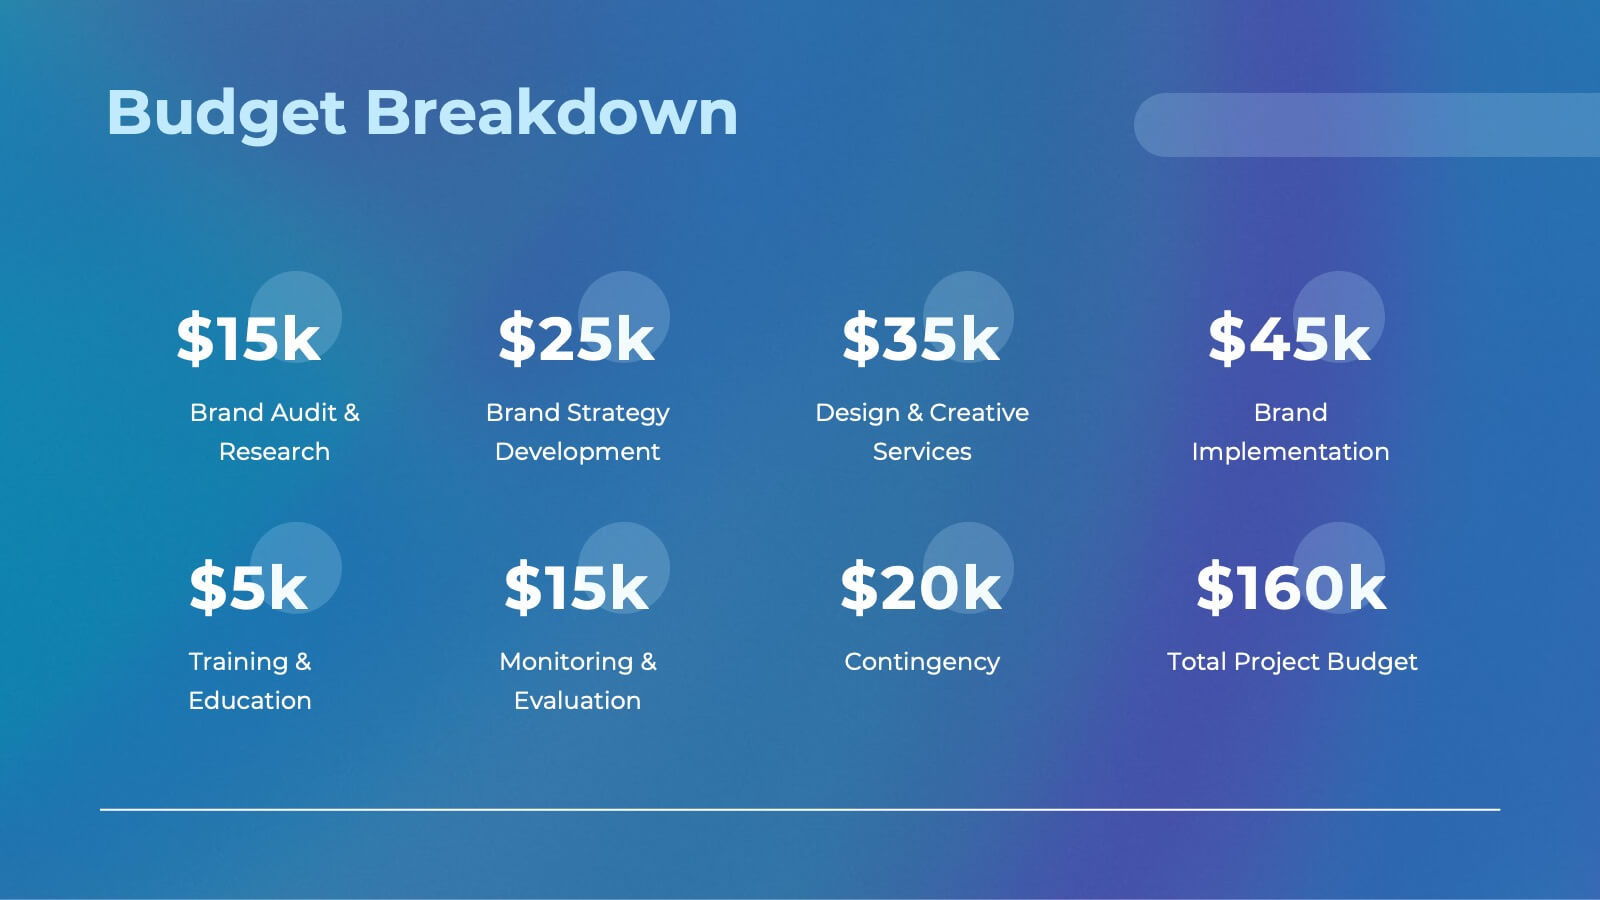
Business Strategy Arrow Presentation
Enhance your strategic planning with the Business Strategy Arrow Presentation. This visually structured template guides your audience through a step-by-step progression, making it ideal for business roadmaps, strategic plans, and goal-oriented workflows. Easily customize the colors, text, and icons to align with your brand. Fully compatible with PowerPoint, Keynote, and Google Slides for effortless editing and professional presentations.


26 diapositivas
Saam Presentation Template
Are you looking for a way to make your food presentation more fun and yummy-looking? Well, look no further! Our Saam food presentation template is just what you need. It's packed full of fun graphics and pictures of your food that will make your presentation look super tasty. And the best part? You can customize the photo layouts and charts to make your presentation look exactly how you want it with all the important information. So whether you're presenting your new restaurant to your investor, or showing your friends what you cooked for dinner this week, this template has got you covered.


5 diapositivas
Industry Analysis Porter's 5 Forces
Analyze market dynamics with this clean, circular infographic focused on Porter’s Five Forces. Visually break down buyer power, supplier influence, new entrants, substitutes, and competitive rivalry for a clear strategic overview. Ideal for consultants, marketers, and business analysts. Fully editable in PowerPoint, Keynote, and Google Slides.


8 diapositivas
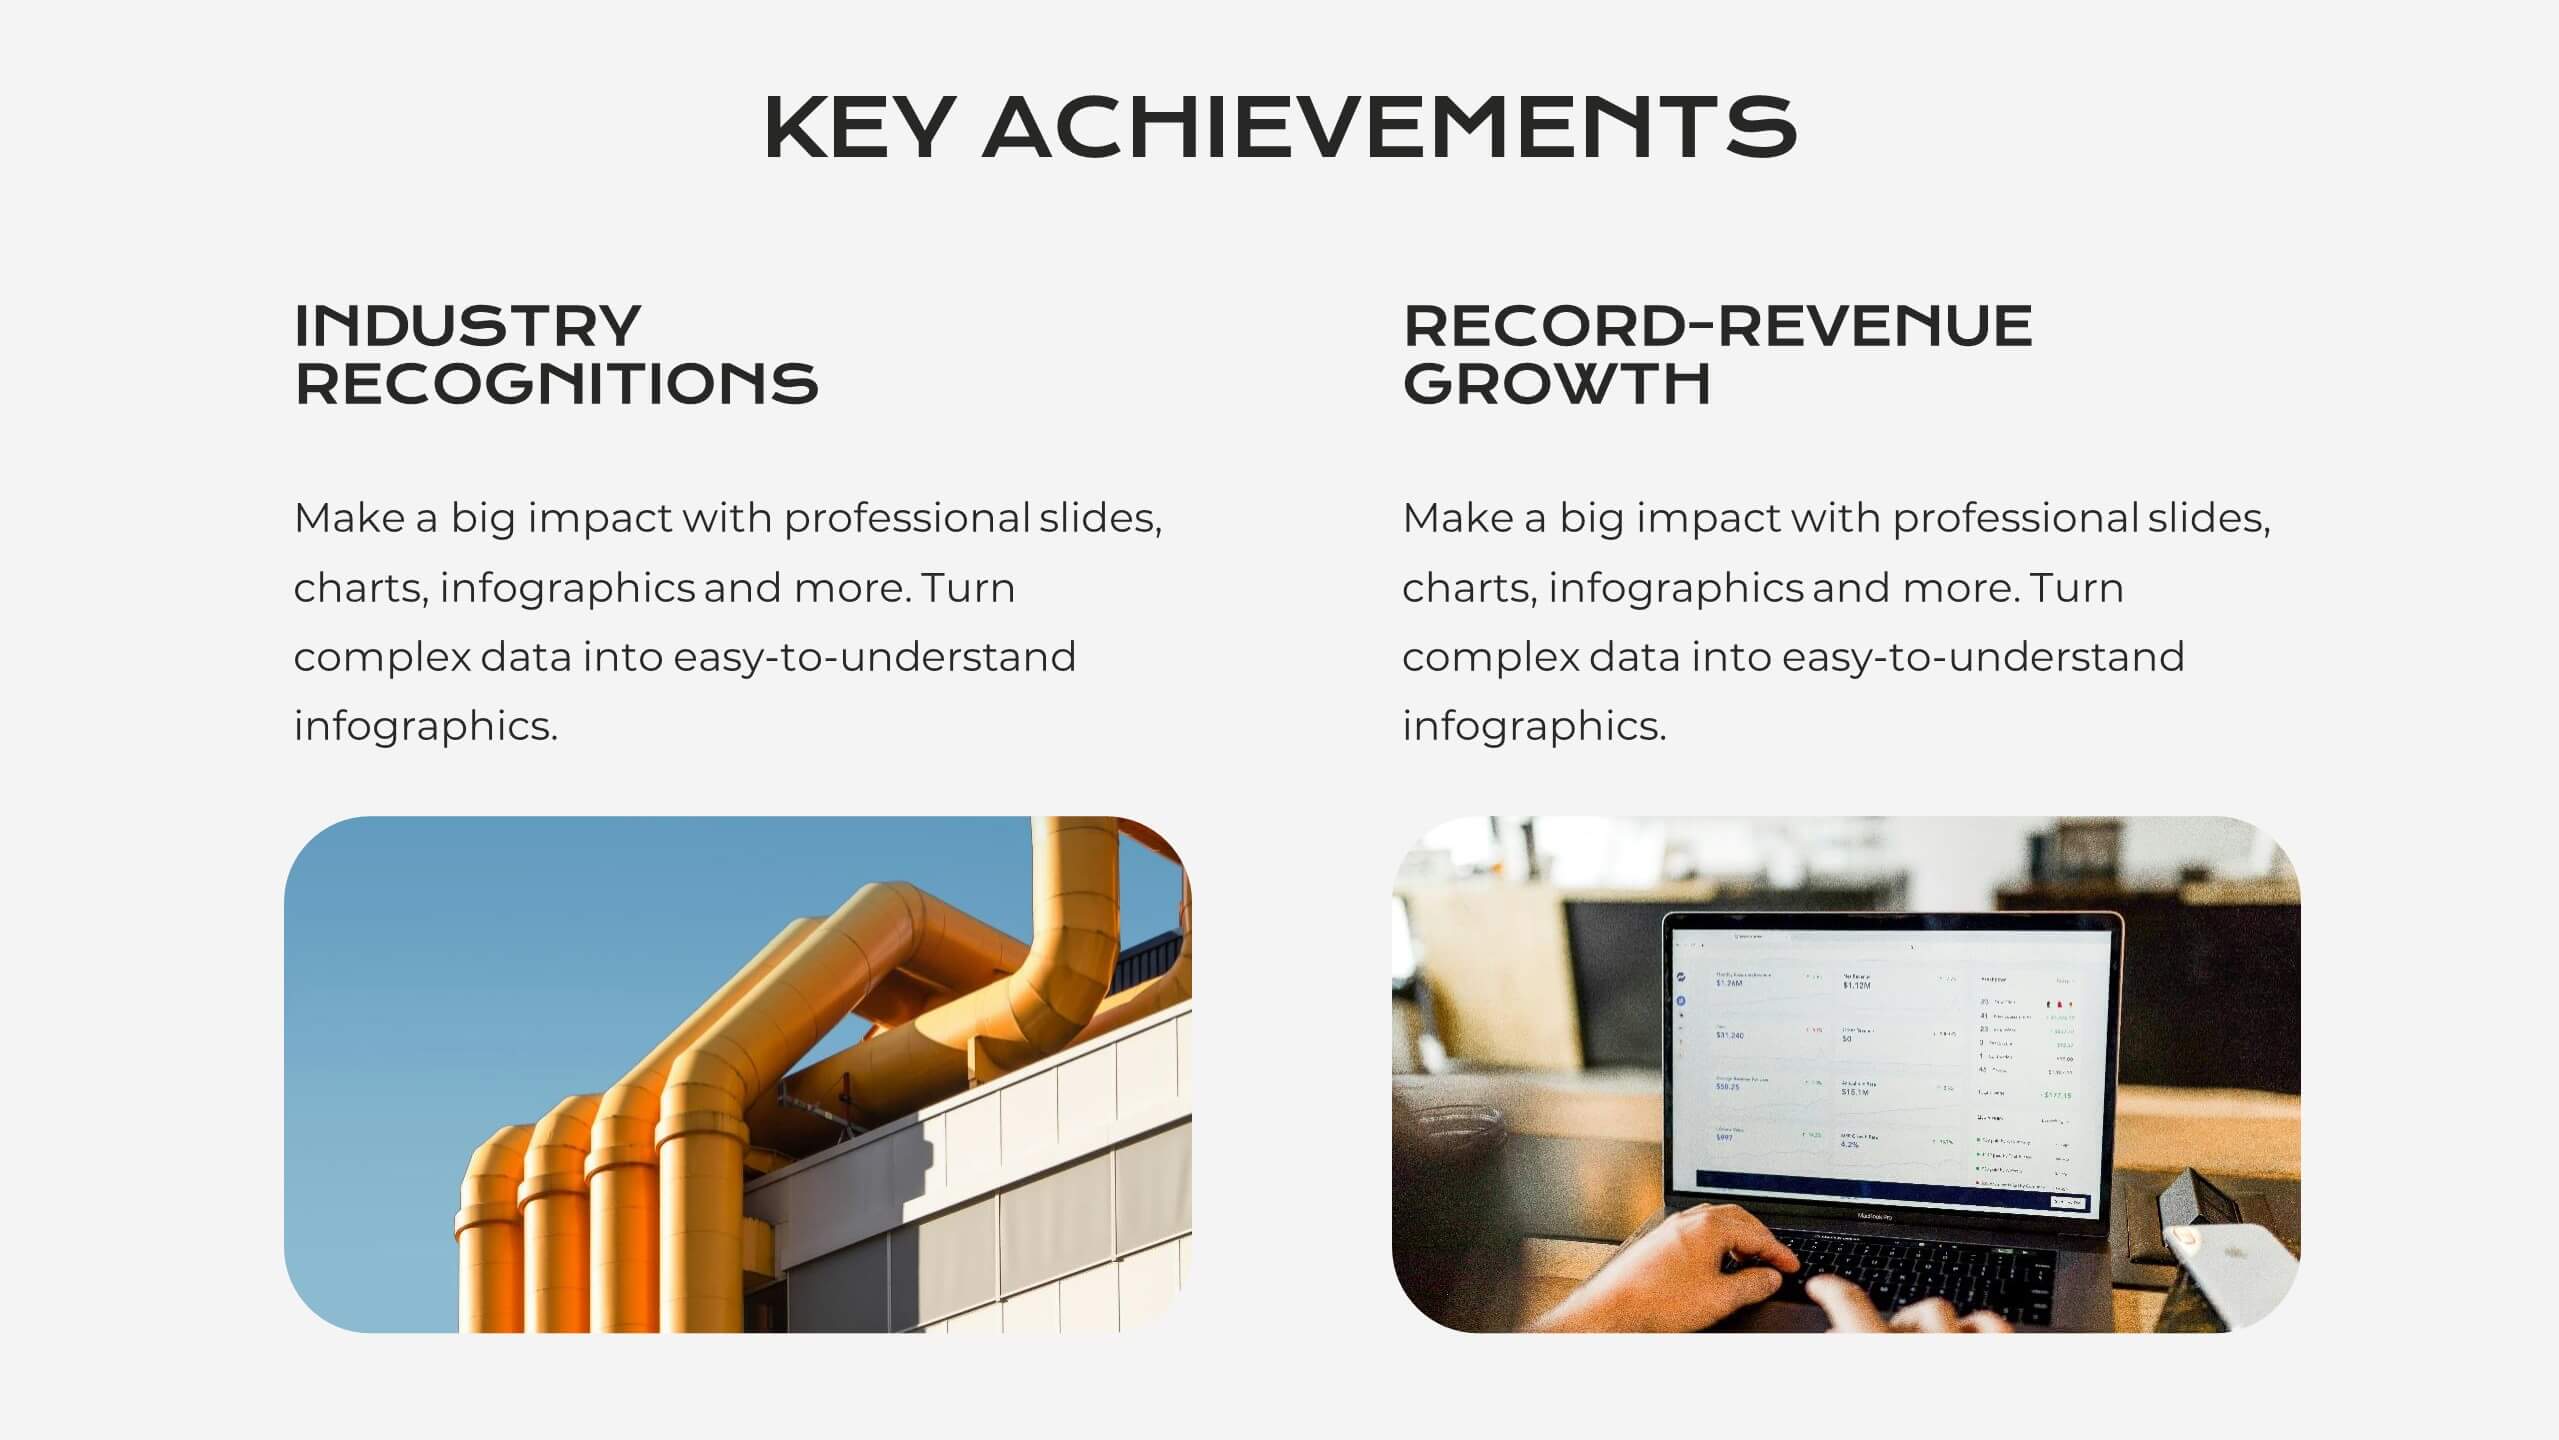
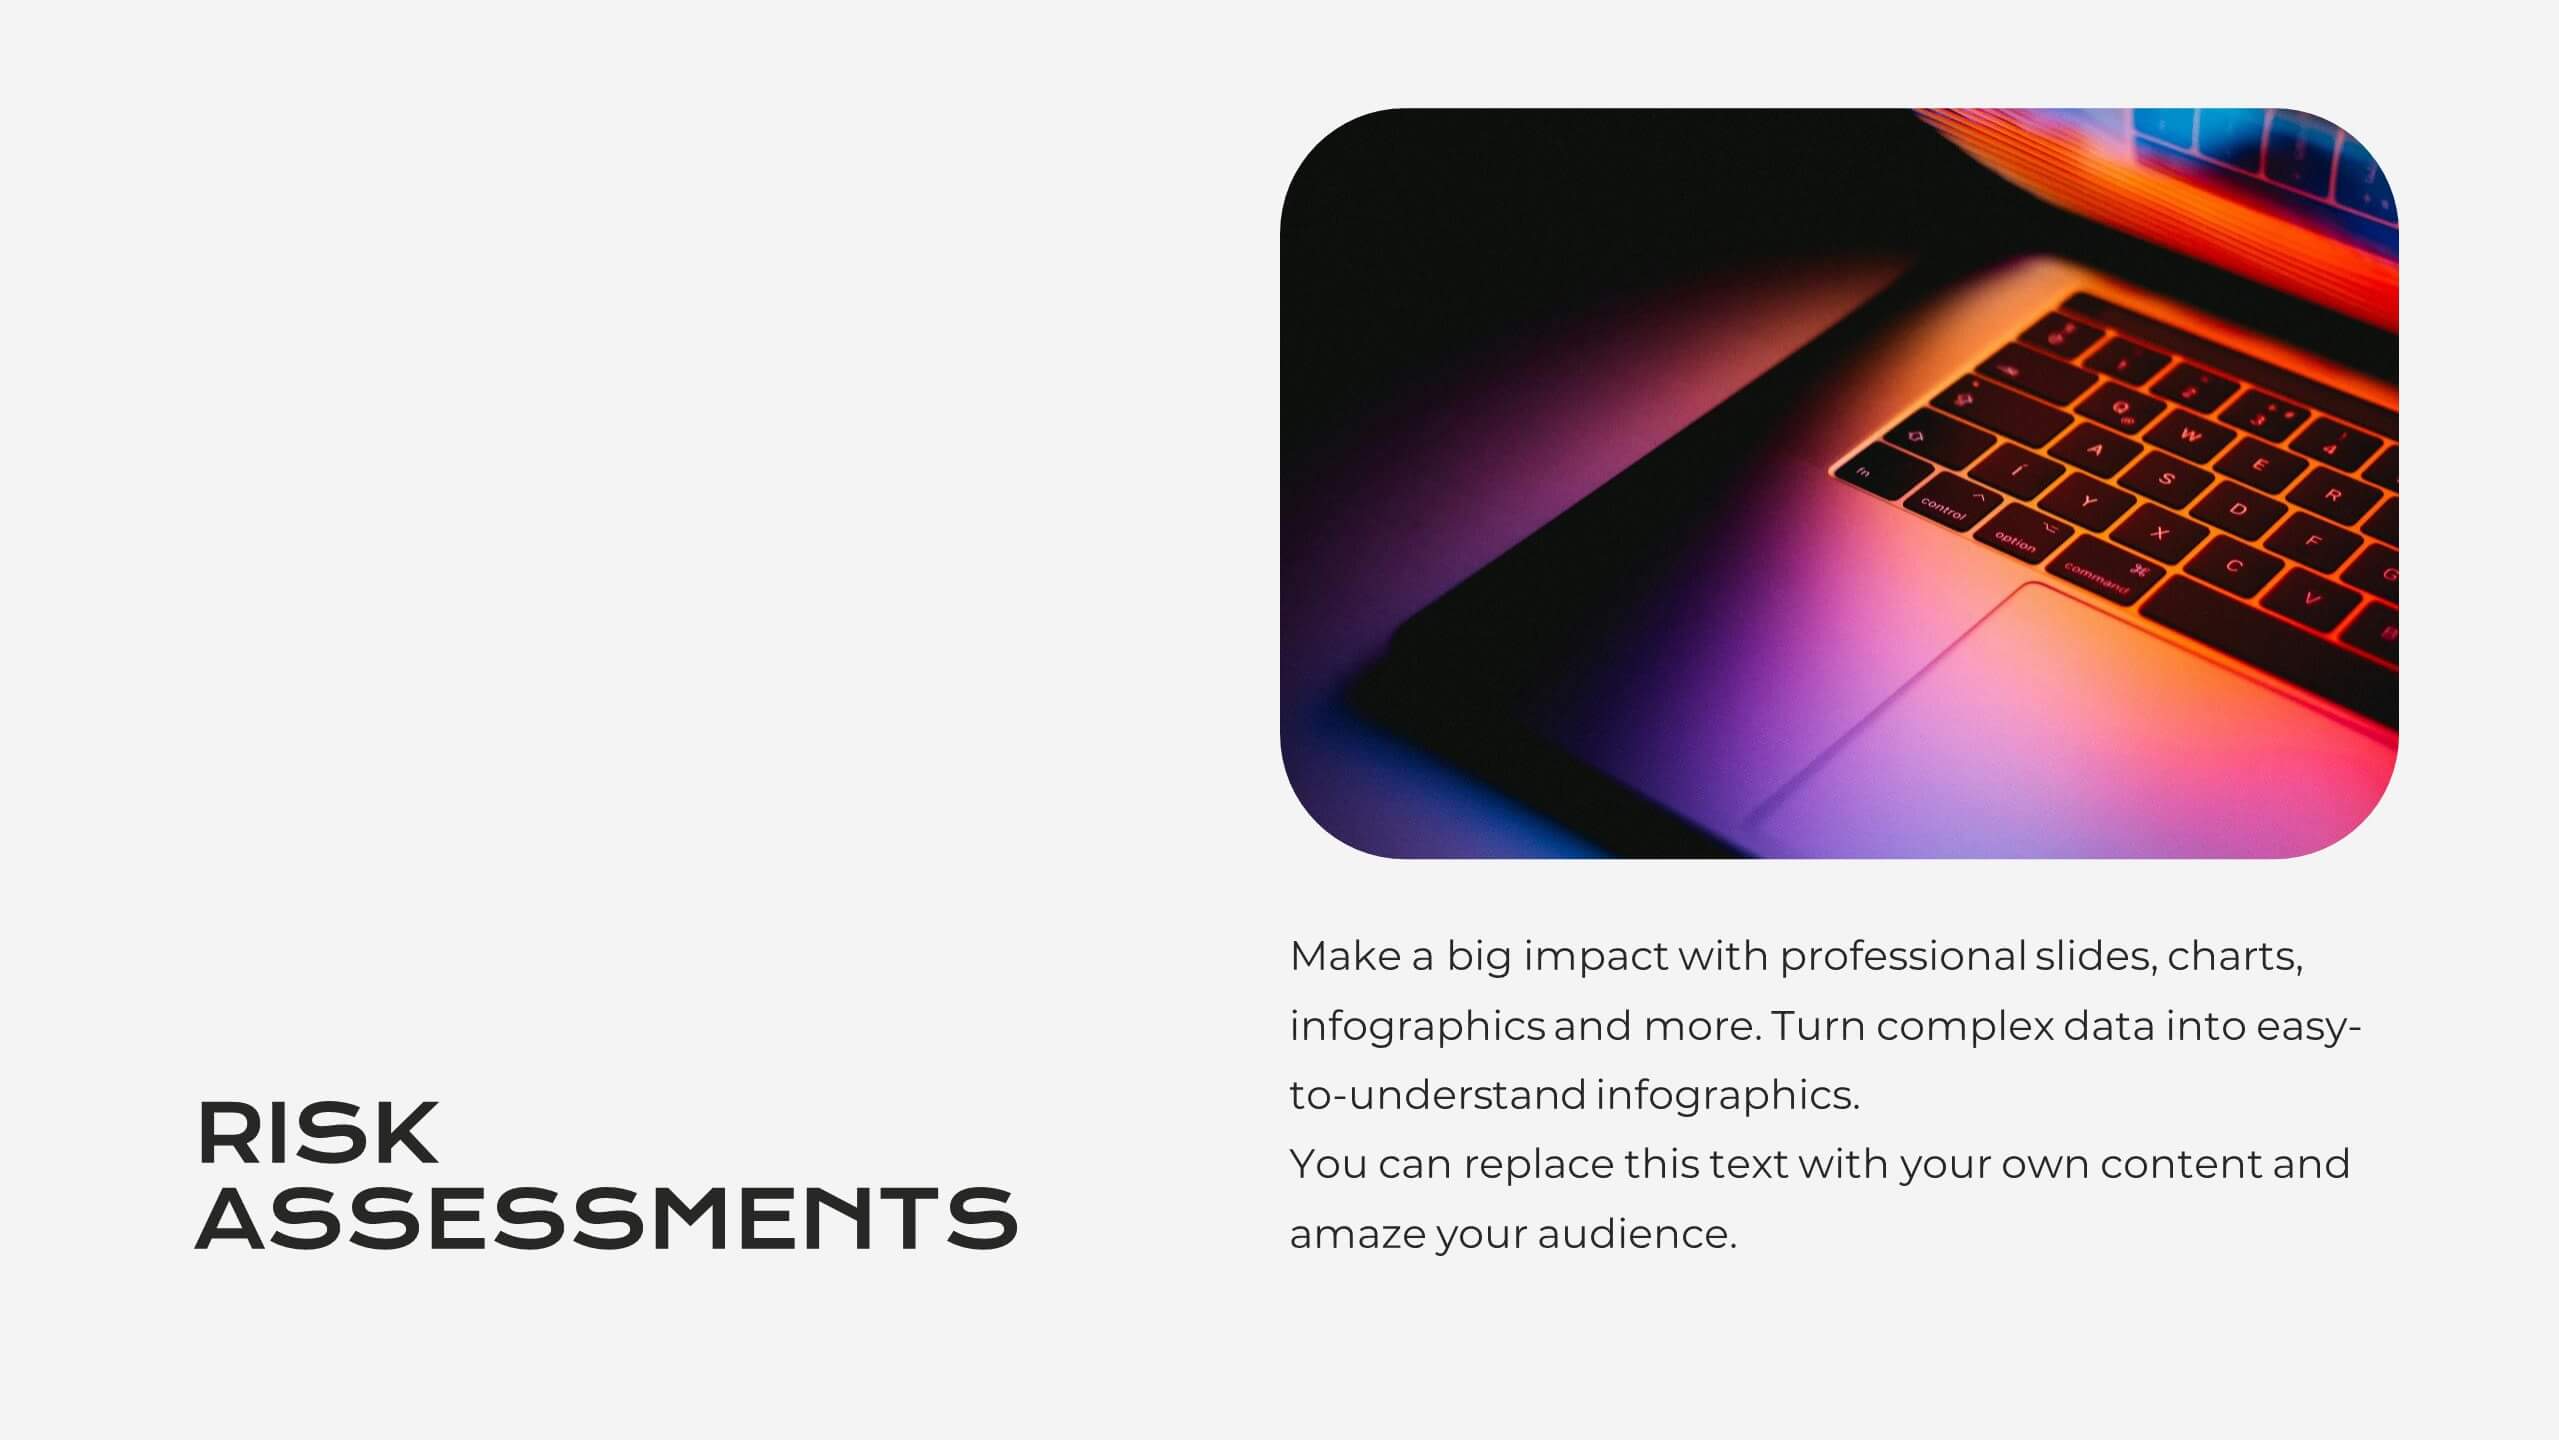
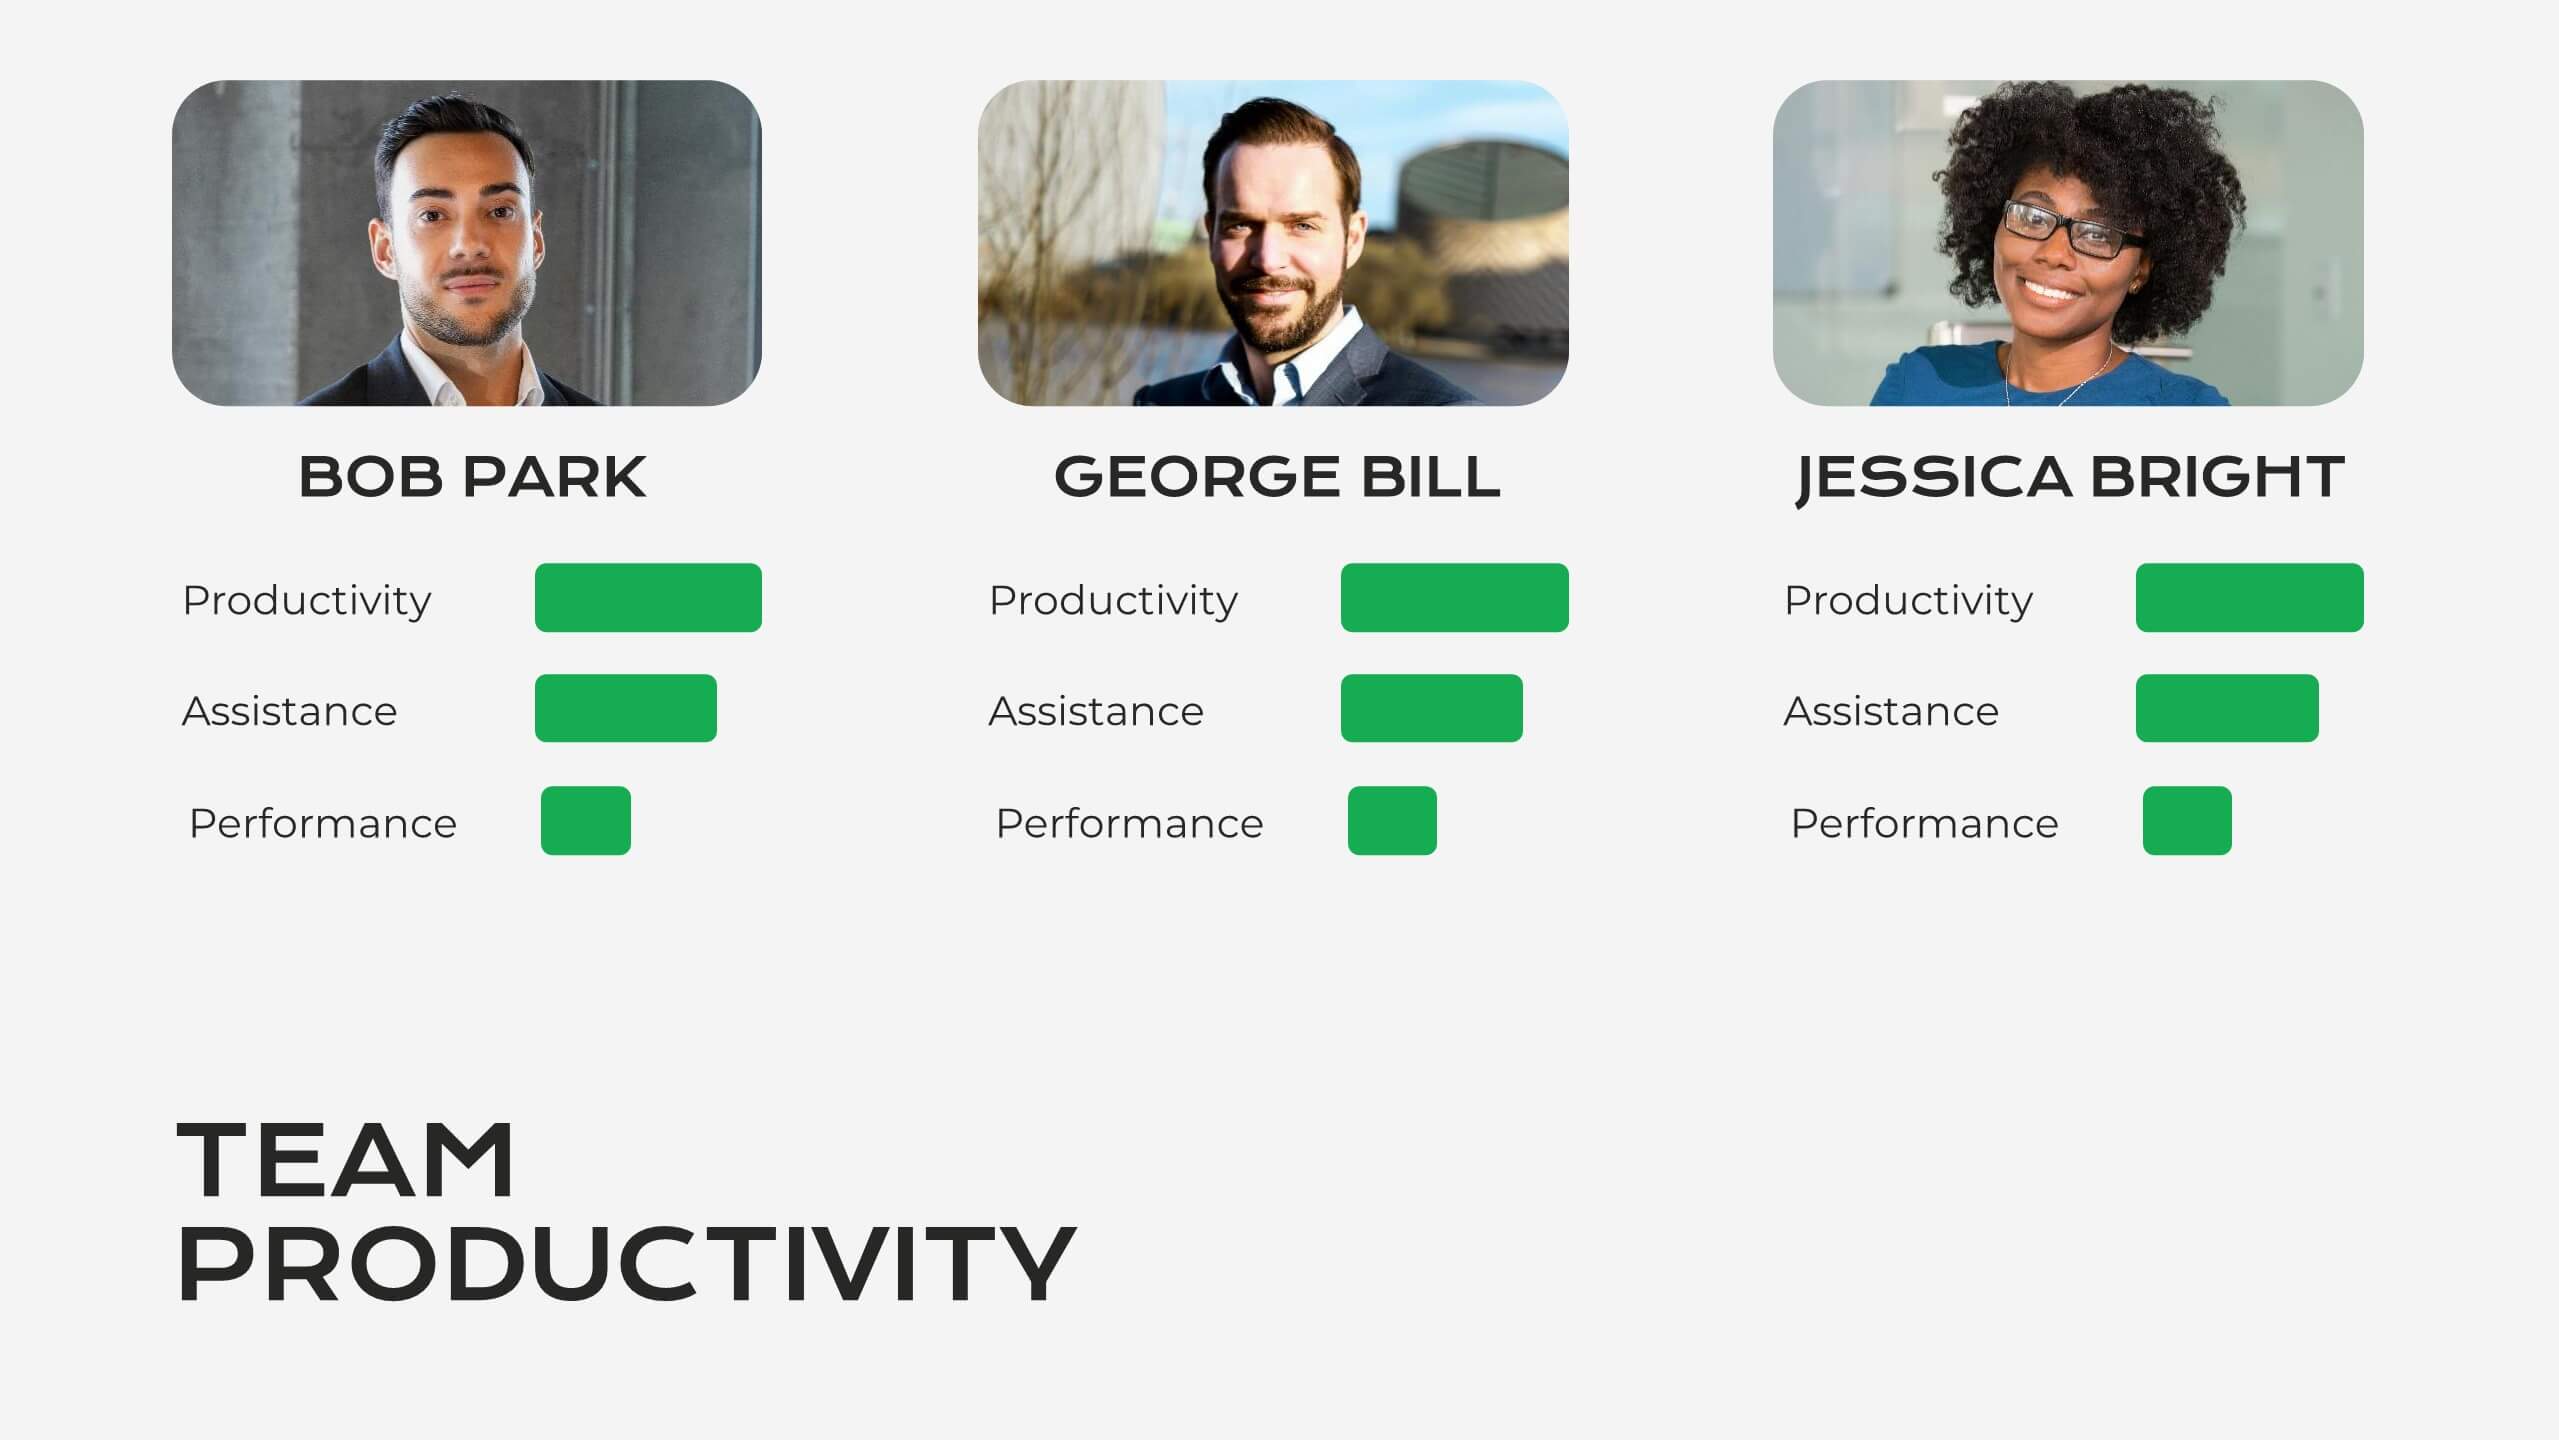
Success Metrics and Performance Presentation
Showcase your Success Metrics and Performance with this data-driven presentation template. Designed with bar-style visualizations and percentage-based highlights, this layout is ideal for business analysts, project managers, and executives looking to present key performance indicators (KPIs) with clarity. Featuring customizable colors, icons, and text placeholders, this template ensures clear and impactful storytelling. Compatible with PowerPoint, Keynote, and Google Slides for easy integration.


8 diapositivas
Mission Objectives and Long-Term Goals Presentation
Clearly define your roadmap with this Mission Objectives and Long-Term Goals presentation. This clean, step-by-step layout is ideal for showcasing strategic milestones, vision pillars, or future goals. Each point is visually aligned for logical progression, making it perfect for planning sessions. Fully editable in Canva, PowerPoint, or Google Slides.


6 diapositivas
Product Launch Milestone Plan Presentation
Turn your big idea into a successful launch with this bold and structured presentation design. Perfect for outlining goals, tracking phases, and measuring progress, it keeps your product roadmap clear and engaging. Easily editable and compatible with PowerPoint, Keynote, and Google Slides for seamless presentation creation.


8 diapositivas
Insurance Market Trends Presentation
Stay Ahead in the Insurance Industry with this Insurance Market Trends Presentation template. Designed with a modern roadmap layout, this slide helps illustrate key trends, policy changes, and industry insights in an engaging and structured way. Ideal for insurance professionals, financial analysts, and business strategists, this fully customizable template is compatible with PowerPoint, Keynote, and Google Slides, making it easy to adapt to your specific needs.


6 diapositivas
Porter’s Value Chain Analysis Presentation
Give your strategy story a powerful lift with a clean visual layout that makes every activity in your organization feel connected and purposeful. This presentation explains primary and support processes in a way that helps teams identify strengths, gaps, and opportunities for improvement. Fully compatible with PowerPoint, Keynote, and Google Slides.


4 diapositivas
SaaS Pricing Comparison Chart Presentation
Make pricing comparisons exciting with this bold, side-by-side layout designed to instantly spotlight key differences. Whether you’re showcasing SaaS plans or product tiers, this chart template lets you present value and features clearly. Fully editable and easy to customize in PowerPoint, Keynote, and Google Slides for polished pricing presentations.


5 diapositivas
Executive Summary of Business Goals Presentation
Showcase your strategic objectives clearly with this Executive Summary of Business Goals Presentation. Featuring a layered pyramid structure and bold icons, it effectively breaks down five key goals or priorities. Perfect for business reviews, annual plans, or leadership meetings. Fully customizable in Canva, PowerPoint, or Google Slides.


7 diapositivas
Milestones Credit Card Infographic Presentation
A Milestones Infographic is a visual representation of significant events, accomplishments, or achievements in a project, business, or individual's life. This template include timelines, graphs, diagrams, and other visual elements to help convey important information. You can use this infographic to cover many different topics, including project management, business growth, personal achievements, or company history. This template is useful for businesses or individuals who want to showcase their accomplishments, highlight important dates or events, or just share progress updates.


7 diapositivas
Business Model Canvas Infographic Presentation Template
The Business Model Canvas is a tool for articulating a strategy in the form of a business model for a start-up or existing enterprise. This template provides a visual overview for entrepreneurs and innovators to write about the critical components of their business, from different perspectives. With this template presenting information in graphical format, the Canvas aids communication between business people with different backgrounds and skill sets, helping to align ideas. We created a simple and effective presentation that will help you to grasp the concepts of this tool in a few minutes!