


Características


¿Tienes alguna pregunta?
Recomendar

20 diapositivas
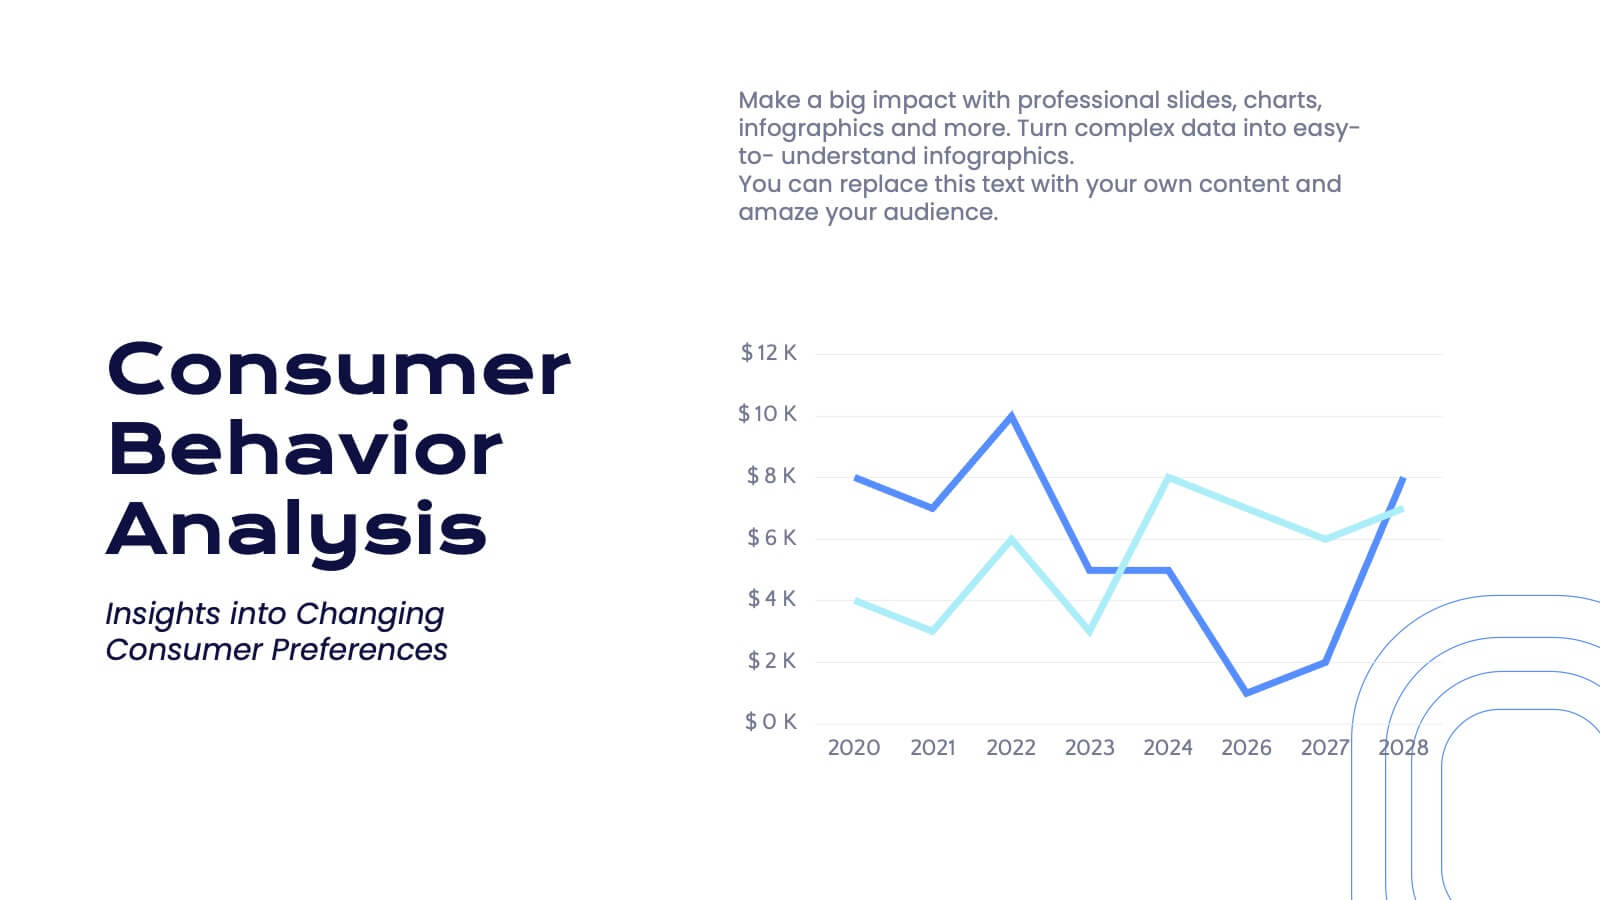
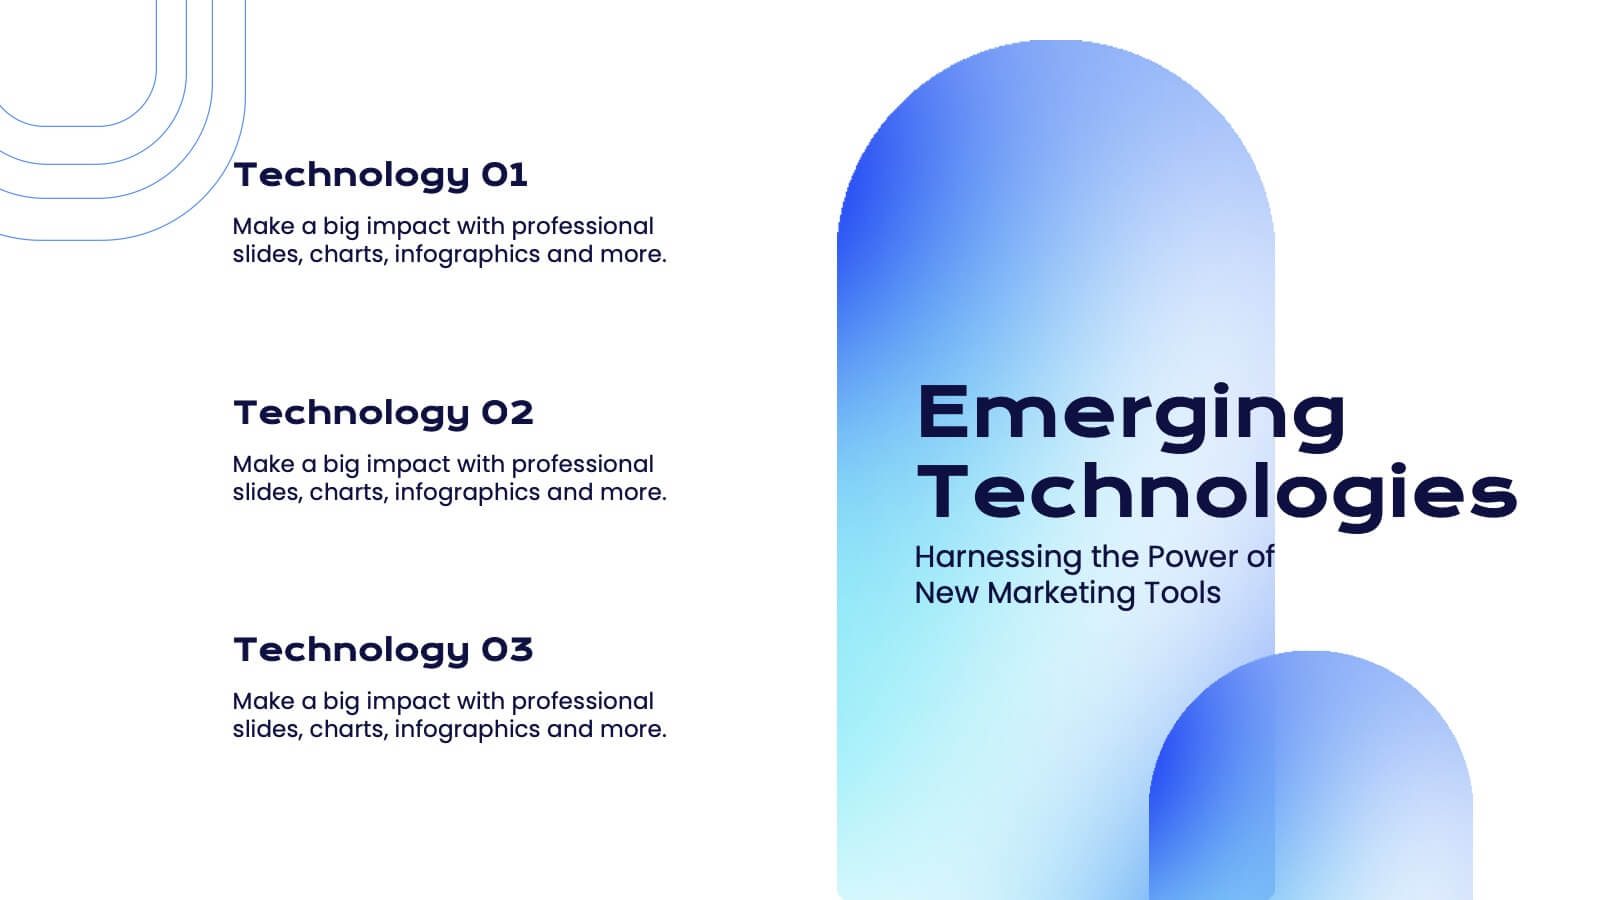
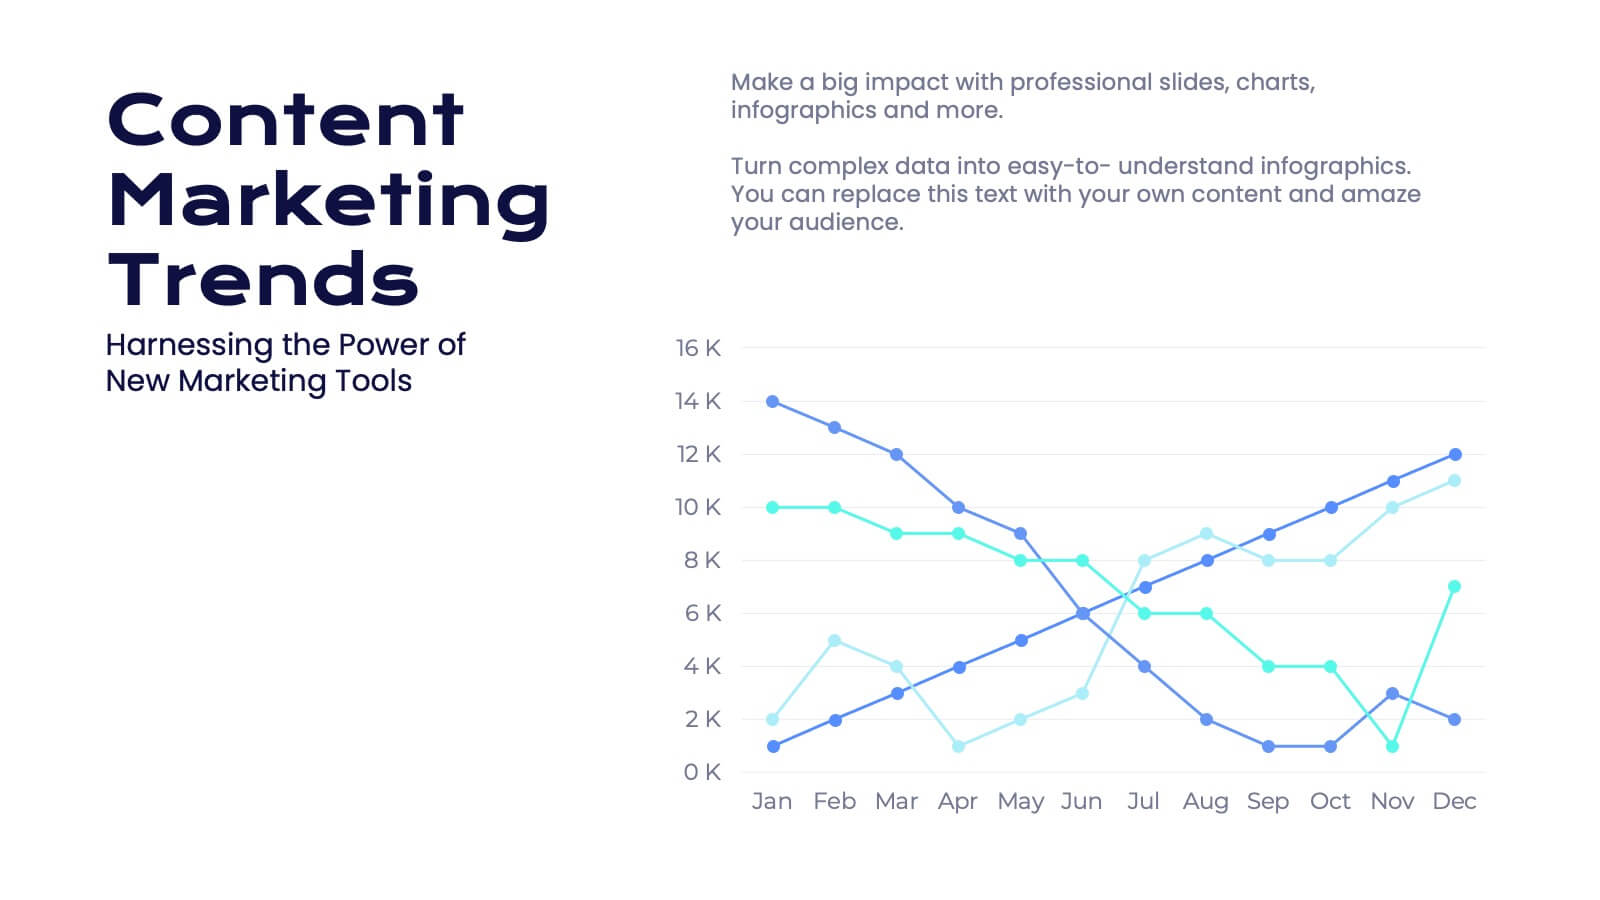
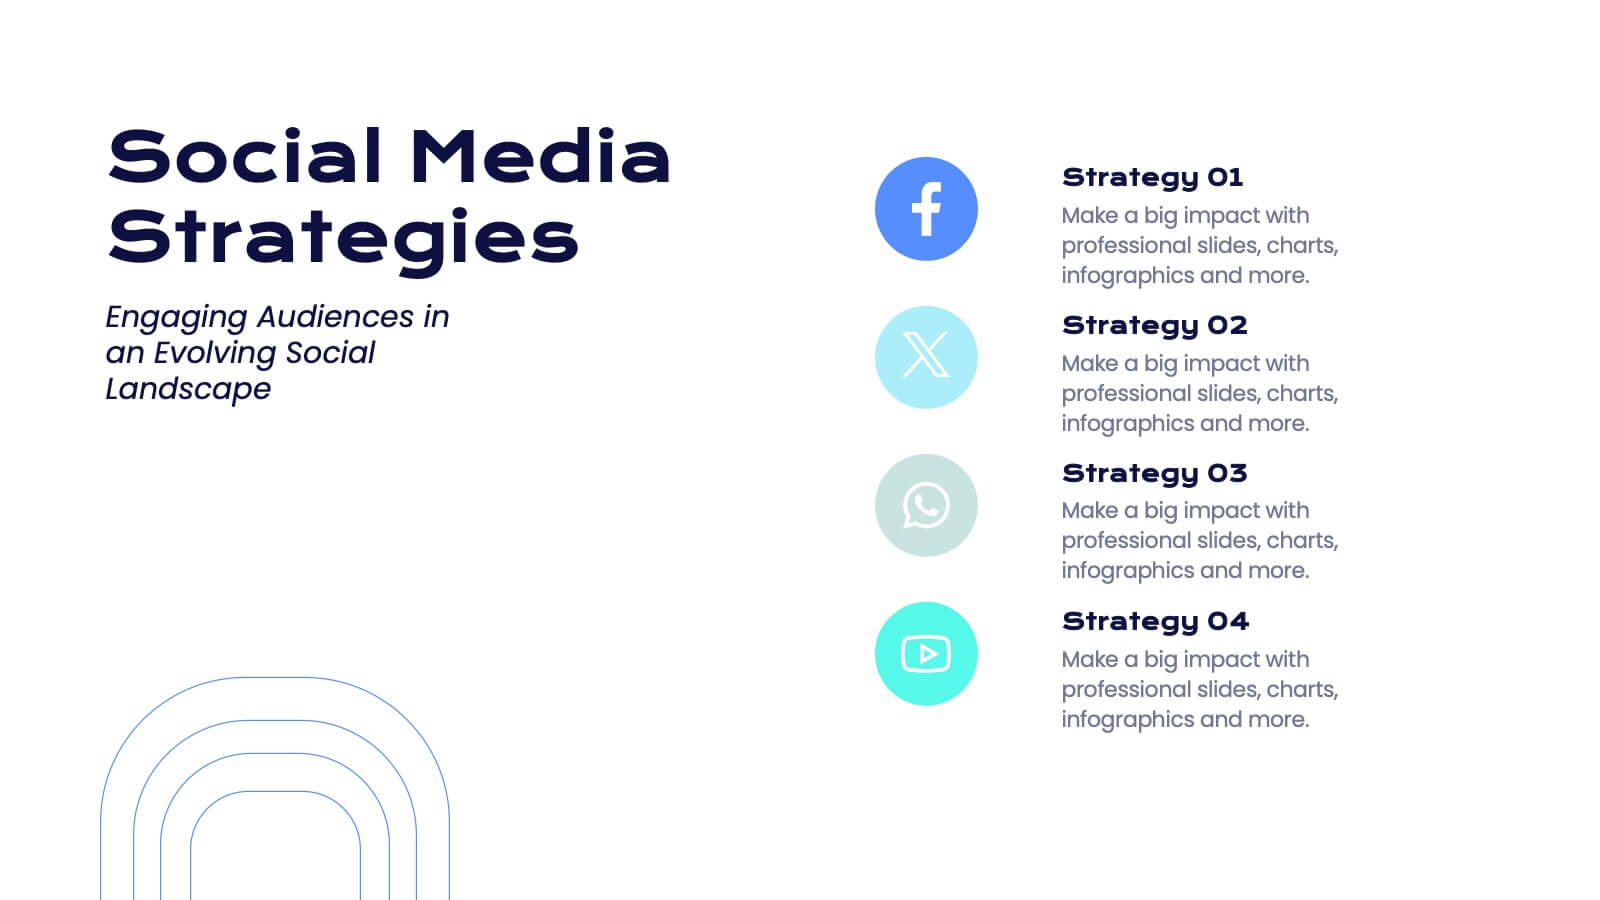
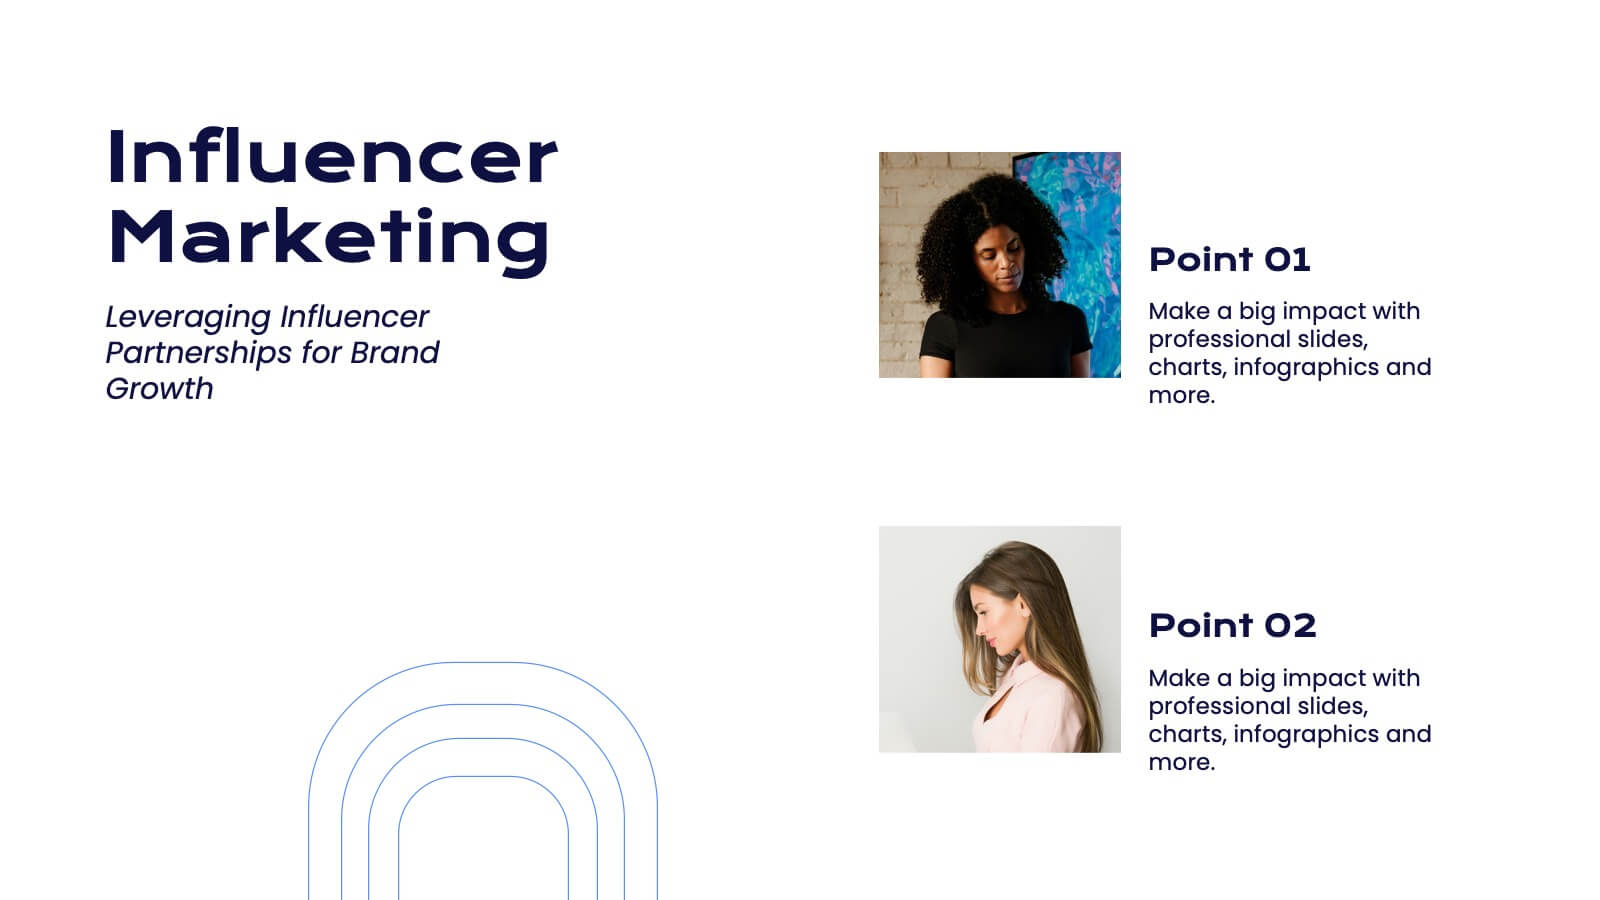
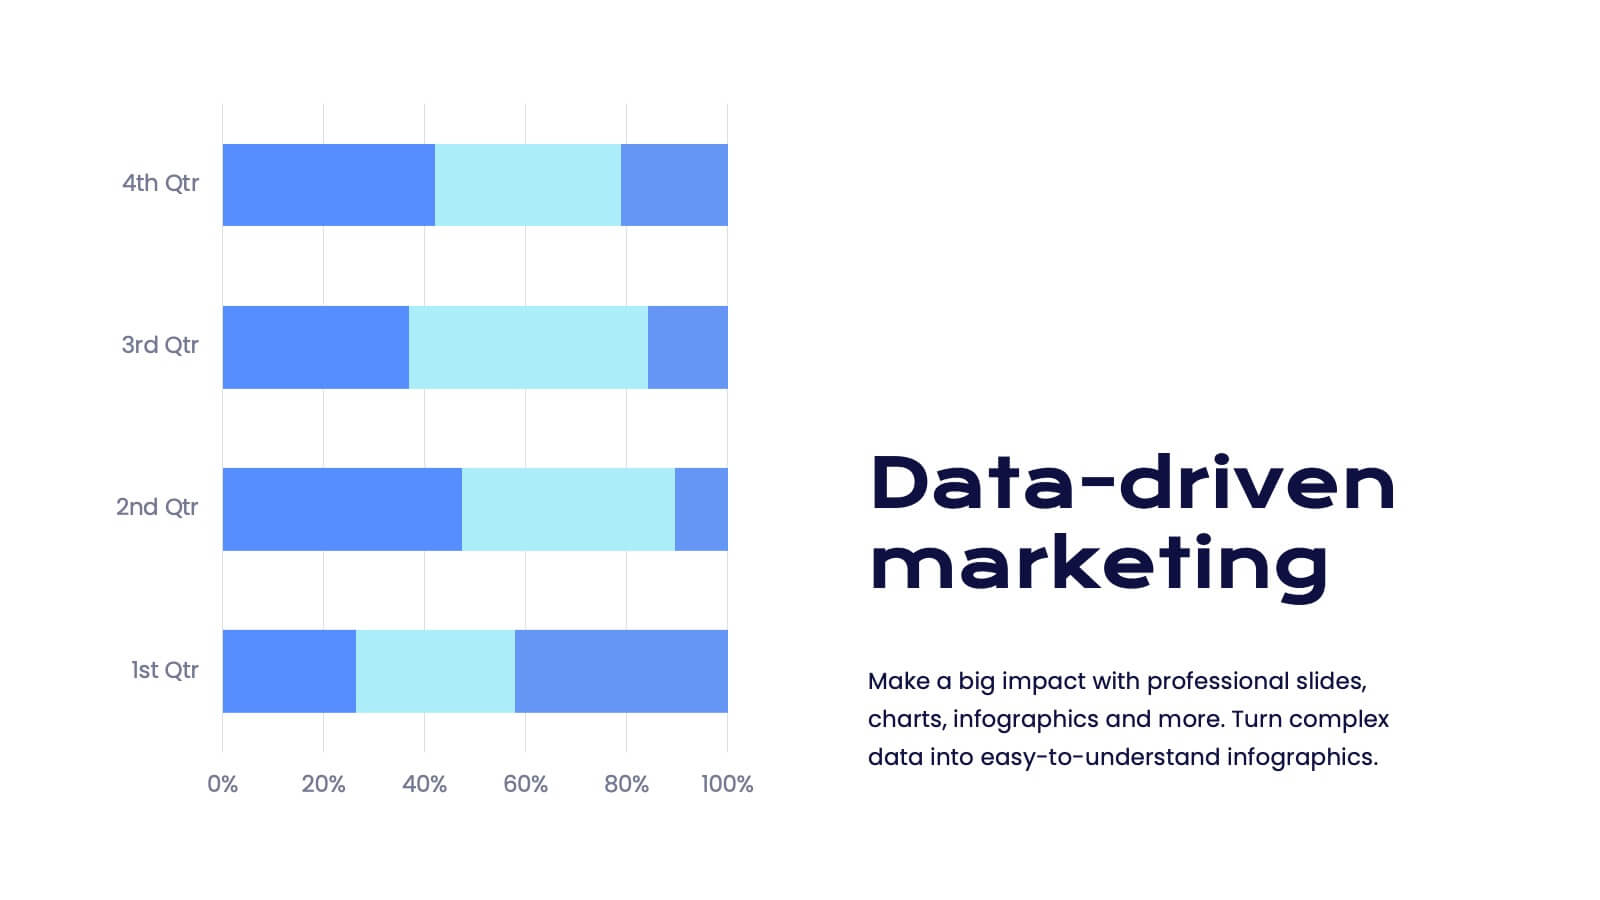
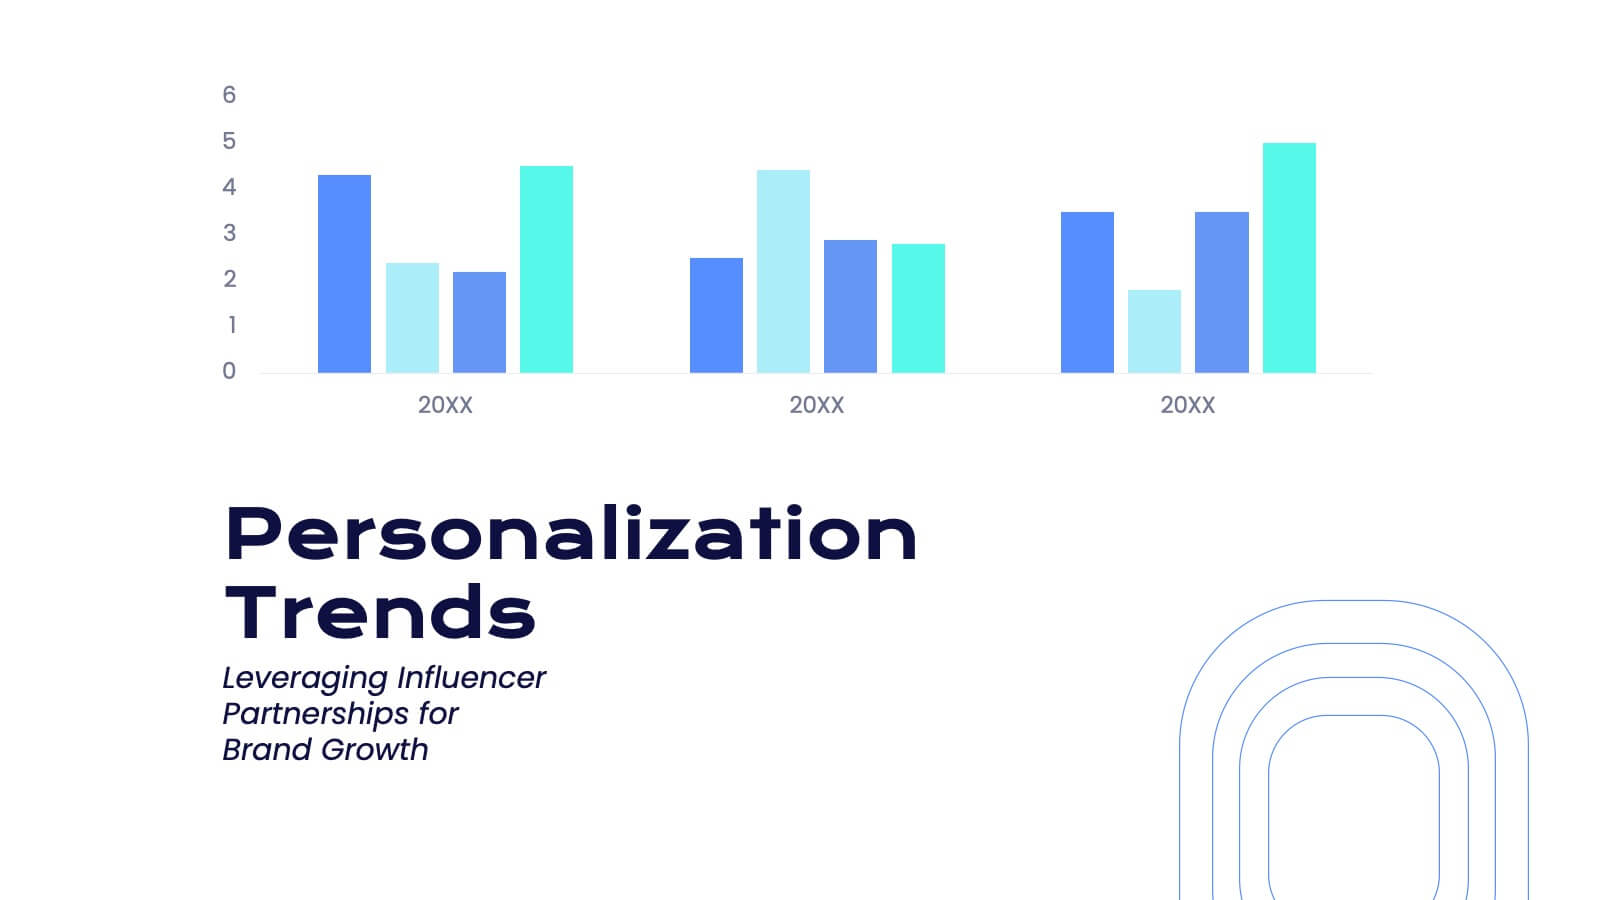
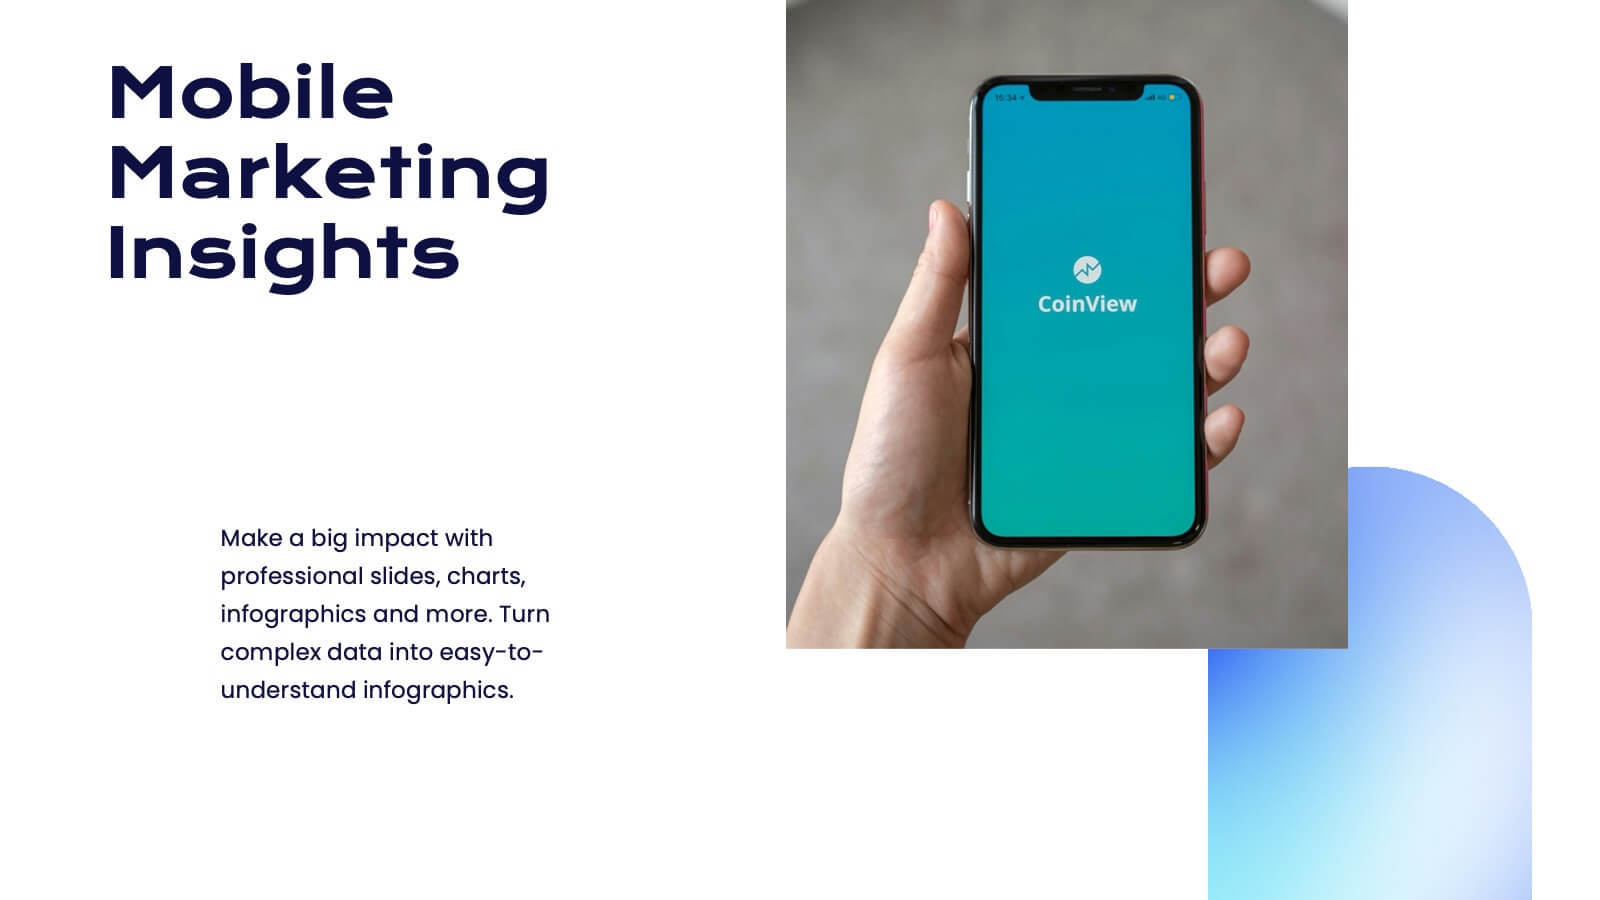
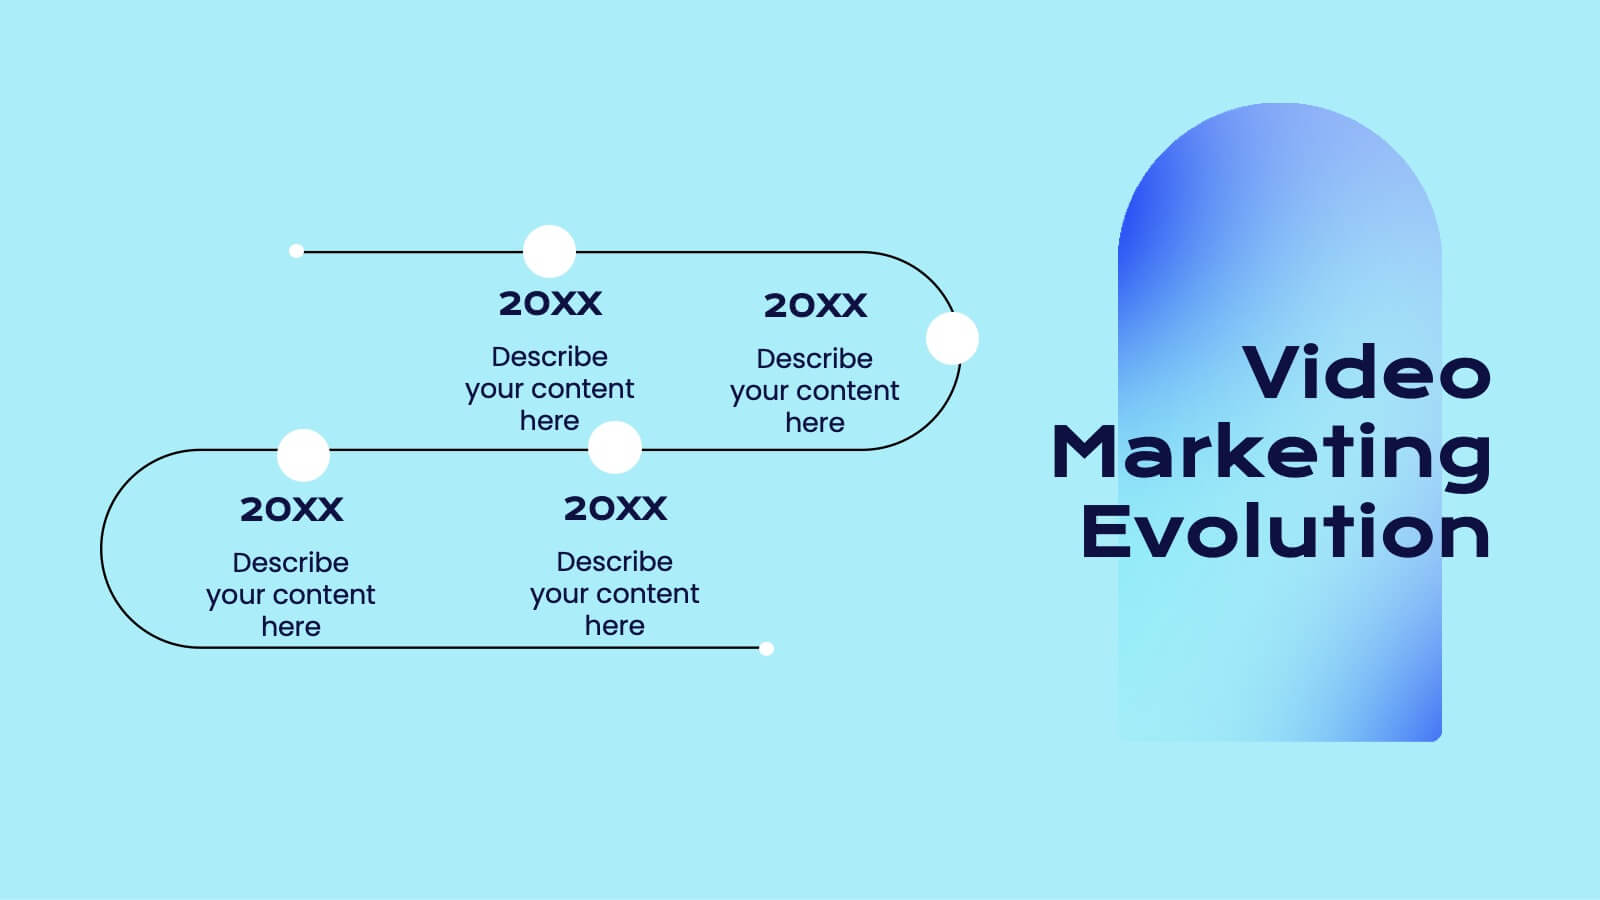
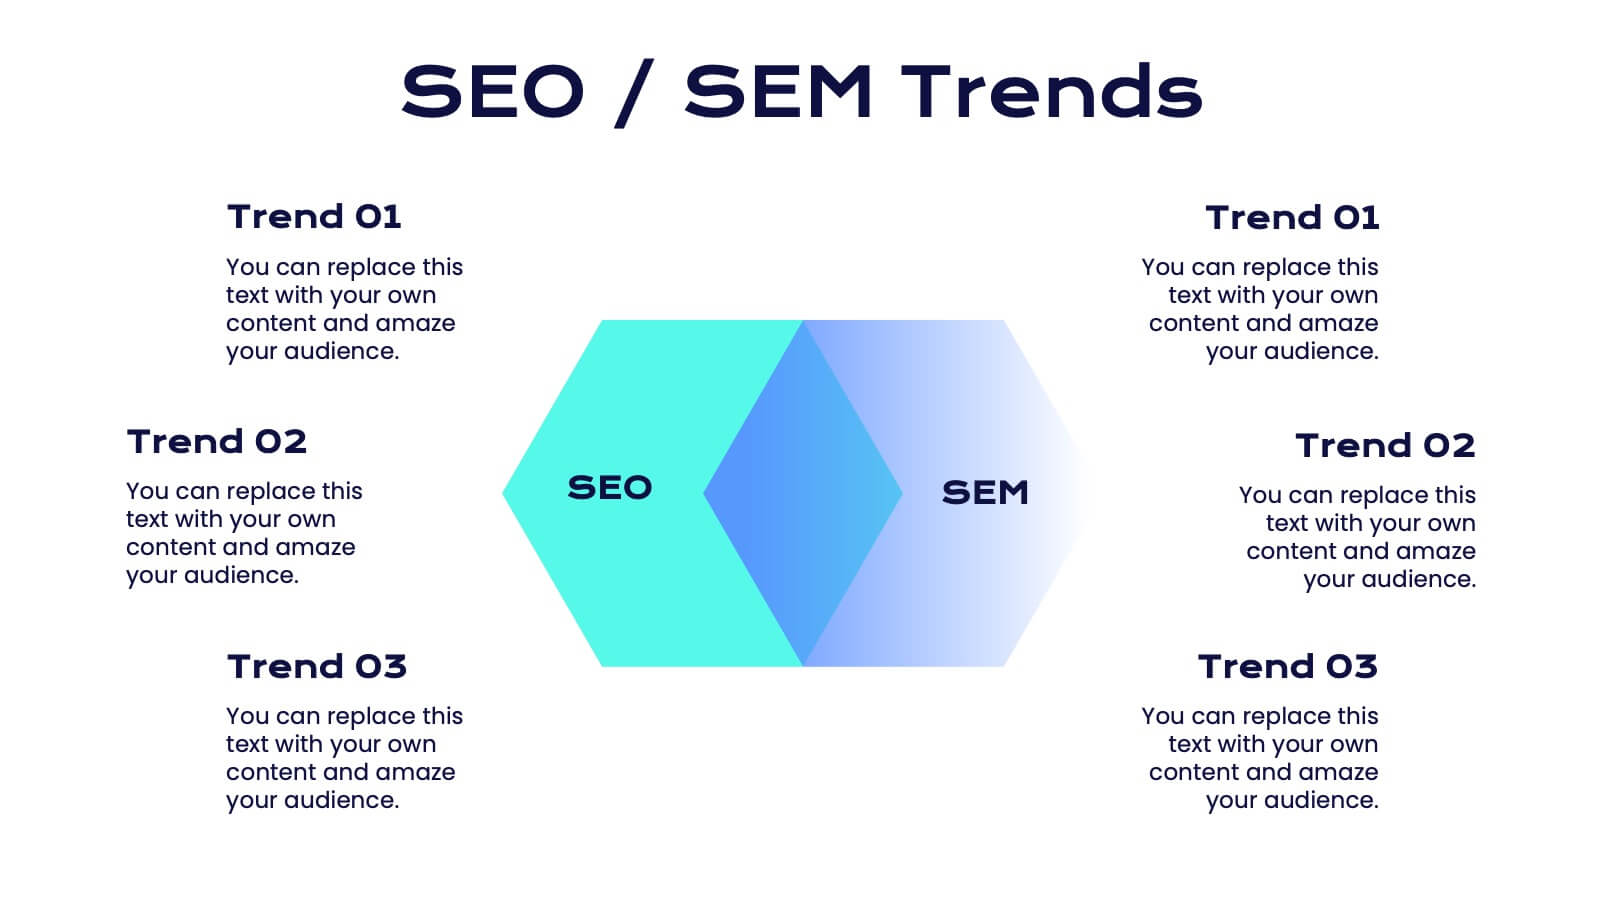
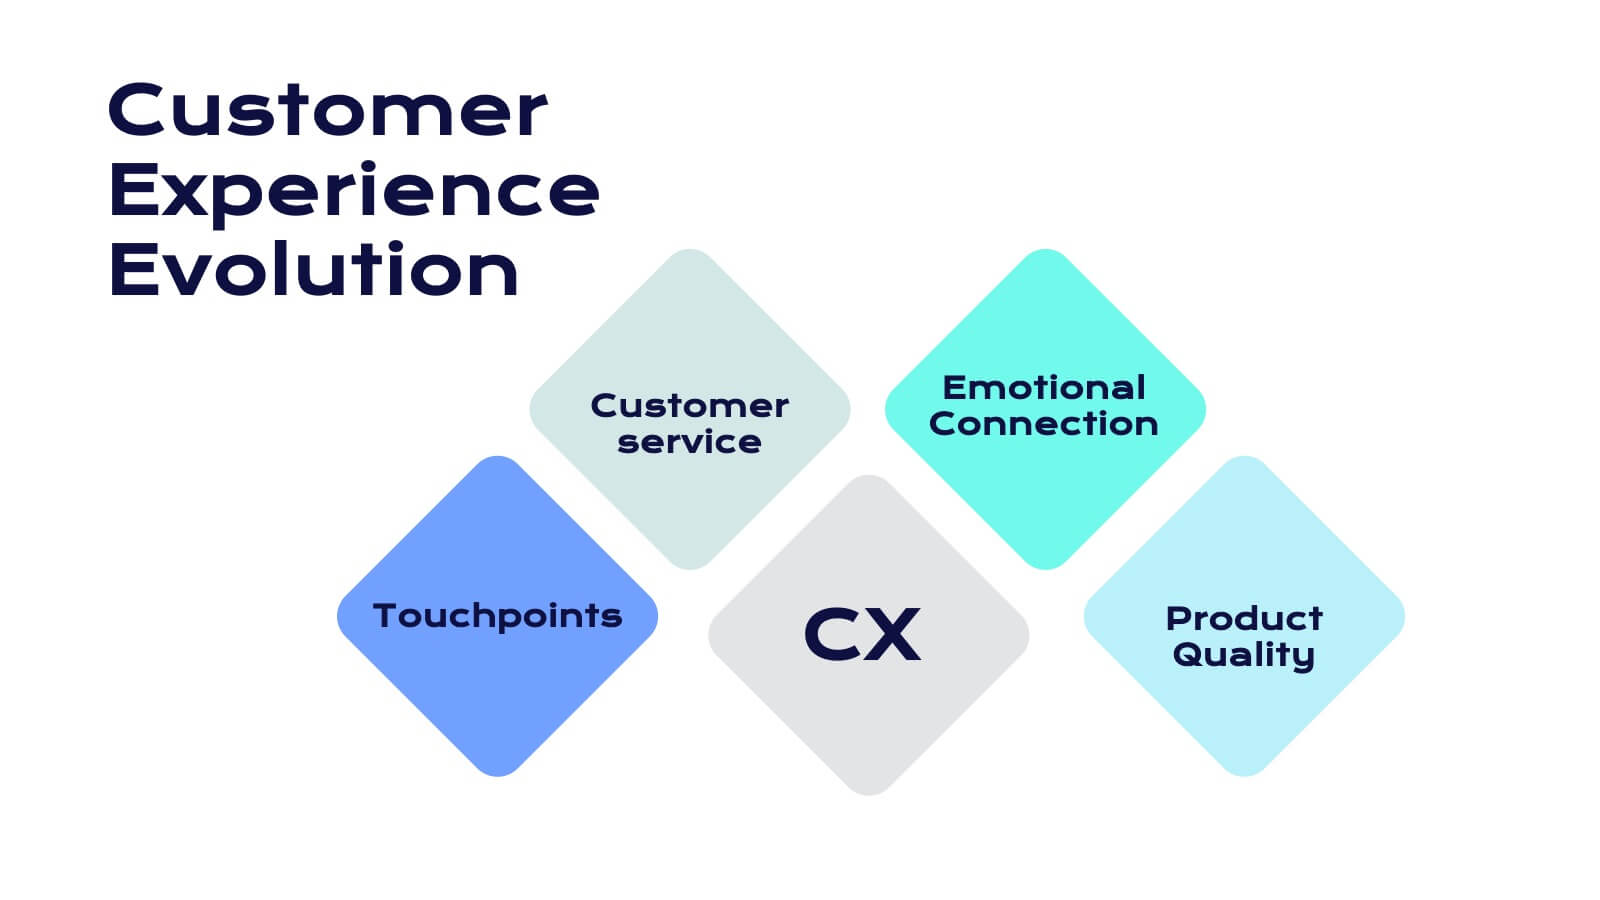
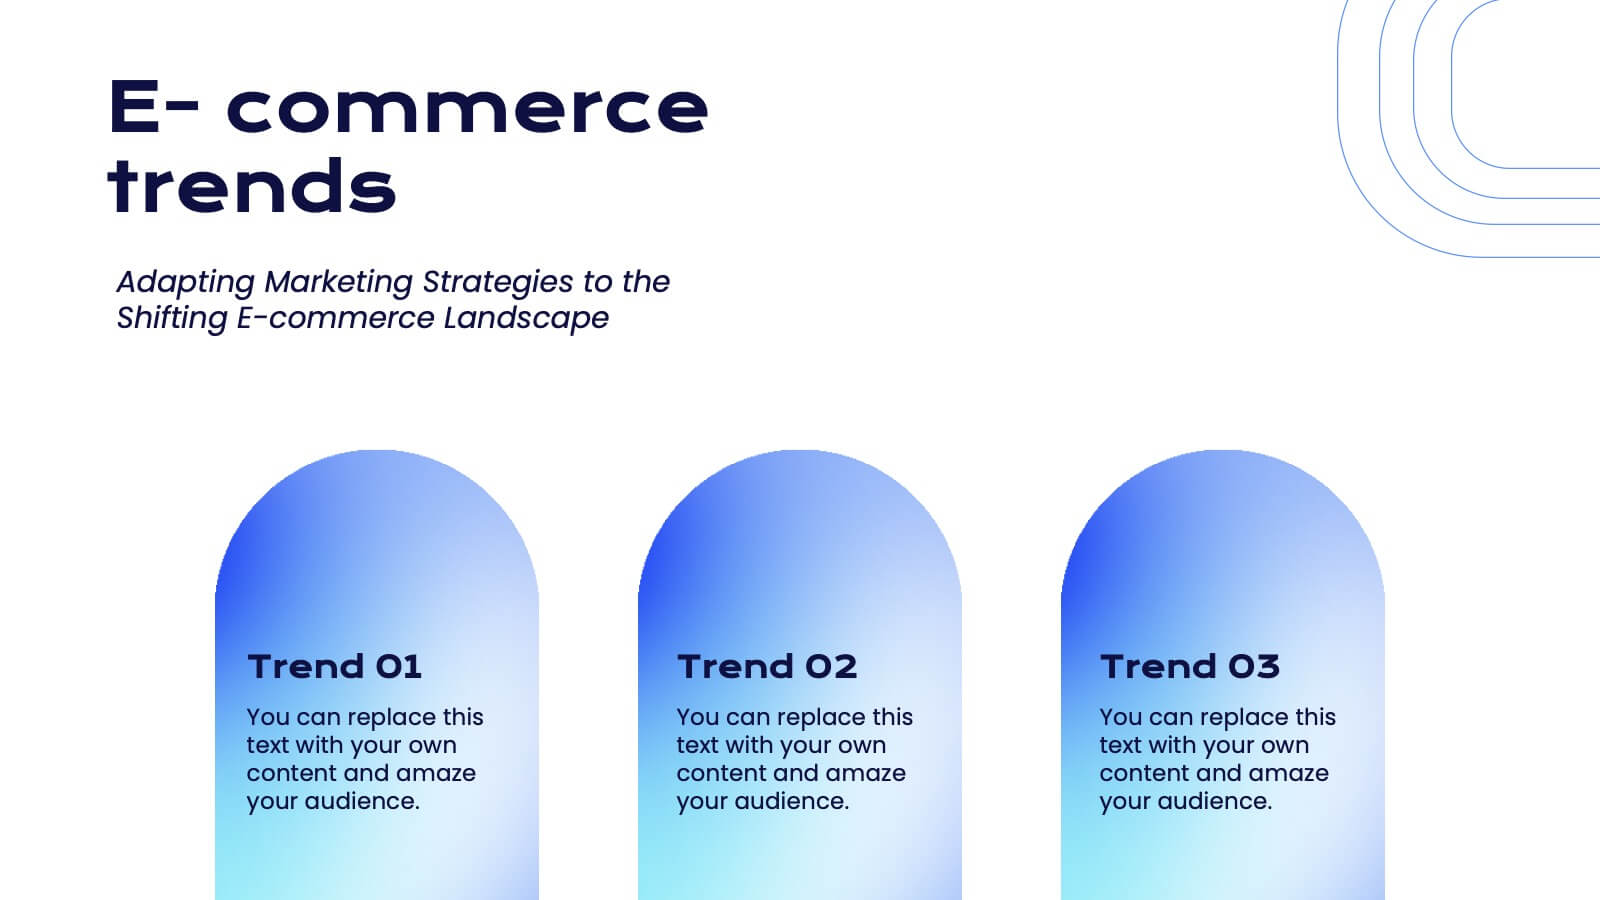
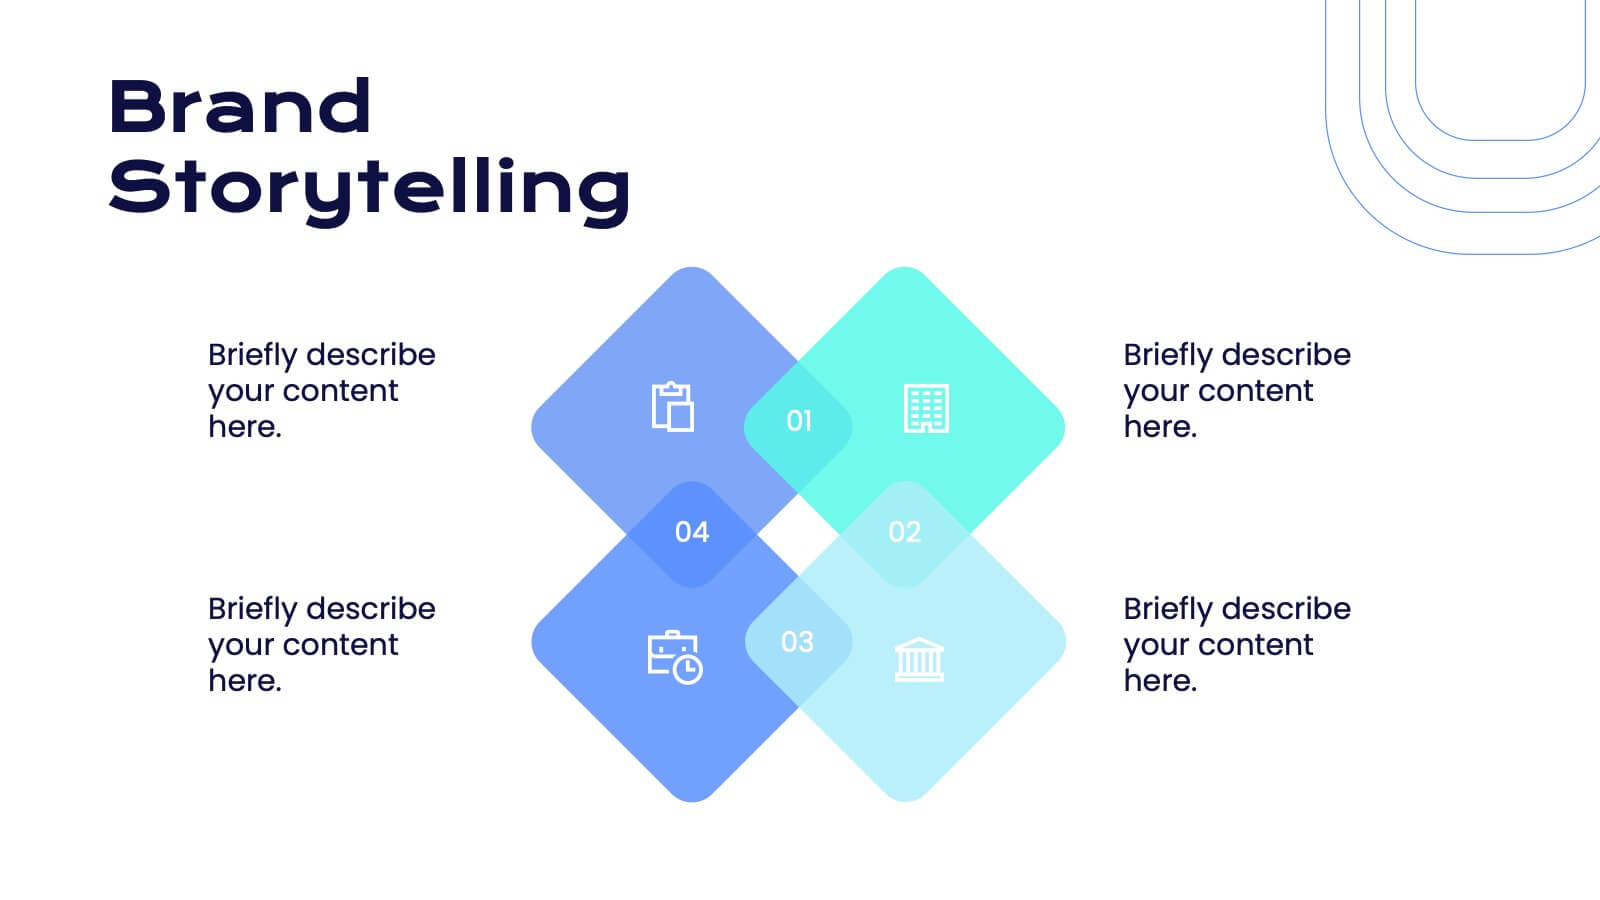
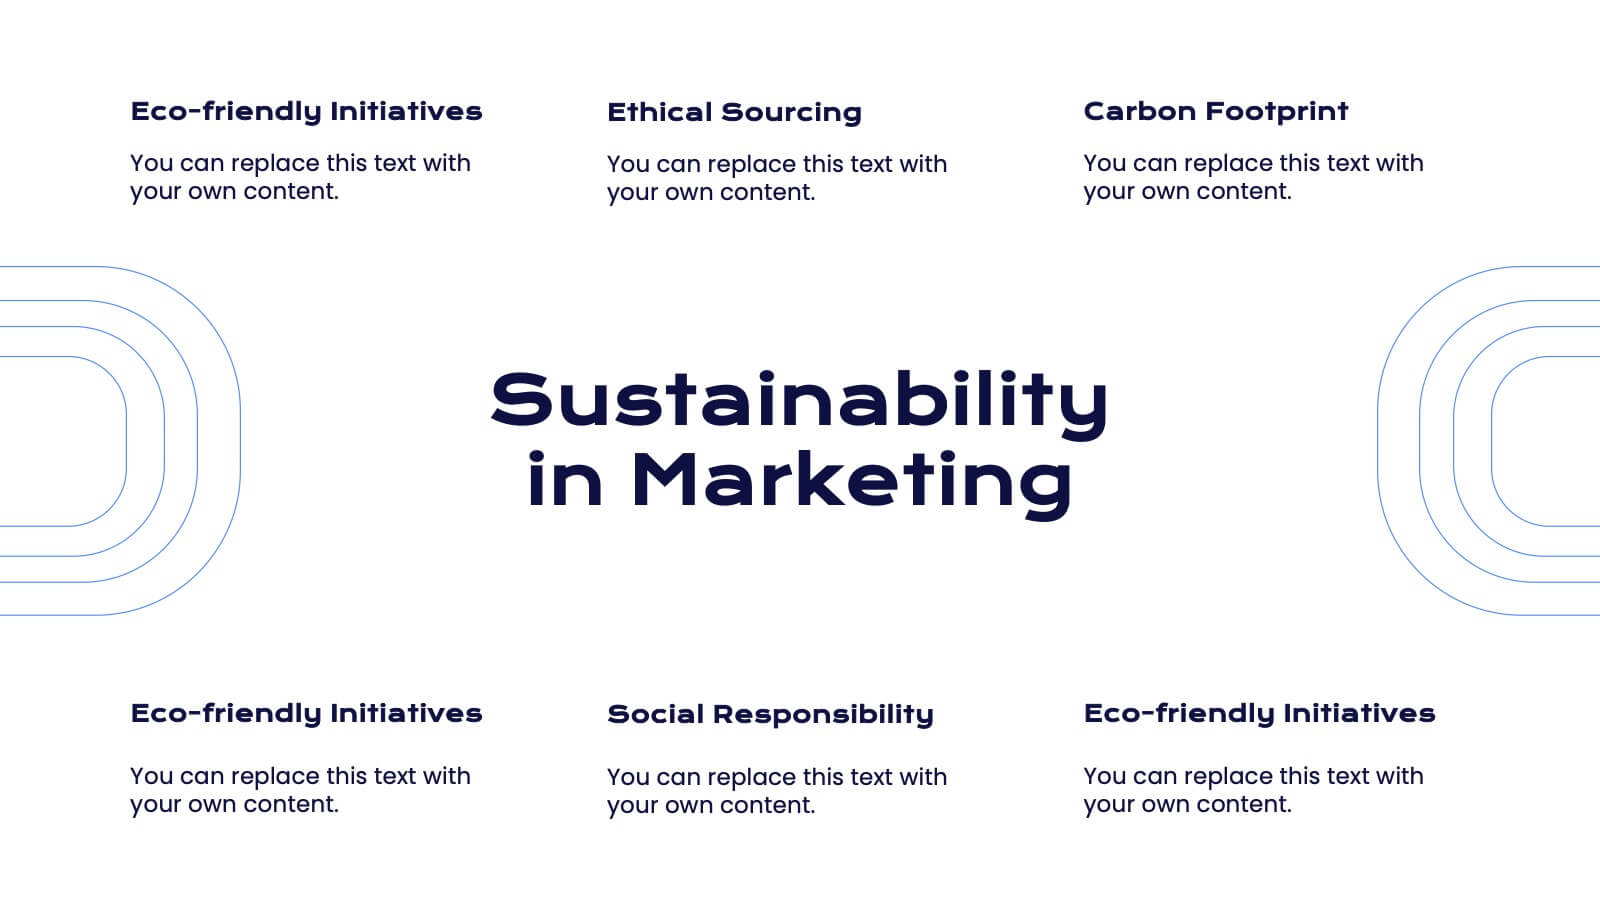
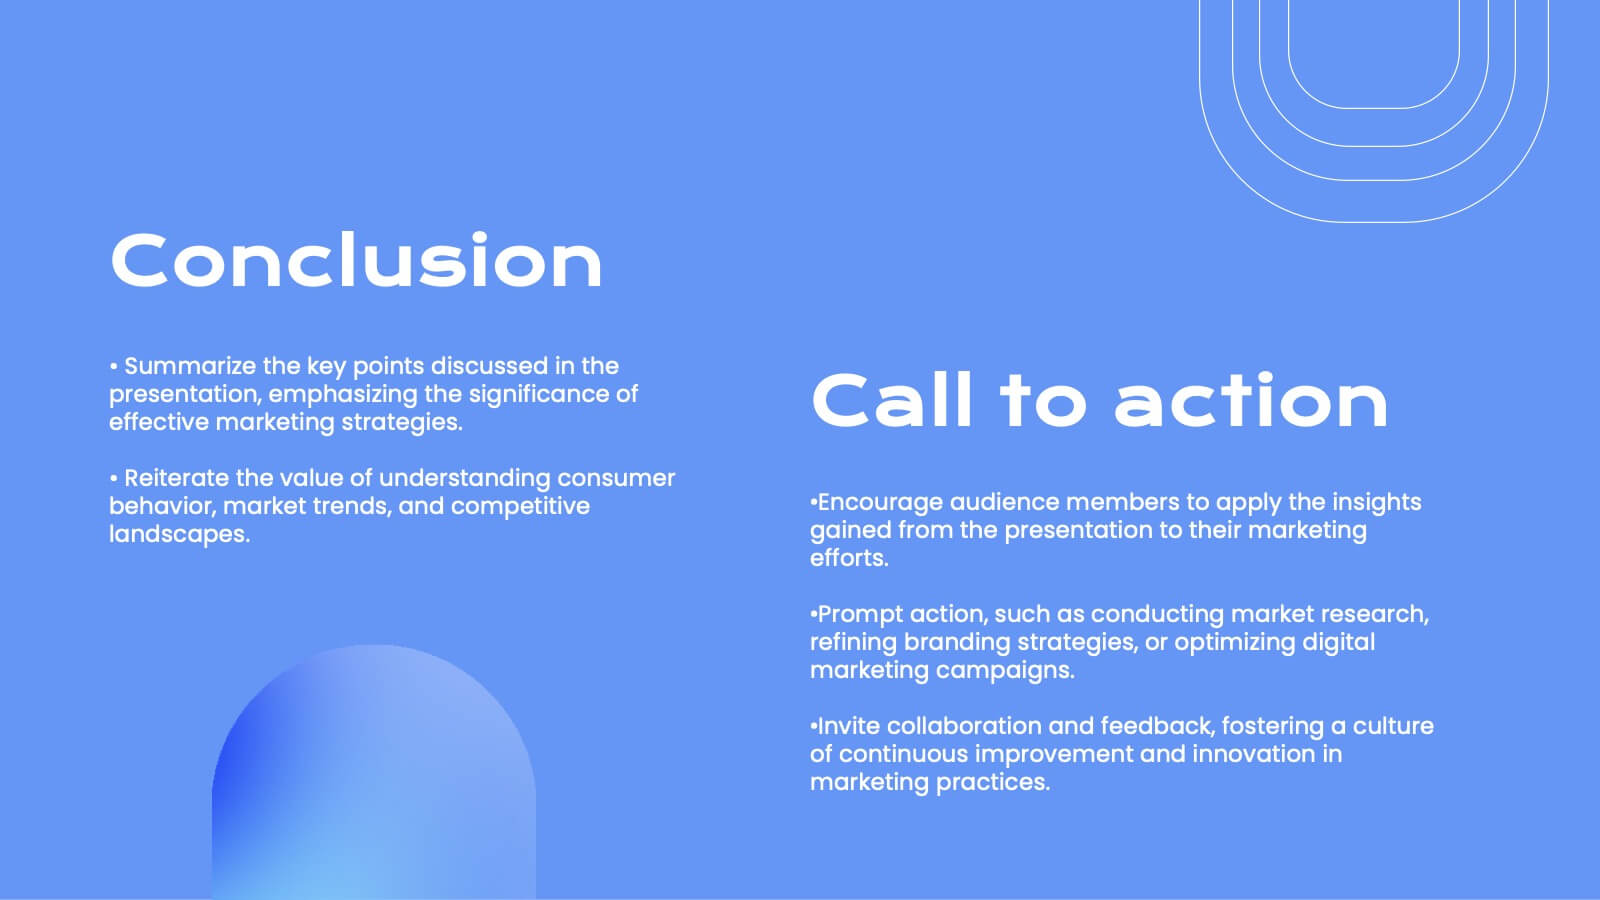
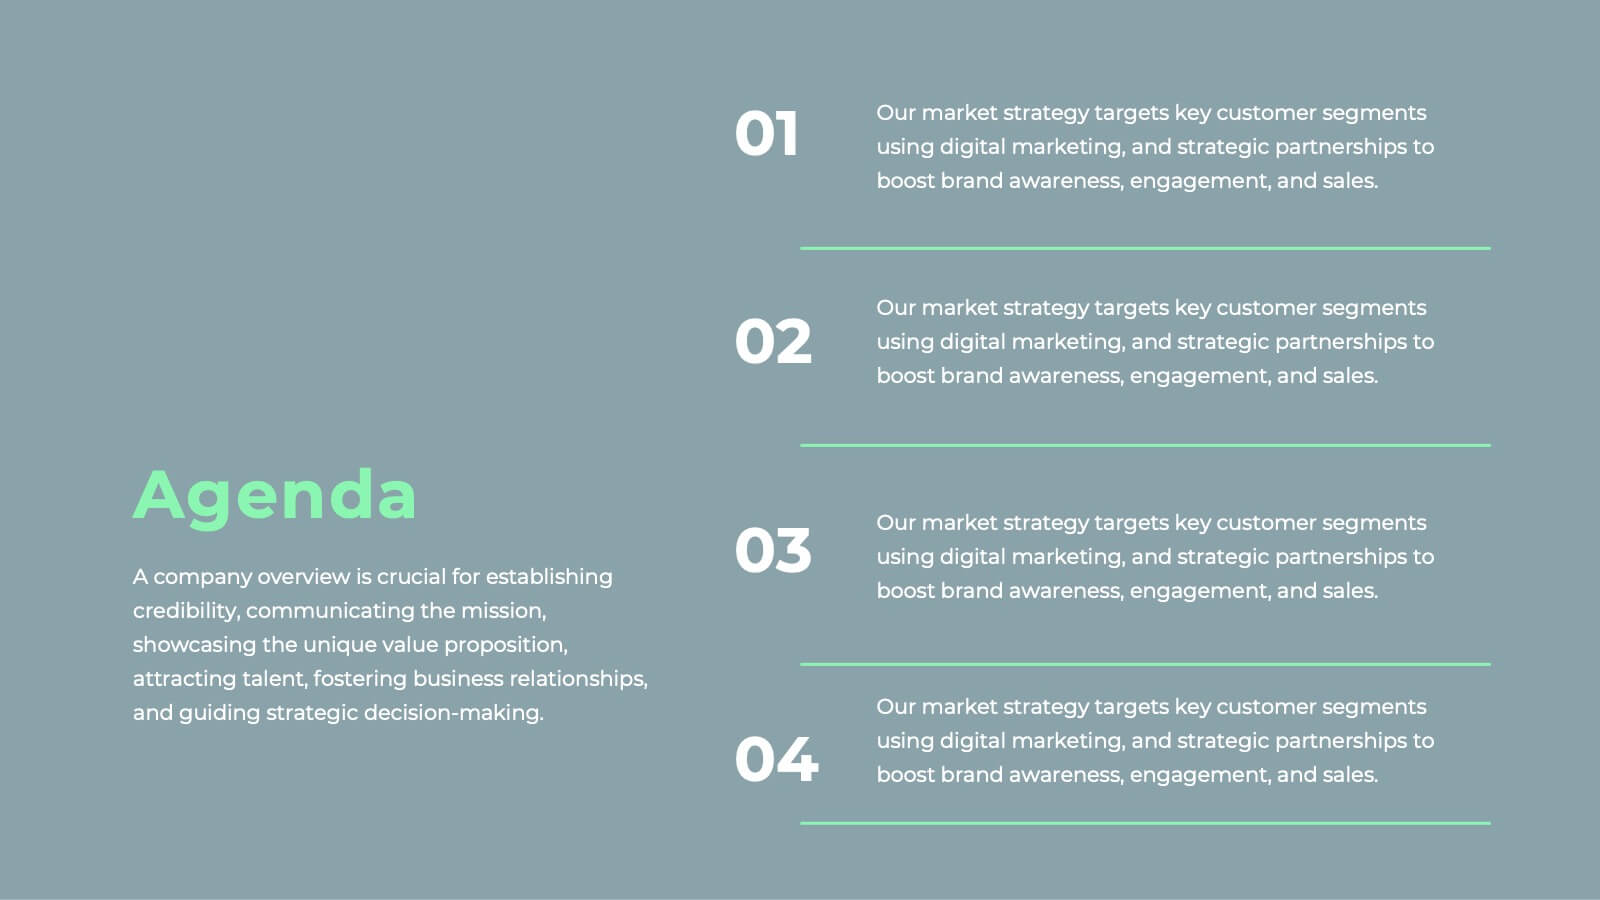
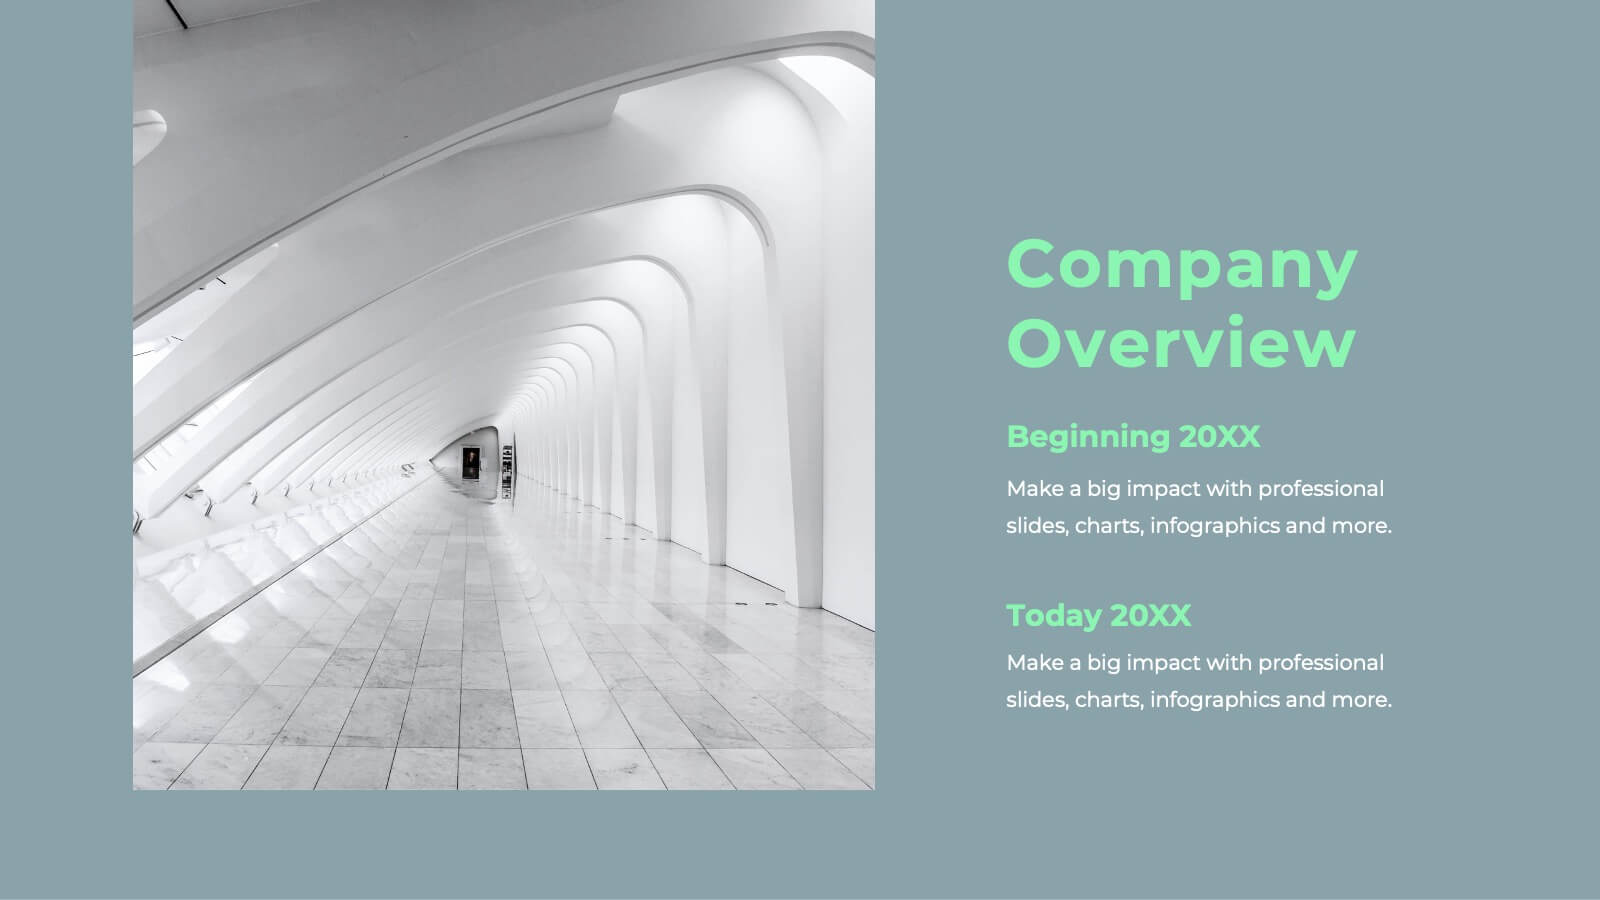
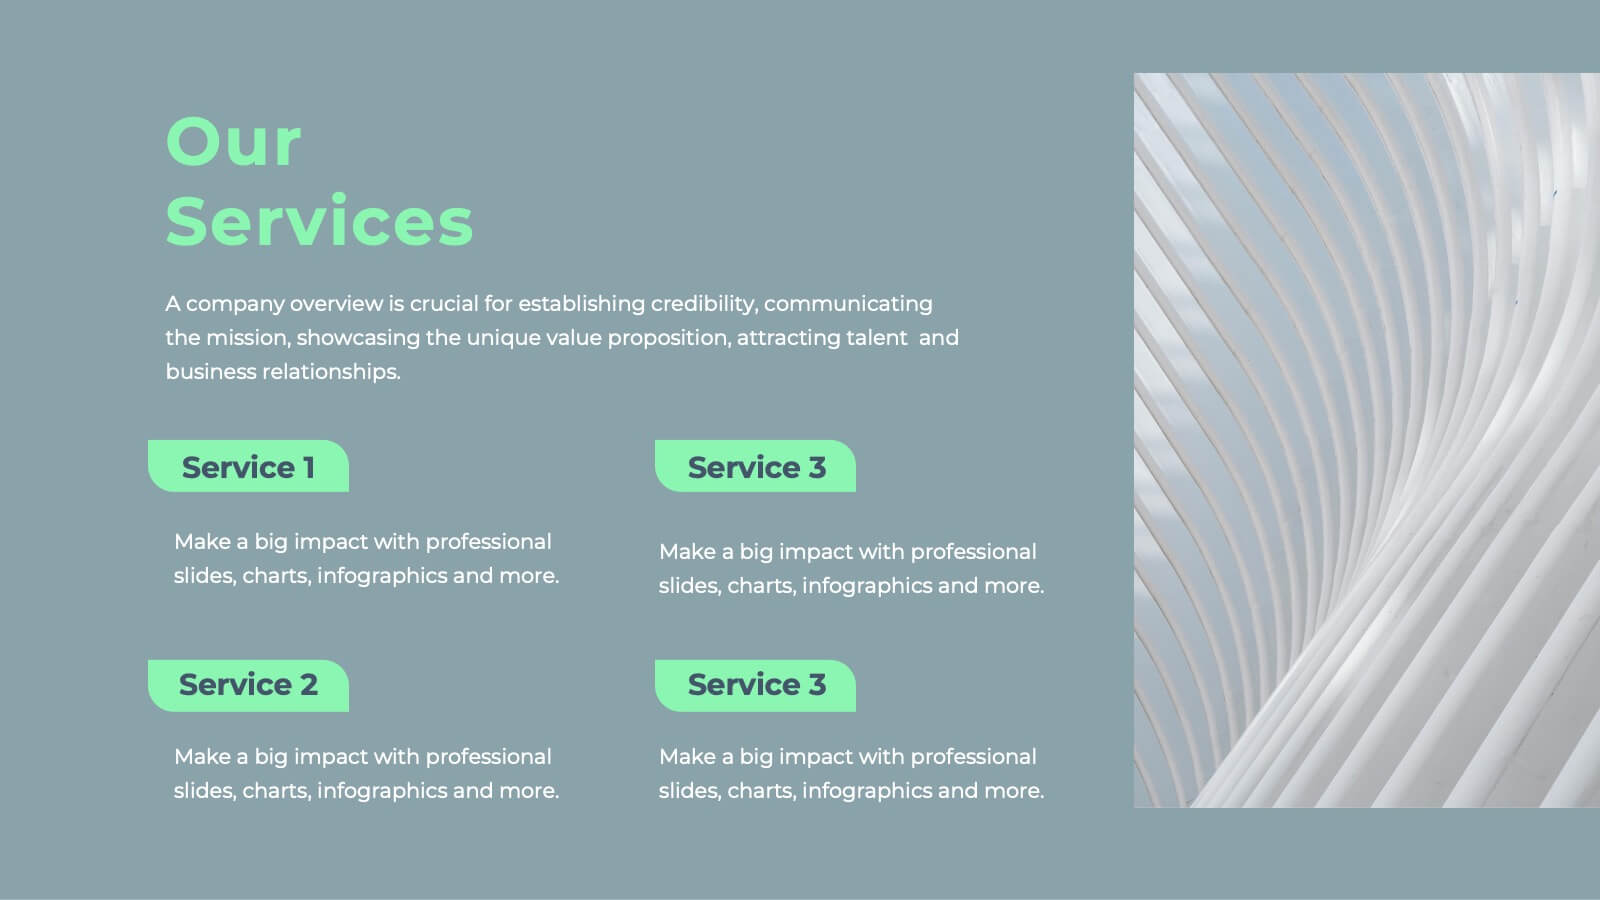
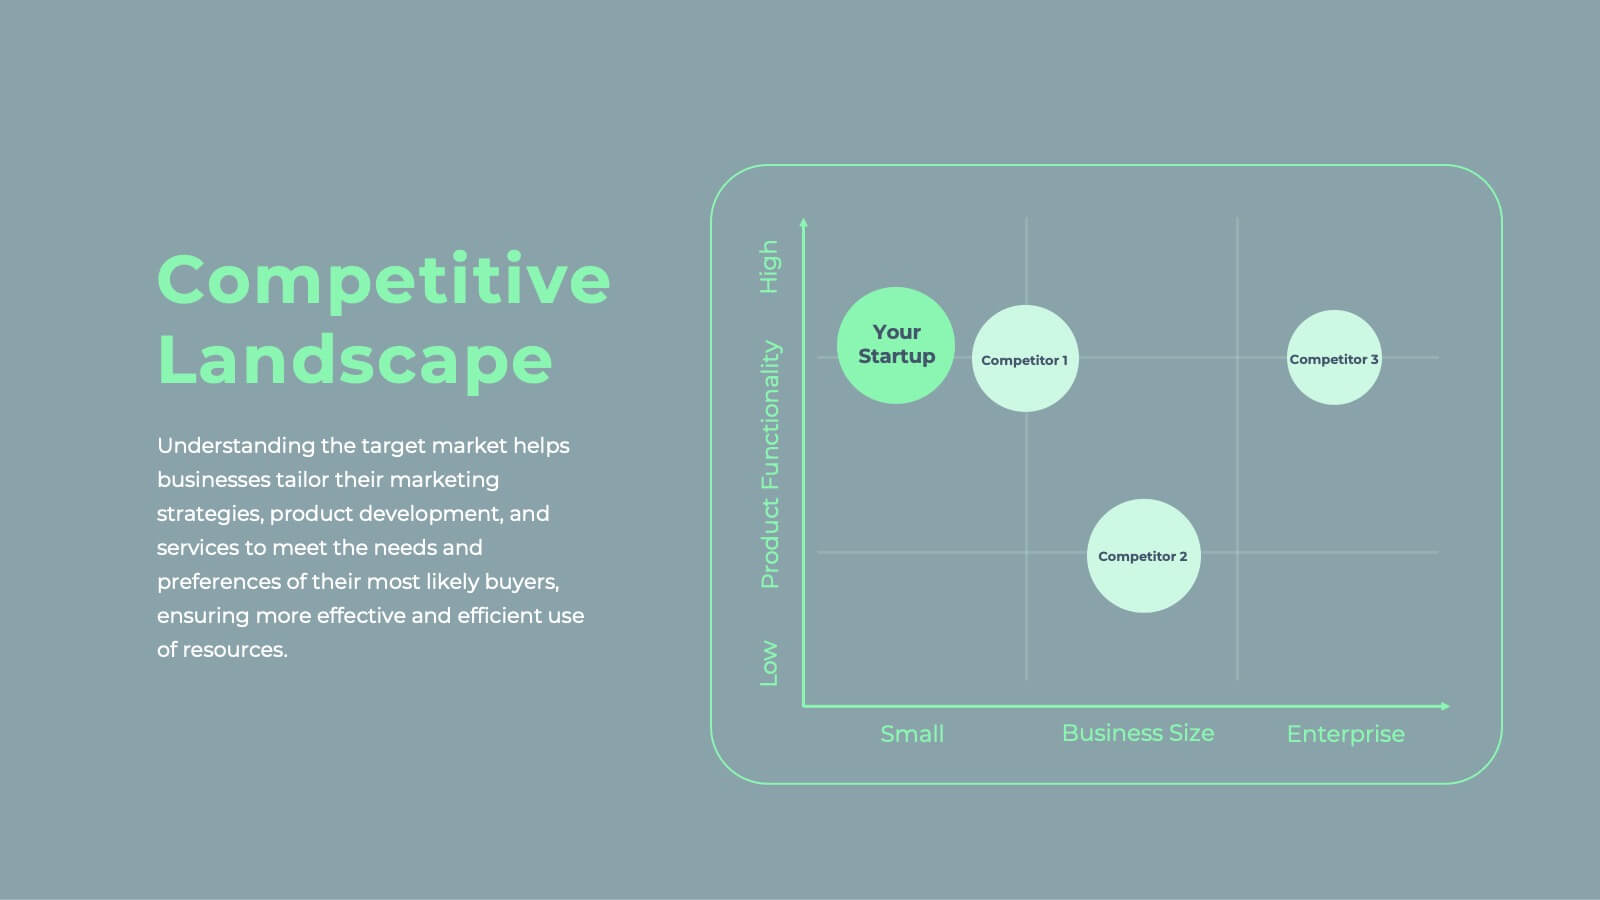
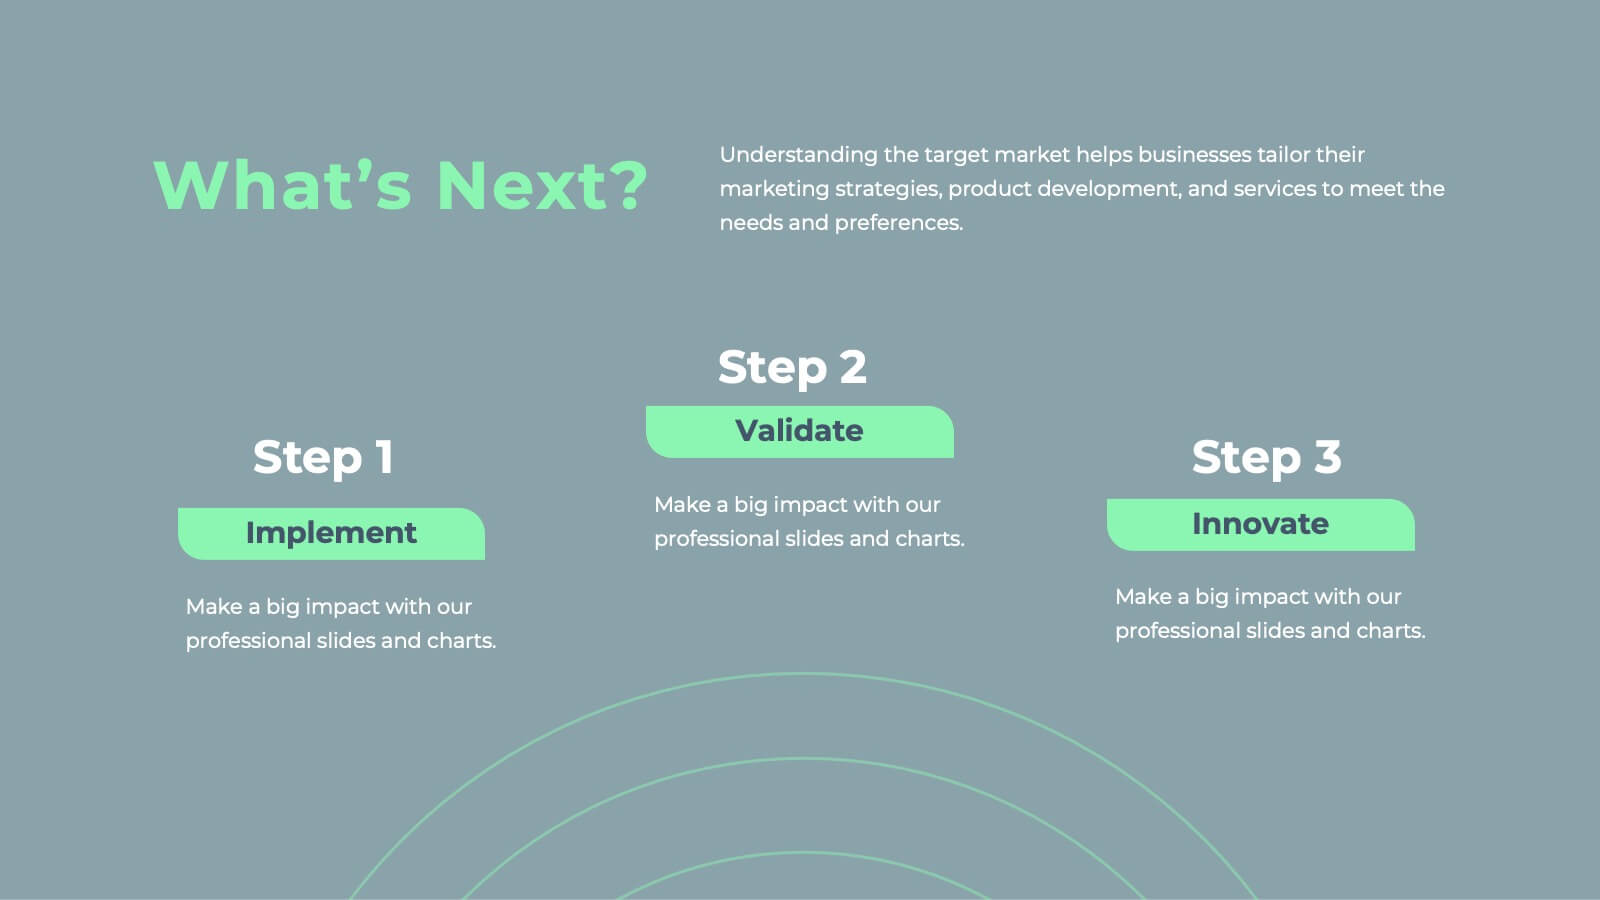
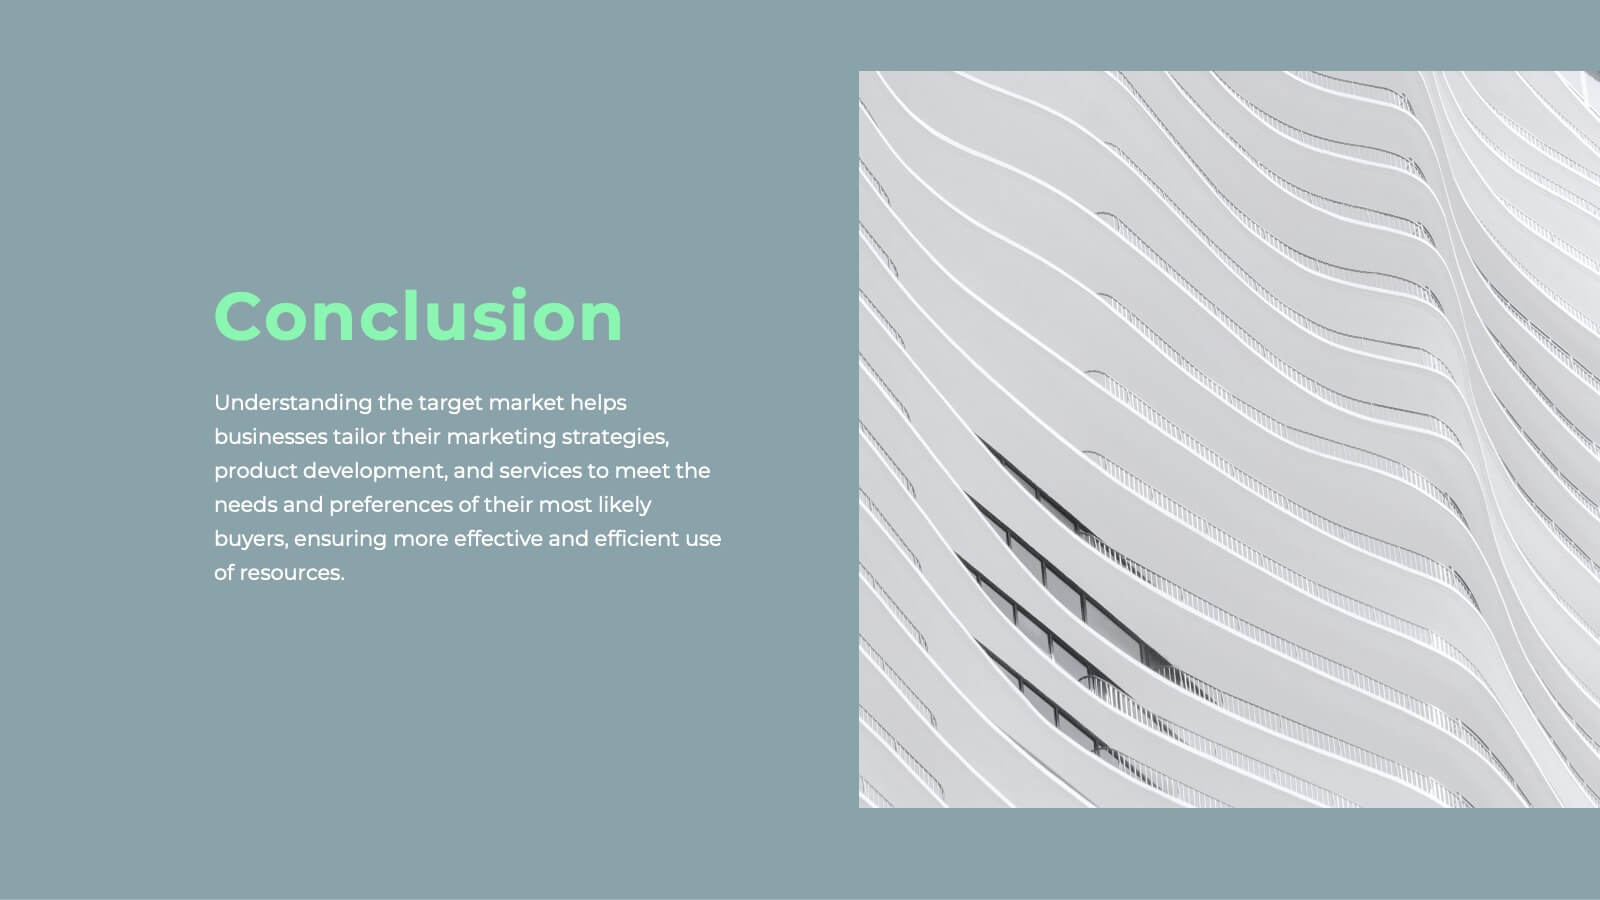
Faerie Digital Marketing Strategy Plan Presentation
Create a compelling marketing strategy with this sleek, modern template! It covers key topics like consumer behavior, social media strategies, and emerging trends. Perfect for showcasing insights in a clear, data-driven format. Fully customizable, it works seamlessly with PowerPoint, Keynote, and Google Slides for effective presentations.


12 diapositivas
Breast Cancer Awareness Day Presentation
The Breast Cancer Awareness Day presentation template is an essential tool for health awareness campaigns. With distinctive pink icons symbolizing support and education, this template is perfect for seminars and presentations. It's fully compatible with PowerPoint, Keynote, and Google Slides, enhancing accessibility and user experience.


5 diapositivas
Monthly Report Statistics Infographics
A Monthly Report is a document that provides an overview of activities, progress, achievements, and challenges within a specific month. These infographic templates are designed to present monthly data and statistics in a clear and engaging manner. These infographics will help you showcase key information effectively. This is perfect for preparing reports for management, stakeholders, clients, or colleagues, this template will help you communicate your findings clearly and impressively. Compatible with Powerpoint, Keynote, and Google Slides, its customizable design and visual appeal will ensures that your monthly reports are engaging and informative.


5 diapositivas
5-Layer Circle Diagram Presentation
Bring complex ideas to life with a clean circular layout that reveals information in five clear, connected layers. This presentation helps you break down concepts, compare levels, or showcase structured processes in a visually intuitive way that keeps audiences focused. Fully compatible with PowerPoint, Keynote, and Google Slides.


4 diapositivas
Top Priorities and Checklist Format Presentation
Stay focused and aligned with the Top Priorities and Checklist Format Presentation. This clear, checklist-based design is ideal for highlighting action items, goals, or key project deliverables. Visually guide your team with structured sections and a checklist illustration that reinforces accountability. Fully editable in PowerPoint, Keynote, and Google Slides.


23 diapositivas
Orbit Marketing Strategy Plan Presentation
Elevate your marketing strategy presentations with this vibrant and dynamic template! Perfect for analyzing market trends, identifying target audiences, and outlining strategic objectives. Ideal for marketing professionals aiming to captivate their audience and drive results. Compatible with PowerPoint, Keynote, and Google Slides, this template ensures your strategy is clear, compelling, and effective.


7 diapositivas
Modern Artificial Intelligence Infographic
Modern Artificial Intelligence refers to the contemporary state of AI technology, methods, and applications that have evolved significantly in recent years, especially from the early 21st century onwards. This infographic template is designed to present complex information in a clear and engaging manner. This template uses visuals like charts, graphs, icons, and text to enhance understanding. The objective of this infographic is to provide a visual and informative snapshot of the contemporary landscape of artificial intelligence, making complex concepts accessible to a broad audience.


7 diapositivas
Data Governance Infographic
Navigate the world of data management with our governance infographic. Painted in a thoughtful blend of orange, white, and blue, this template simplifies the multifaceted realm of data governance for its viewers. Perfectly tailored for IT professionals, data analysts, business strategists, and educators, it breaks down the key components of data governance in a visually compelling manner. Enriched with custom graphics, icons, and dedicated image placeholders, this tool can transform any presentation into a memorable one. And with compatibility spanning PowerPoint, Keynote, and Google Slides, it’s designed for universal appeal.


7 diapositivas
Law and Compliance Presentation
Bring order and precision to your reports with this modern, structured layout designed to simplify complex regulations and policies. Perfect for presenting legal processes, compliance updates, or governance strategies, it blends professionalism with clarity. Fully compatible with PowerPoint, Keynote, and Google Slides for seamless editing and presentation flexibility.

21 diapositivas
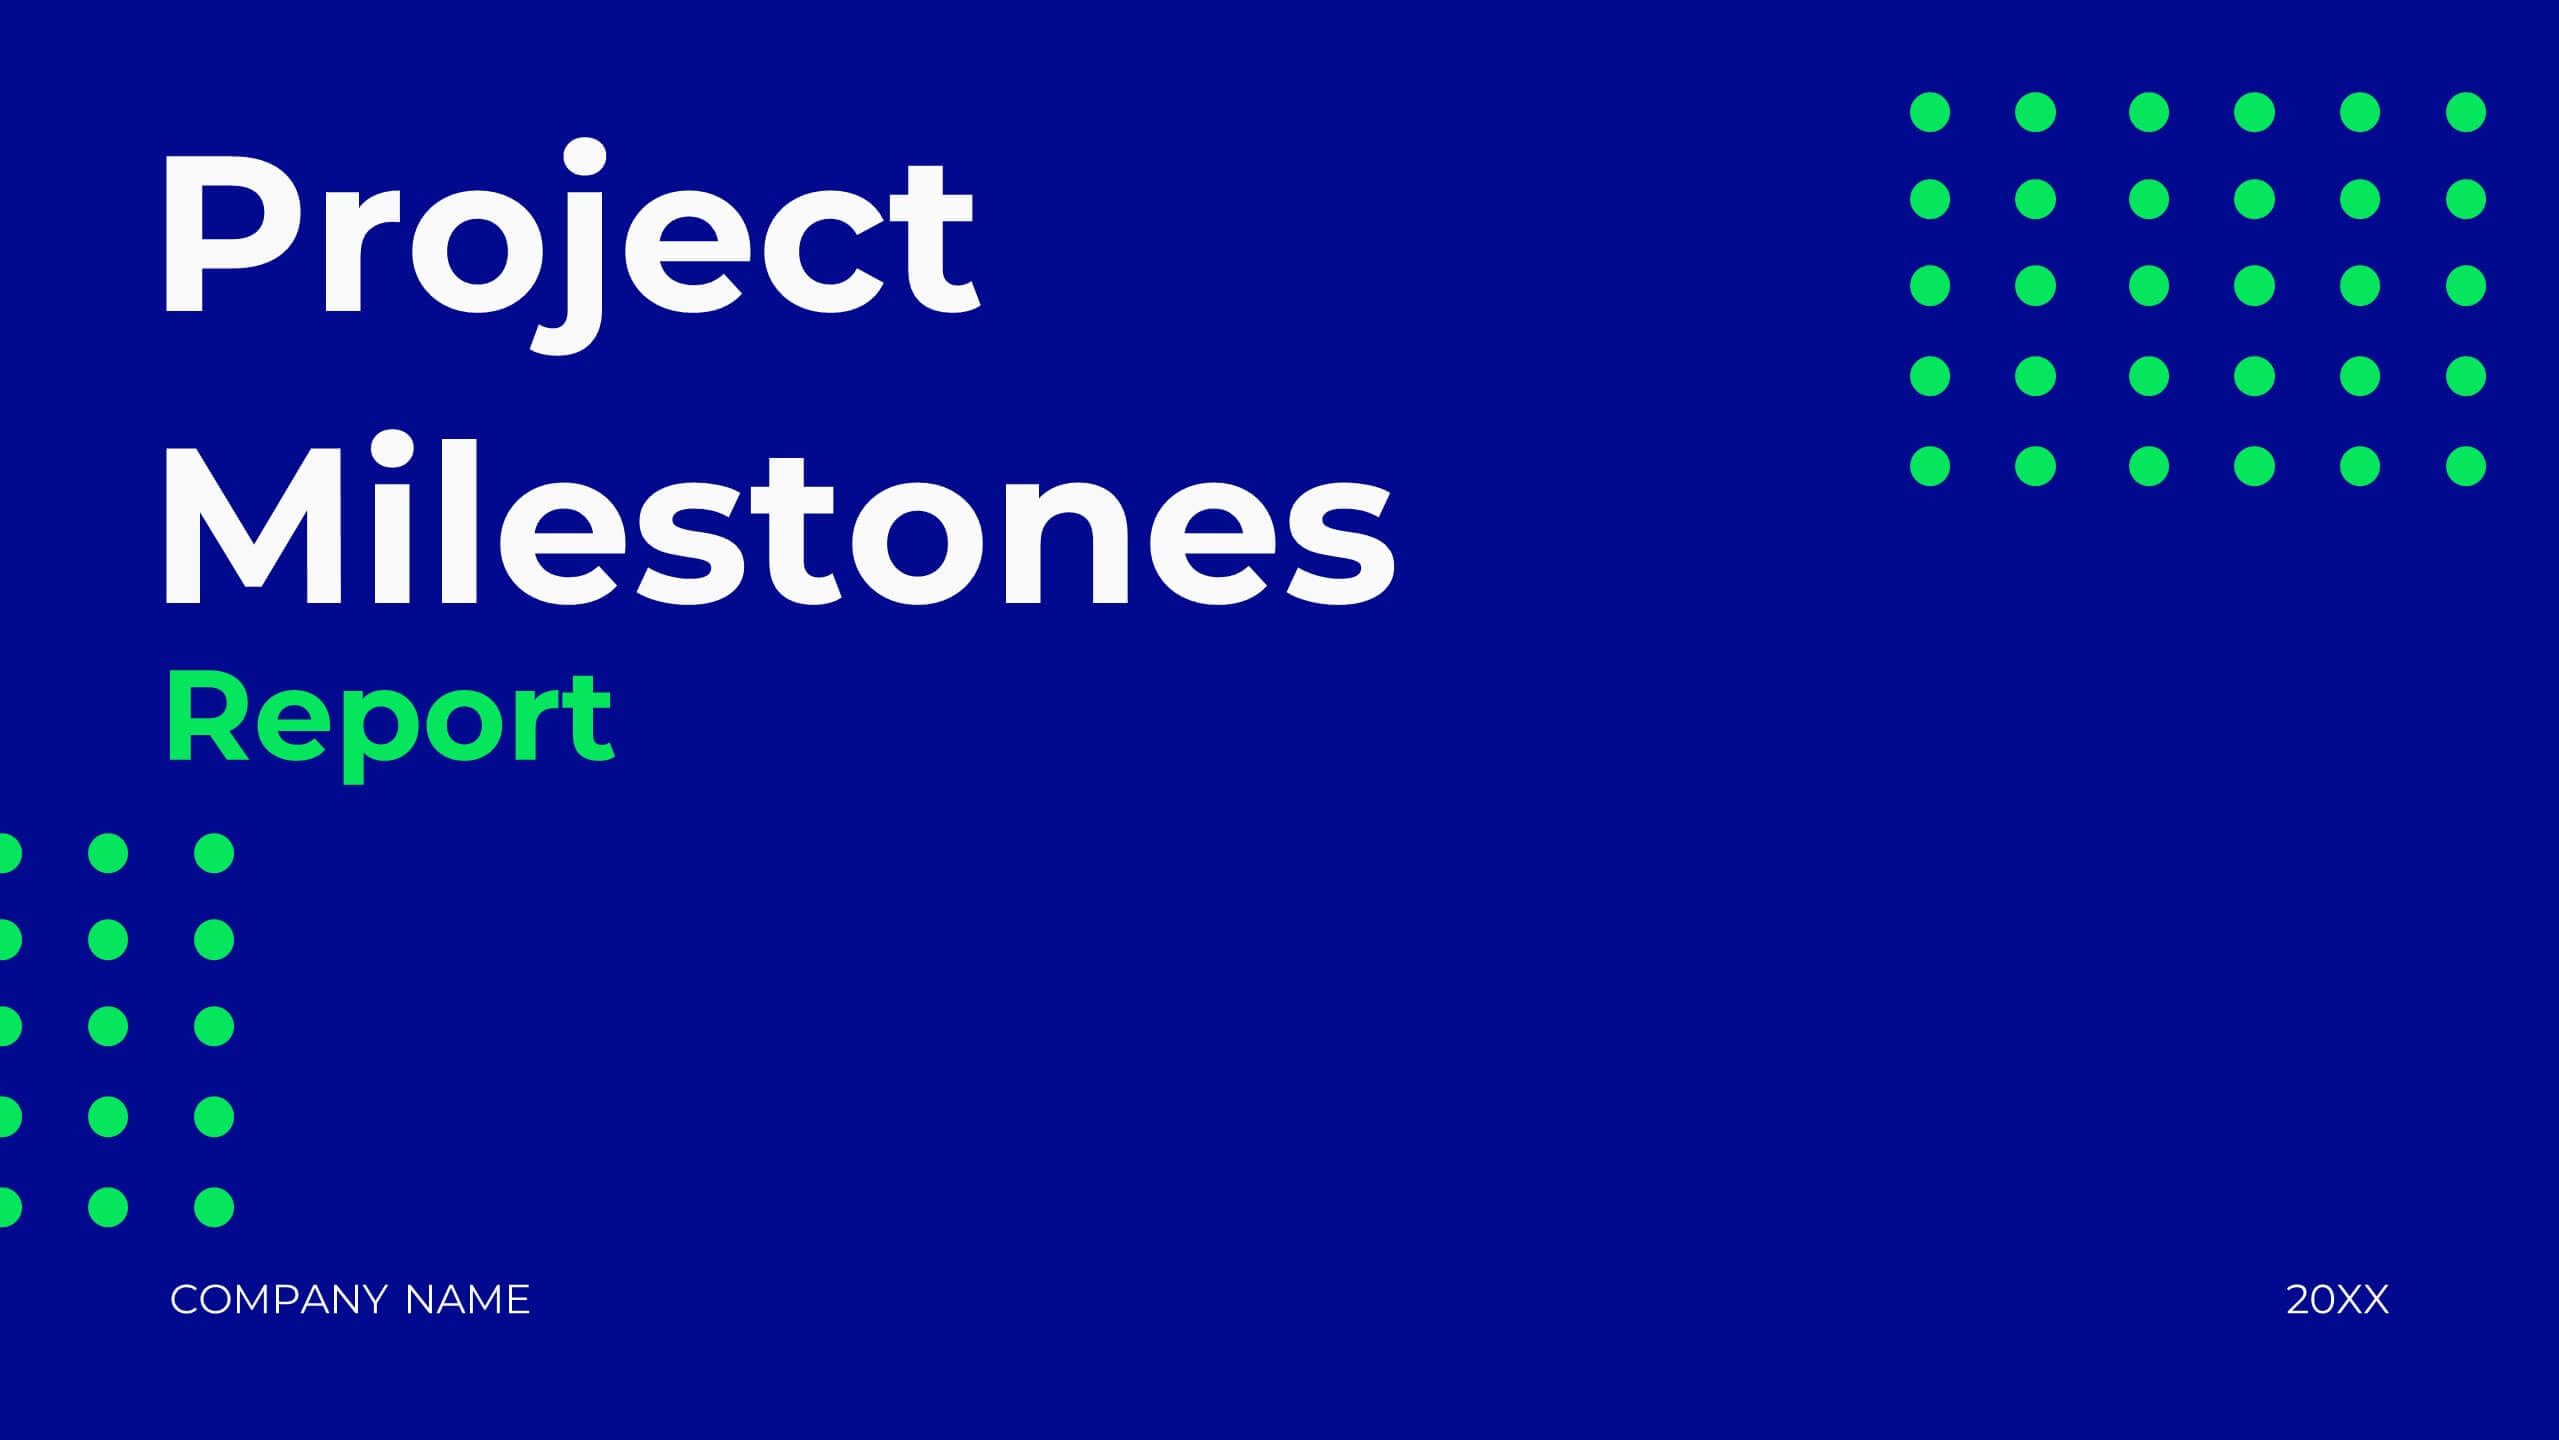
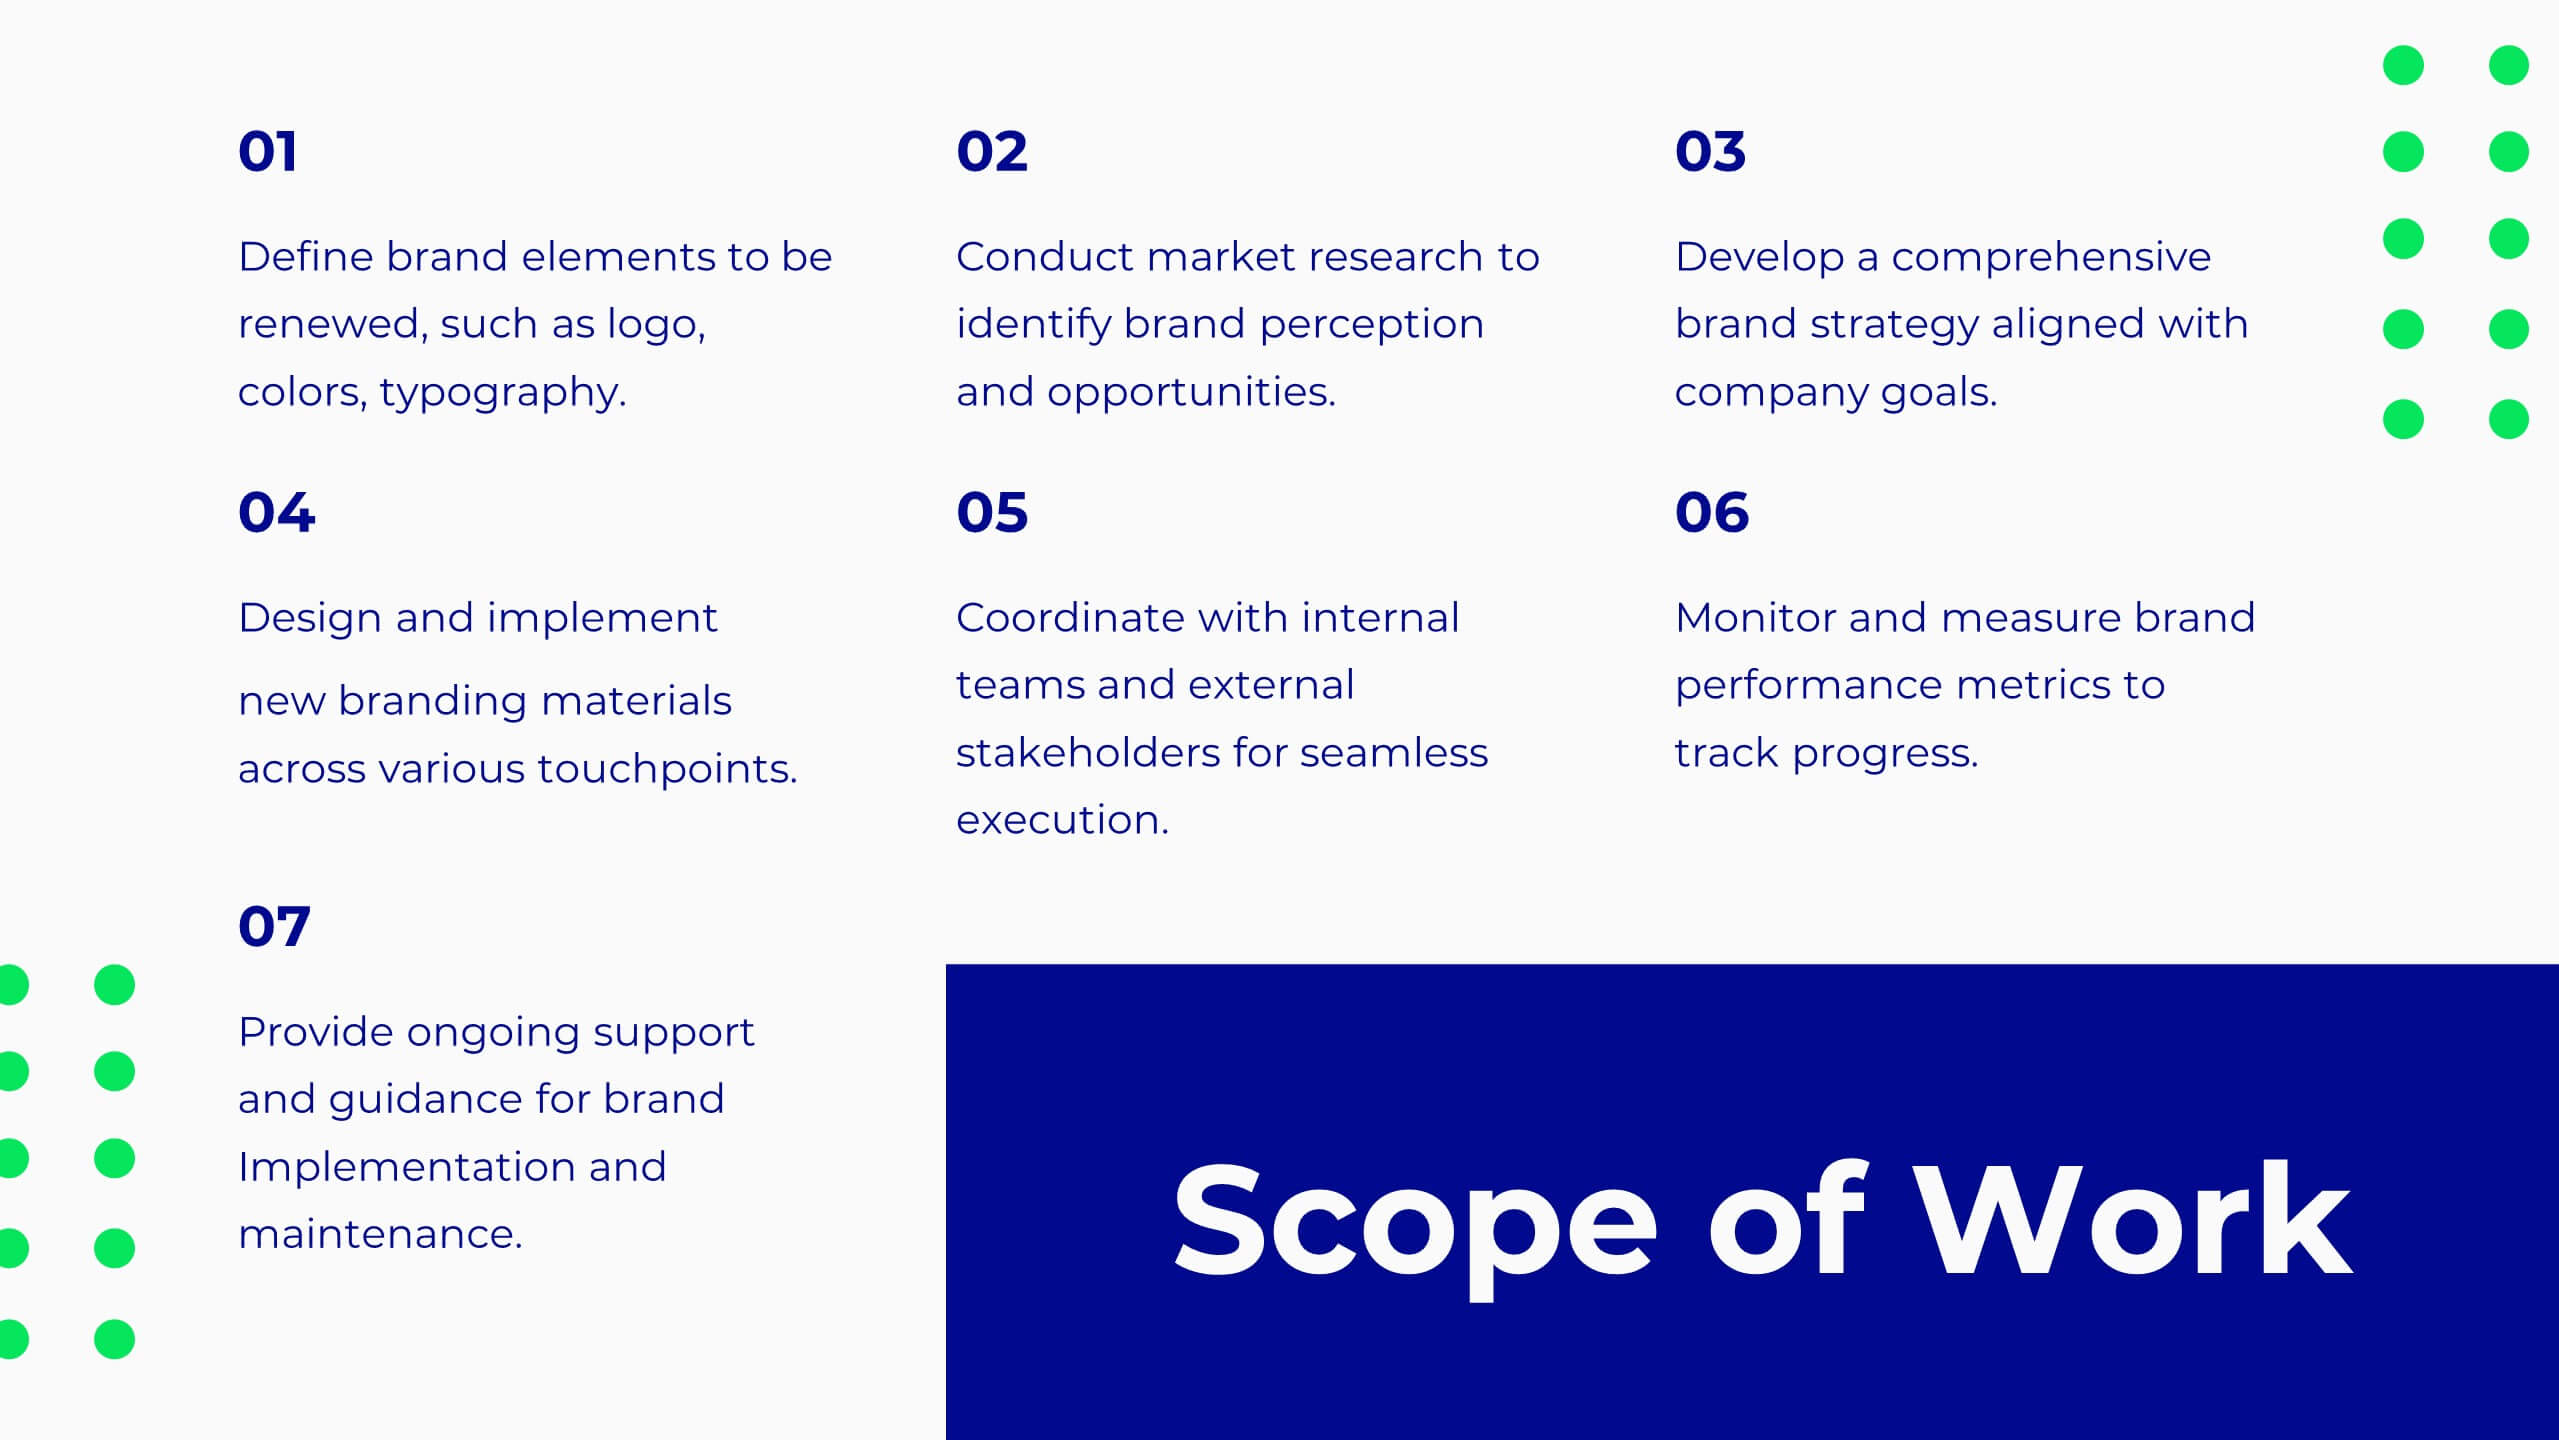
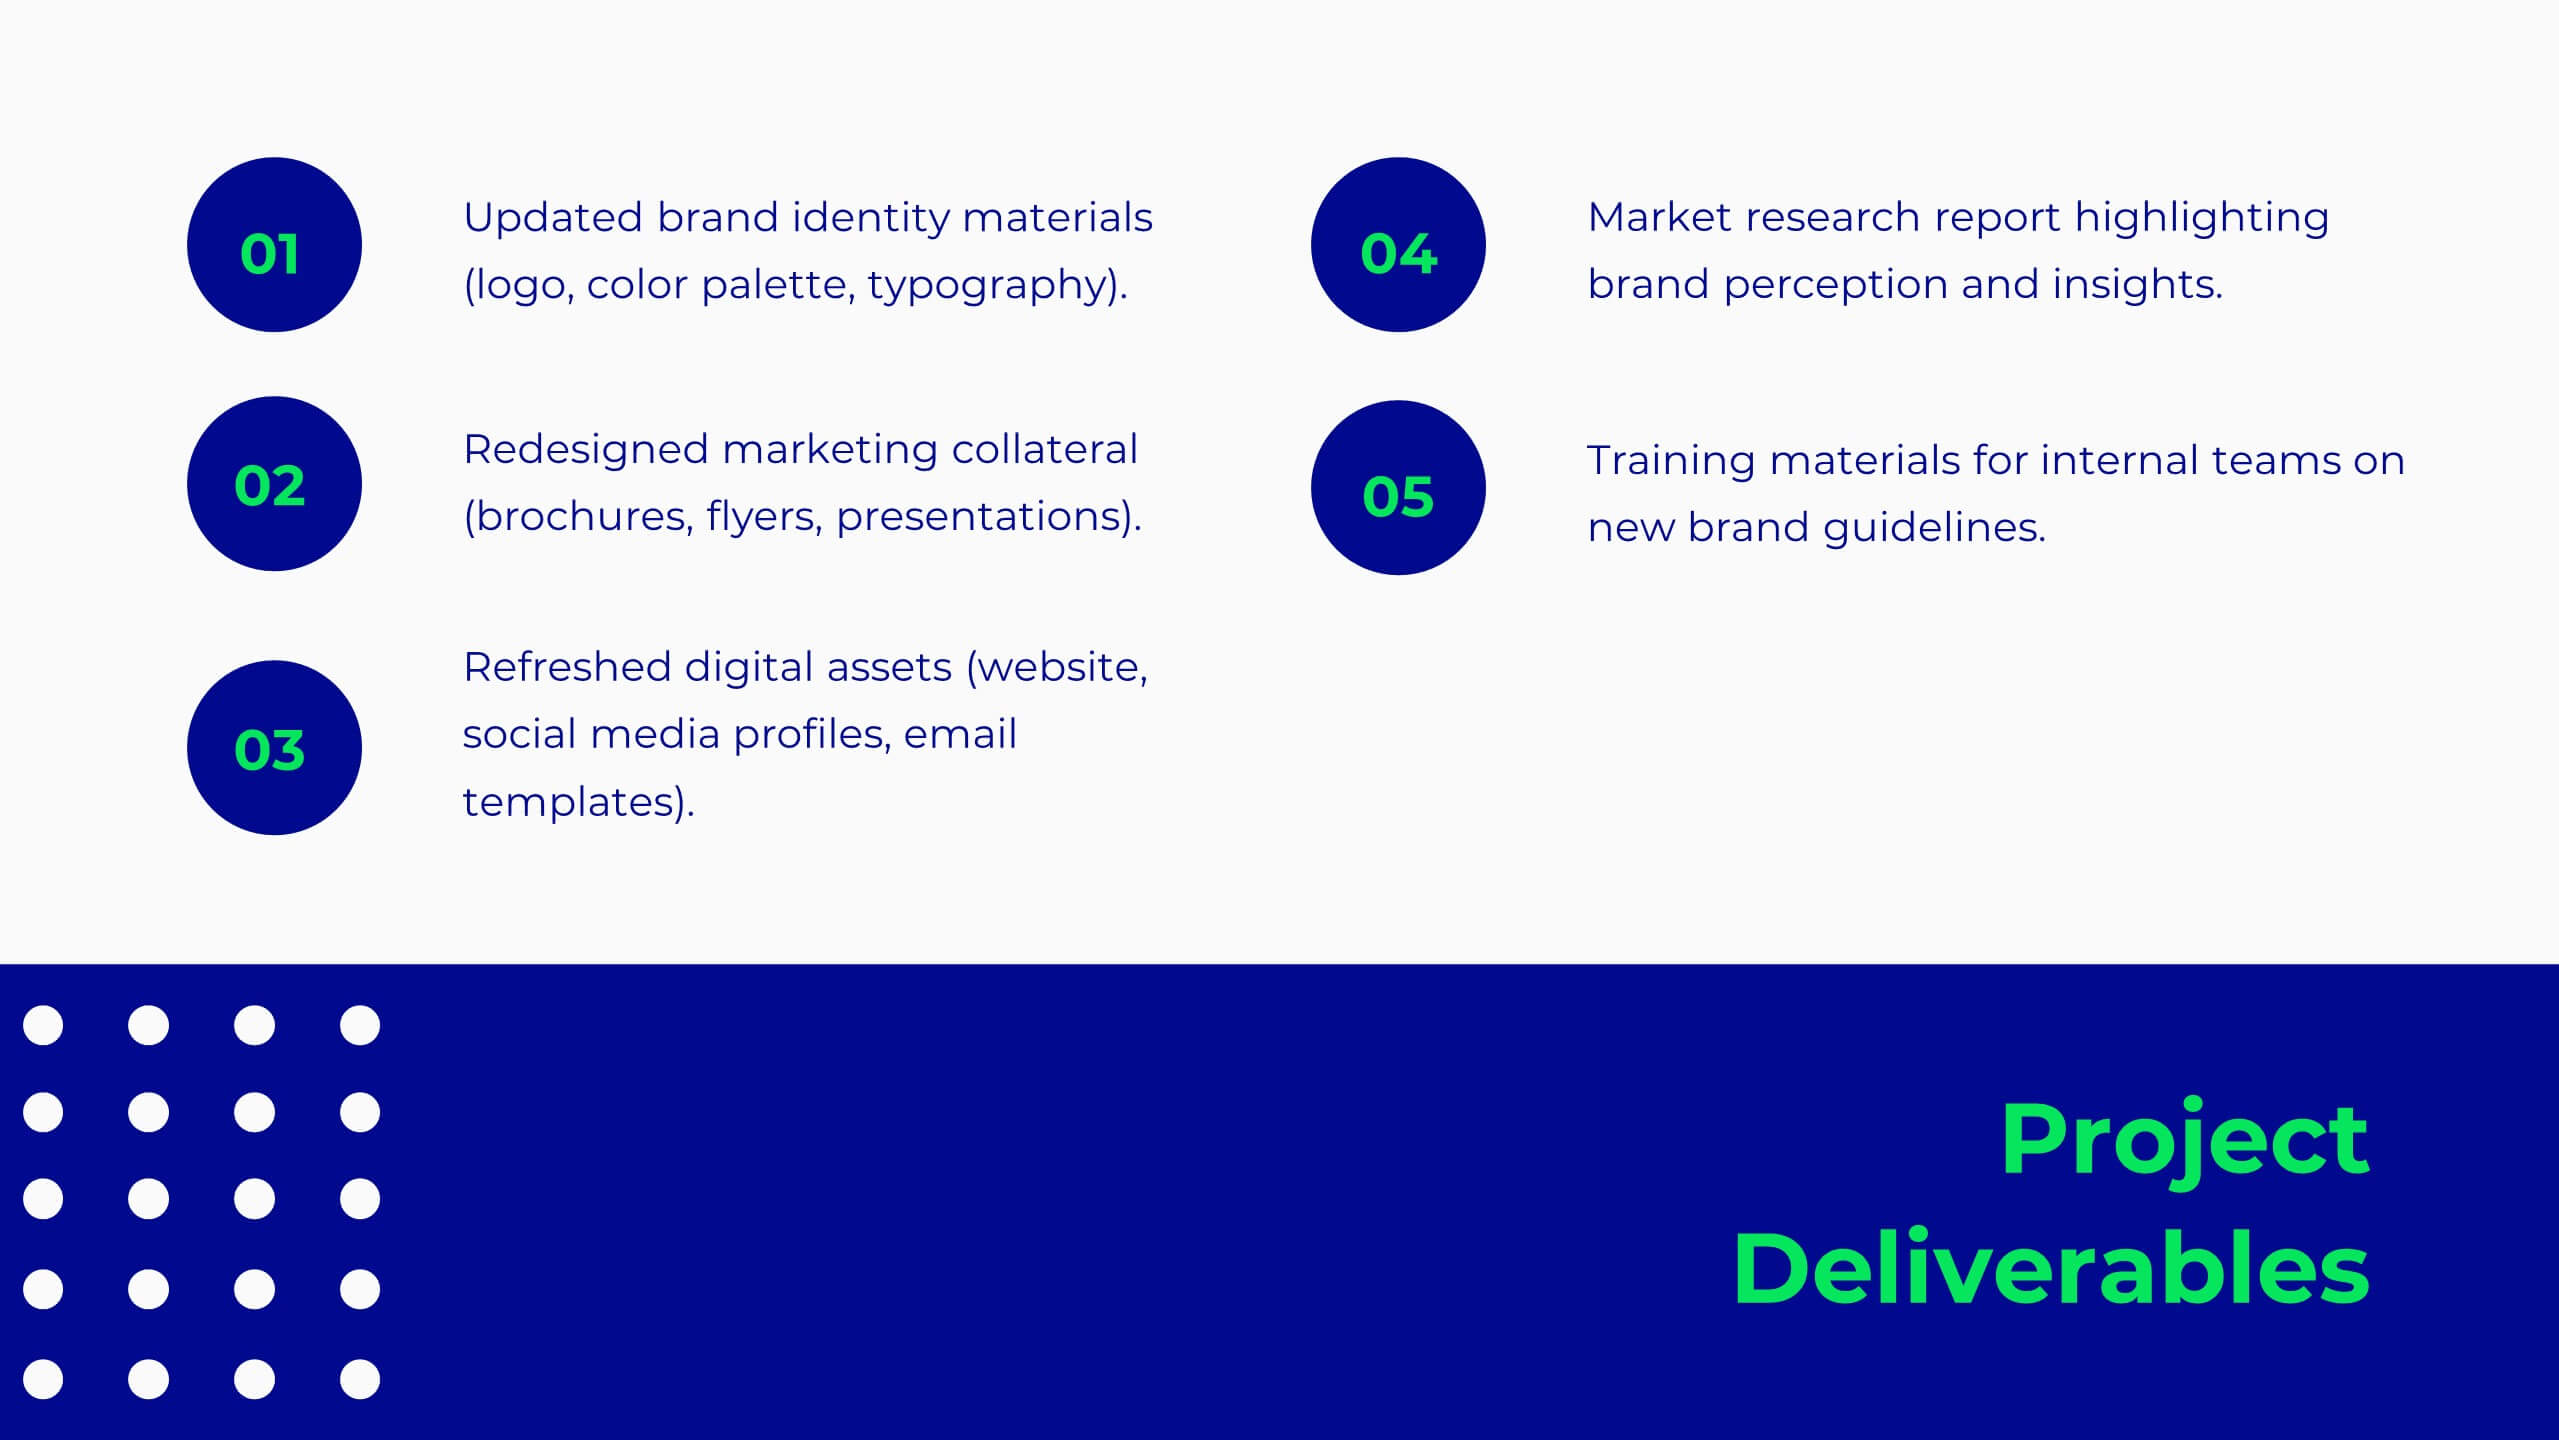
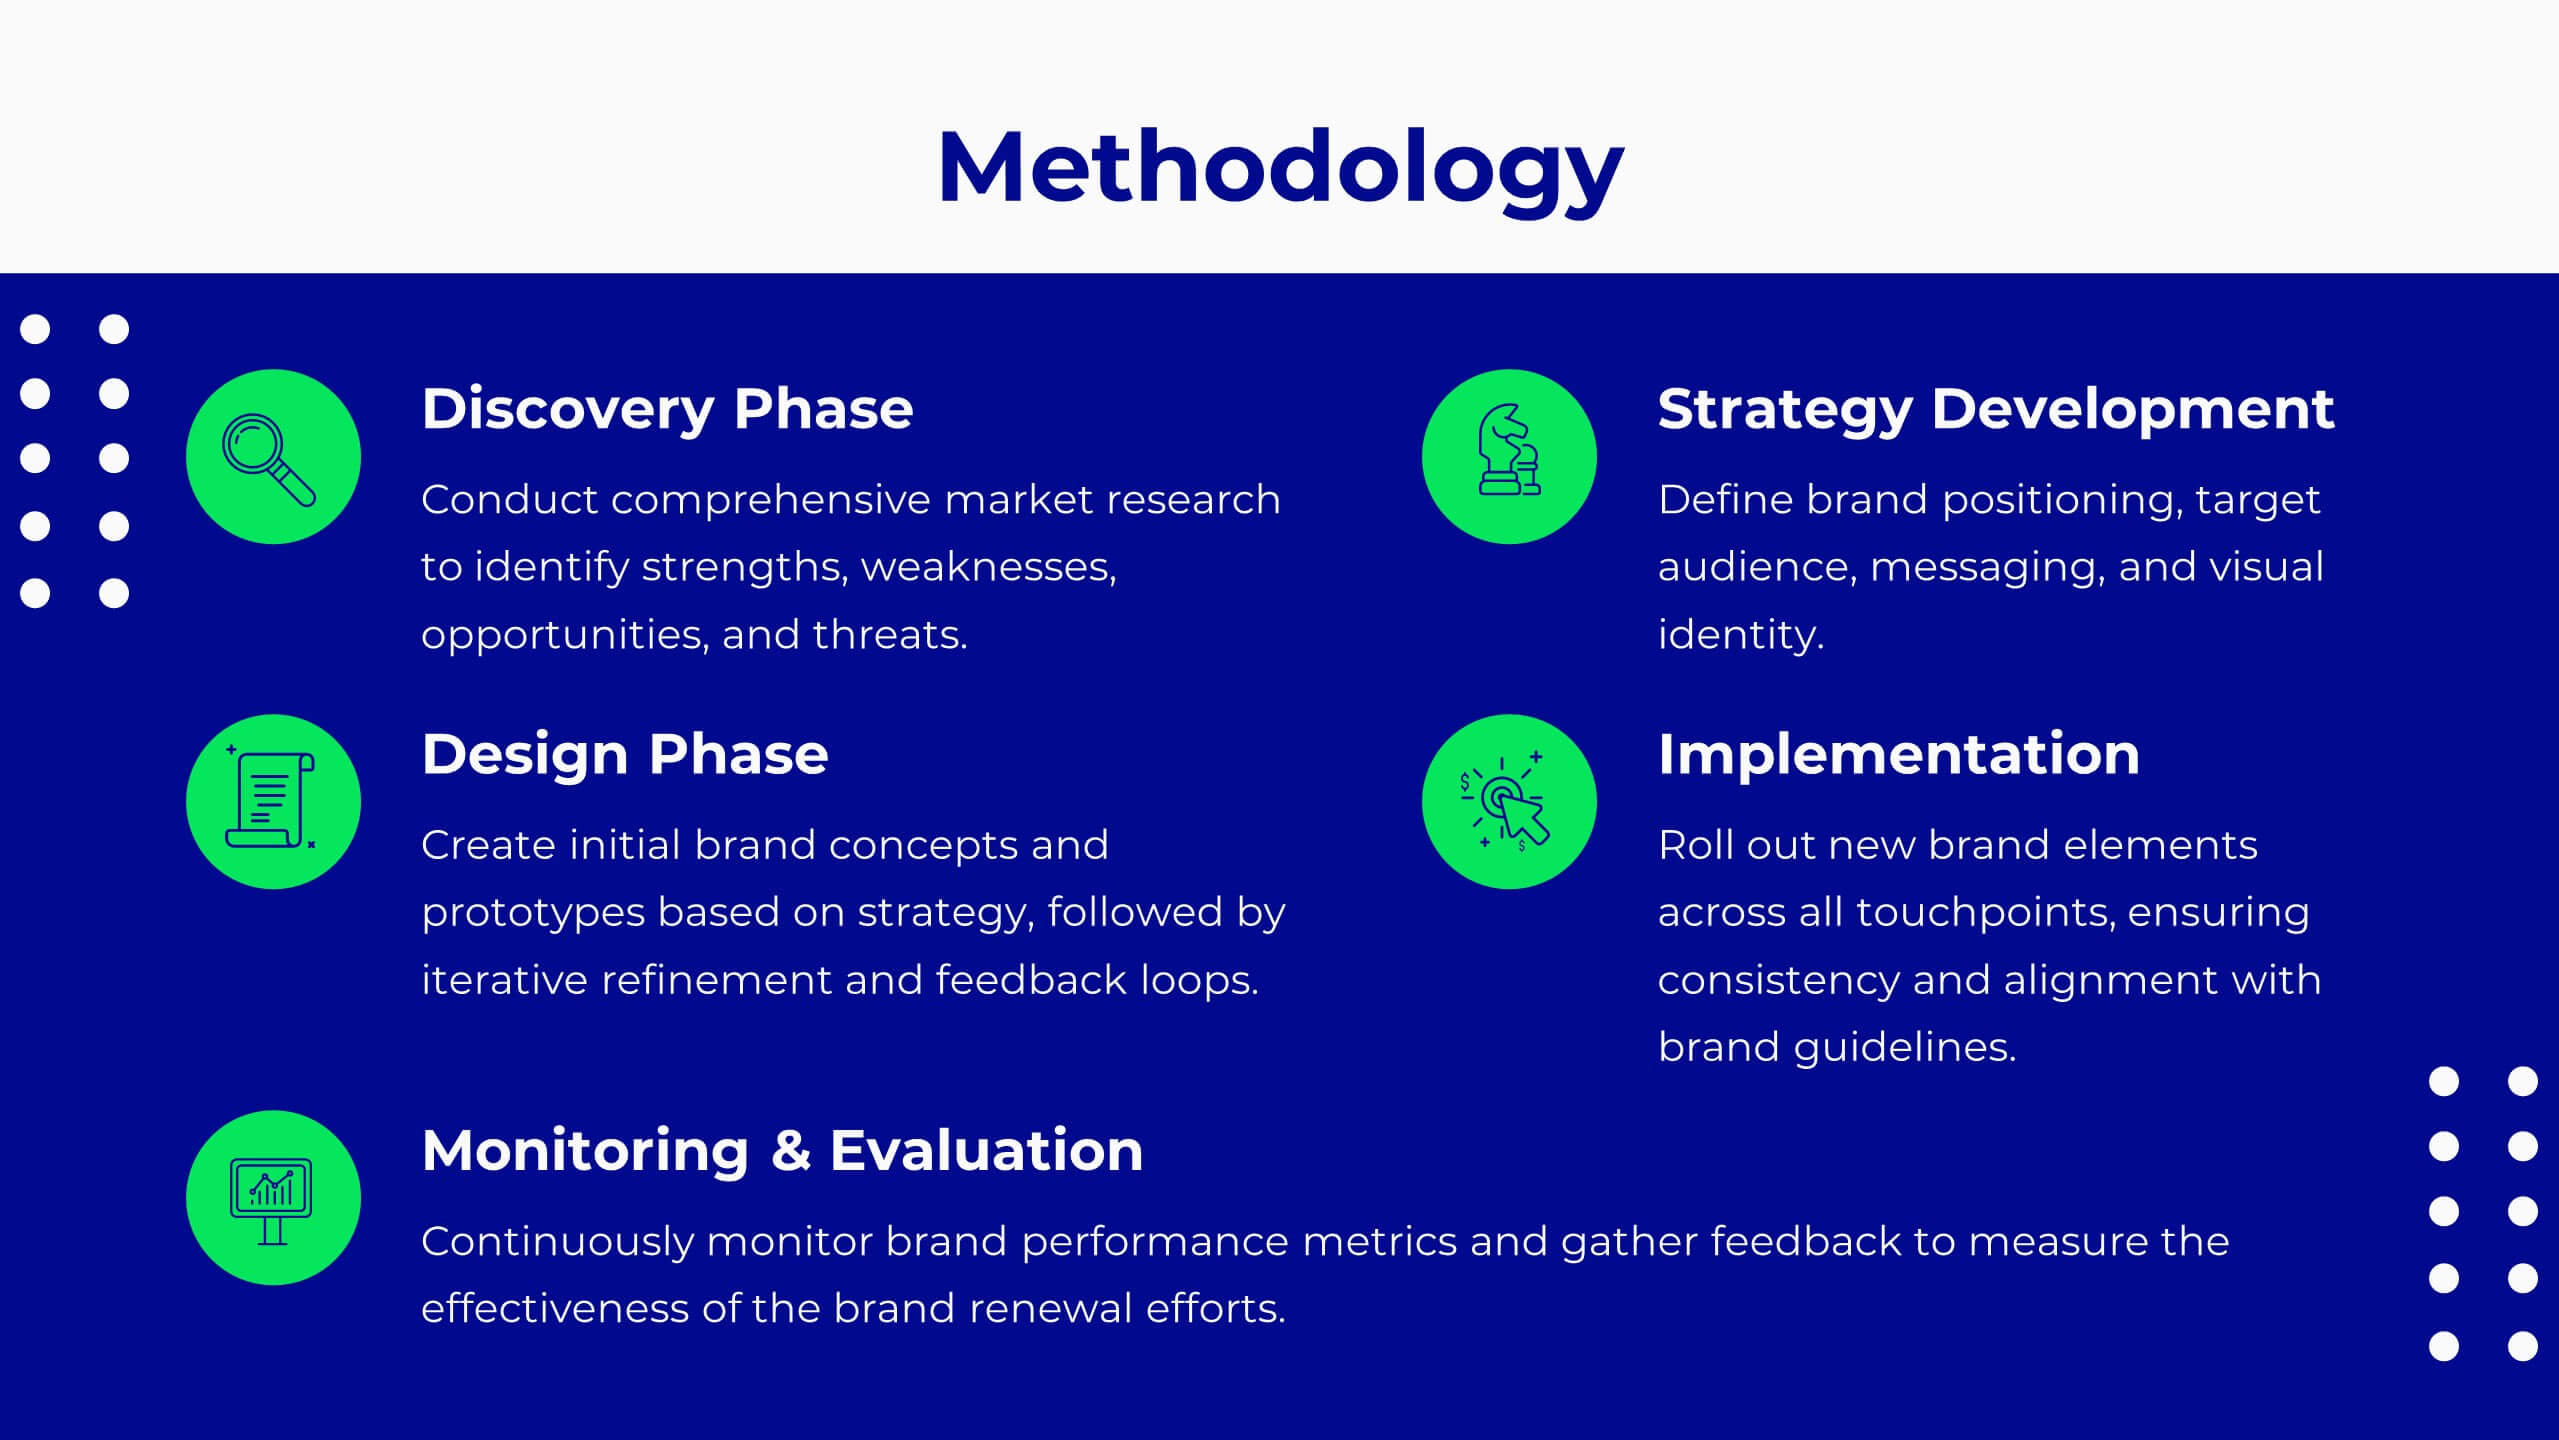
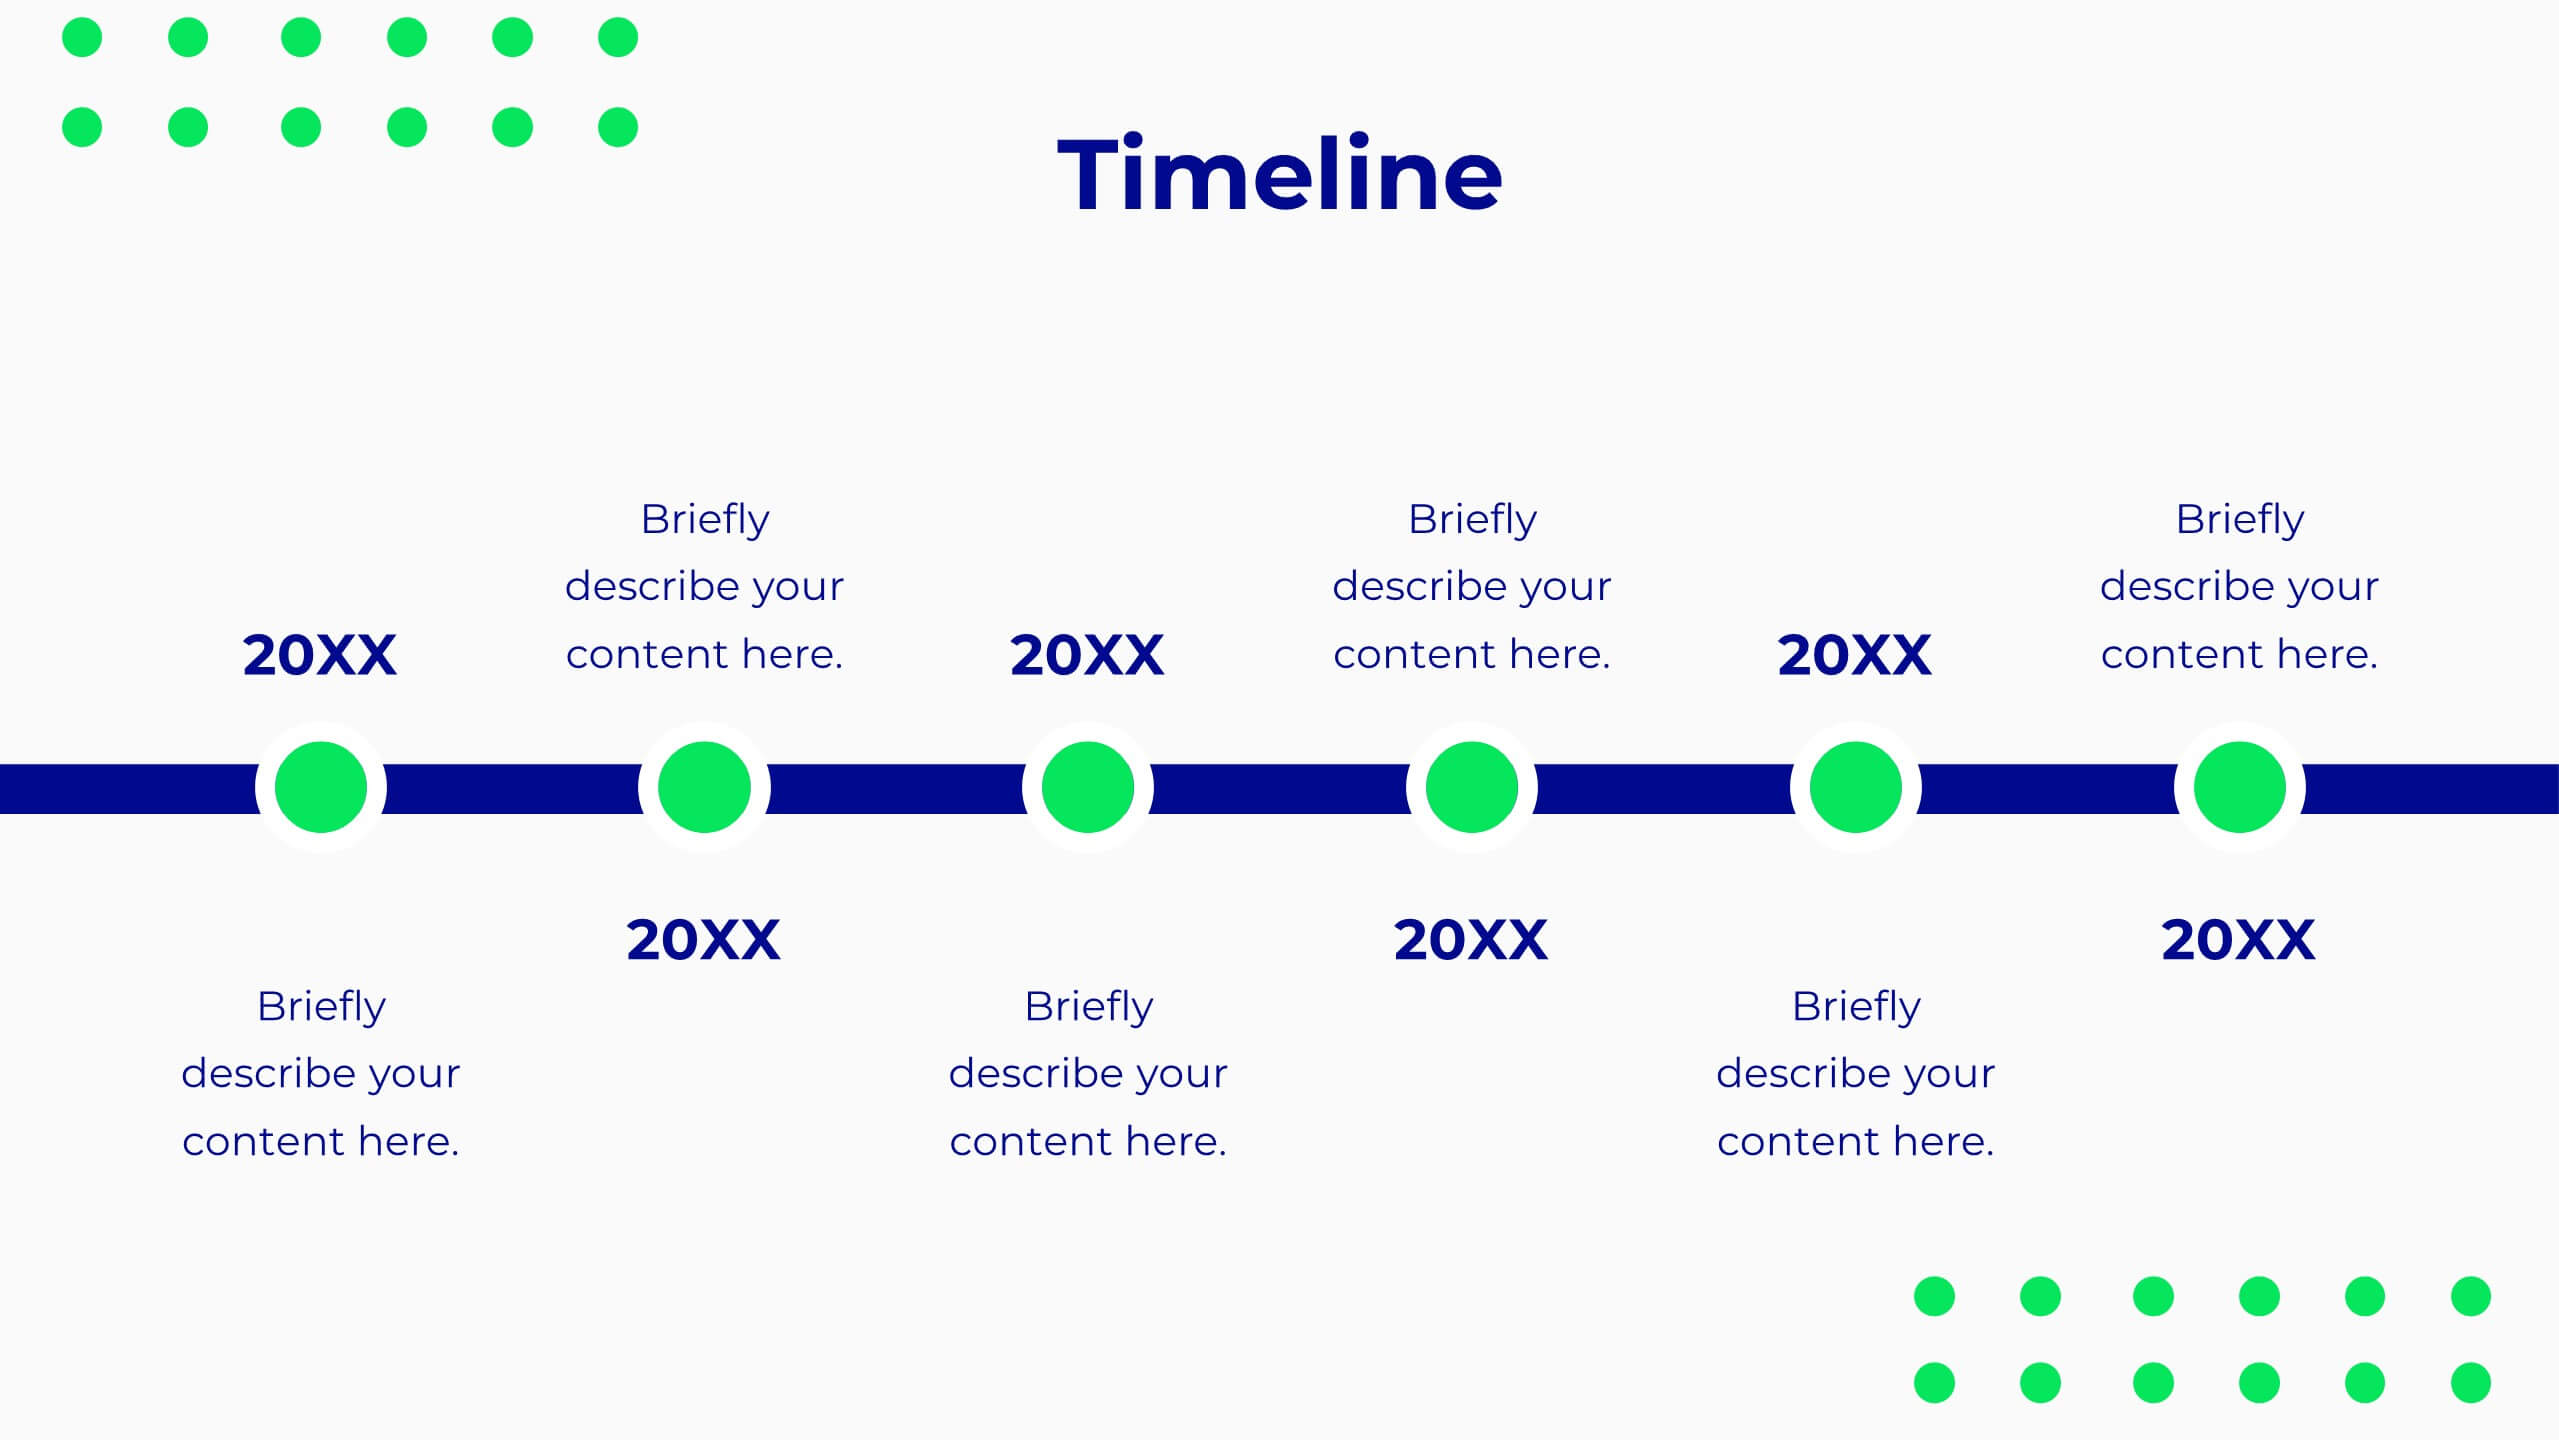
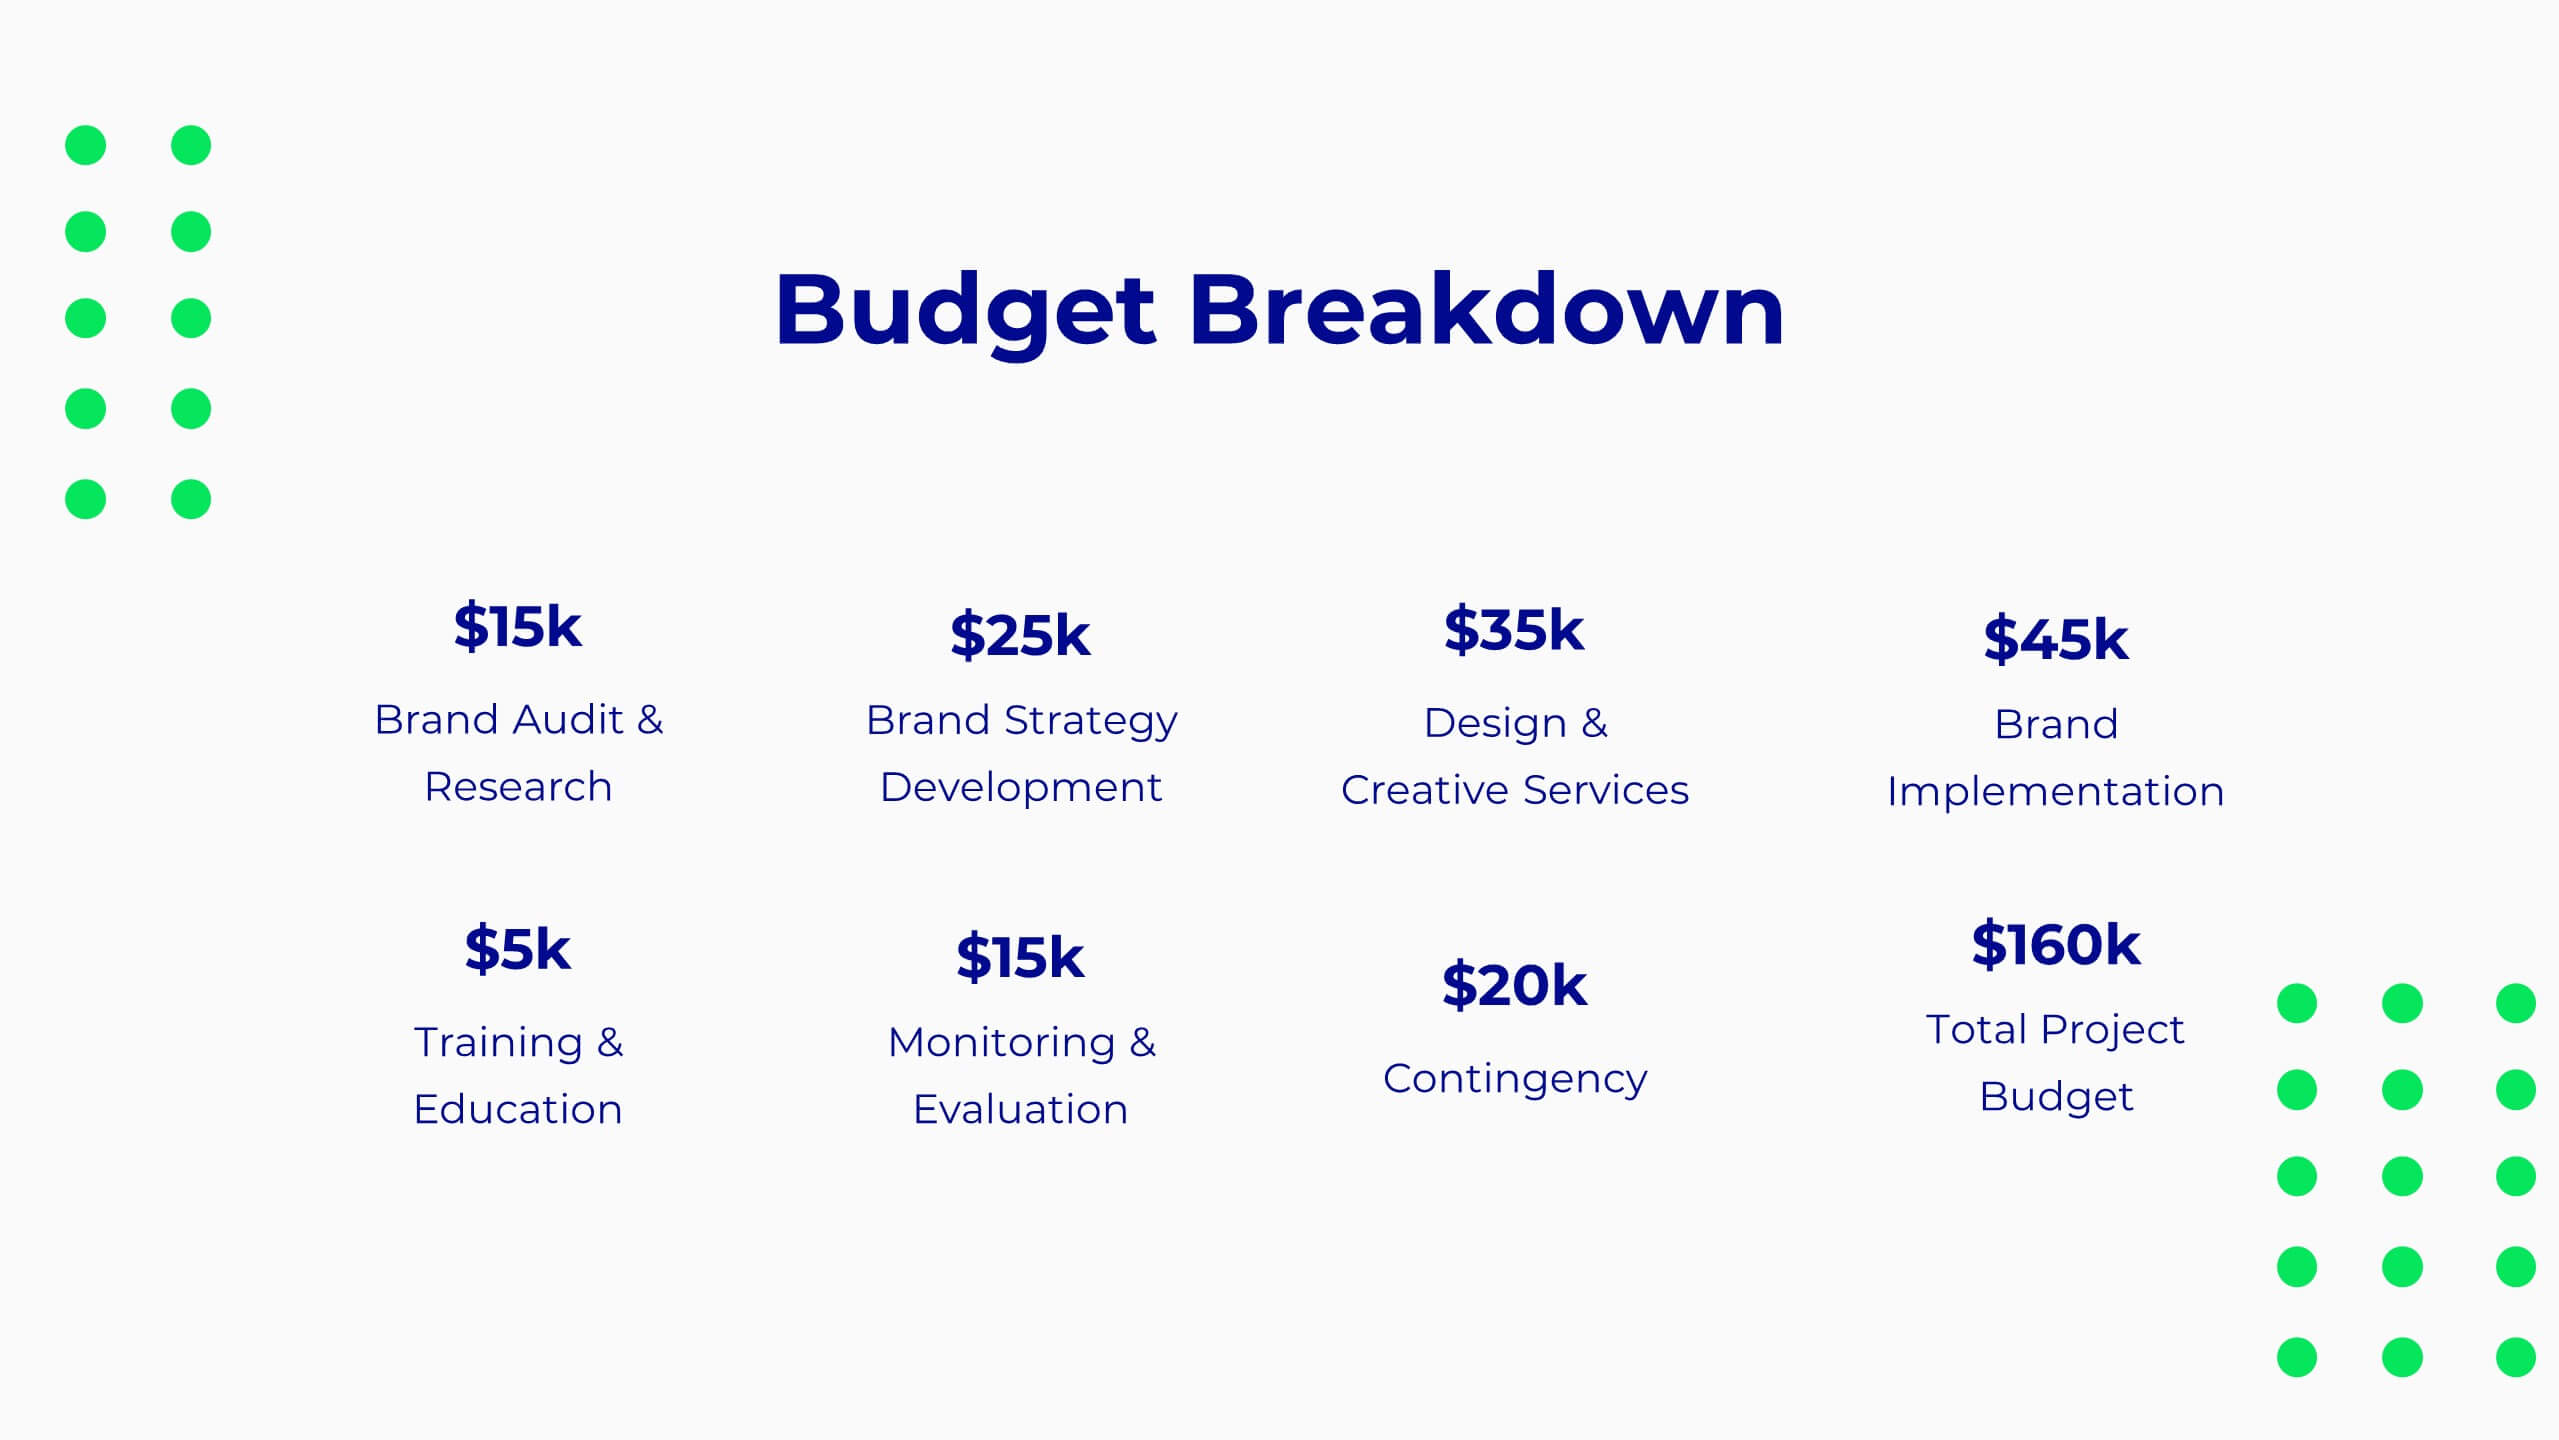
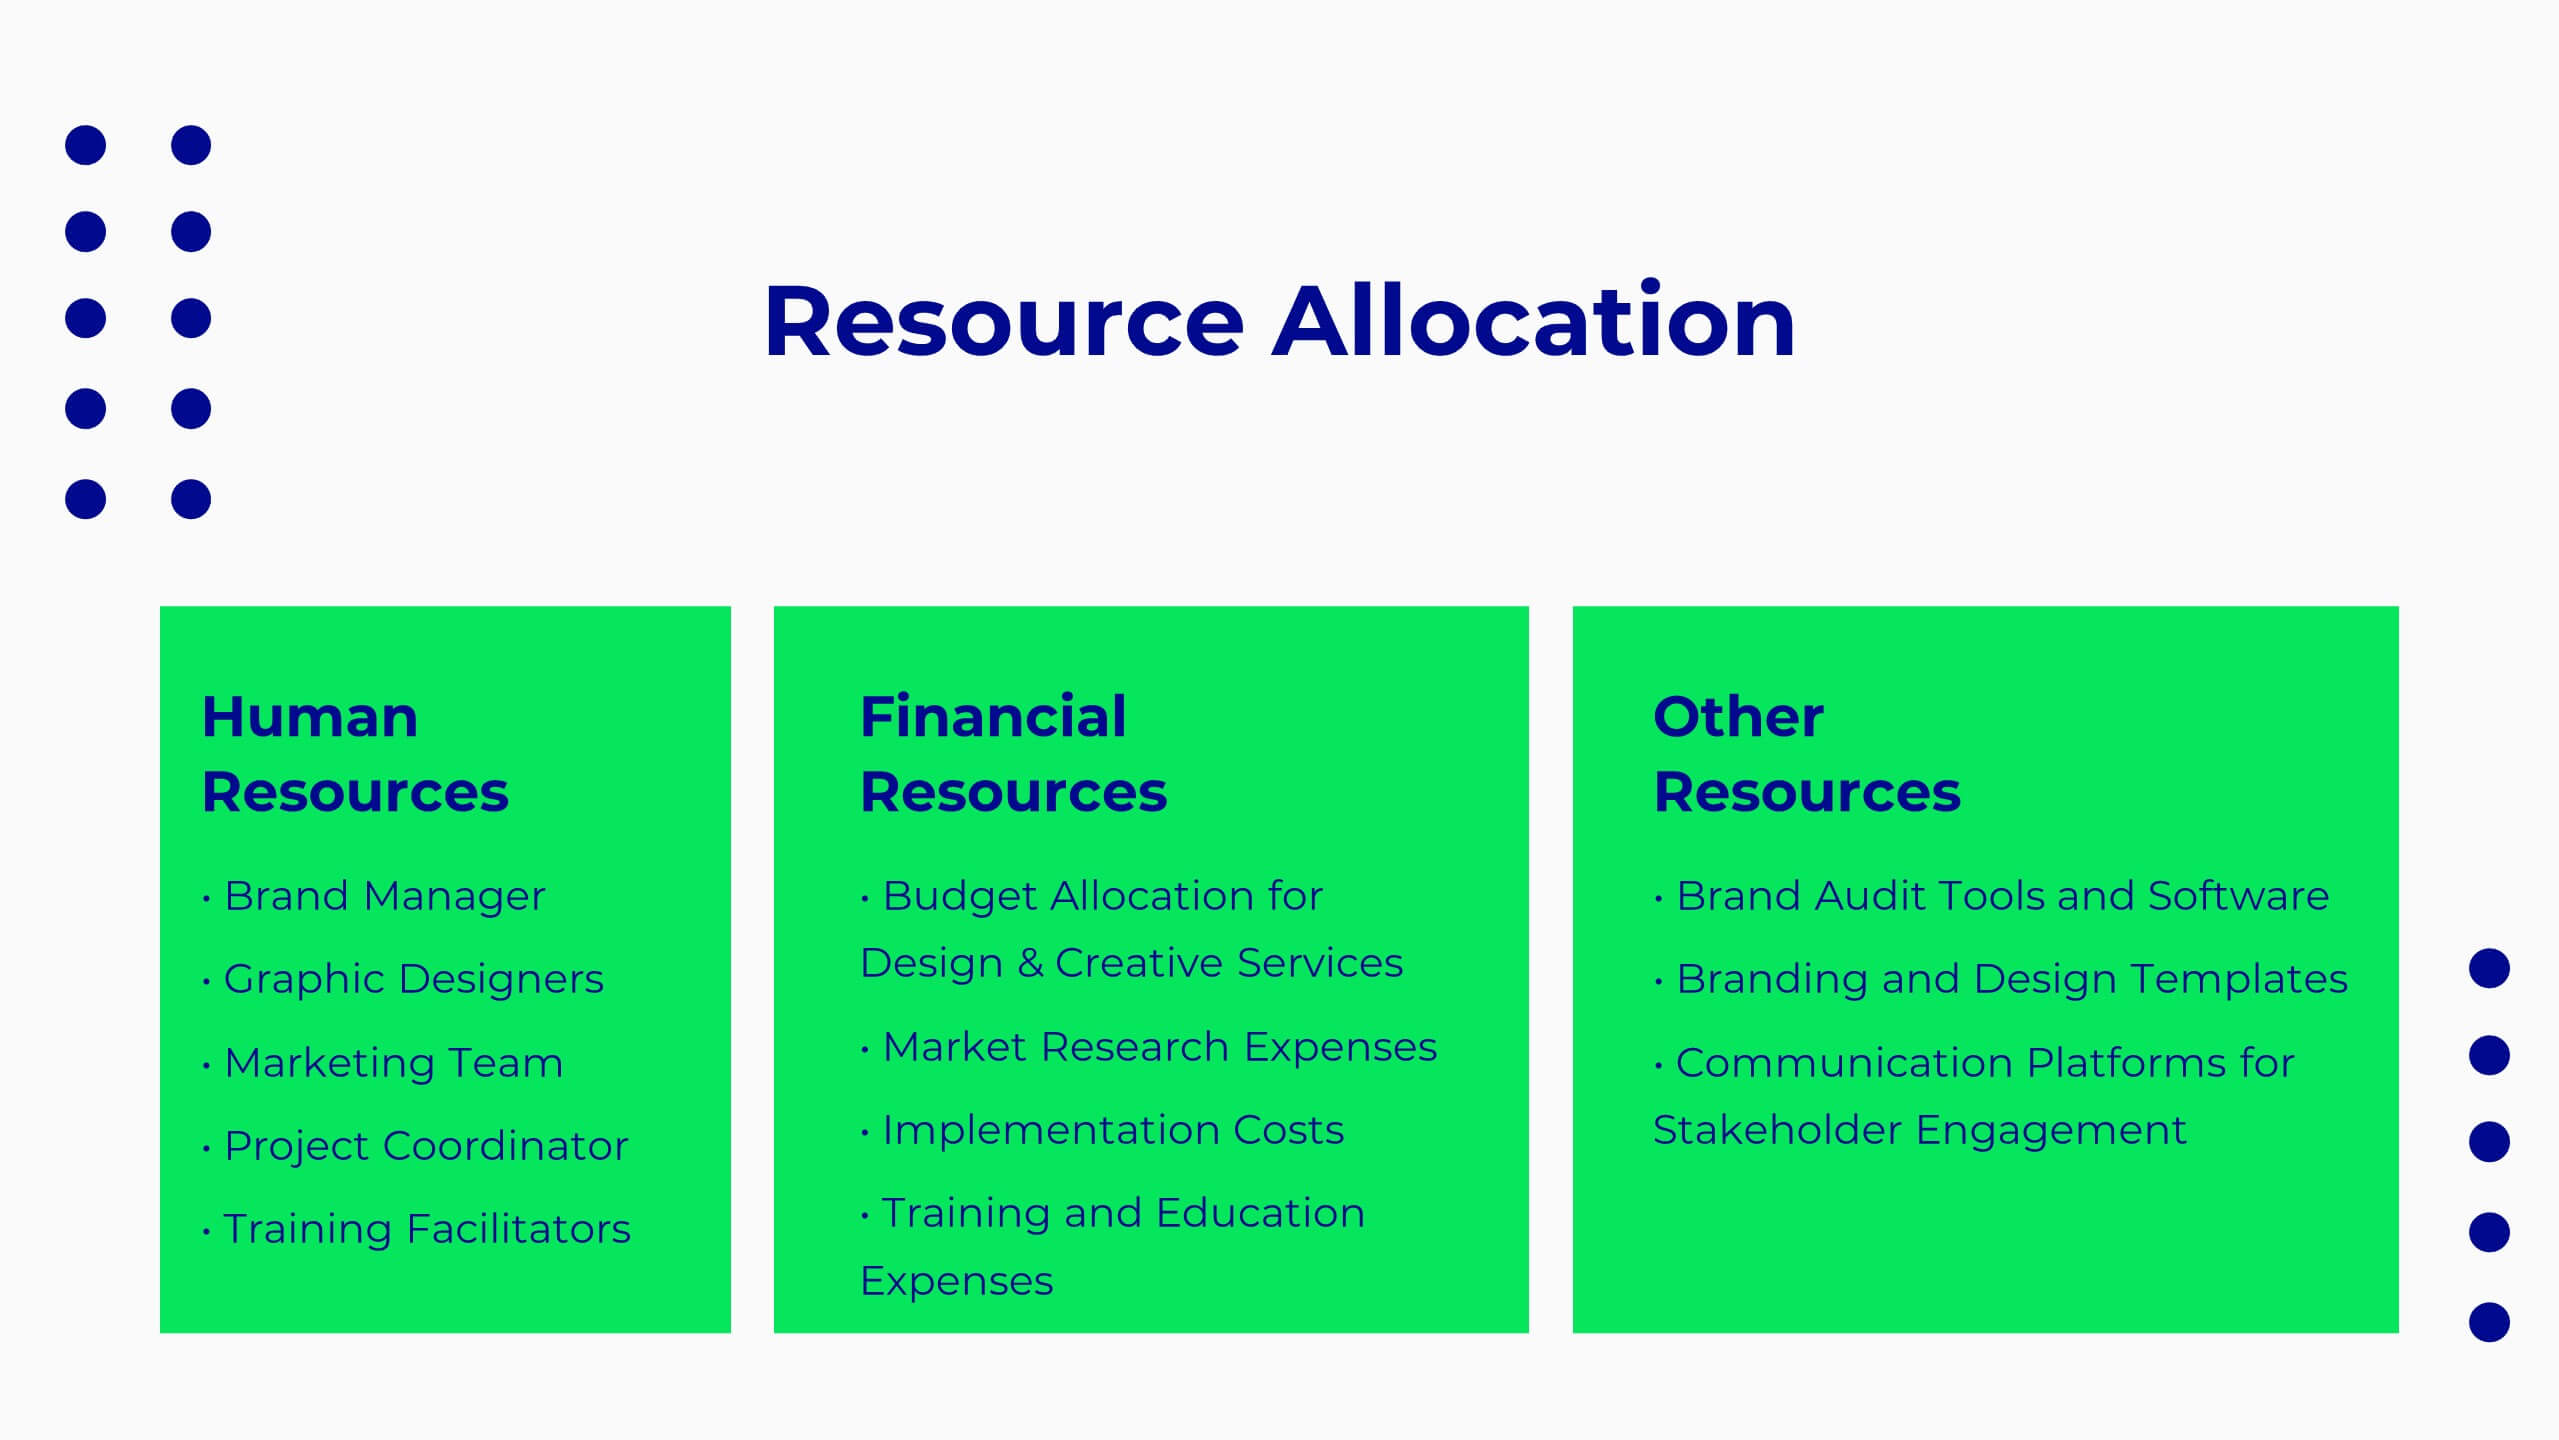
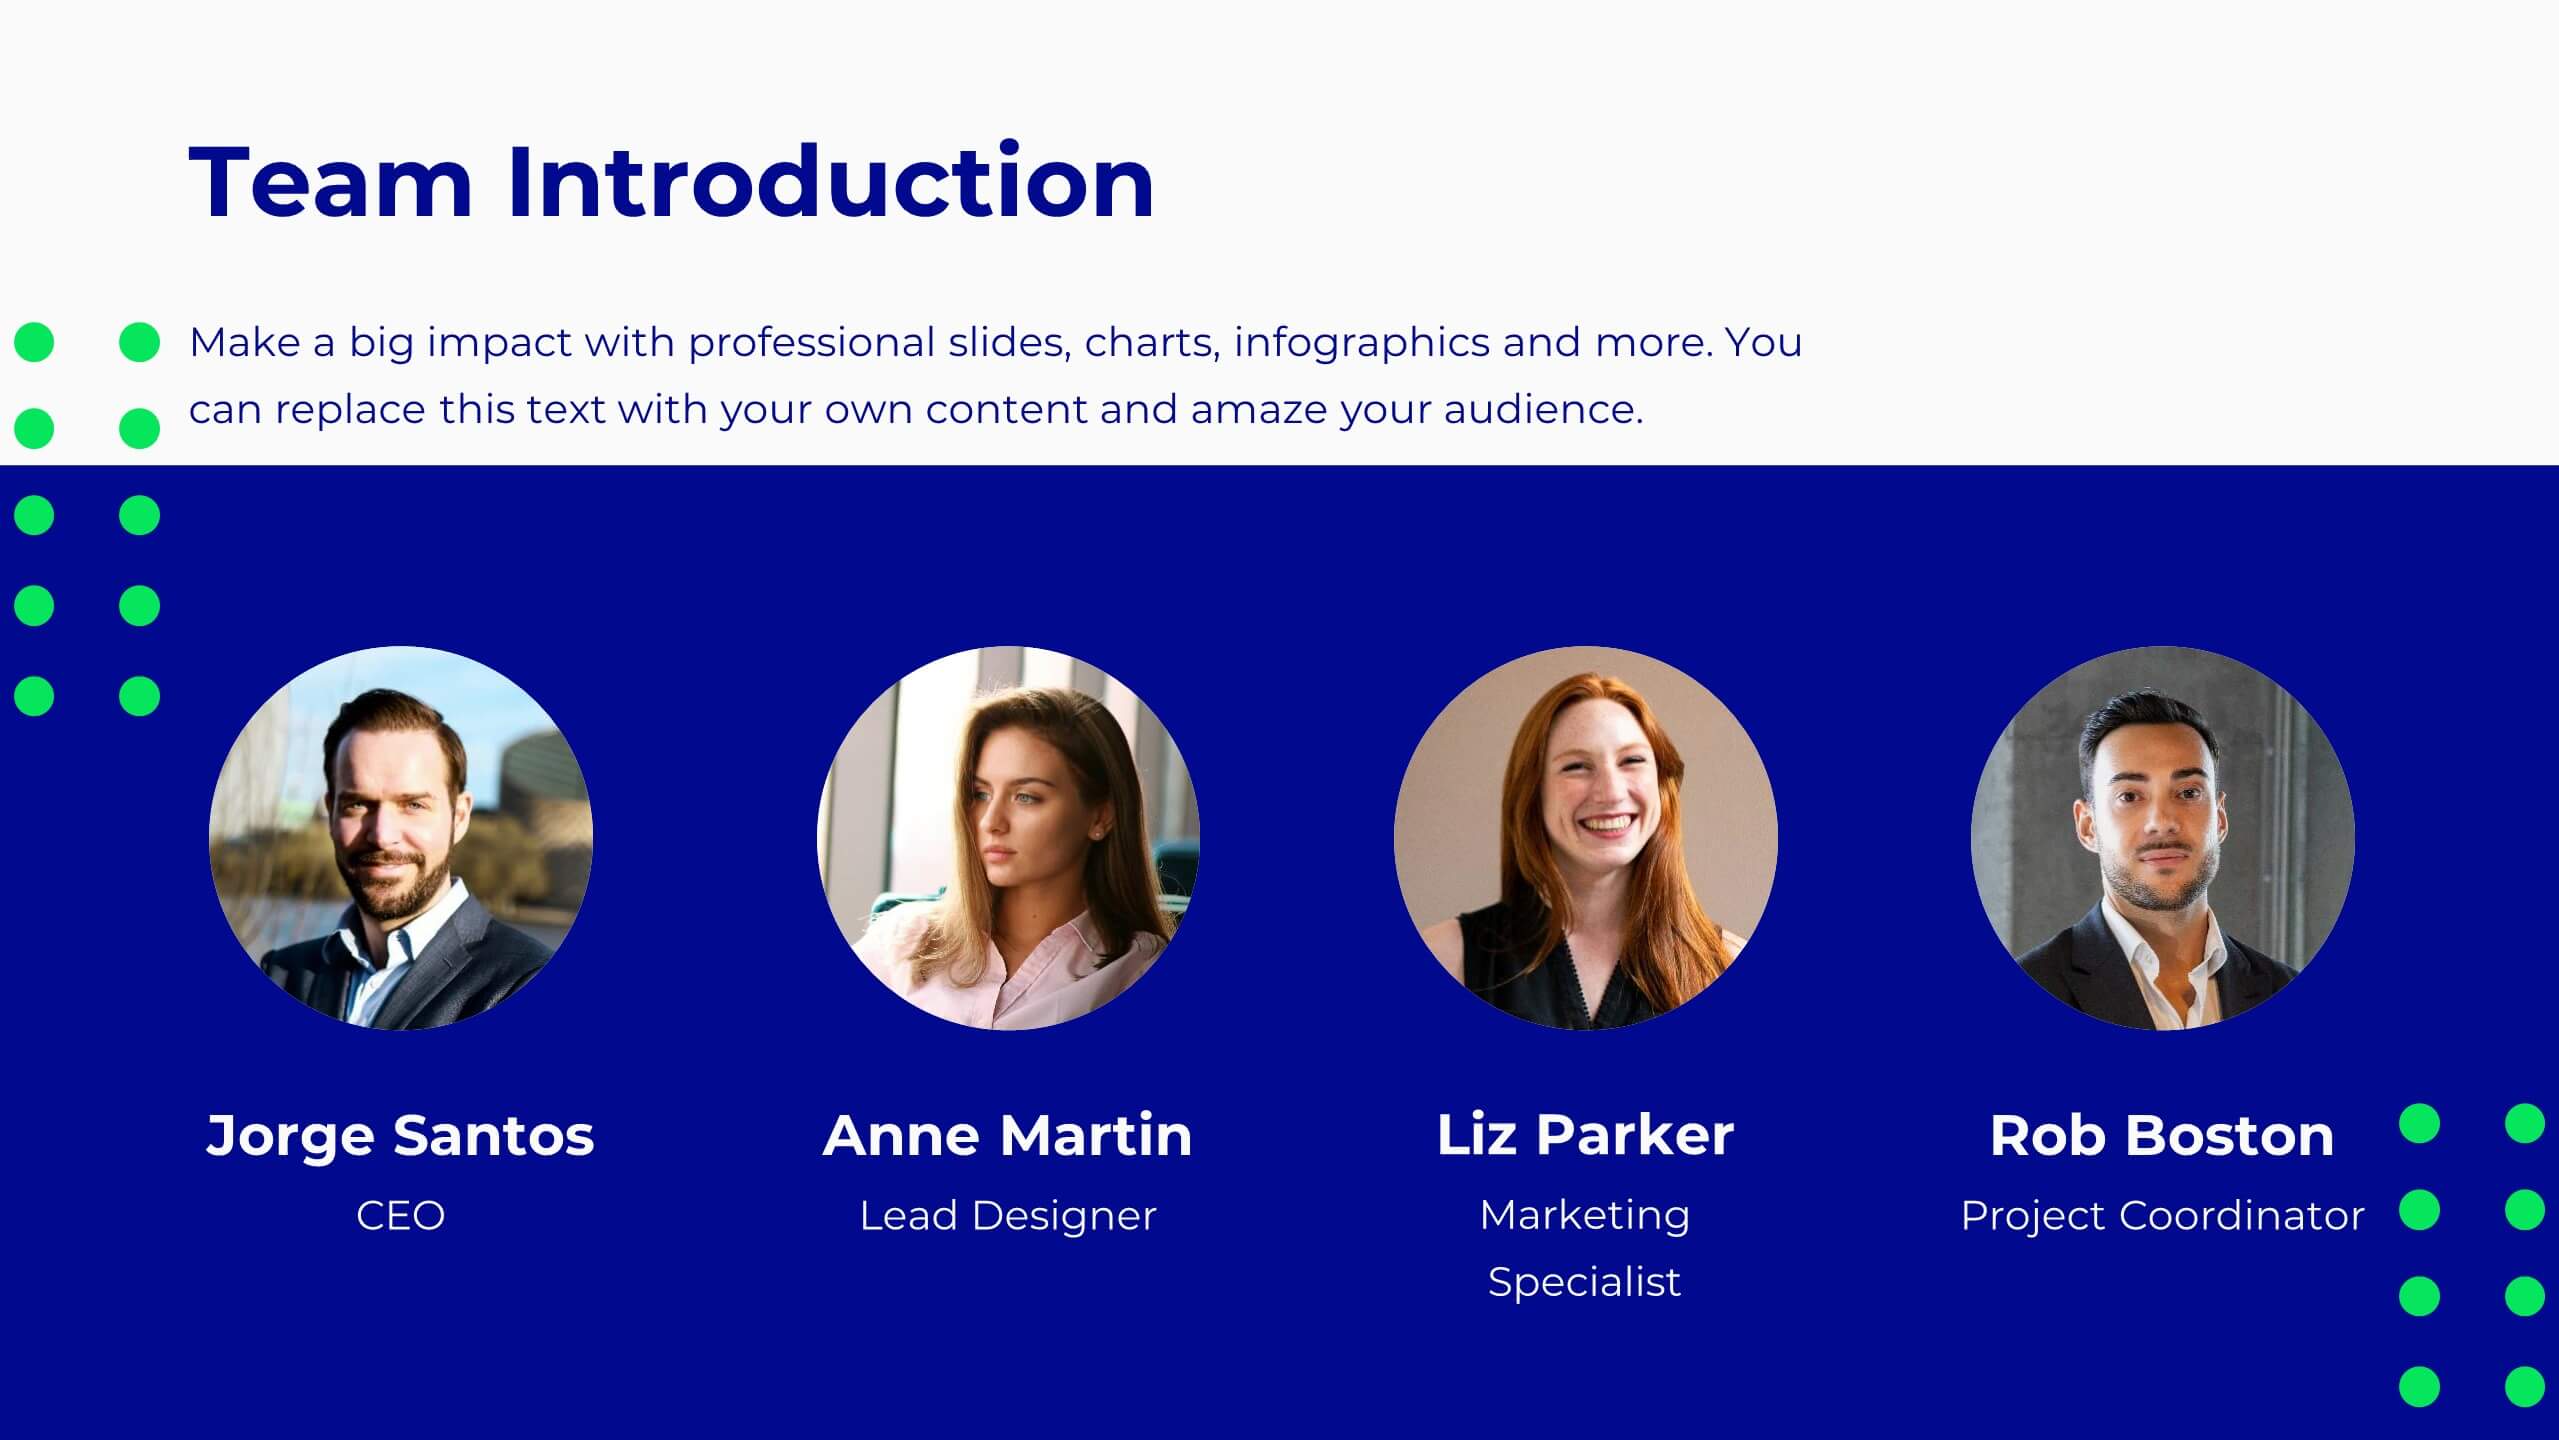
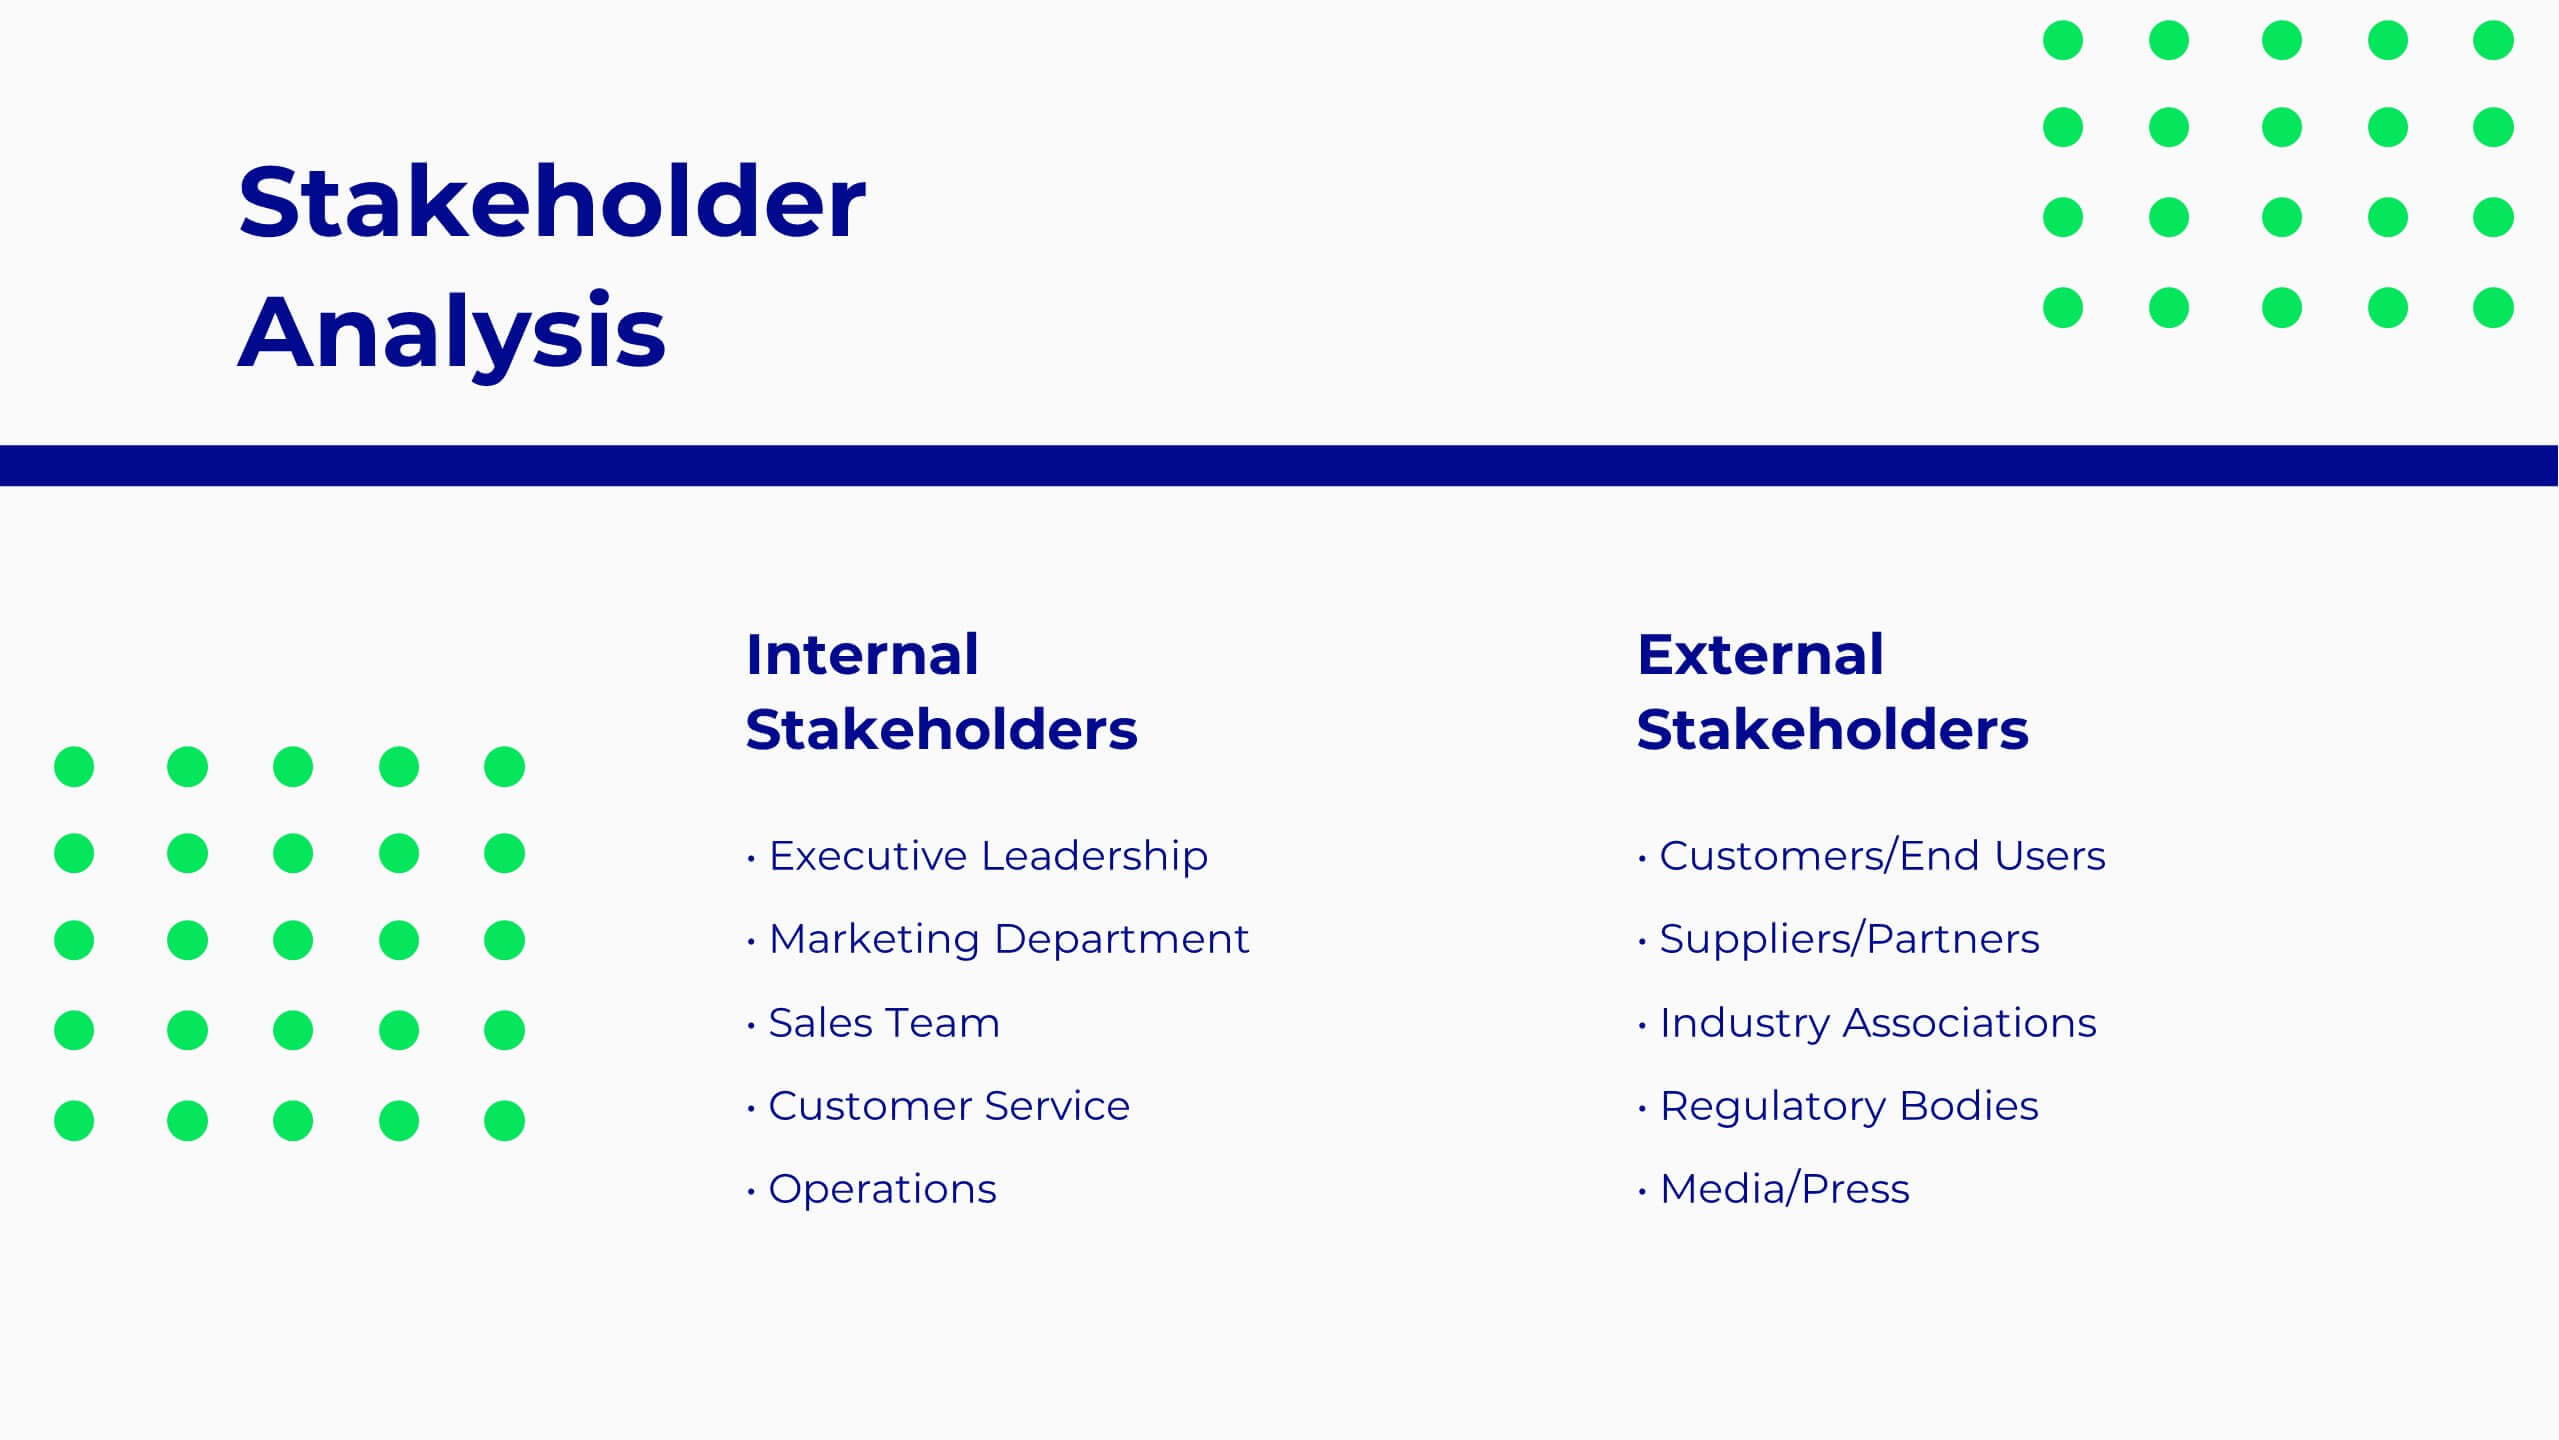
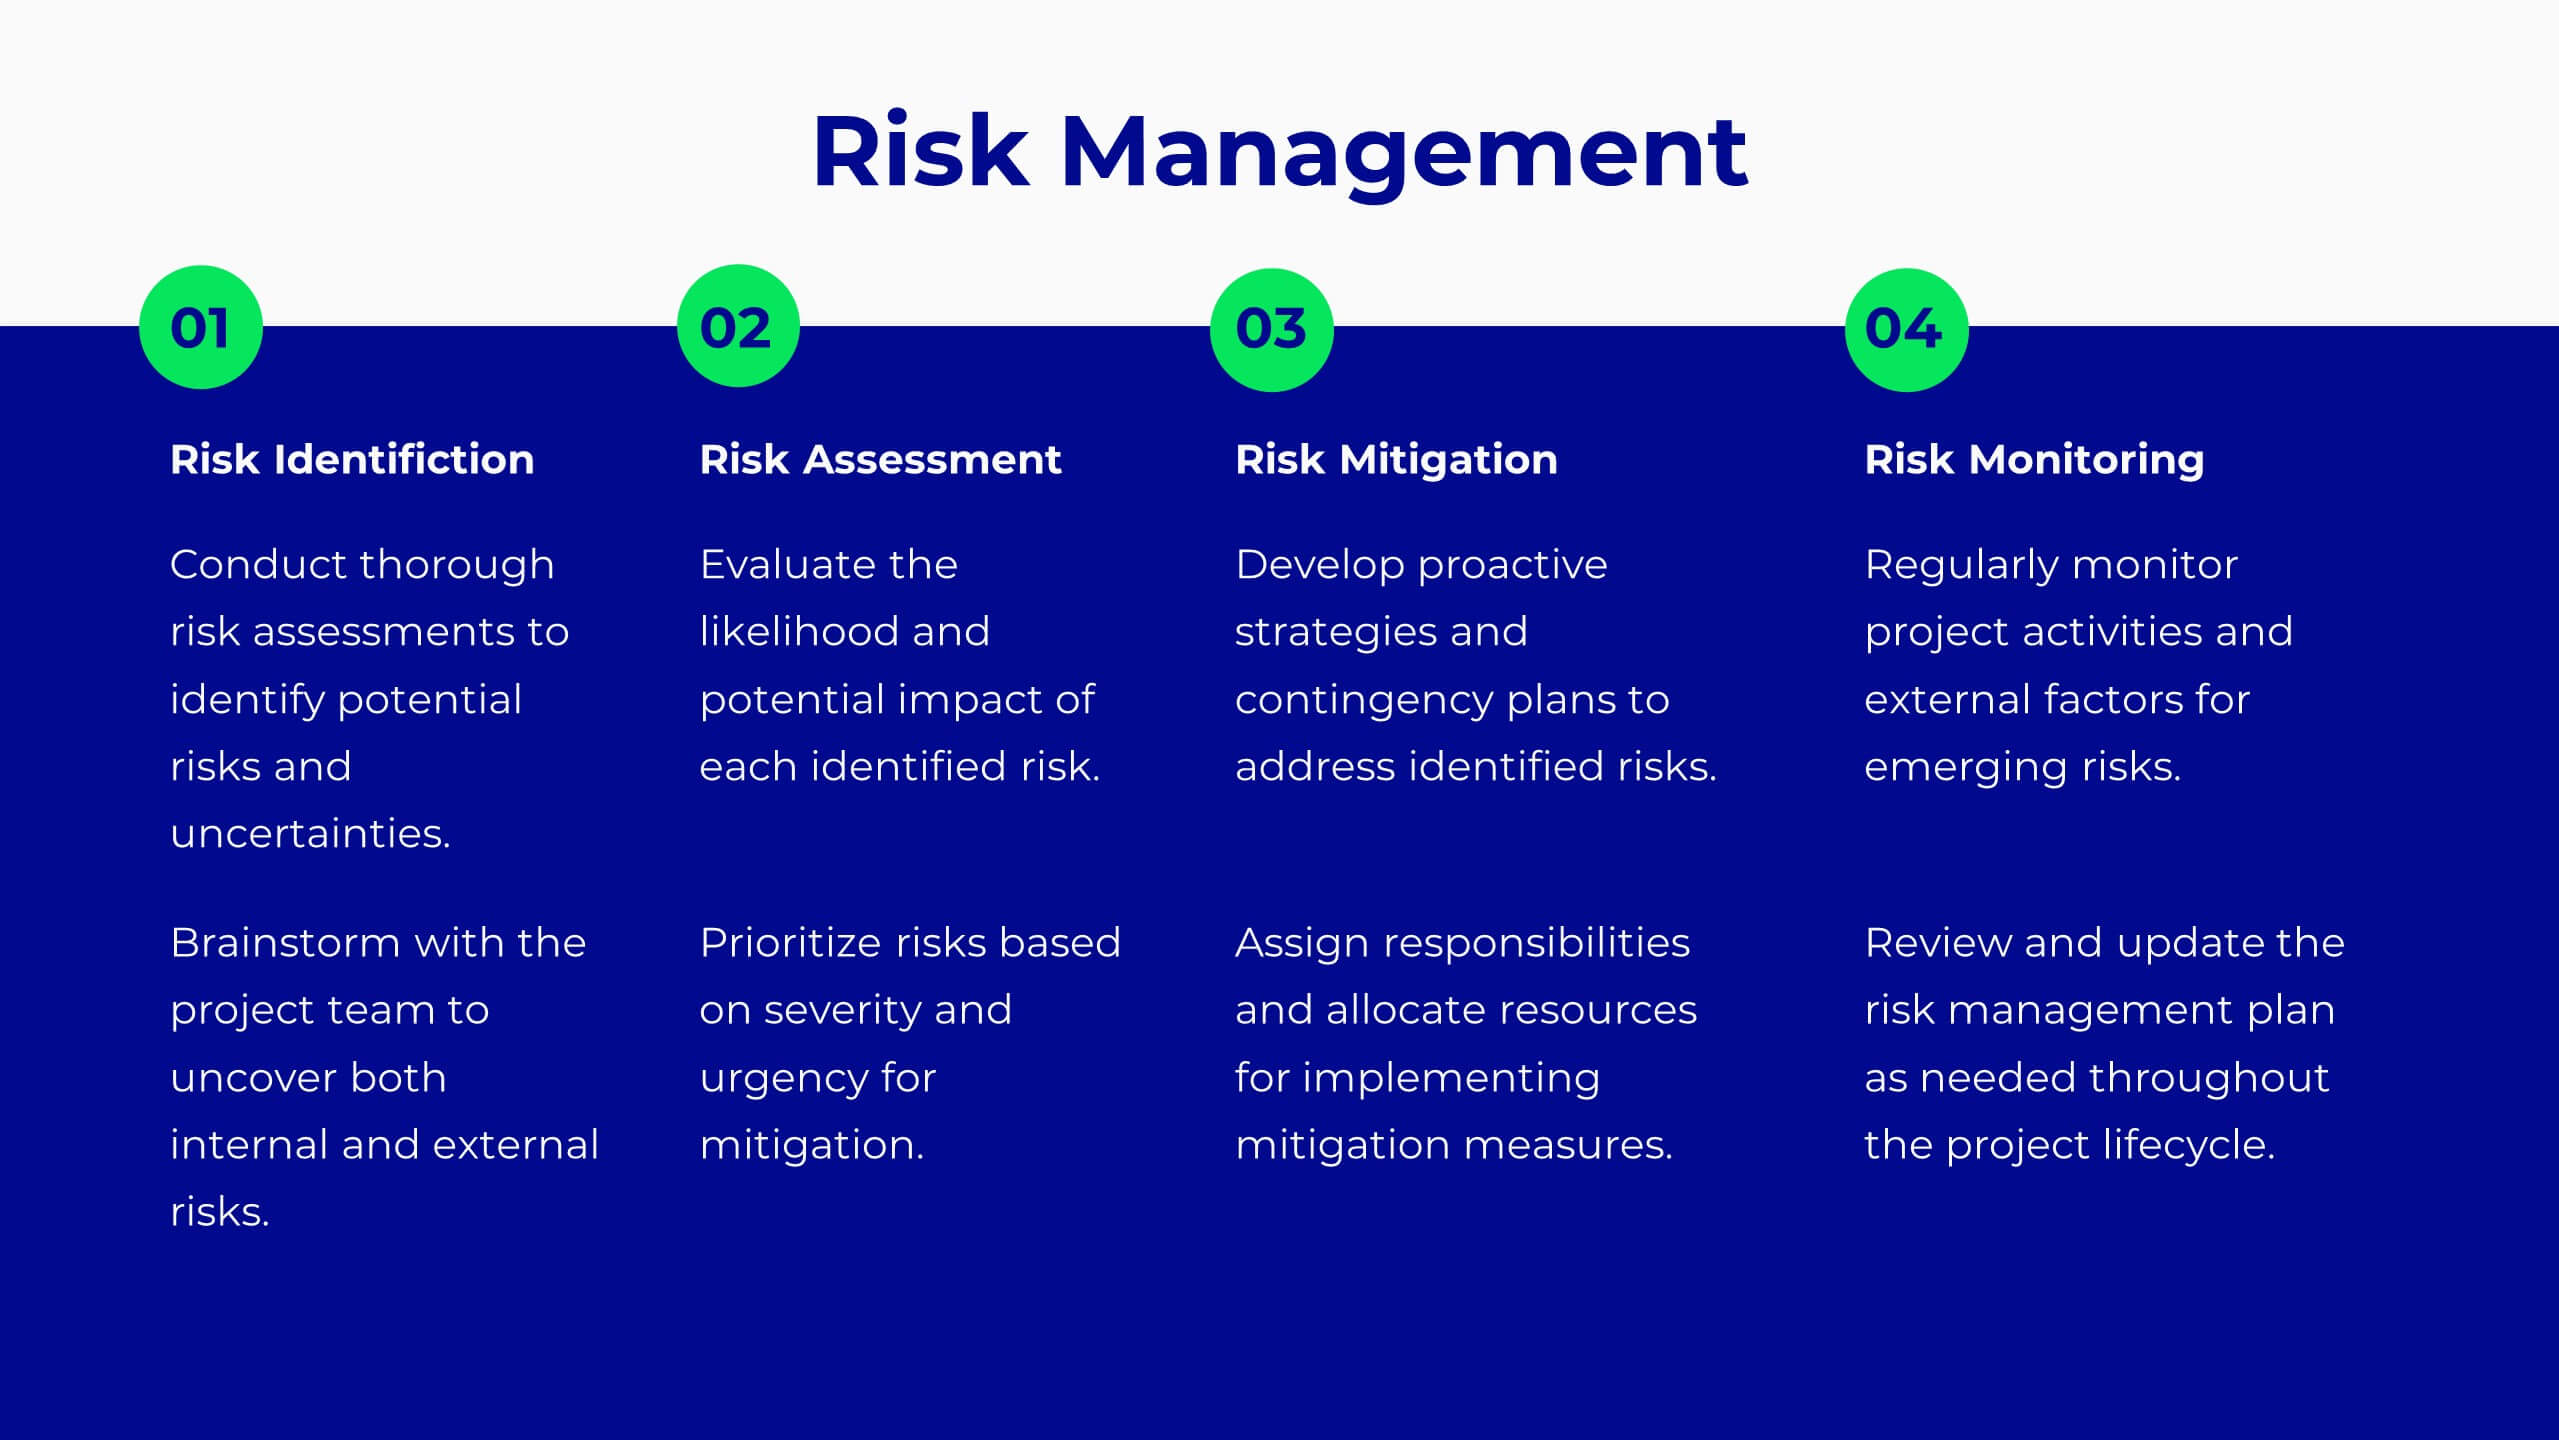
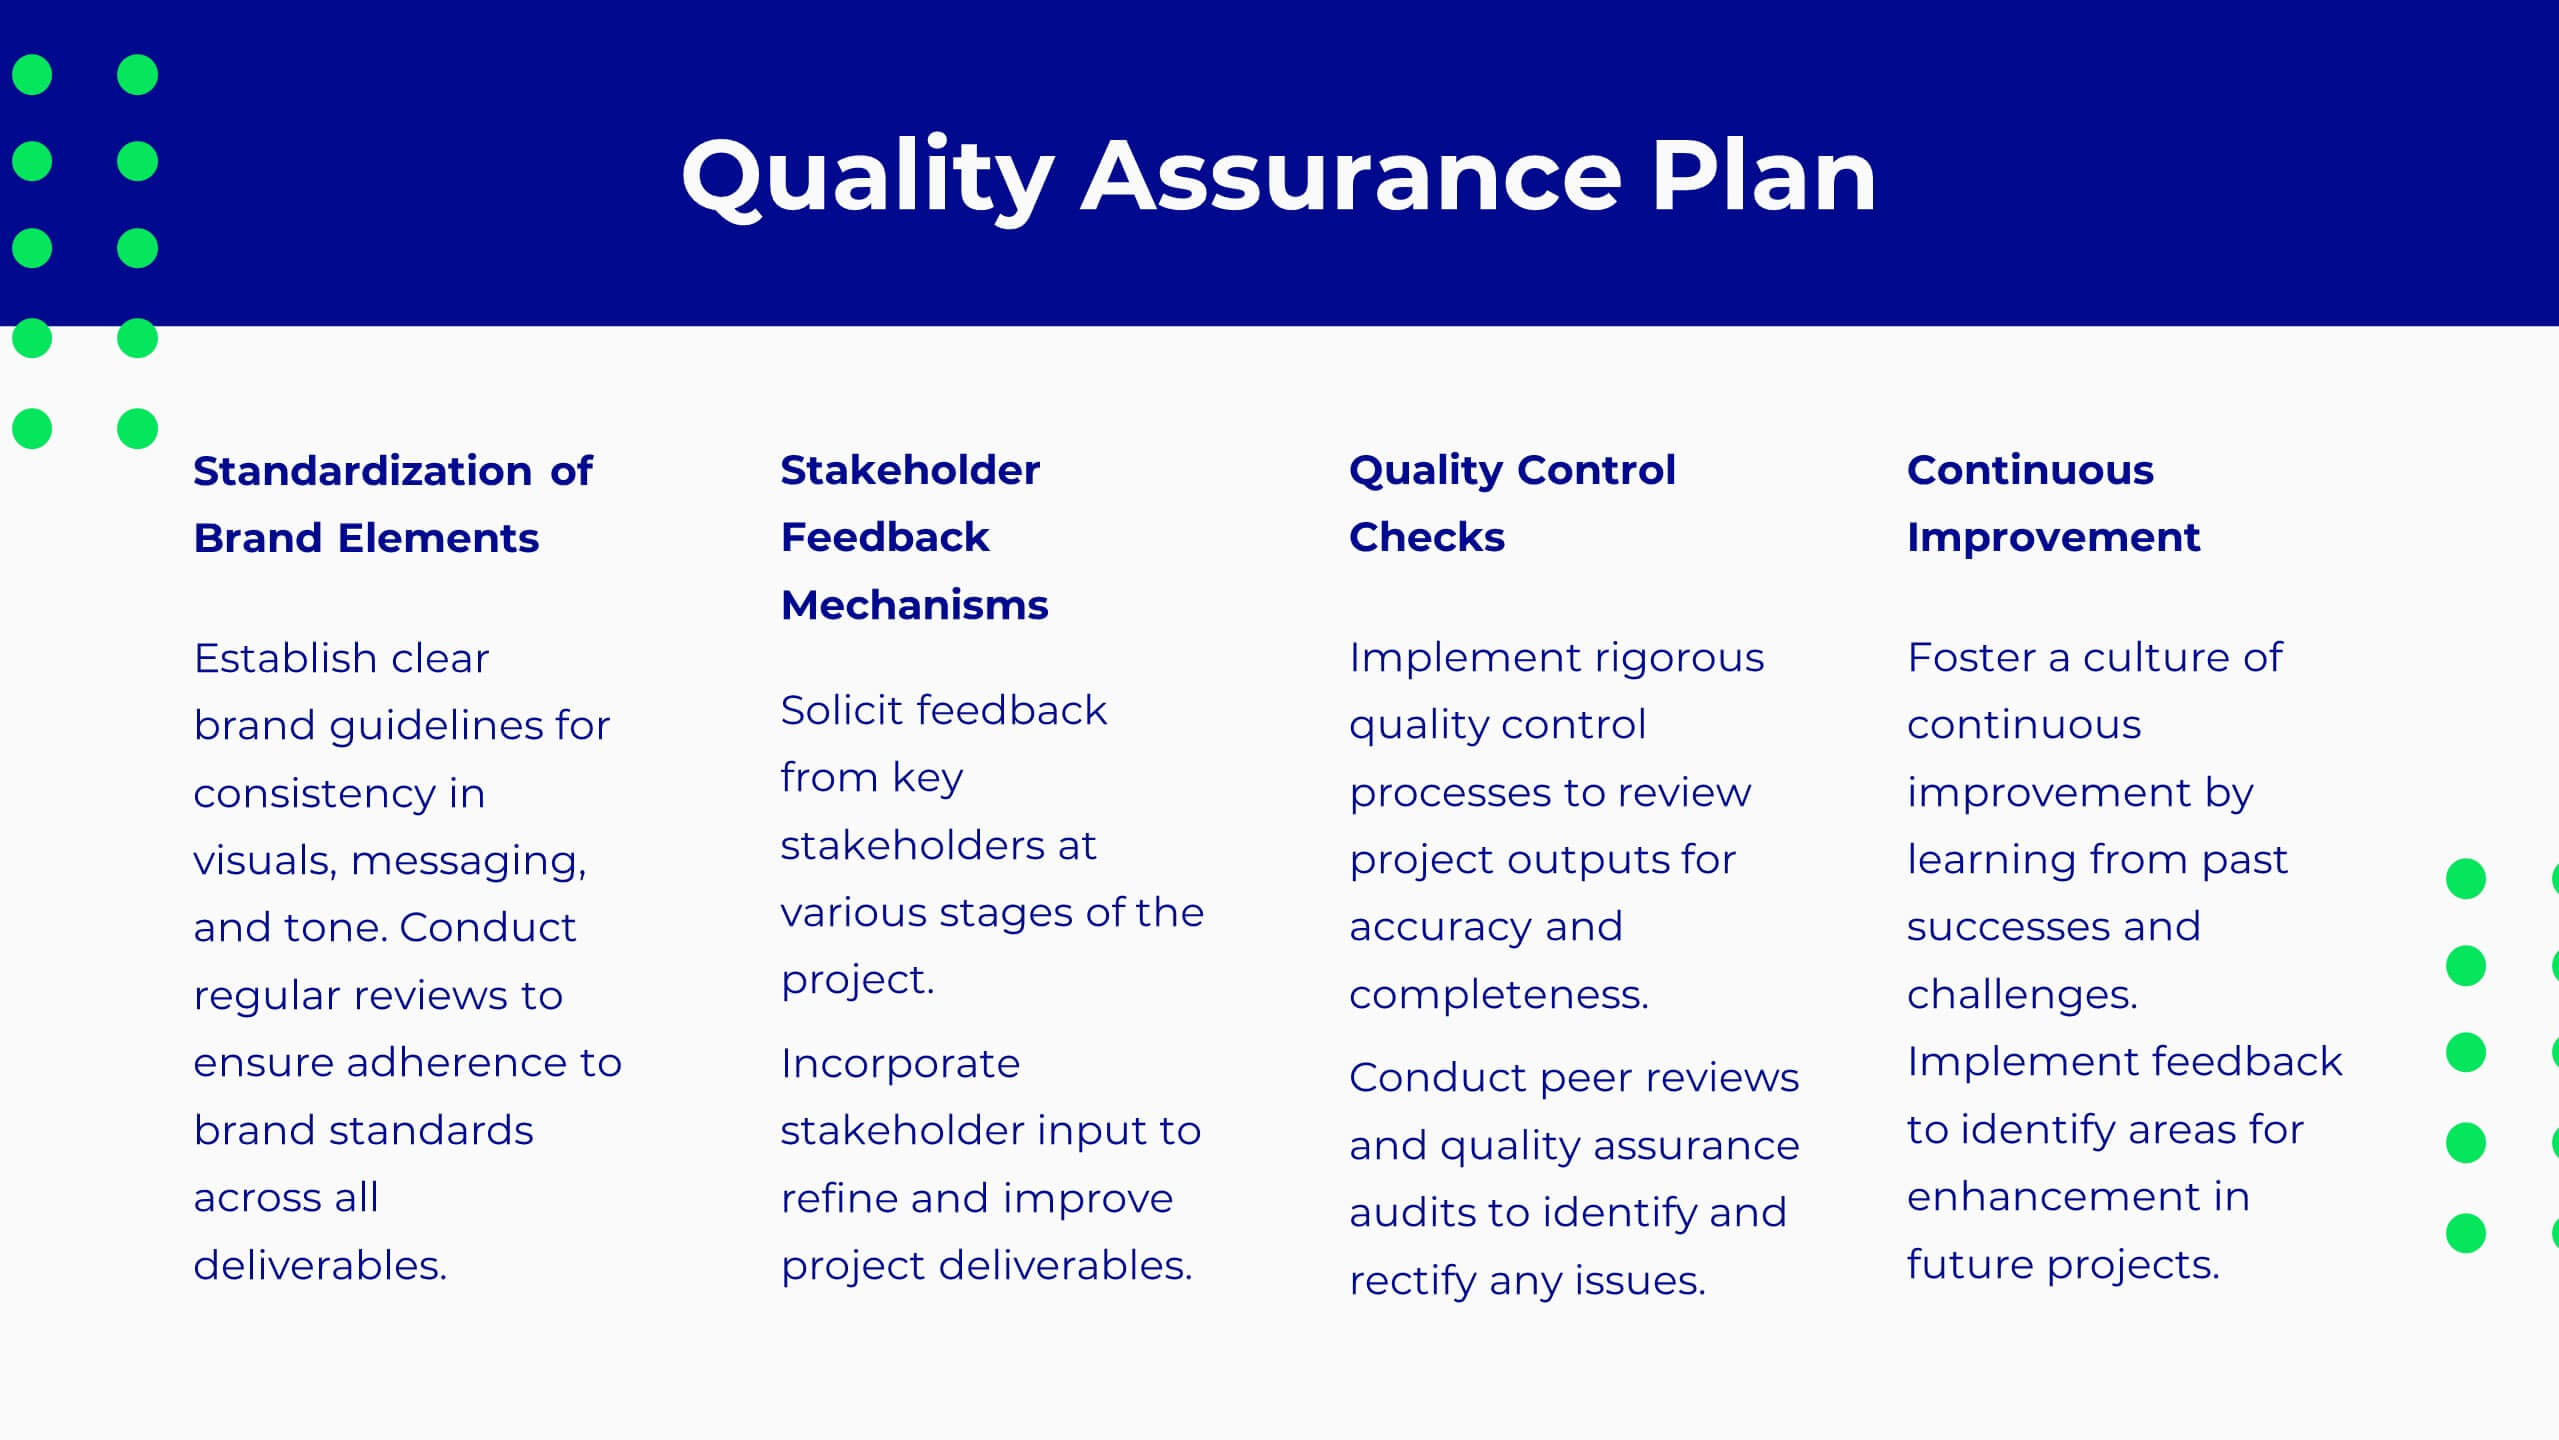
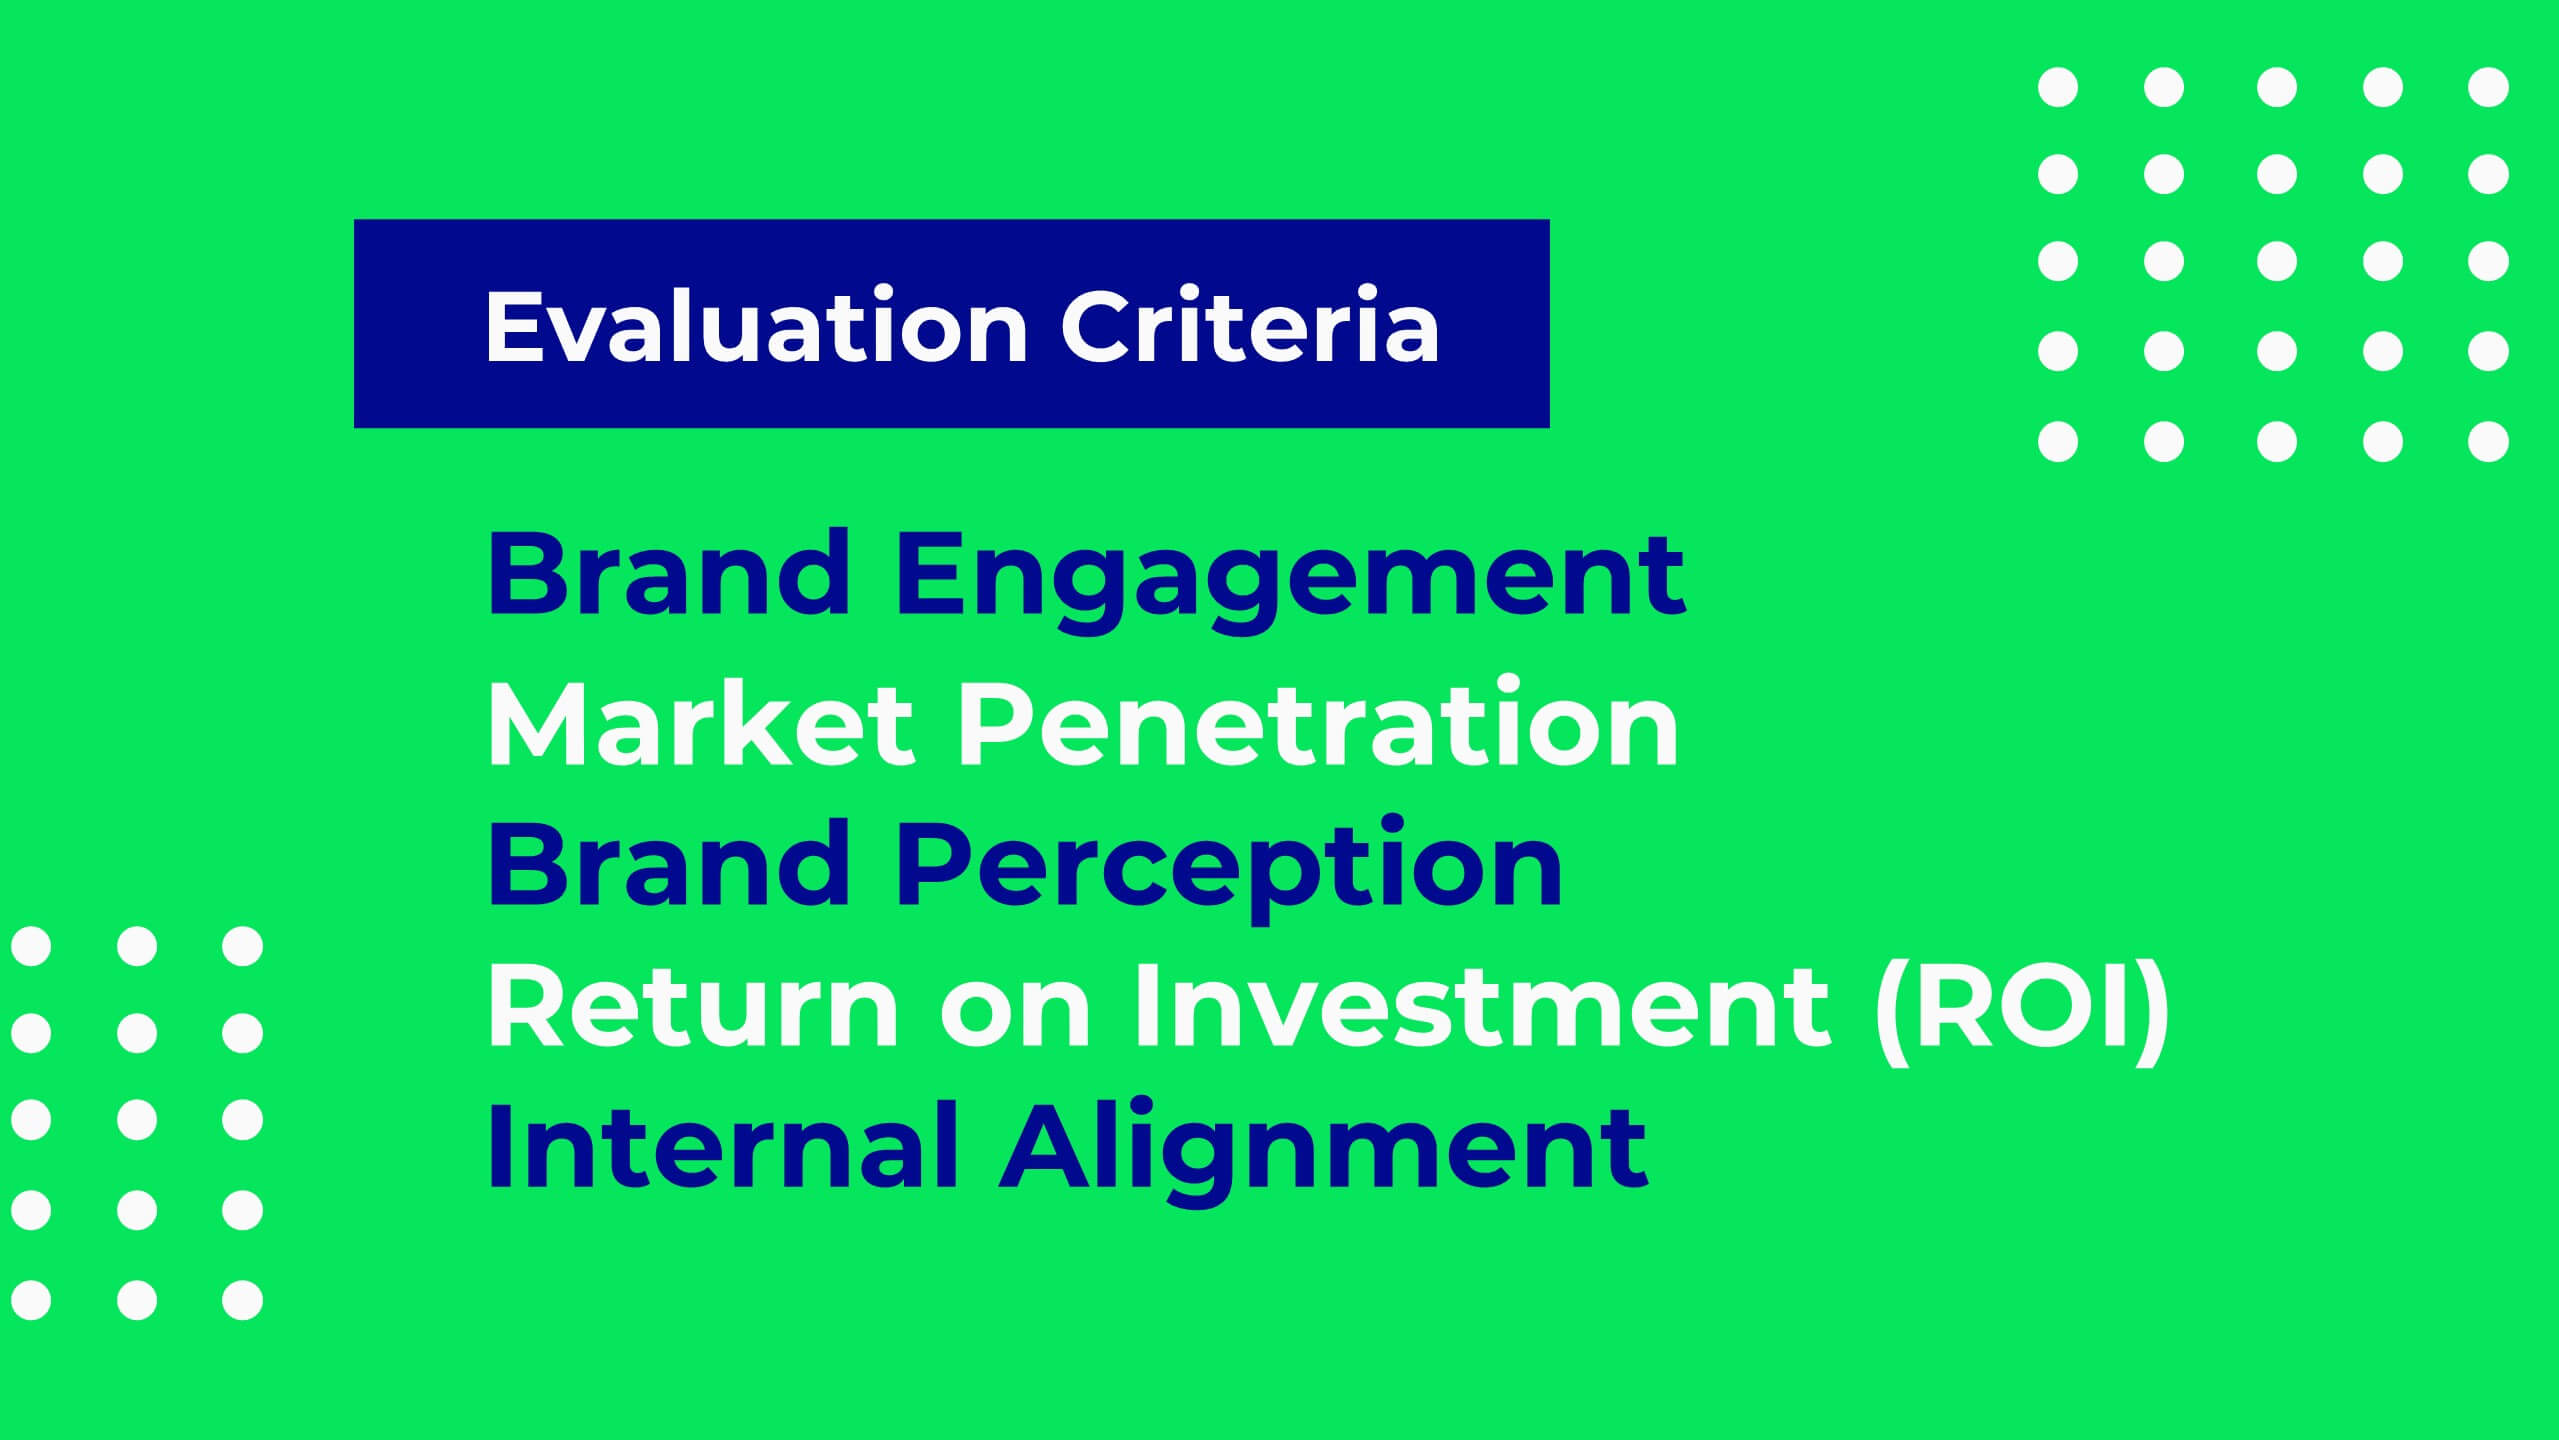
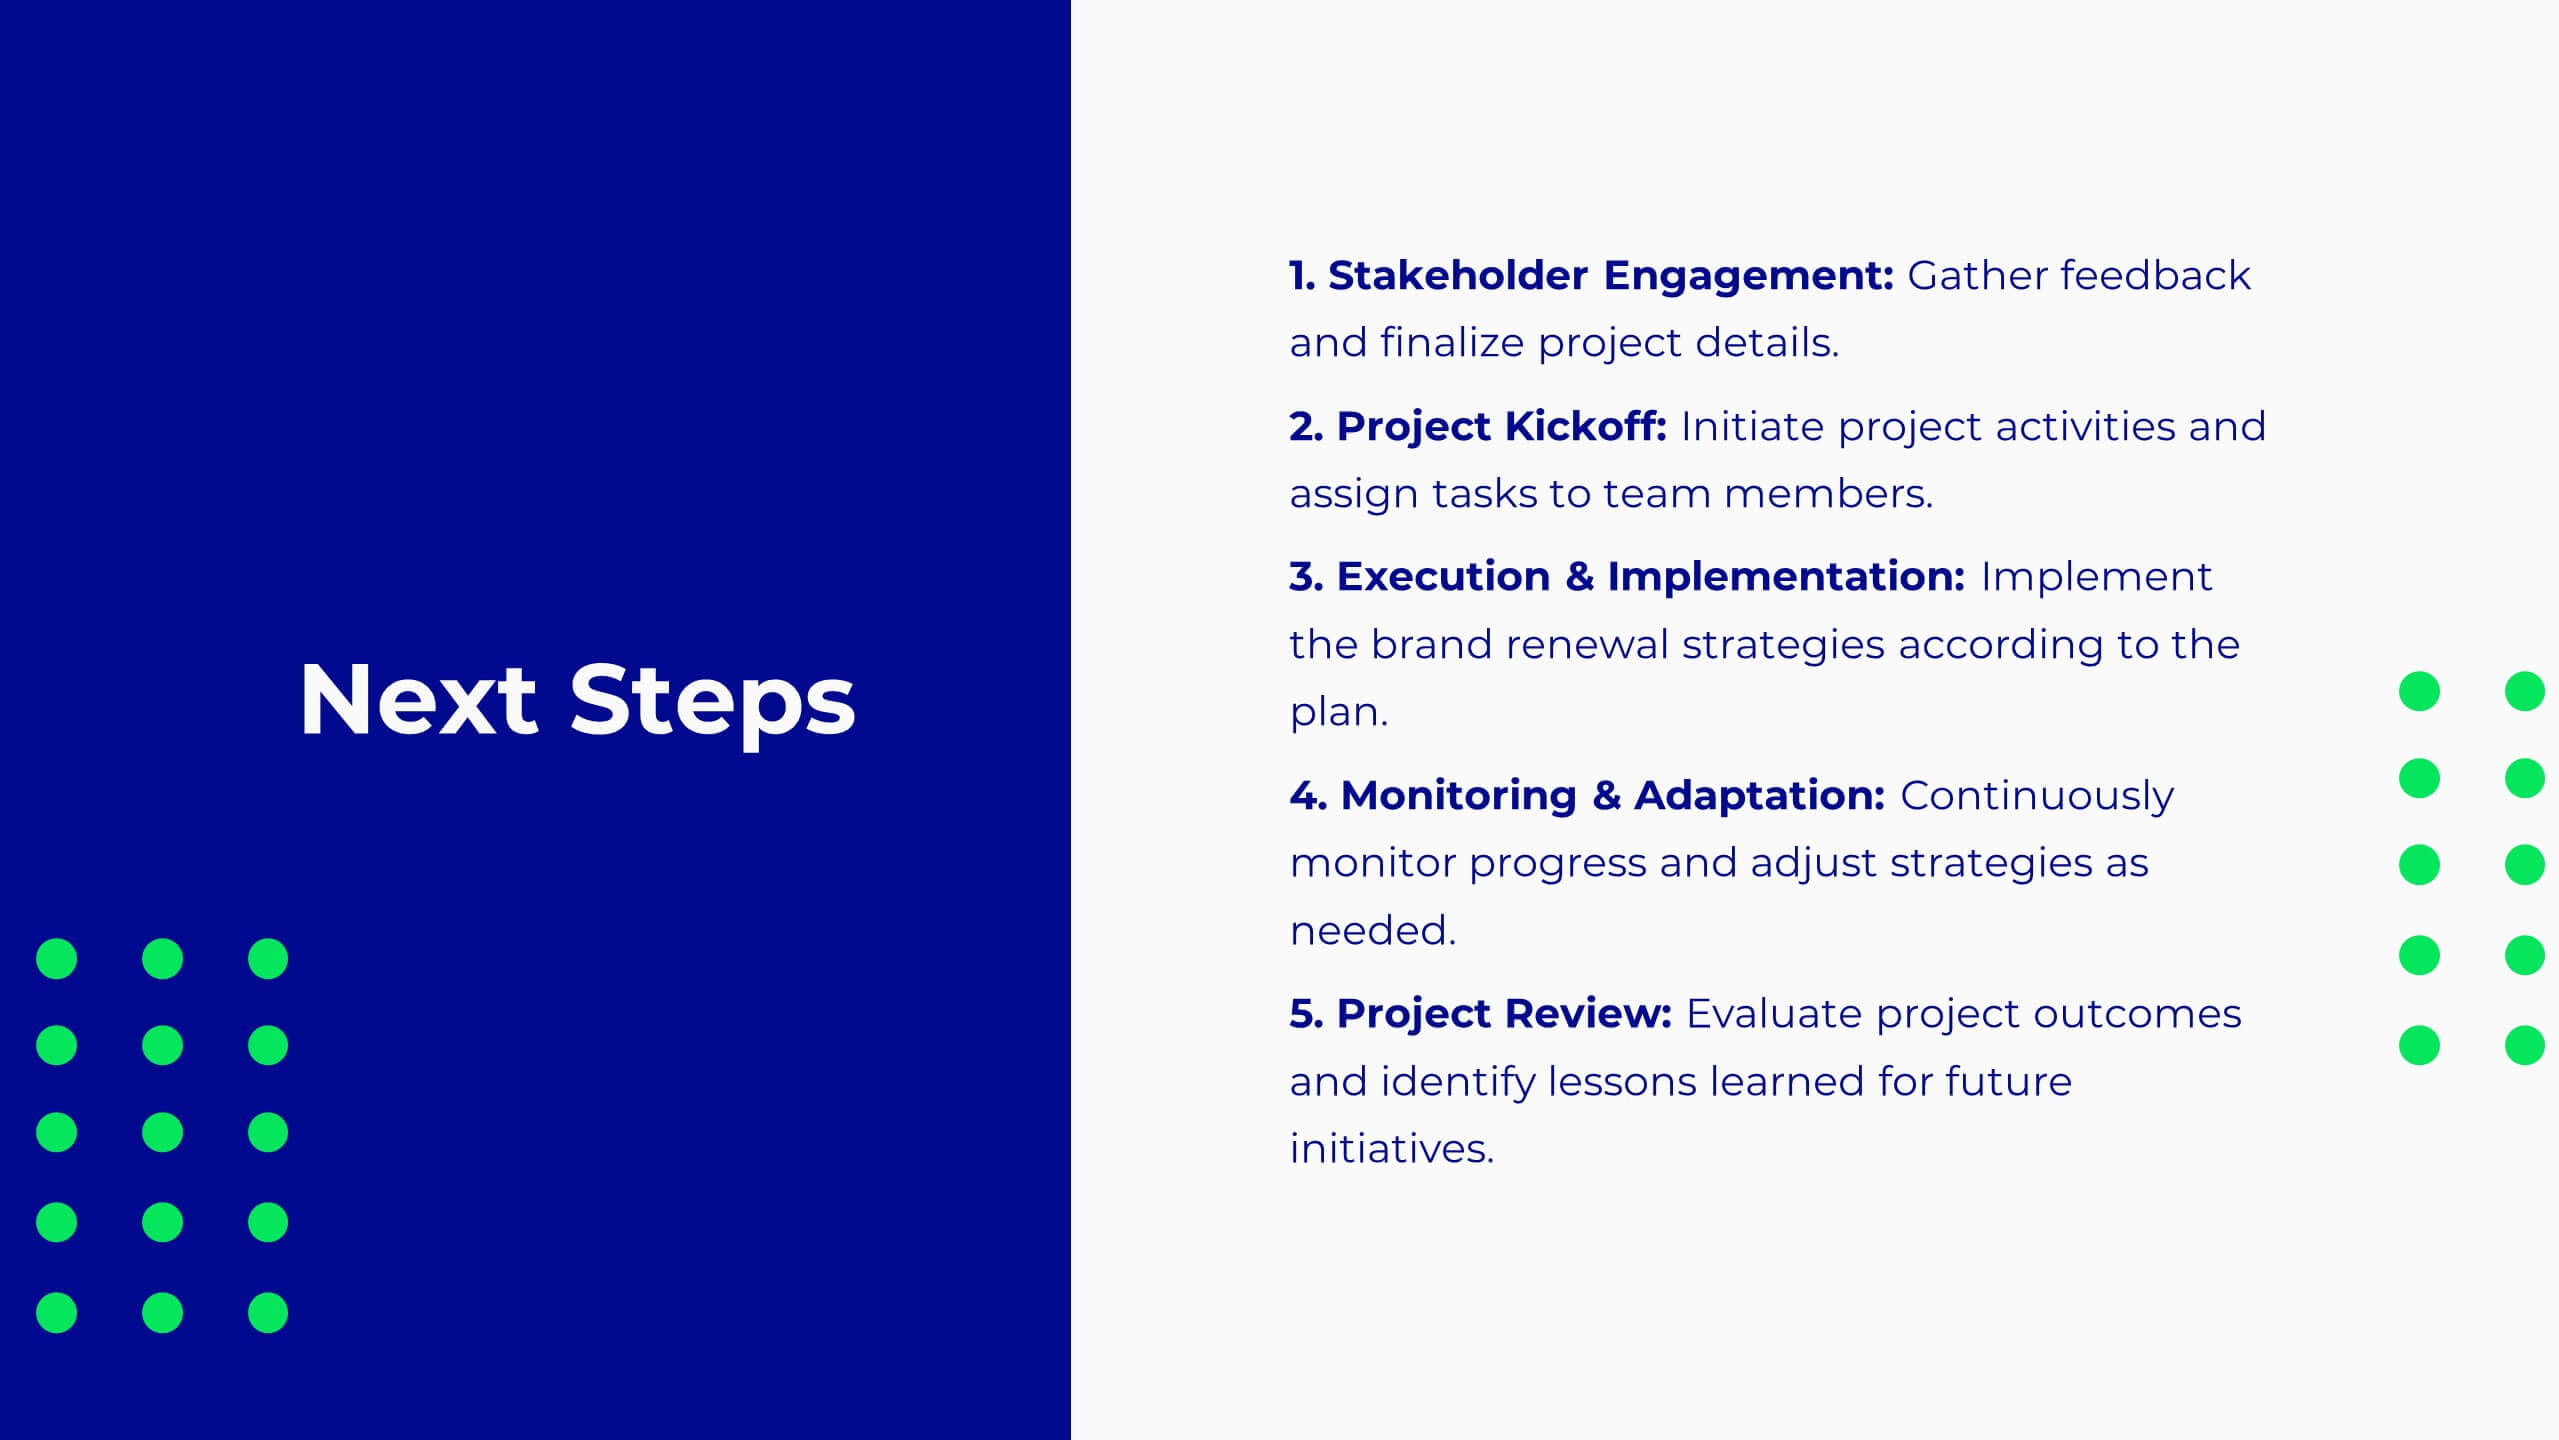
Pulse Project Milestones Report Presentation
Present project milestones effectively with this sleek, professional template. Cover project overview, timeline, and budget. Perfect for defining objectives, scope of work, and resource allocation. Highlight team introductions and stakeholder analysis. Ensure quality with risk management and assurance plans. Compatible with PowerPoint, Keynote, and Google Slides. Elevate your presentations today!


2 diapositivas
Professional Thank You Slide Presentation
End your presentation with a clean, modern slide that leaves a polished final impression. This layout gives you space to share closing notes, contact details, or key reminders in a clear and visually balanced style. Fully editable and compatible with PowerPoint, Keynote, and Google Slides.


20 diapositivas
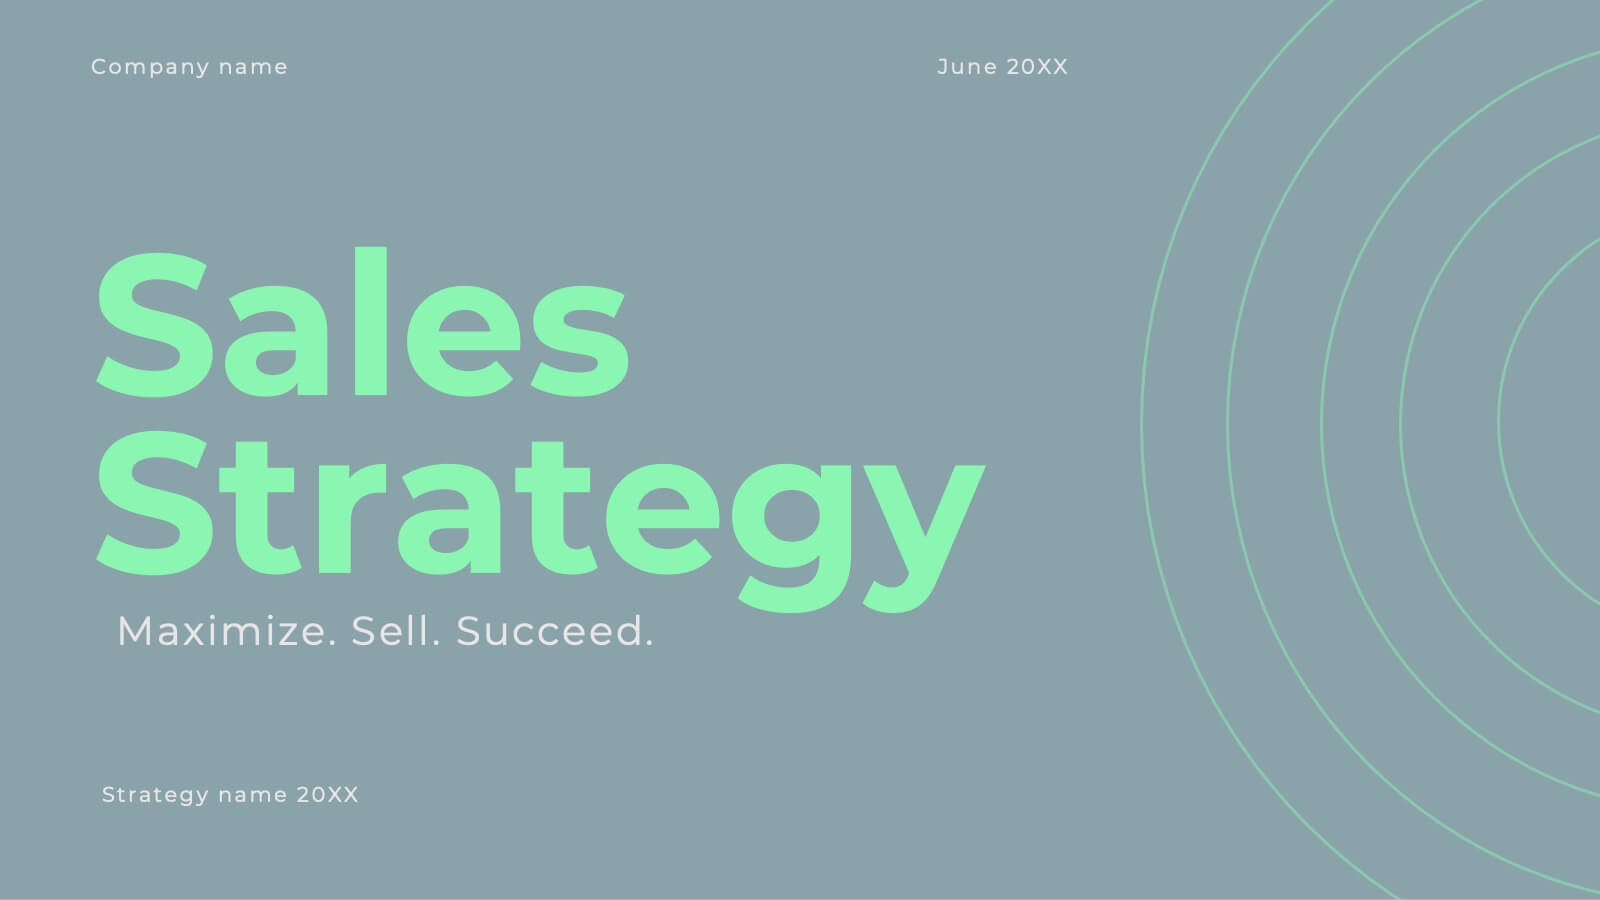
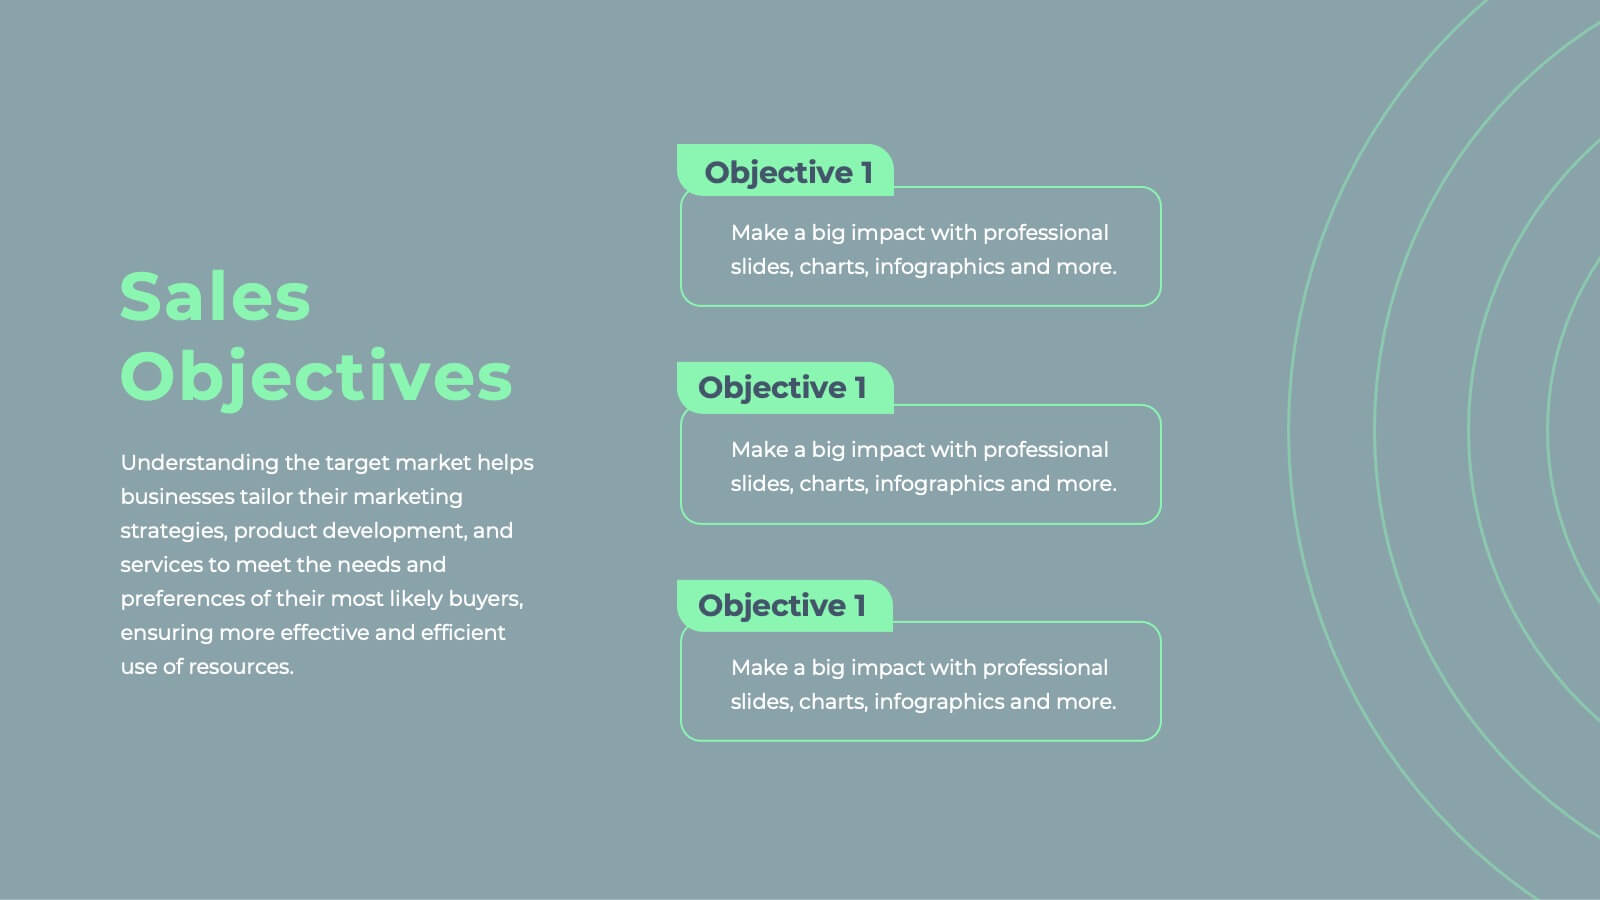
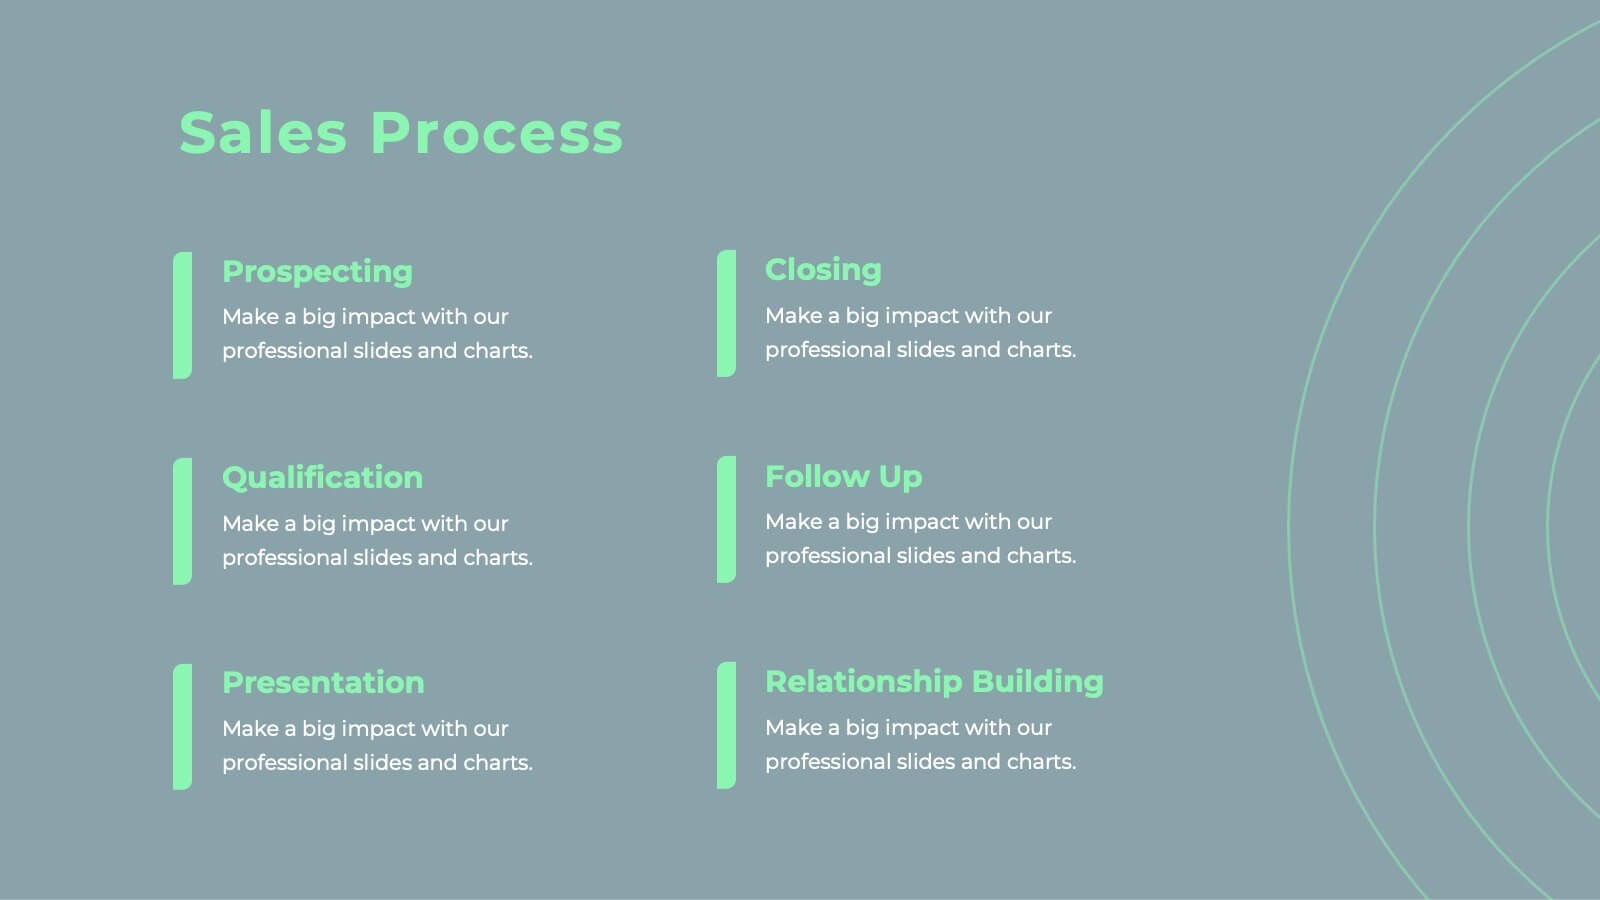
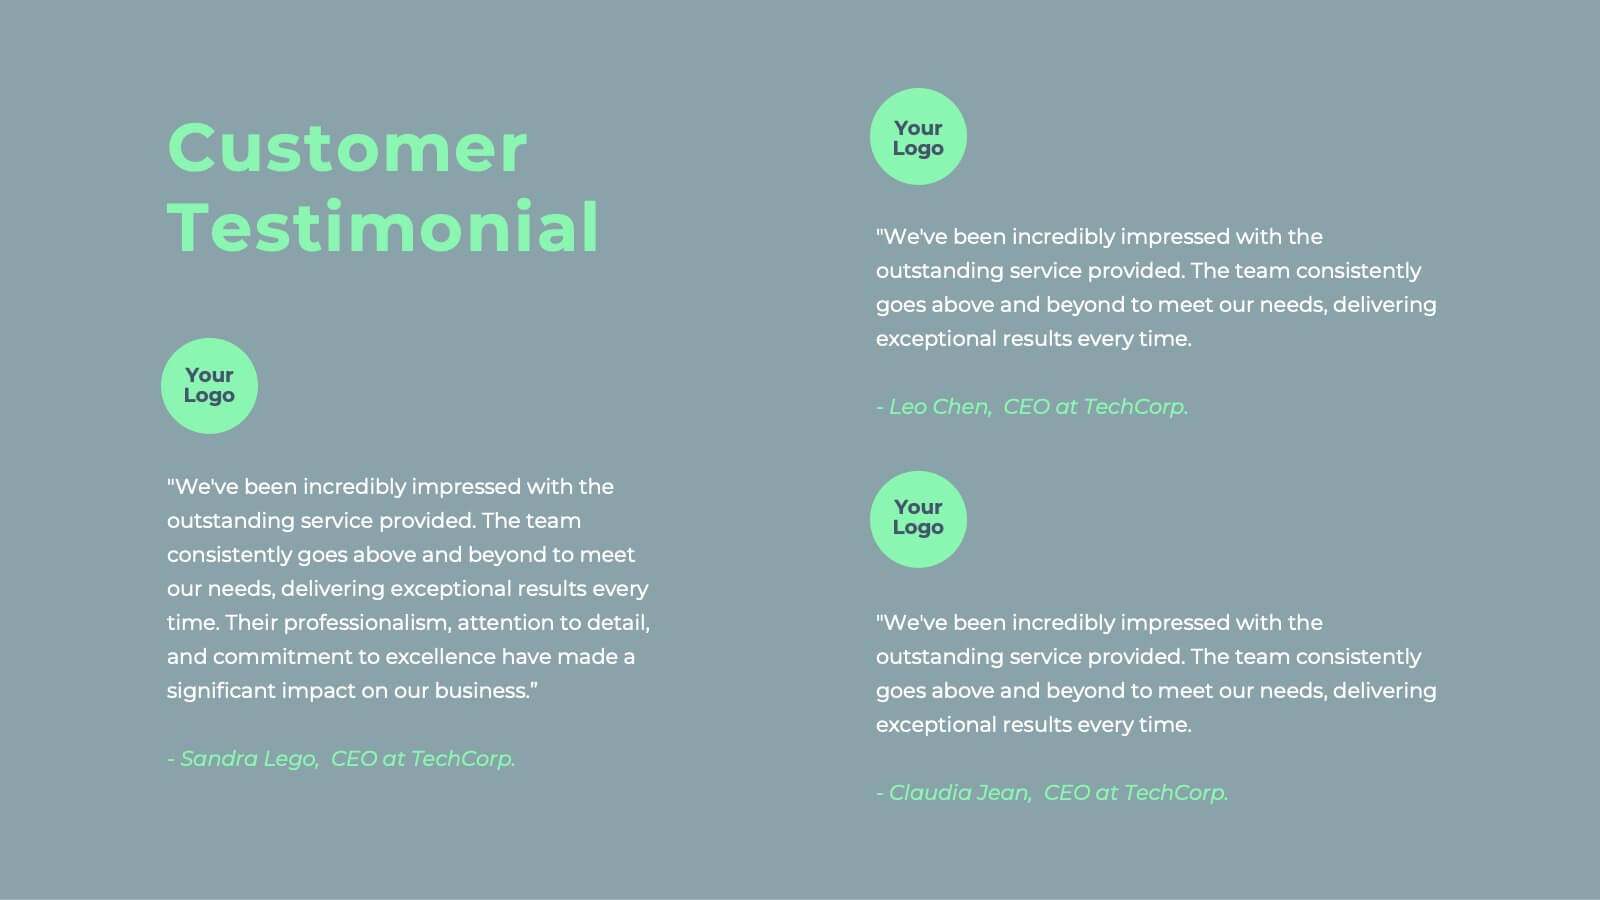
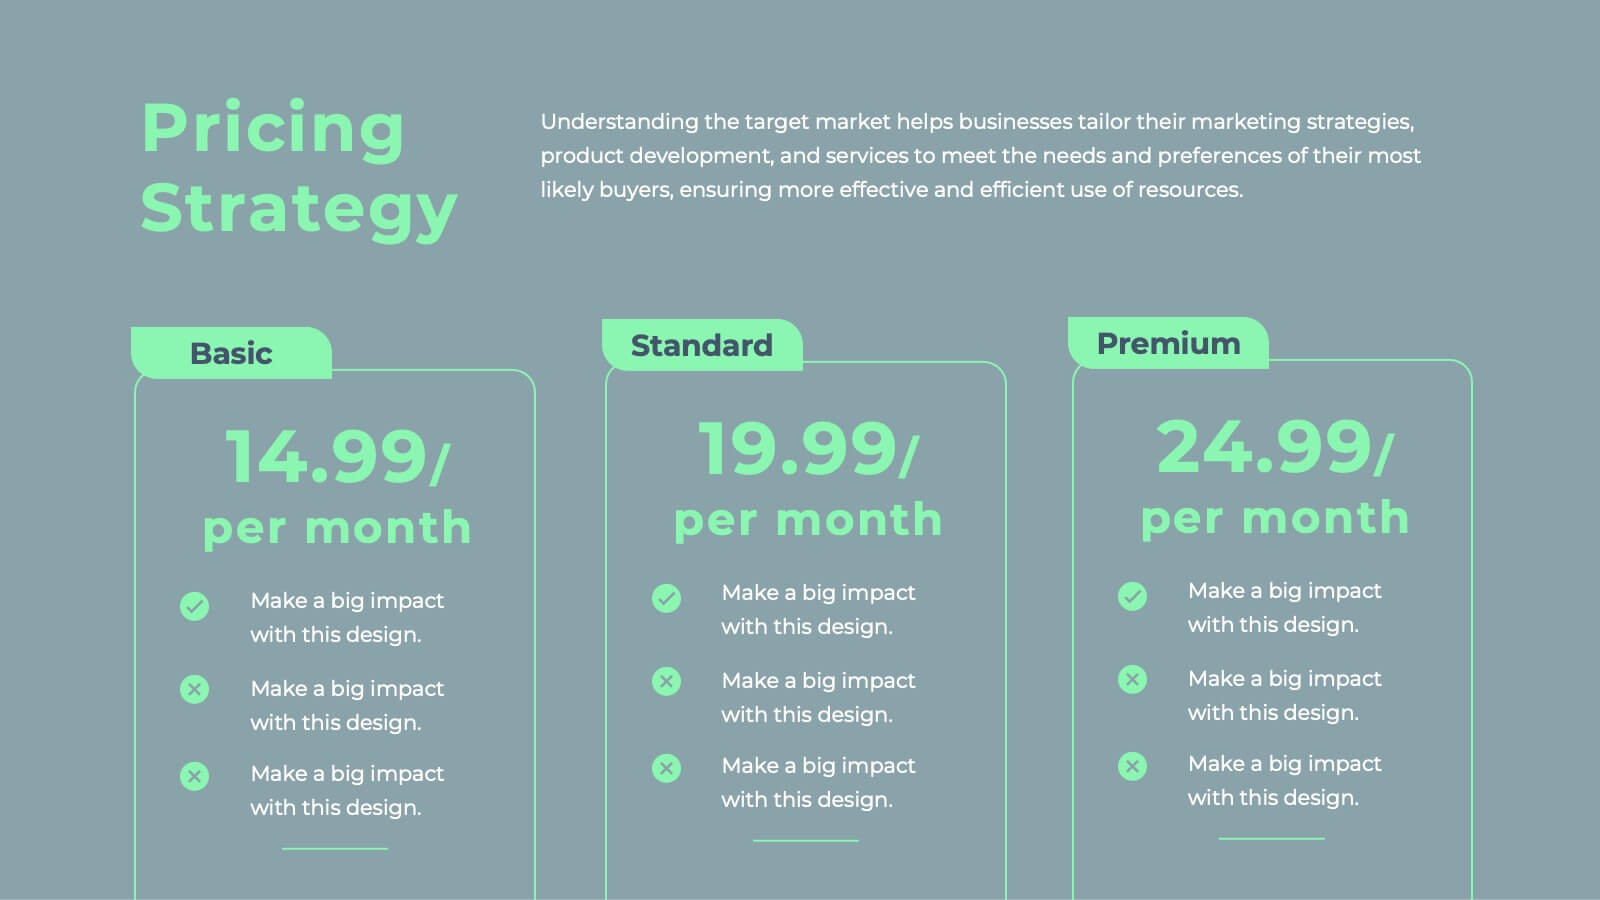
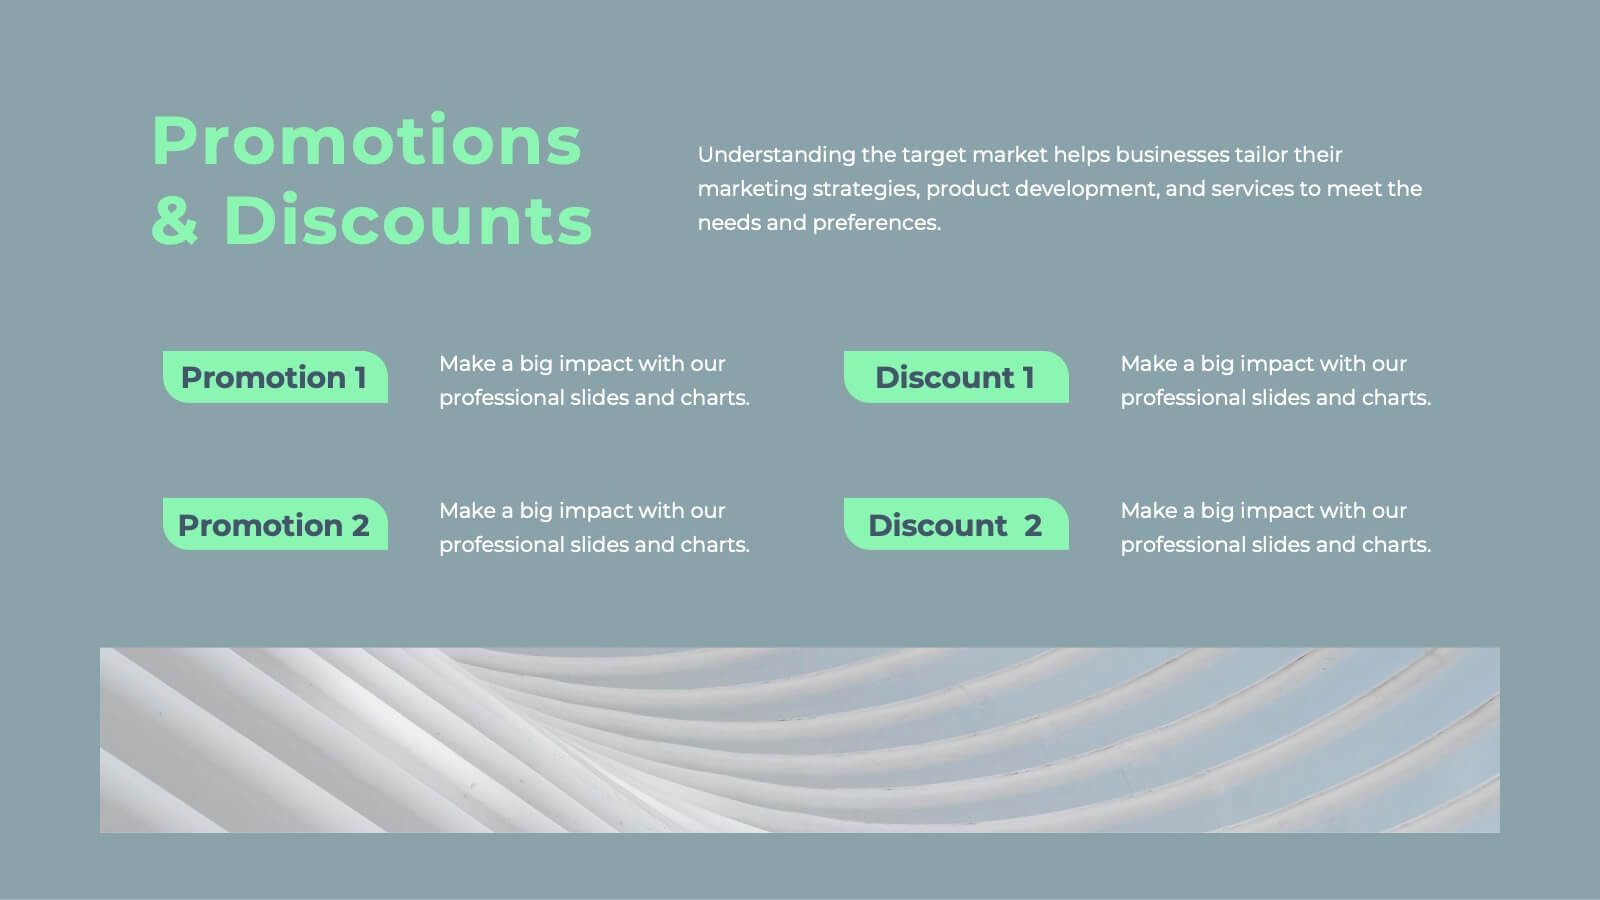
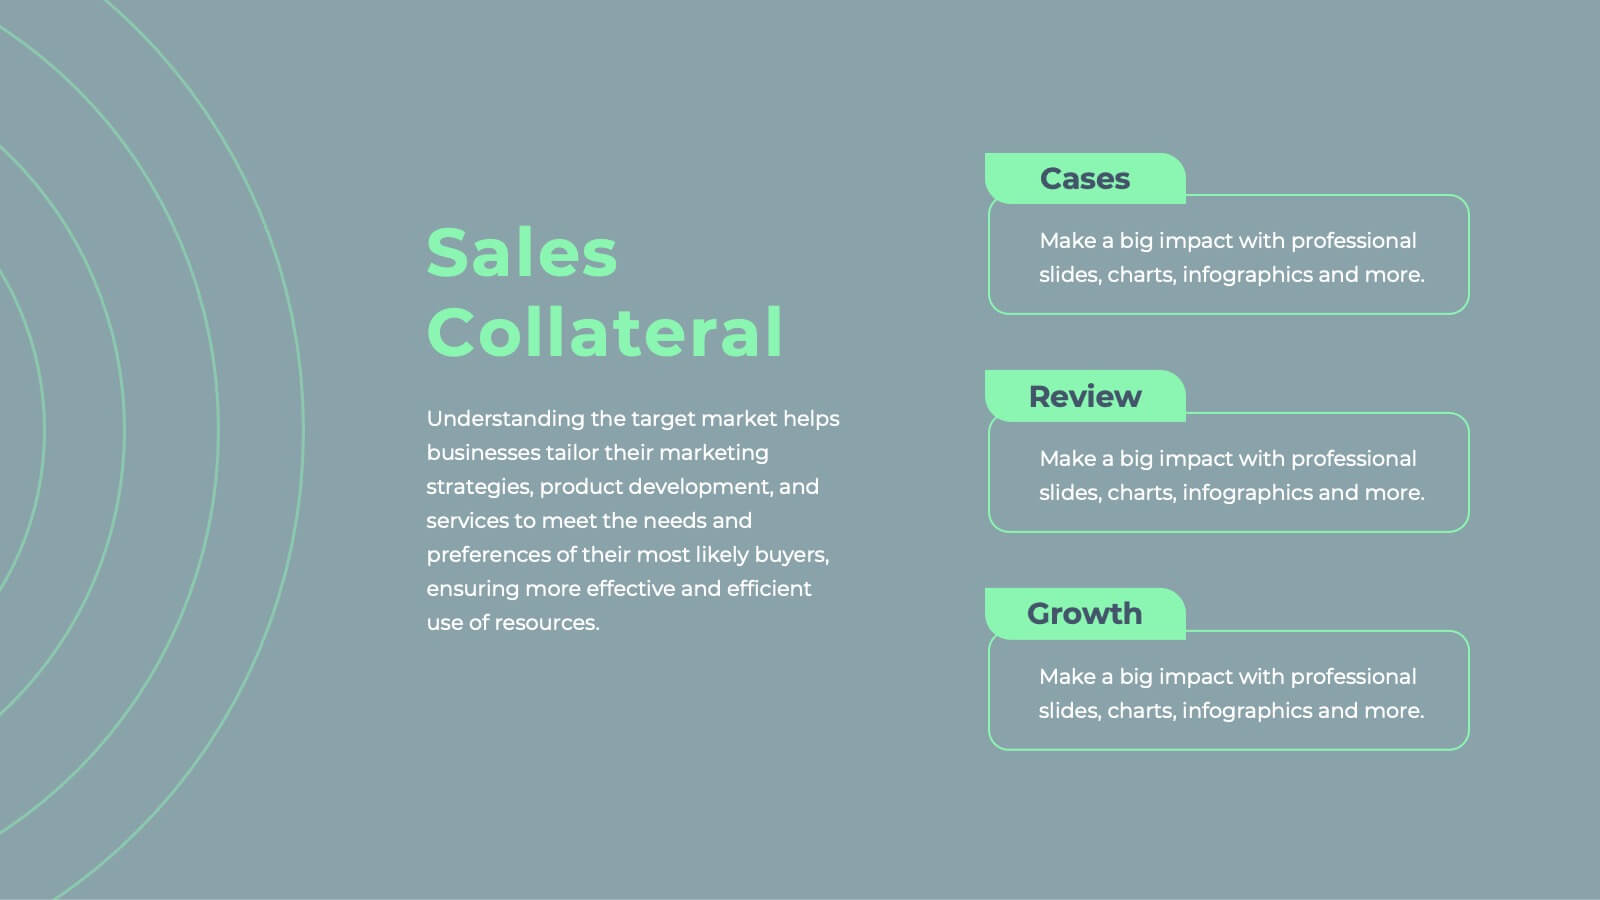
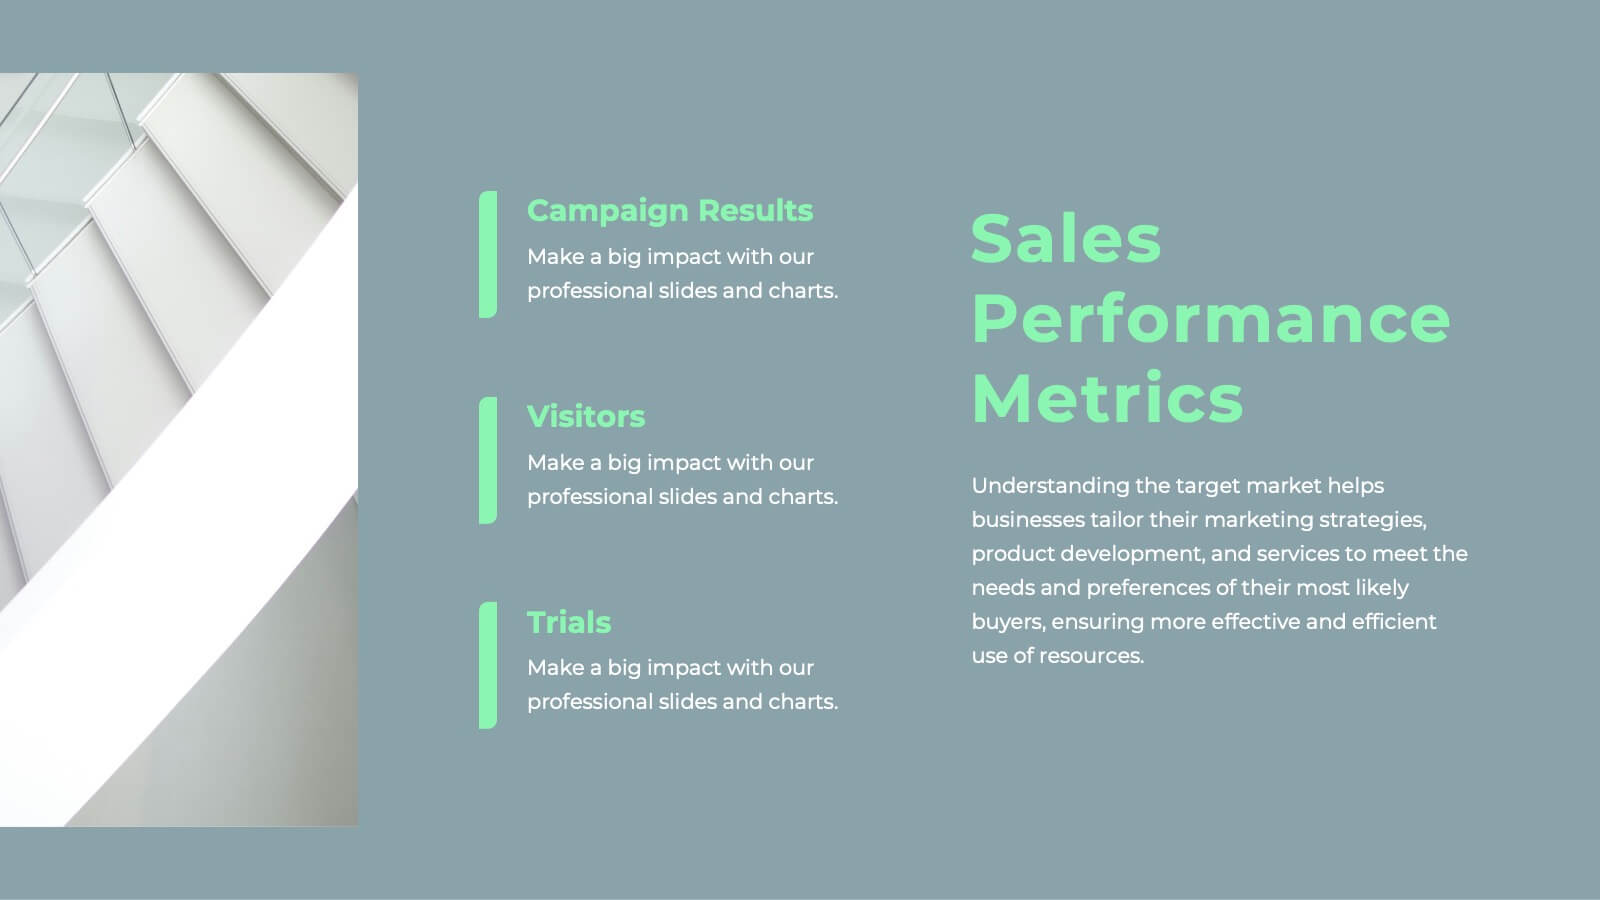
Javelin Sales Strategy Presentation
Boost your sales strategy with this sleek template! Perfect for outlining objectives, processes, performance metrics, and future opportunities. Tailored for impactful presentations to clients and teams. Fully customizable and compatible with PowerPoint, Keynote, and Google Slides.


10 diapositivas
Abstract Geometric Pattern Presentation
Energize your message with a bold, modern pattern that instantly grabs attention and gives your content a polished creative edge. This presentation transforms abstract shapes into a clean visual structure that supports clear talking points and smooth storytelling. Fully editable and compatible with PowerPoint, Keynote, and Google Slides.


21 diapositivas
Starforge Project Status Report Presentation
This Project Status Report Presentation template provides a professional and structured format to track progress, review performance metrics, and outline key achievements. Ideal for business updates, it covers agenda, financial summary, goals review, and next steps. Fully customizable and compatible with PowerPoint, Keynote, and Google Slides for effortless editing.


2 diapositivas
Corporate Identity and Services Overview Presentation
Clearly showcase your company’s offerings with the Corporate Identity and Services Overview Presentation. This modern, minimalist layout is ideal for highlighting key services, team roles, or business pillars with clarity and visual appeal. Fully editable in Canva, PowerPoint, and Google Slides for quick customization and professional results.


10 diapositivas
Effective Team Communication Presentation
Streamline your Effective Team Communication with this modern infographic template. Designed to enhance collaboration and workflow clarity, this slide helps visualize key communication strategies for better team efficiency. Fully customizable in PowerPoint, Keynote, and Google Slides, making it perfect for corporate training, leadership meetings, and project planning.


6 diapositivas
Resource Allocation and PM Strategy Deck Presentation
Break down project resources and team strategies using this dynamic visual dashboard. Track allocation, effort levels, or progress across roles in a clean, easy-to-follow layout. Fully editable in PowerPoint, Keynote, and Google Slides, this template helps project managers communicate priorities and responsibilities with clarity and impact.