


Características


¿Tienes alguna pregunta?
Recomendar


7 diapositivas
Bowtie Chart for Threat Mitigation Presentation
Visualize and mitigate threats with precision using the Bowtie Chart for Threat Mitigation Presentation. This structured layout highlights risks, controls, and consequences in a mirrored bowtie format—perfect for safety planning, compliance, and risk assessment. Fully customizable in Canva, PowerPoint, Google Slides, and Keynote for seamless integration into your workflow.


6 diapositivas
Corporate Profiles Layout Presentation
Bring your business story to life with a clean, modern layout that makes every detail feel polished and professional. This presentation is designed to showcase company highlights, key services, and essential profile information with clarity and impact. Fully editable and easy to customize in PowerPoint, Keynote, and Google Slides.


6 diapositivas
Process Cycle Wheel Slide Presentation
Give your workflow a visual rhythm with this clean, circular layout designed to highlight every stage of a process with clarity and style. Perfect for showcasing cycles, systems, or strategies, it keeps your message organized and engaging. Fully editable and compatible with PowerPoint, Keynote, and Google Slides.


5 diapositivas
Effective Decision-Making with RAPID
Streamline training and clarify roles with this directional RAPID decision-making template. Designed around the Recommend, Agree, Perform, Input, and Decide framework, this visual uses signpost-style arrows to guide teams through each responsibility in a clear, intuitive layout. Ideal for workshops, onboarding, or leadership development sessions. Fully editable in PowerPoint, Keynote, and Google Slides.


5 diapositivas
Environment Articles Infographic
The Environment is important for a number of reasons, it is essential that we take care of it and minimize our impact on it. This vertical Infographic is a visual representations of information related to environmental topics, presented in a vertical format. These infographics are designed to effectively communicate key facts, statistics, and concepts about the environment in a visually appealing and easily digestible manner. This consist of a series of vertically arranged sections or columns, each containing relevant information and visuals. These sections can cover a wide range of environmental topics, such as climate change, renewable energy, pollution, and sustainable practices.


8 diapositivas
Meet the Team Presentation
Showcase your team effectively with our "Meet the Team Presentation" template. This sleek design features personalized cards for each team member, displaying their photo, name, and contact details on a visually appealing, color-coded background. Perfect for onboarding, company introductions, or team-building presentations, this template enhances recognition and cohesion. The distinct colors can be used to signify different roles or departments, making it easy to identify team dynamics at a glance. Compatible with PowerPoint, Keynote, and Google Slides, it’s an essential tool for any organization aiming to present their team in a professional and engaging manner.


5 diapositivas
Financial Investment Portfolio Presentation
Visualize portfolio distribution like never before. This presentation features glass dome-protected coin stacks to represent diverse asset categories, risk levels, or growth stages. Ideal for financial advisors, investors, or business analysts presenting asset management plans. Fully editable in PowerPoint, Keynote, and Google Slides.


6 diapositivas
Biology Tree Diagram Infographic
Tree diagrams in biology are graphical representations that show the hierarchical relationships and evolutionary history of different organisms, species, or biological traits. This infographic template is designed to simplify complex biological information and show the interconnectedness between different biological topics or classifications. This infographic is a visual representation of various biological concepts and relationships in a hierarchical tree structure. This template color codes the different branches to distinguishing between the different categories and make the infographic easier to navigate.


7 diapositivas
Pillar of Success Infographic
Pillars of Success is a metaphorical term used to describe principles or key elements that are essential for achieving success in various aspects of life, whether it's in personal development, business, education, relationships, or any other domain. This infographic template unveils the essential principles that constitute the very pillars upon which triumph and accomplishment stand. Compatible with Powerpoint, Keynote, and Google Slides. The pillars represent foundational factors that contribute to success. This template symbolizes the foundation of any successful venture, emphasizing the importance of a strong start.


6 diapositivas
Business Journey Roadmap Planning Presentation
Map out strategic progress with this Business Journey Roadmap Planning presentation. Ideal for outlining key steps, milestones, and achievements, this staircase-style layout visually guides your audience through your business journey. Fully editable in Canva, PowerPoint, and Google Slides—perfect for project planning, goal setting, and executive updates.


5 diapositivas
Strategic Planning with Foundational Pillars Presentation
Define the structure behind your strategic vision with the Strategic Planning with Foundational Pillars presentation. This template showcases four strong pillars beneath a classical pediment, symbolizing the stability and balance of your business strategy. Each pillar represents a core principle—perfect for themes like leadership, values, operations, or goals. Clean, modern, and entirely editable in PowerPoint, Keynote, and Google Slides, this visual works great for executive briefings, annual plans, or business consulting pitches.


24 diapositivas
Copper Small Business Pitch Deck Presentation
Elevate your business presentations with this clean and professional pitch deck template! Ideal for team meetings, business updates, or investor pitches, it includes sections for collaboration opportunities, performance metrics, and process improvements. The layout ensures clarity and focus, making it perfect for effective communication. It’s fully customizable and works seamlessly with PowerPoint, Keynote, and Google Slides for hassle-free integration.


24 diapositivas
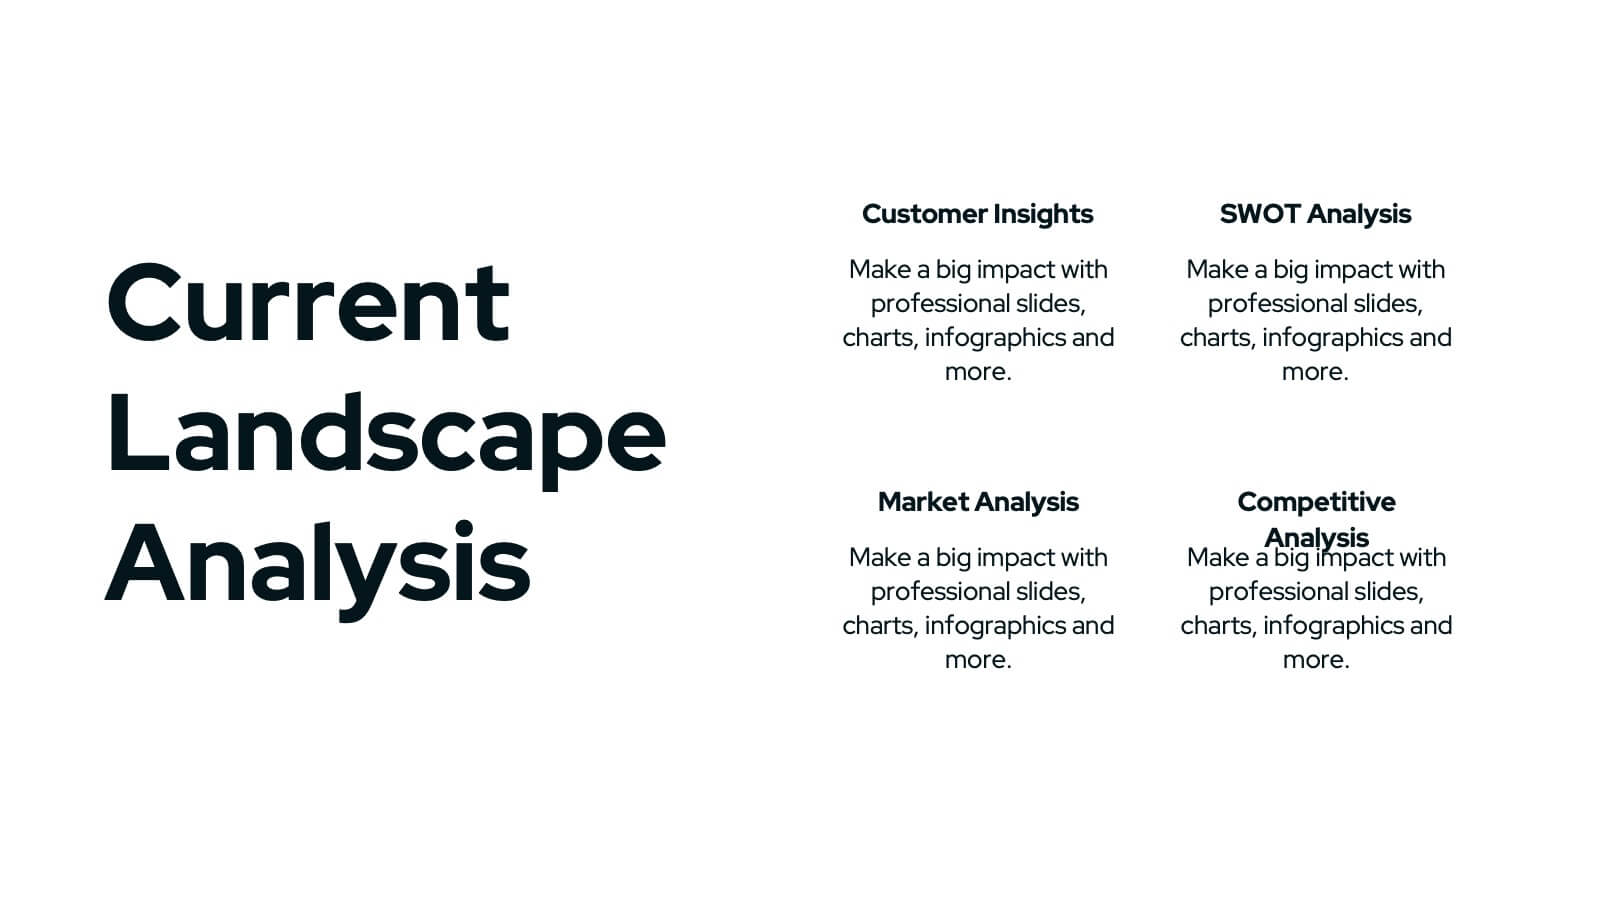
Kepler Investor Pitch Presentation
Impress potential investors with this thoughtfully crafted investor pitch presentation template. Its sleek design is tailored to captivate attention while delivering a clear and concise narrative about your business. Highlight key sections, including your company overview, problem statement, and innovative solutions, all designed to set you apart from the competition. Dive deep into your market opportunities, target audience, and revenue model, using visually engaging layouts and infographics. Showcase growth projections, financial overviews, and funding requirements with clarity and professionalism. Additionally, present your unique selling proposition, milestones, and risk analysis effectively. With dedicated slides for team introductions and a compelling close, this template is perfect for startups and established businesses alike. Fully customizable and compatible with PowerPoint, Google Slides, and Keynote, it ensures seamless branding and adaptability for any presentation. Engage your audience and secure the investment you need!


8 diapositivas
Cycle of Continuous Improvement Deck Presentation
Highlight iterative progress and strategic refinement with the Cycle of Continuous Improvement Deck. This template is ideal for quality management, agile planning, or operational excellence sessions. Fully editable and visually dynamic, it presents circular workflows in clean layouts. Compatible with PowerPoint, Keynote, and Google Slides—great for teams and consultants.


5 diapositivas
Office Collaboration Illustration Pack Presentation
Visualize modern teamwork with this sleek office collaboration layout. Ideal for showcasing brainstorming sessions, decision-making flows, or team communication, this illustration-driven template is perfect for business updates, internal strategy briefs, or workflow discussions. Fully editable and compatible with PowerPoint, Keynote, and Google Slides.


6 diapositivas
AIDA Diagram
The AIDA Diagram is a simple and effective marketing tool used to guide the design of advertising and promotional materials with the goal of attracting and retaining customers. AIDA stands for Attention, Interest, Desire, and Action, and it represents the four stages a potential customer goes through when exposed to marketing content. This infographic template is a classic marketing and advertising framework used to understand and guide the consumer's journey through the buying process. This infographic is completely customizable and compatible with Powerpoint, Keynote, and Google Slides.

21 diapositivas
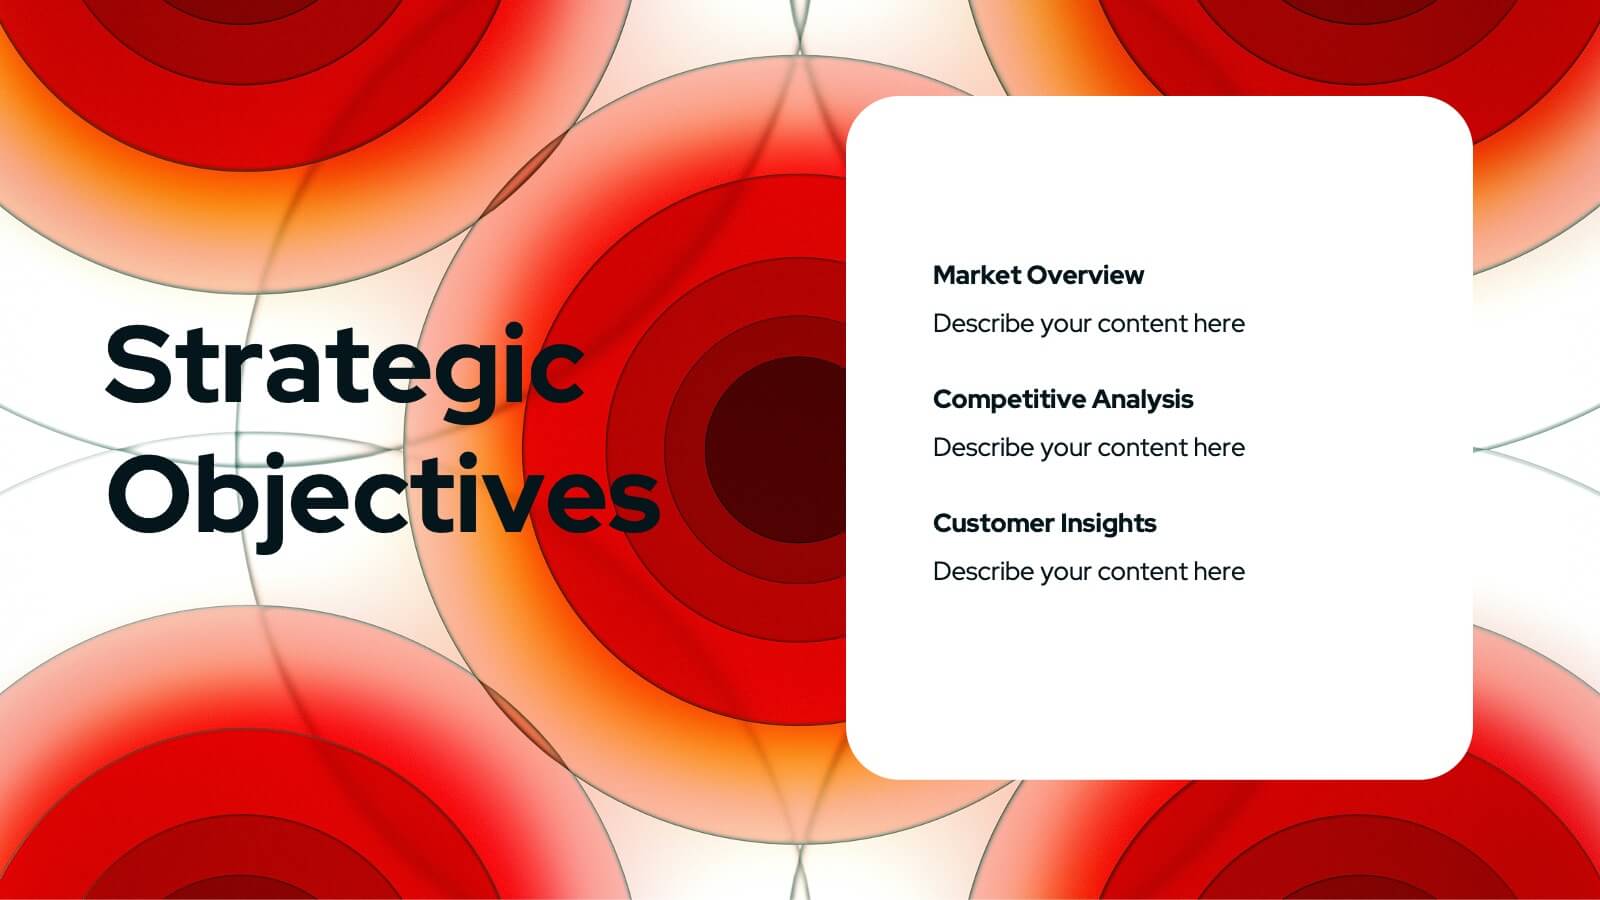
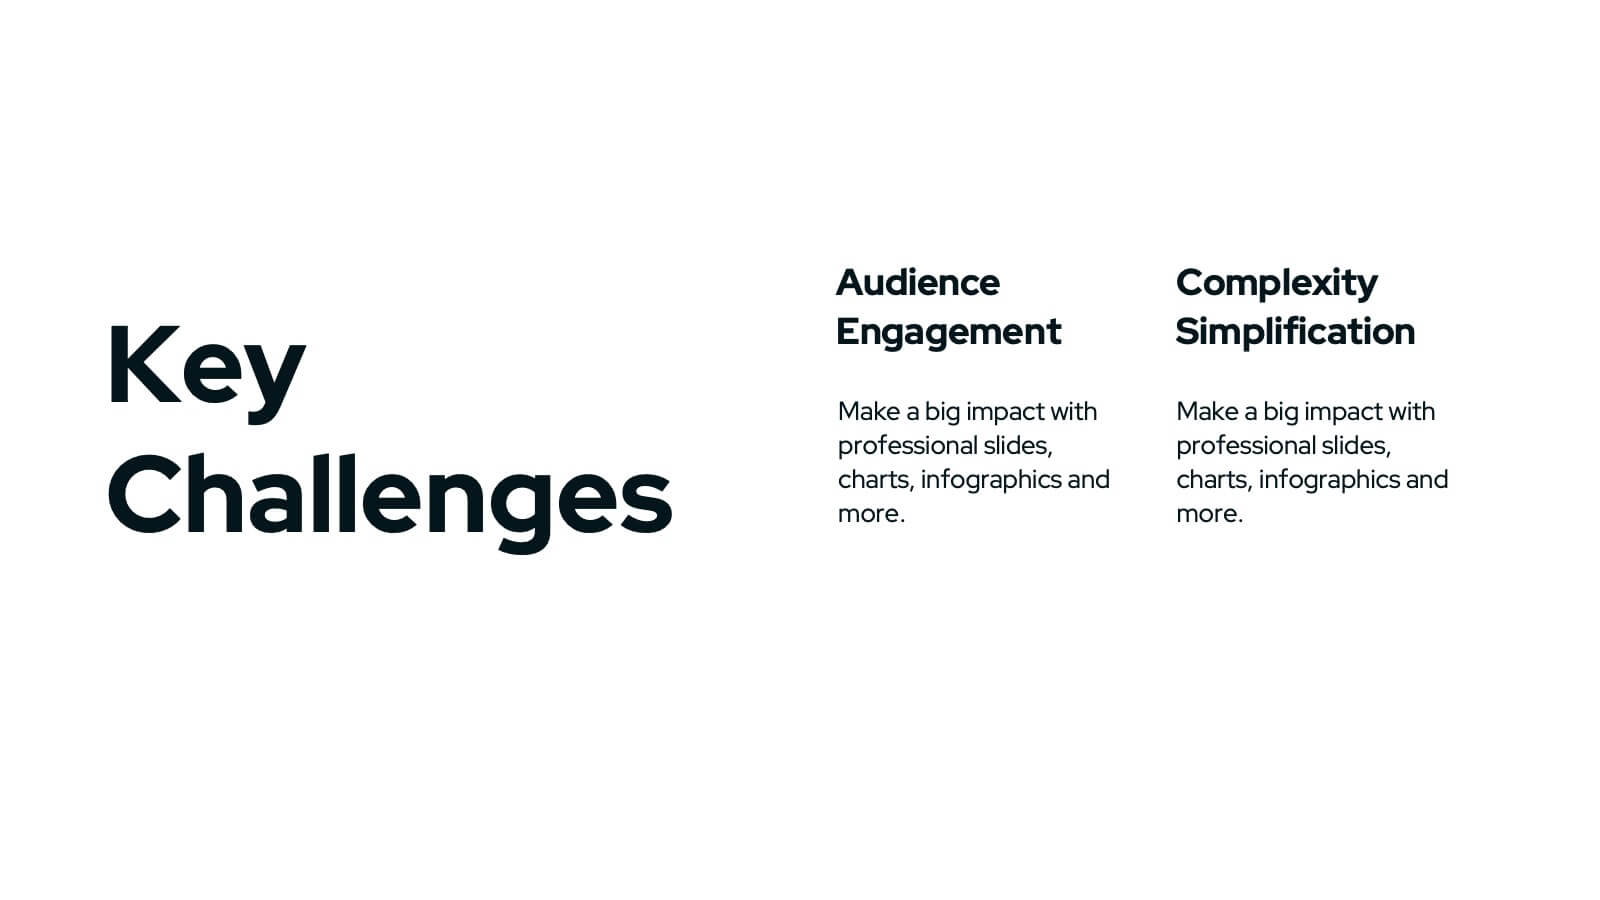
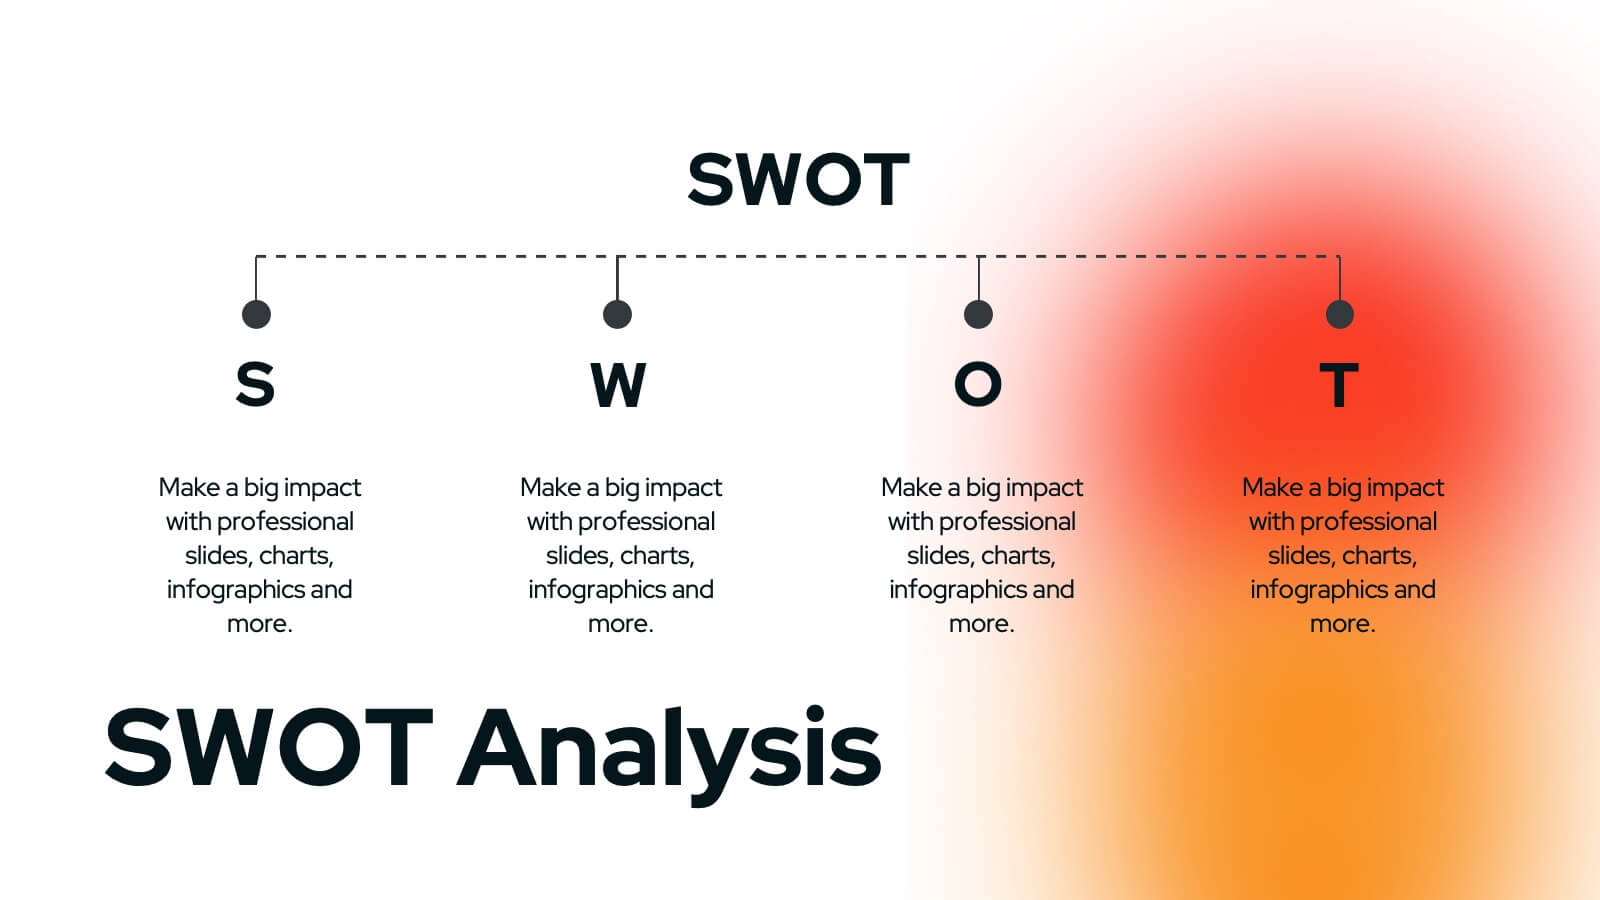
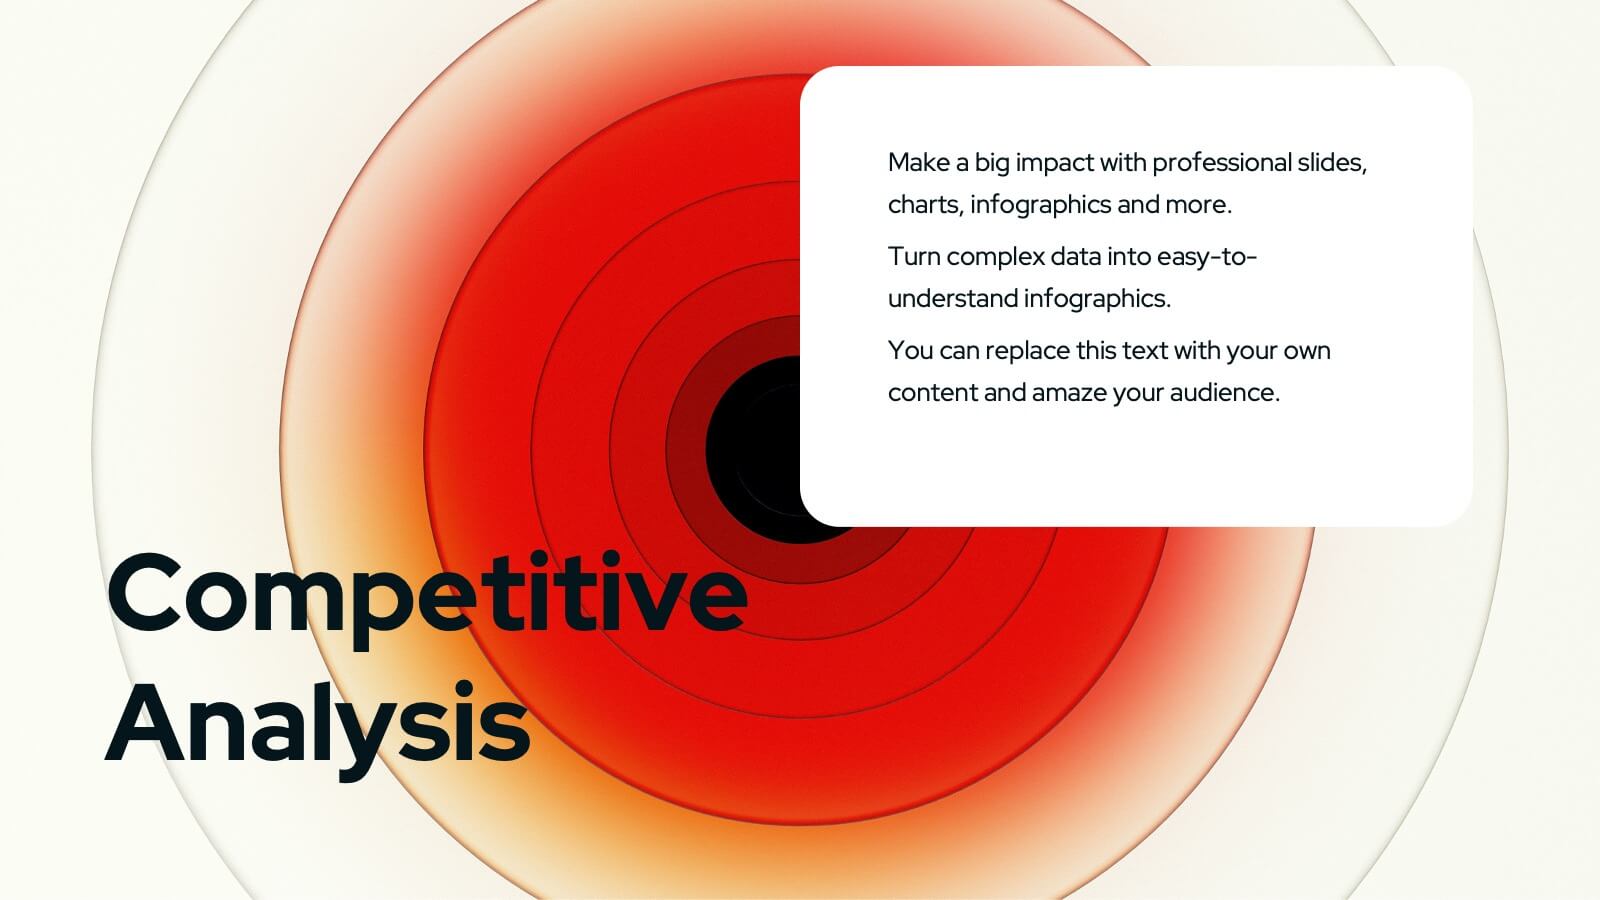
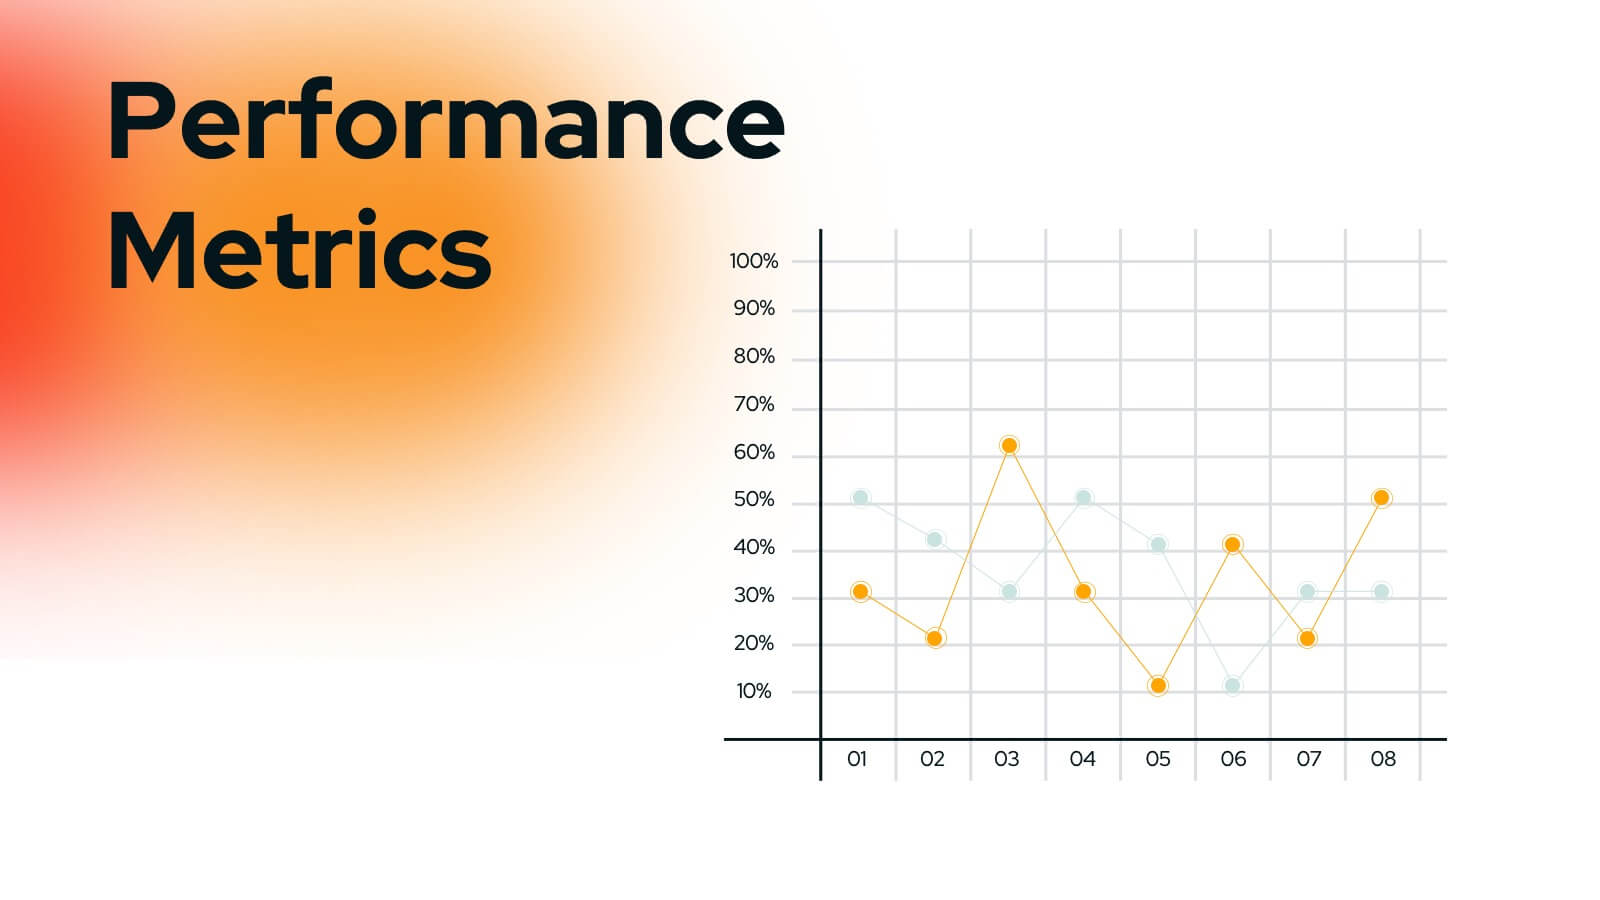
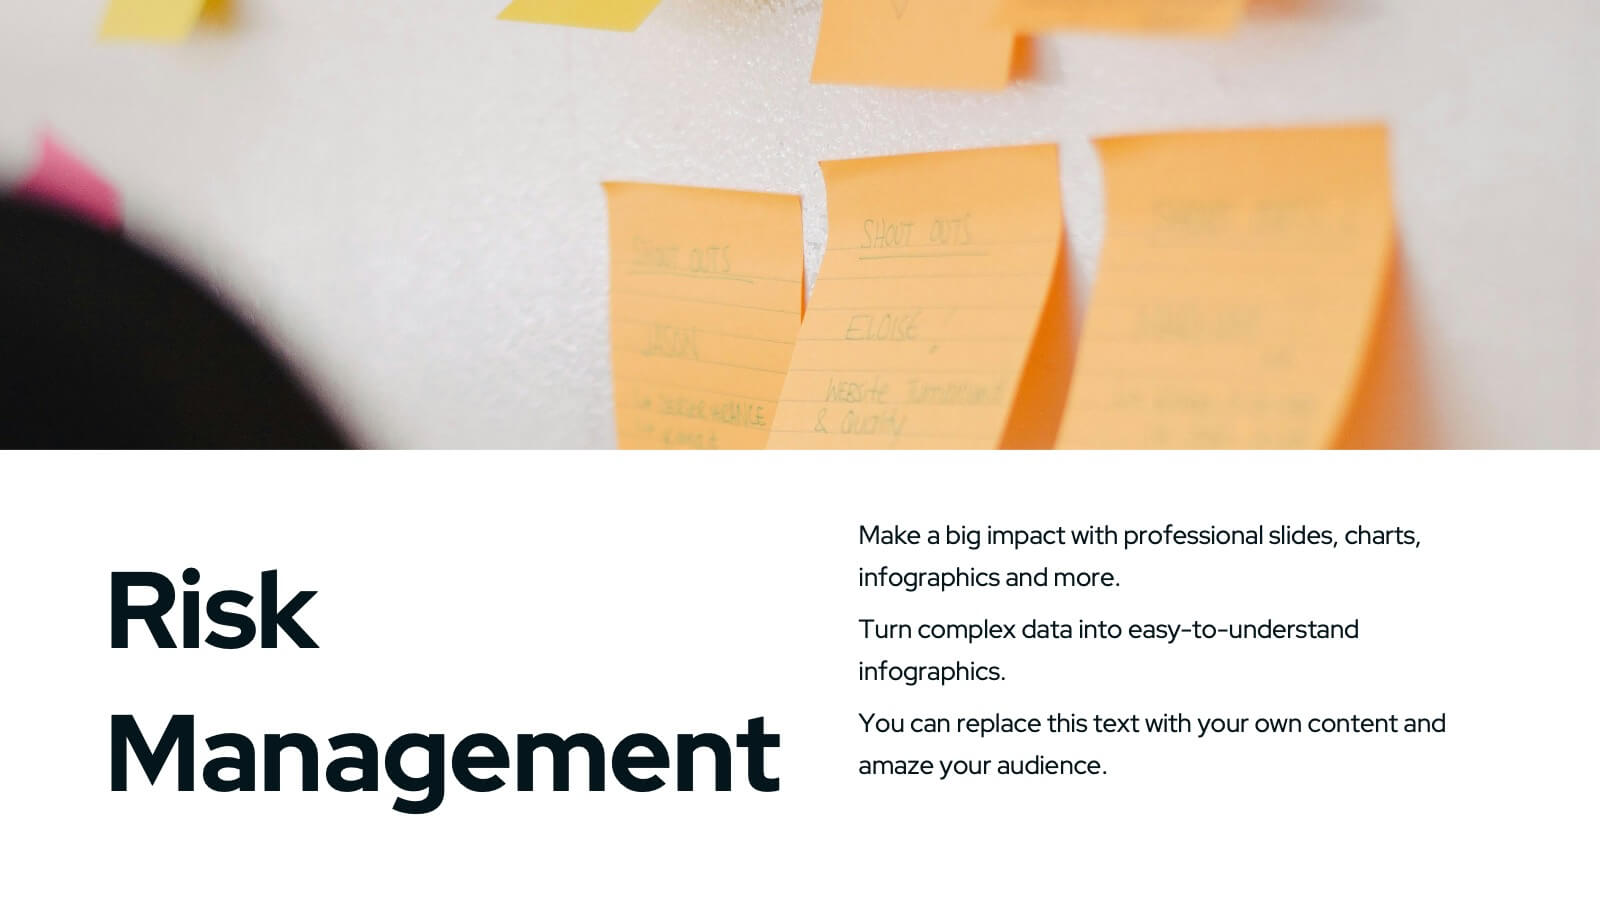
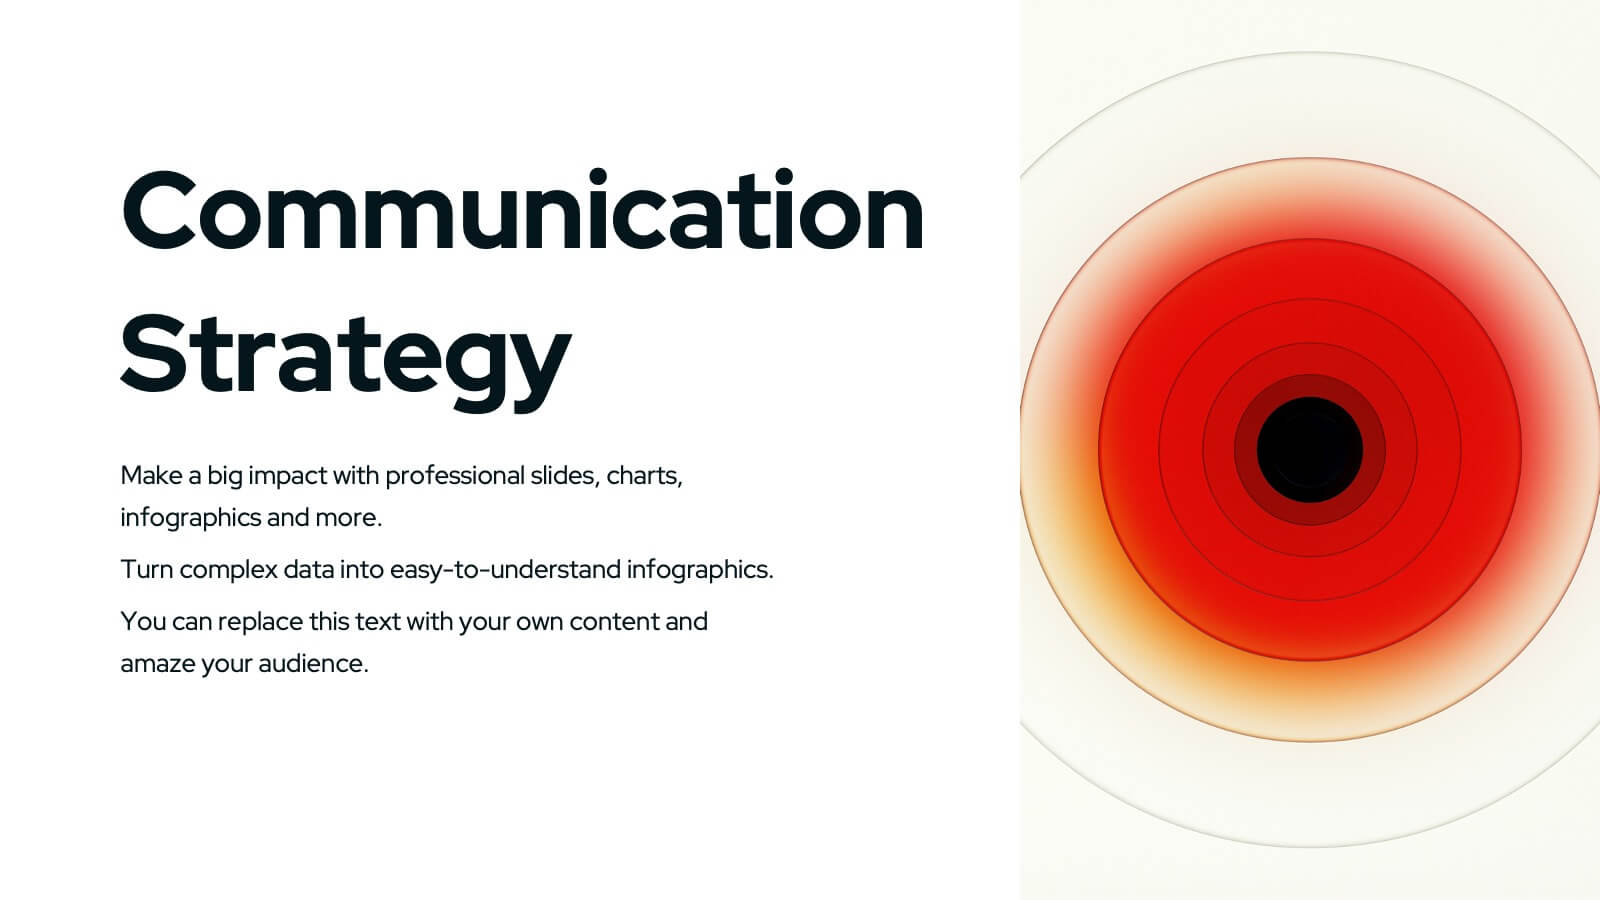
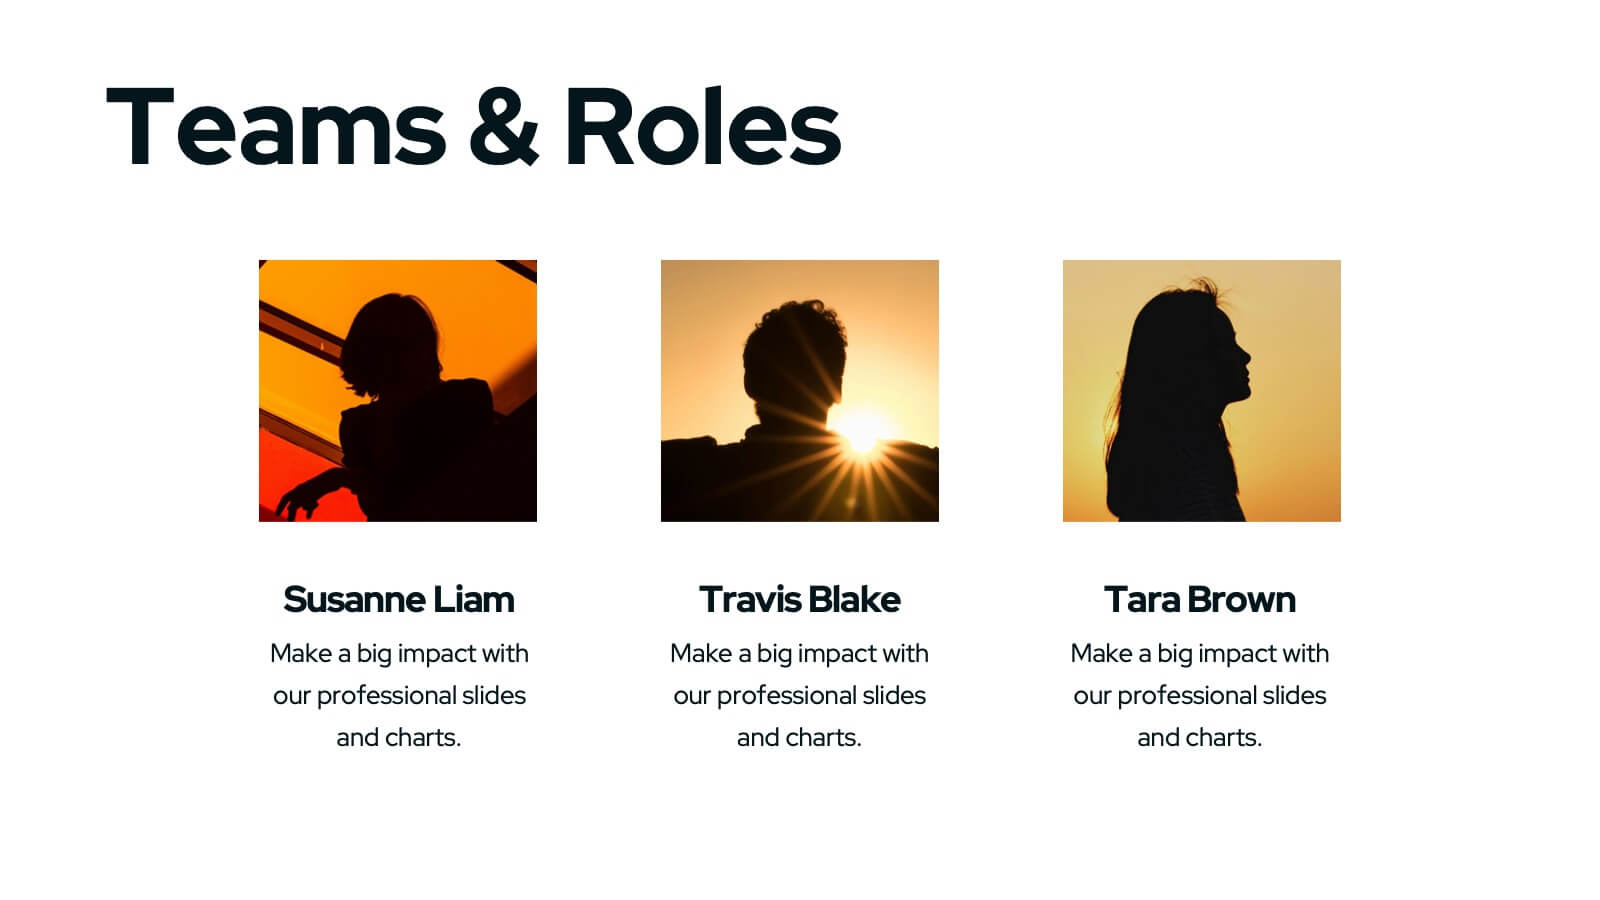
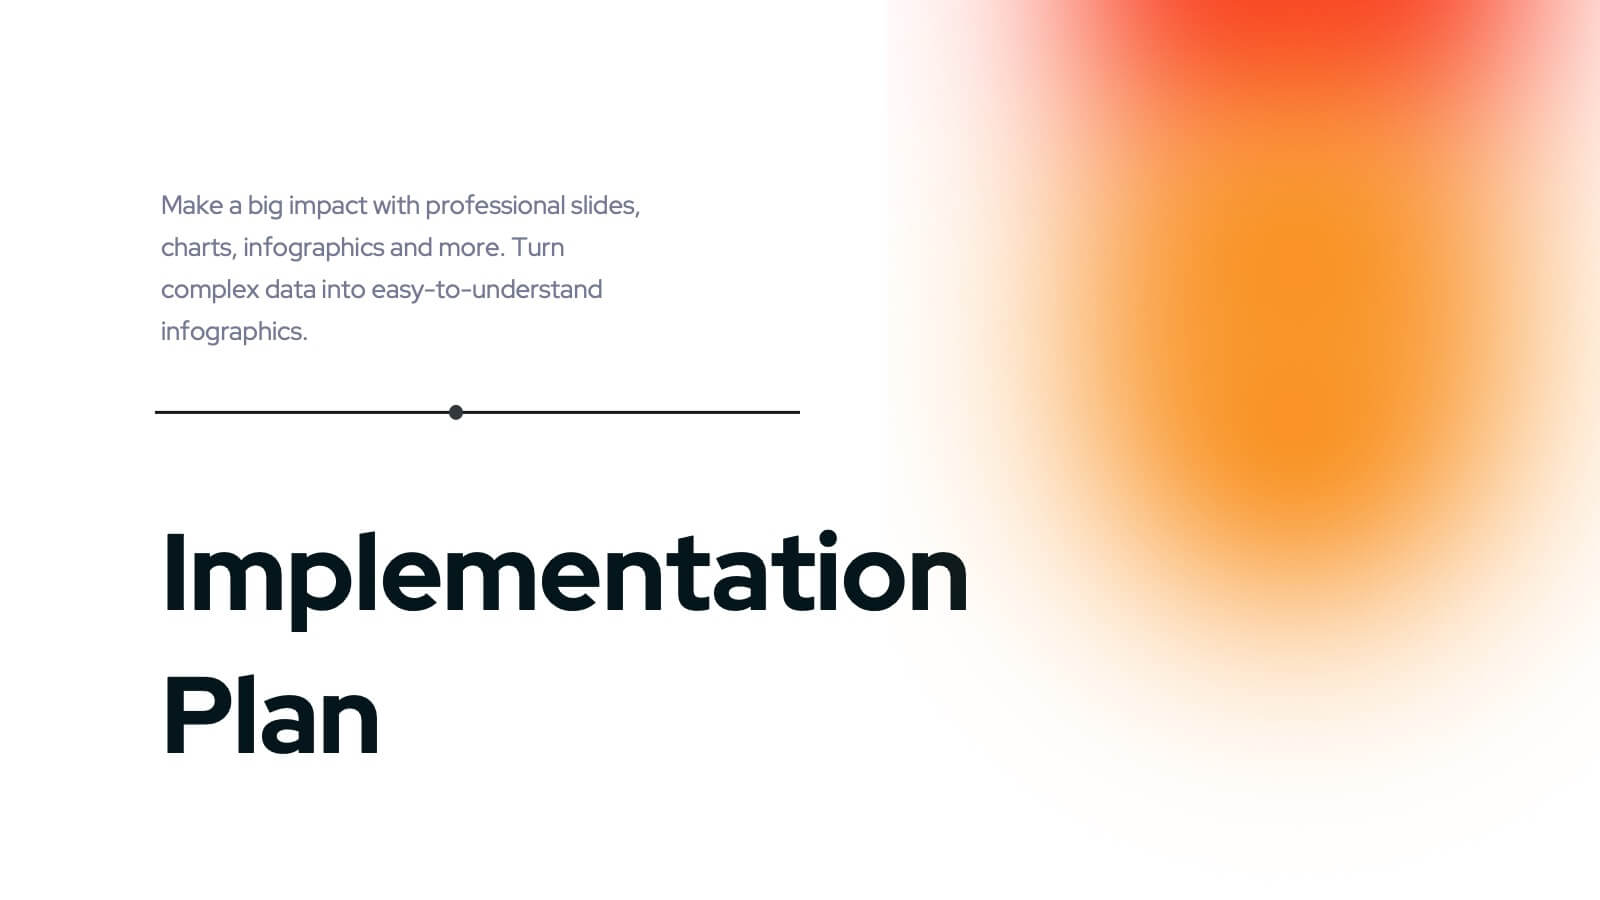
Wyrm Marketing Strategy Plan Presentation
Unleash the power of your marketing strategy with this bold and dynamic presentation template! Perfect for covering everything from landscape analysis and target audience identification to performance metrics and risk management. This template helps guide your audience through key challenges, SWOT analysis, and strategic initiatives with clarity and impact. Compatible with PowerPoint, Keynote, and Google Slides for effortless and engaging presentations.