


Características


¿Tienes alguna pregunta?
Recomendar


26 diapositivas
Beauty Products Company Profile Presentation
A beauty products company is a business that specializes in the development, manufacturing, marketing, and sale of various beauty and skincare products. This presentation template is designed to showcase your cosmetics and skincare brand in the most captivating and alluring way possible. With a blend of elegance and modernity, this template is your beauty brand's ticket to leaving a lasting impression on clients, investors, and partners. Fully customizable and compatible with Powerpoint, Keynote, and Google Slides. The sophisticated color palette will reflect the elegance of your beauty company.


4 diapositivas
Cyber Security Measures Overview Presentation
Protect your digital world with this bold and professional template designed to visualize data protection, network security, and online safety strategies. Perfect for IT teams, tech presentations, or training materials. Fully customizable and compatible with PowerPoint, Keynote, and Google Slides for a seamless and secure presentation experience.


4 diapositivas
Lean Agile Implementation Roadmap Presentation
Present your Lean Agile journey with this upward roadmap diagram. Designed for project managers and Agile teams, this layout visualizes four progressive stages using icons and curved arrows. Ideal for showcasing phased adoption, sprint milestones, or transformation goals. Fully customizable in PowerPoint, Keynote, and Google Slides for easy adaptation.


6 diapositivas
Business Growth Metrics Butterfly Chart
Highlight performance patterns and opportunities with the Business Growth Metrics Butterfly Chart Presentation. This engaging layout uses mirrored radial segments to present six growth indicators—ideal for tracking progress across two categories, departments, or timeframes. The butterfly-shaped curves draw the viewer’s attention to the center, making comparisons intuitive and visually balanced. Fully customizable in PowerPoint, Keynote, and Google Slides, this template is perfect for showcasing KPI trends, sales metrics, or marketing performance.


21 diapositivas
Starchime UX Case Study Presentation
Showcase your UX design process with this case study template, covering research, user journey mapping, wireframes, and usability testing. Ideal for presenting design insights and outcomes. Compatible with PowerPoint, Keynote, and Google Slides, it’s perfect for a clear, professional, and impactful UX design presentation.


10 diapositivas
Financial Investment Strategy Presentation
Bring your financial ideas together with a clean, puzzle-style layout that instantly makes complex strategies feel organized and actionable. This presentation helps you explain key components, compare performance drivers, and present investment plans with clarity and confidence. Easy to edit and fully compatible with PowerPoint, Keynote, and Google Slides.


26 diapositivas
Remote Work Strategies Presentation
Enhance your team's flexibility with our Remote Work Strategies presentation template, designed for use with PowerPoint, Keynote, and Google Slides. This template is an invaluable asset for team leaders, HR professionals, and business consultants dedicated to cultivating a productive remote work culture. Our template is tailored to provide an in-depth analysis of remote work best practices, offering slides that cover essential strategies for communication, collaboration, and project management in a virtual environment. It also includes insights on setting up a successful home office, maintaining work-life balance, and leveraging technology for seamless remote operations. With customizable elements, you can illustrate the advantages of remote work, share success stories, and provide actionable tips to maximize team efficiency from afar. This template is SEO-optimized to ensure your presentation reaches those seeking to optimize their remote work operations and foster a thriving digital workplace.


21 diapositivas
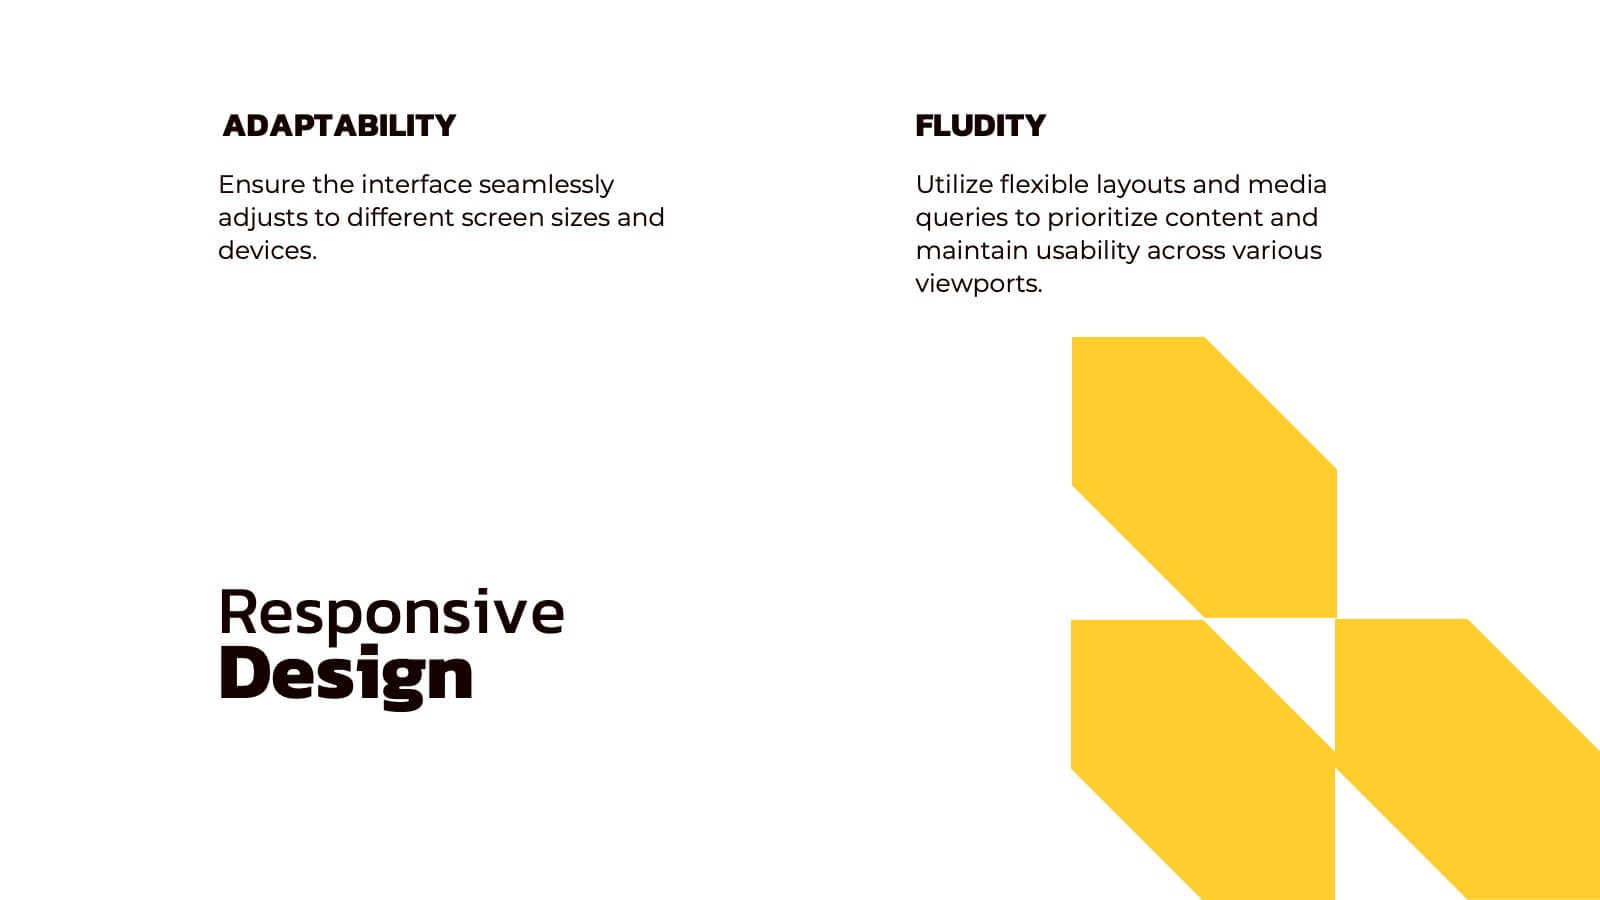
Crystalhearth UX Design Presentation
This professional template simplifies UX/UI design presentations, covering user research, personas, journey mapping, wireframes, and usability guidelines. Showcase visual elements, branding, accessibility, and responsive design. Ideal for illustrating the iterative process, testing insights, and project showcases. Fully customizable and compatible with PowerPoint, Keynote, and Google Slides.


5 diapositivas
Numerical Highlights in Strategy Presentation
Present key strategic milestones using this visually engaging curved-number layout. Designed to emphasize four sequential points, it's perfect for showcasing steps, achievements, or data-driven highlights. The bold numbering and layered hills guide the viewer naturally. Fully editable in Canva—ideal for business plans, growth summaries, or performance strategy visuals.


21 diapositivas
Eidolon Digital Strategy Presentation
Craft a forward-thinking presentation with a dynamic template designed for digital strategies. Highlight key components such as current landscape analysis, market trends, and competitive insights to provide a comprehensive overview of your strategic vision. Use the SWOT analysis and key challenges slides to identify opportunities and areas of growth. Showcase your value proposition and strategic initiatives, backed by detailed plans for resource allocation, risk management, and implementation timelines. The template also includes sections for performance metrics, communication strategies, and team roles and responsibilities, ensuring every detail is covered. With its sleek and professional design, this template is fully editable and compatible with PowerPoint, Google Slides, and Keynote, making it an ideal choice for businesses, consultants, or agencies aiming to communicate their digital strategies with precision and impact.


5 diapositivas
5-Level Smile Rating Presentation
Give your audience a fun, visual way to understand sentiment with this colorful rating slide. Perfect for feedback summaries, project reviews, or performance insights, it displays five clear emotion levels in a simple, engaging format. Easy to customize and fully compatible with PowerPoint, Keynote, and Google Slides.


4 diapositivas
Company Vision and Long-Term Goals Presentation
Present your company’s future with clarity and impact using this Company Vision and Long-Term Goals slide. Featuring a bar chart-style graphic with ascending growth stages, this template allows you to showcase strategic milestones, business values, or development phases. Each bar is paired with icons and editable text to highlight specific goals, making it ideal for leadership meetings, strategic planning, or investor pitches. Clean, modern, and customizable in PowerPoint, Keynote, and Google Slides.


8 diapositivas
Governance and Compliance Framework
Streamline your compliance reporting with this triangle-based governance framework slide. Featuring three core pillars—Risk, Strategy, and Leadership—this layout visually connects your organizational roles, responsibilities, and regulatory measures. Each corner is paired with numbered titles and editable icons, perfect for illustrating audits, policies, or internal controls. Fully editable in PowerPoint, Keynote, and Google Slides.


5 diapositivas
Business Executive Summary Report Presentation
Simplify your executive reporting with this 'Business Executive Summary Report' template, designed to present critical insights at a glance. This template streamlines complex data into digestible parts, ensuring clarity and impact in every slide. Perfect for executives and managers using PowerPoint, Keynote, and Google Slides.


24 diapositivas
Veritas UX Research Report Presentation
This UX research report template is designed for clarity and modern style, using a sleek color palette and structured layouts to showcase insights. It includes sections for project overview, user research, personas, wireframes, prototyping, and user testing results. Compatible with PowerPoint, Keynote, and Google Slides, it’s ideal for presenting findings effectively.


21 diapositivas
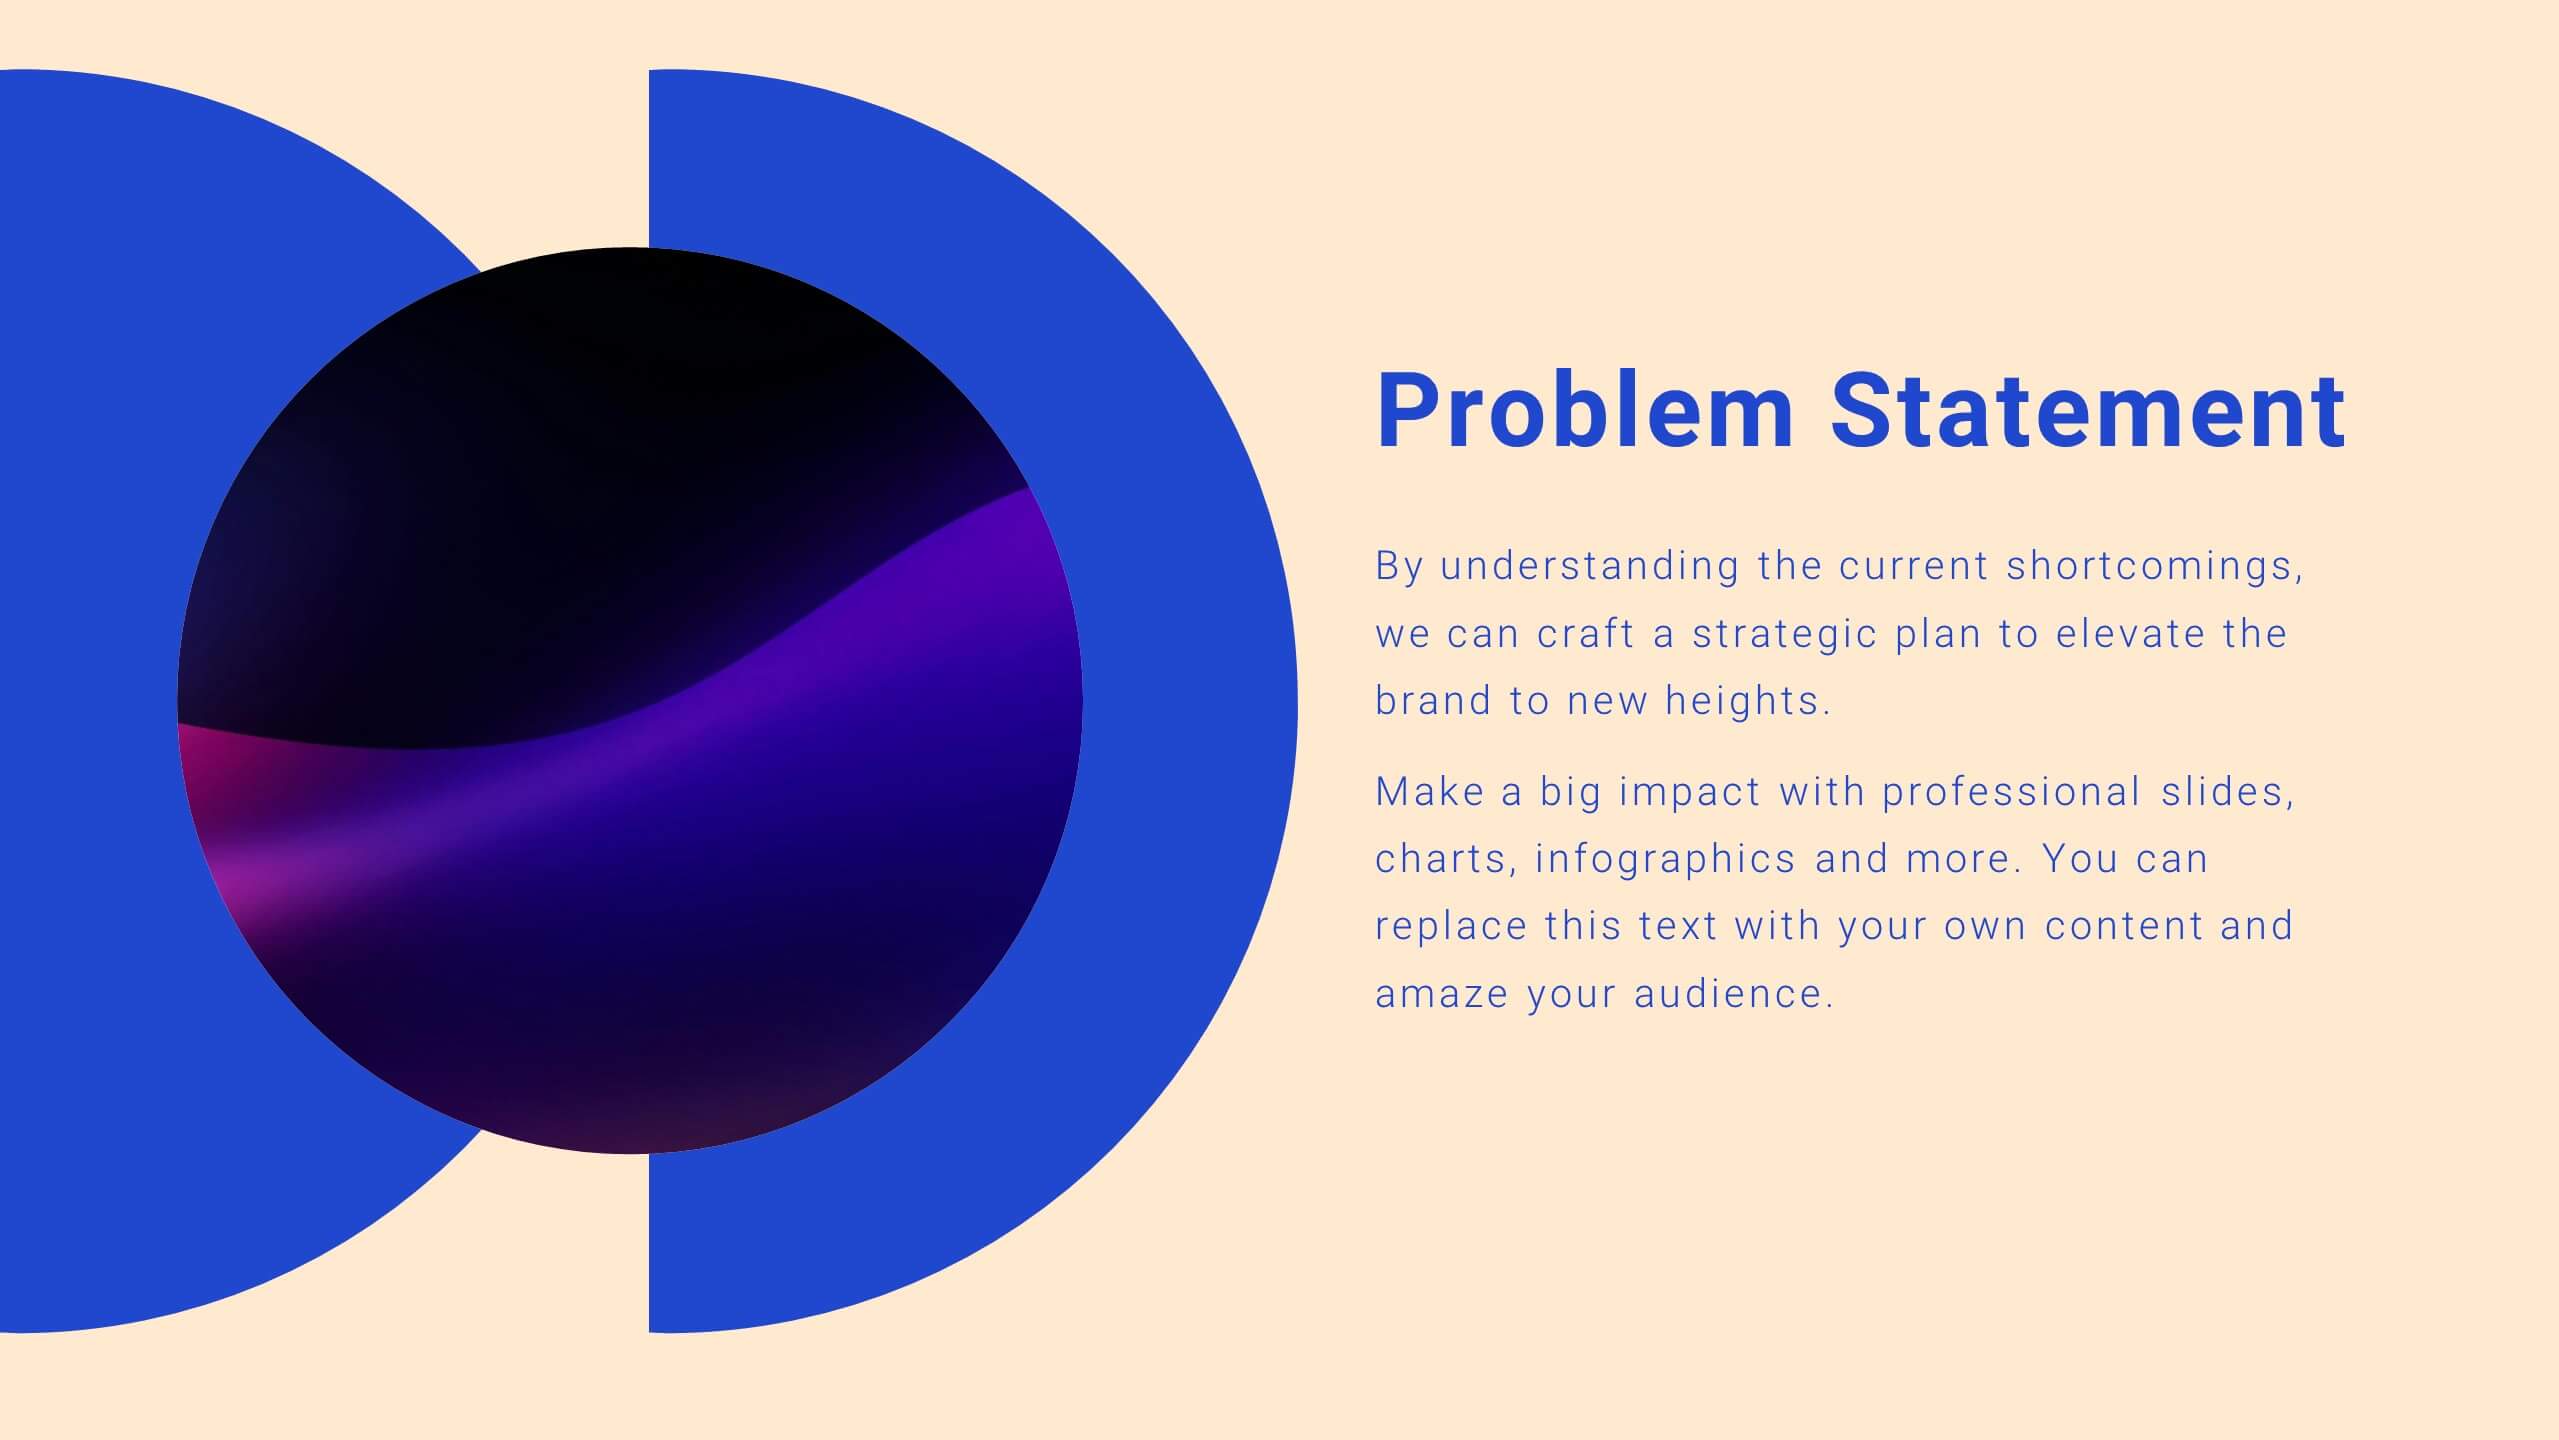
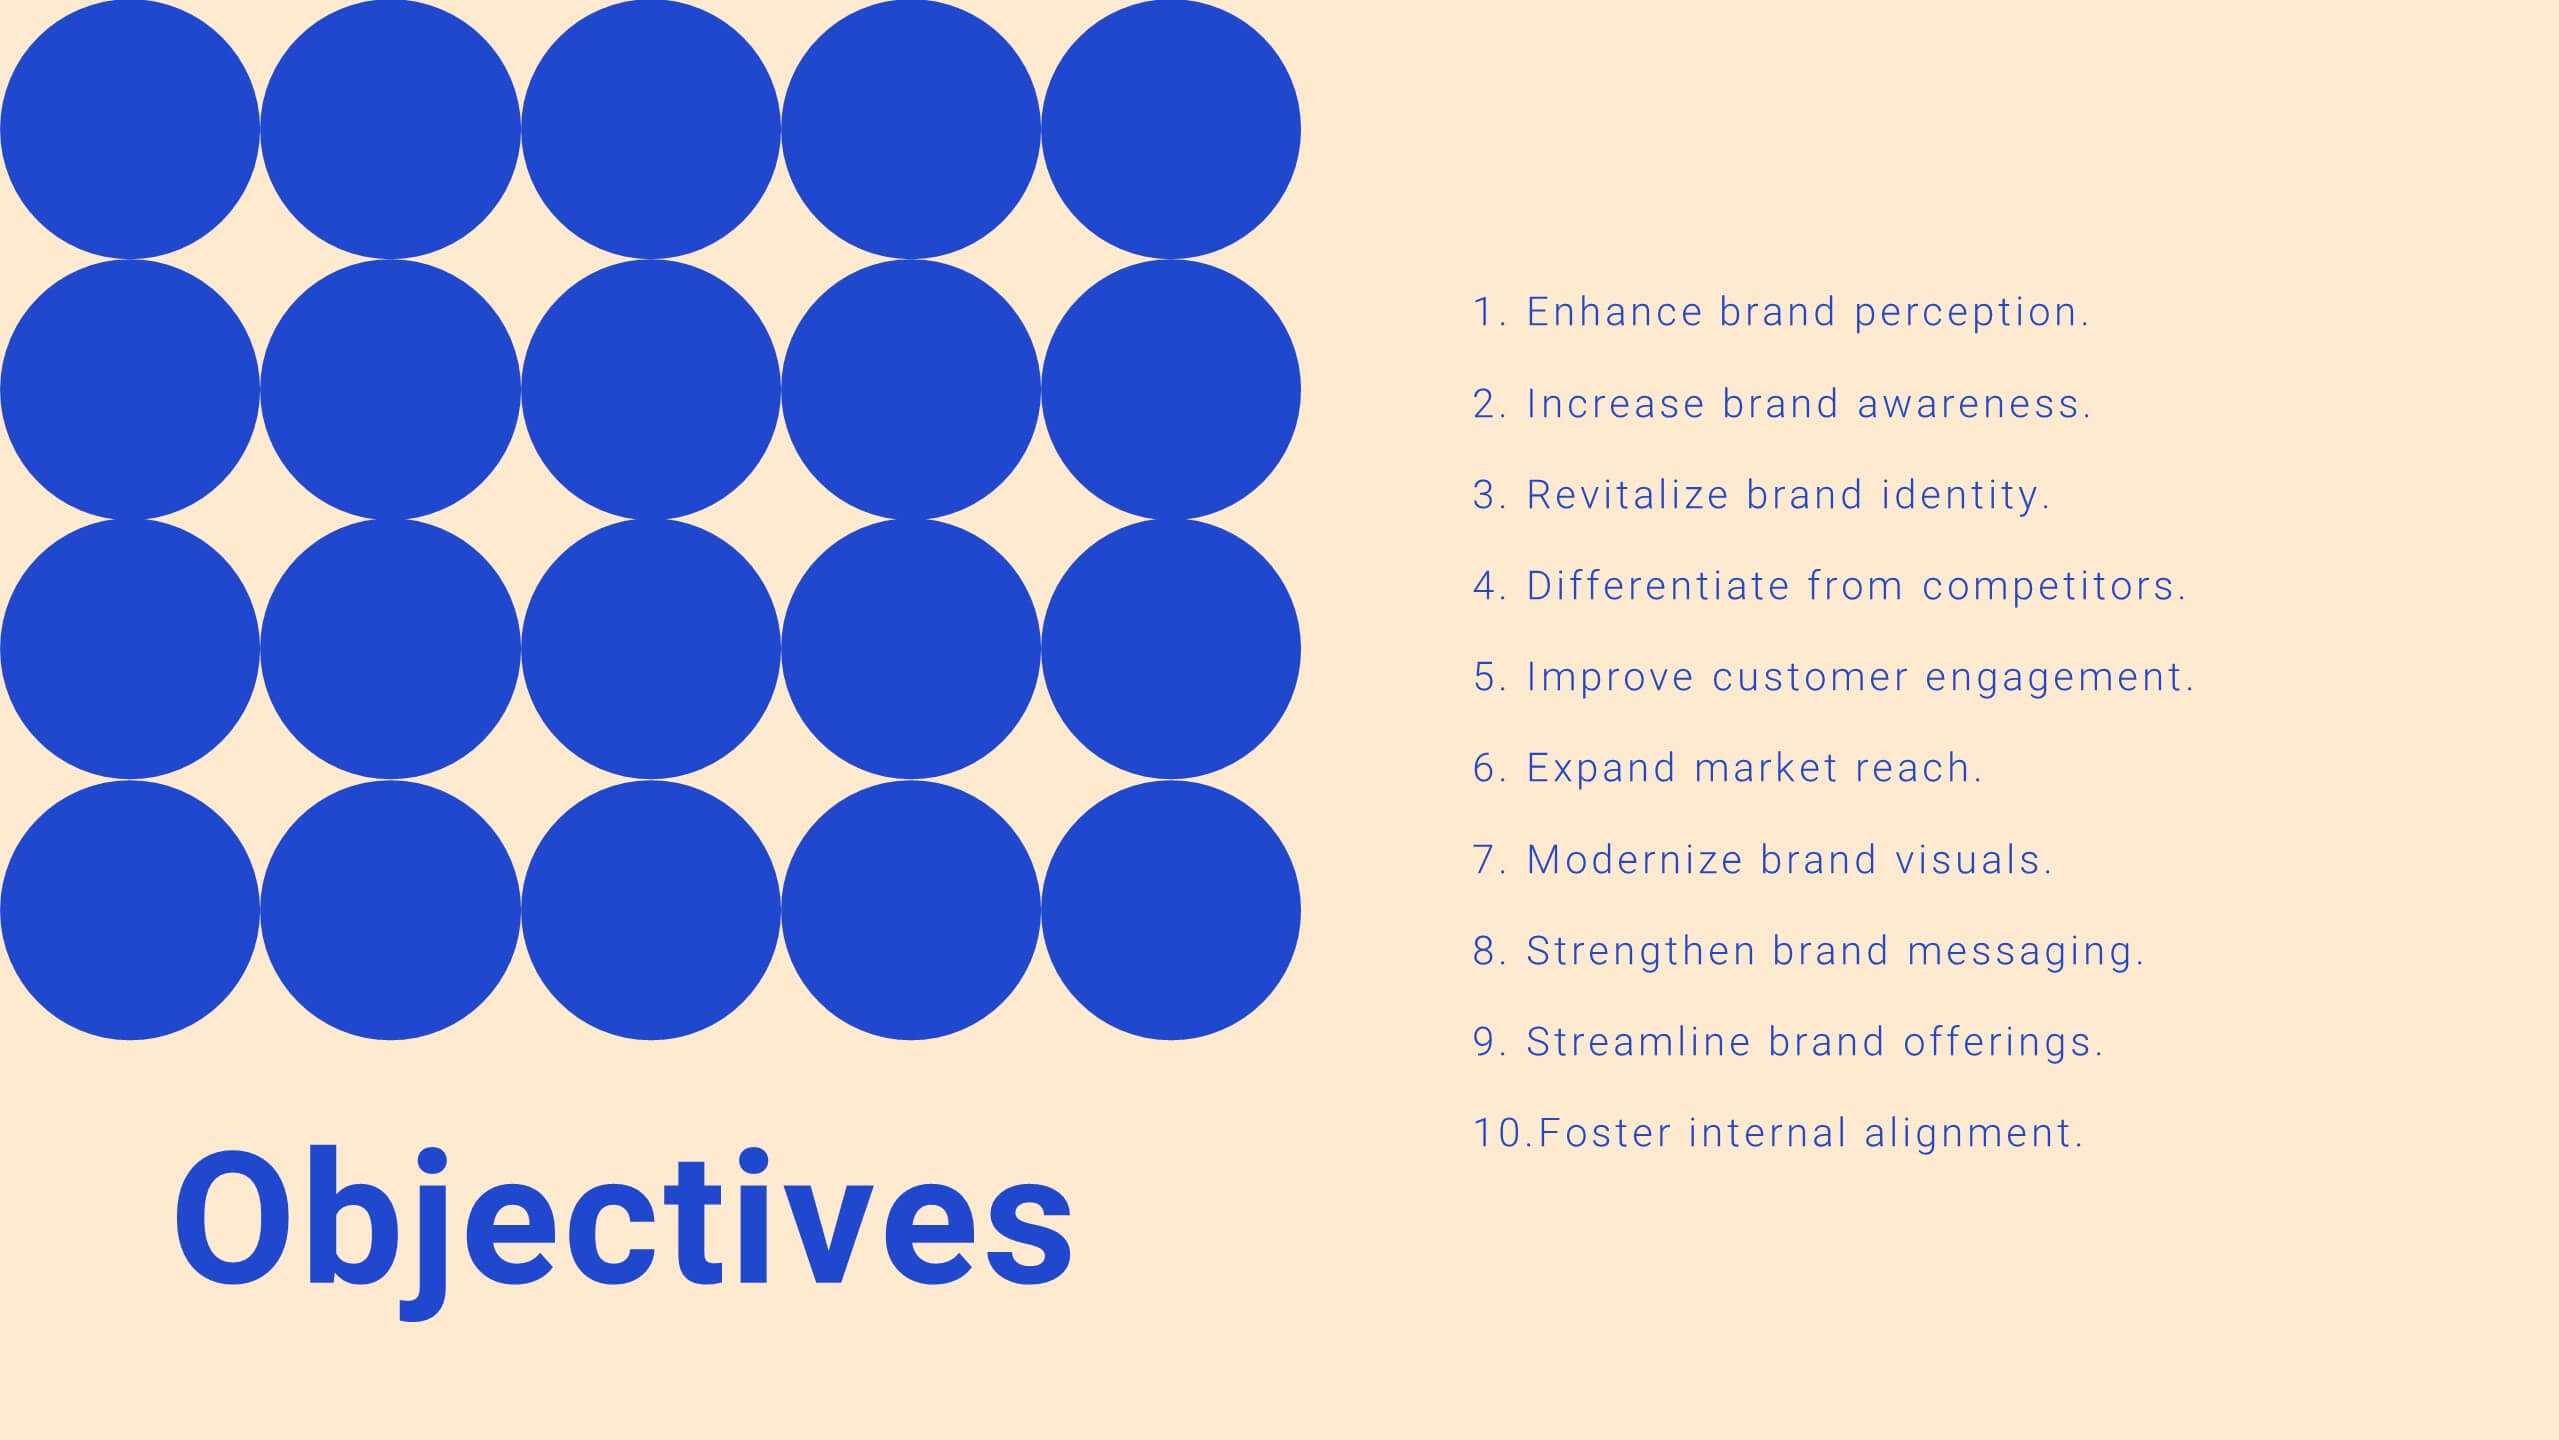
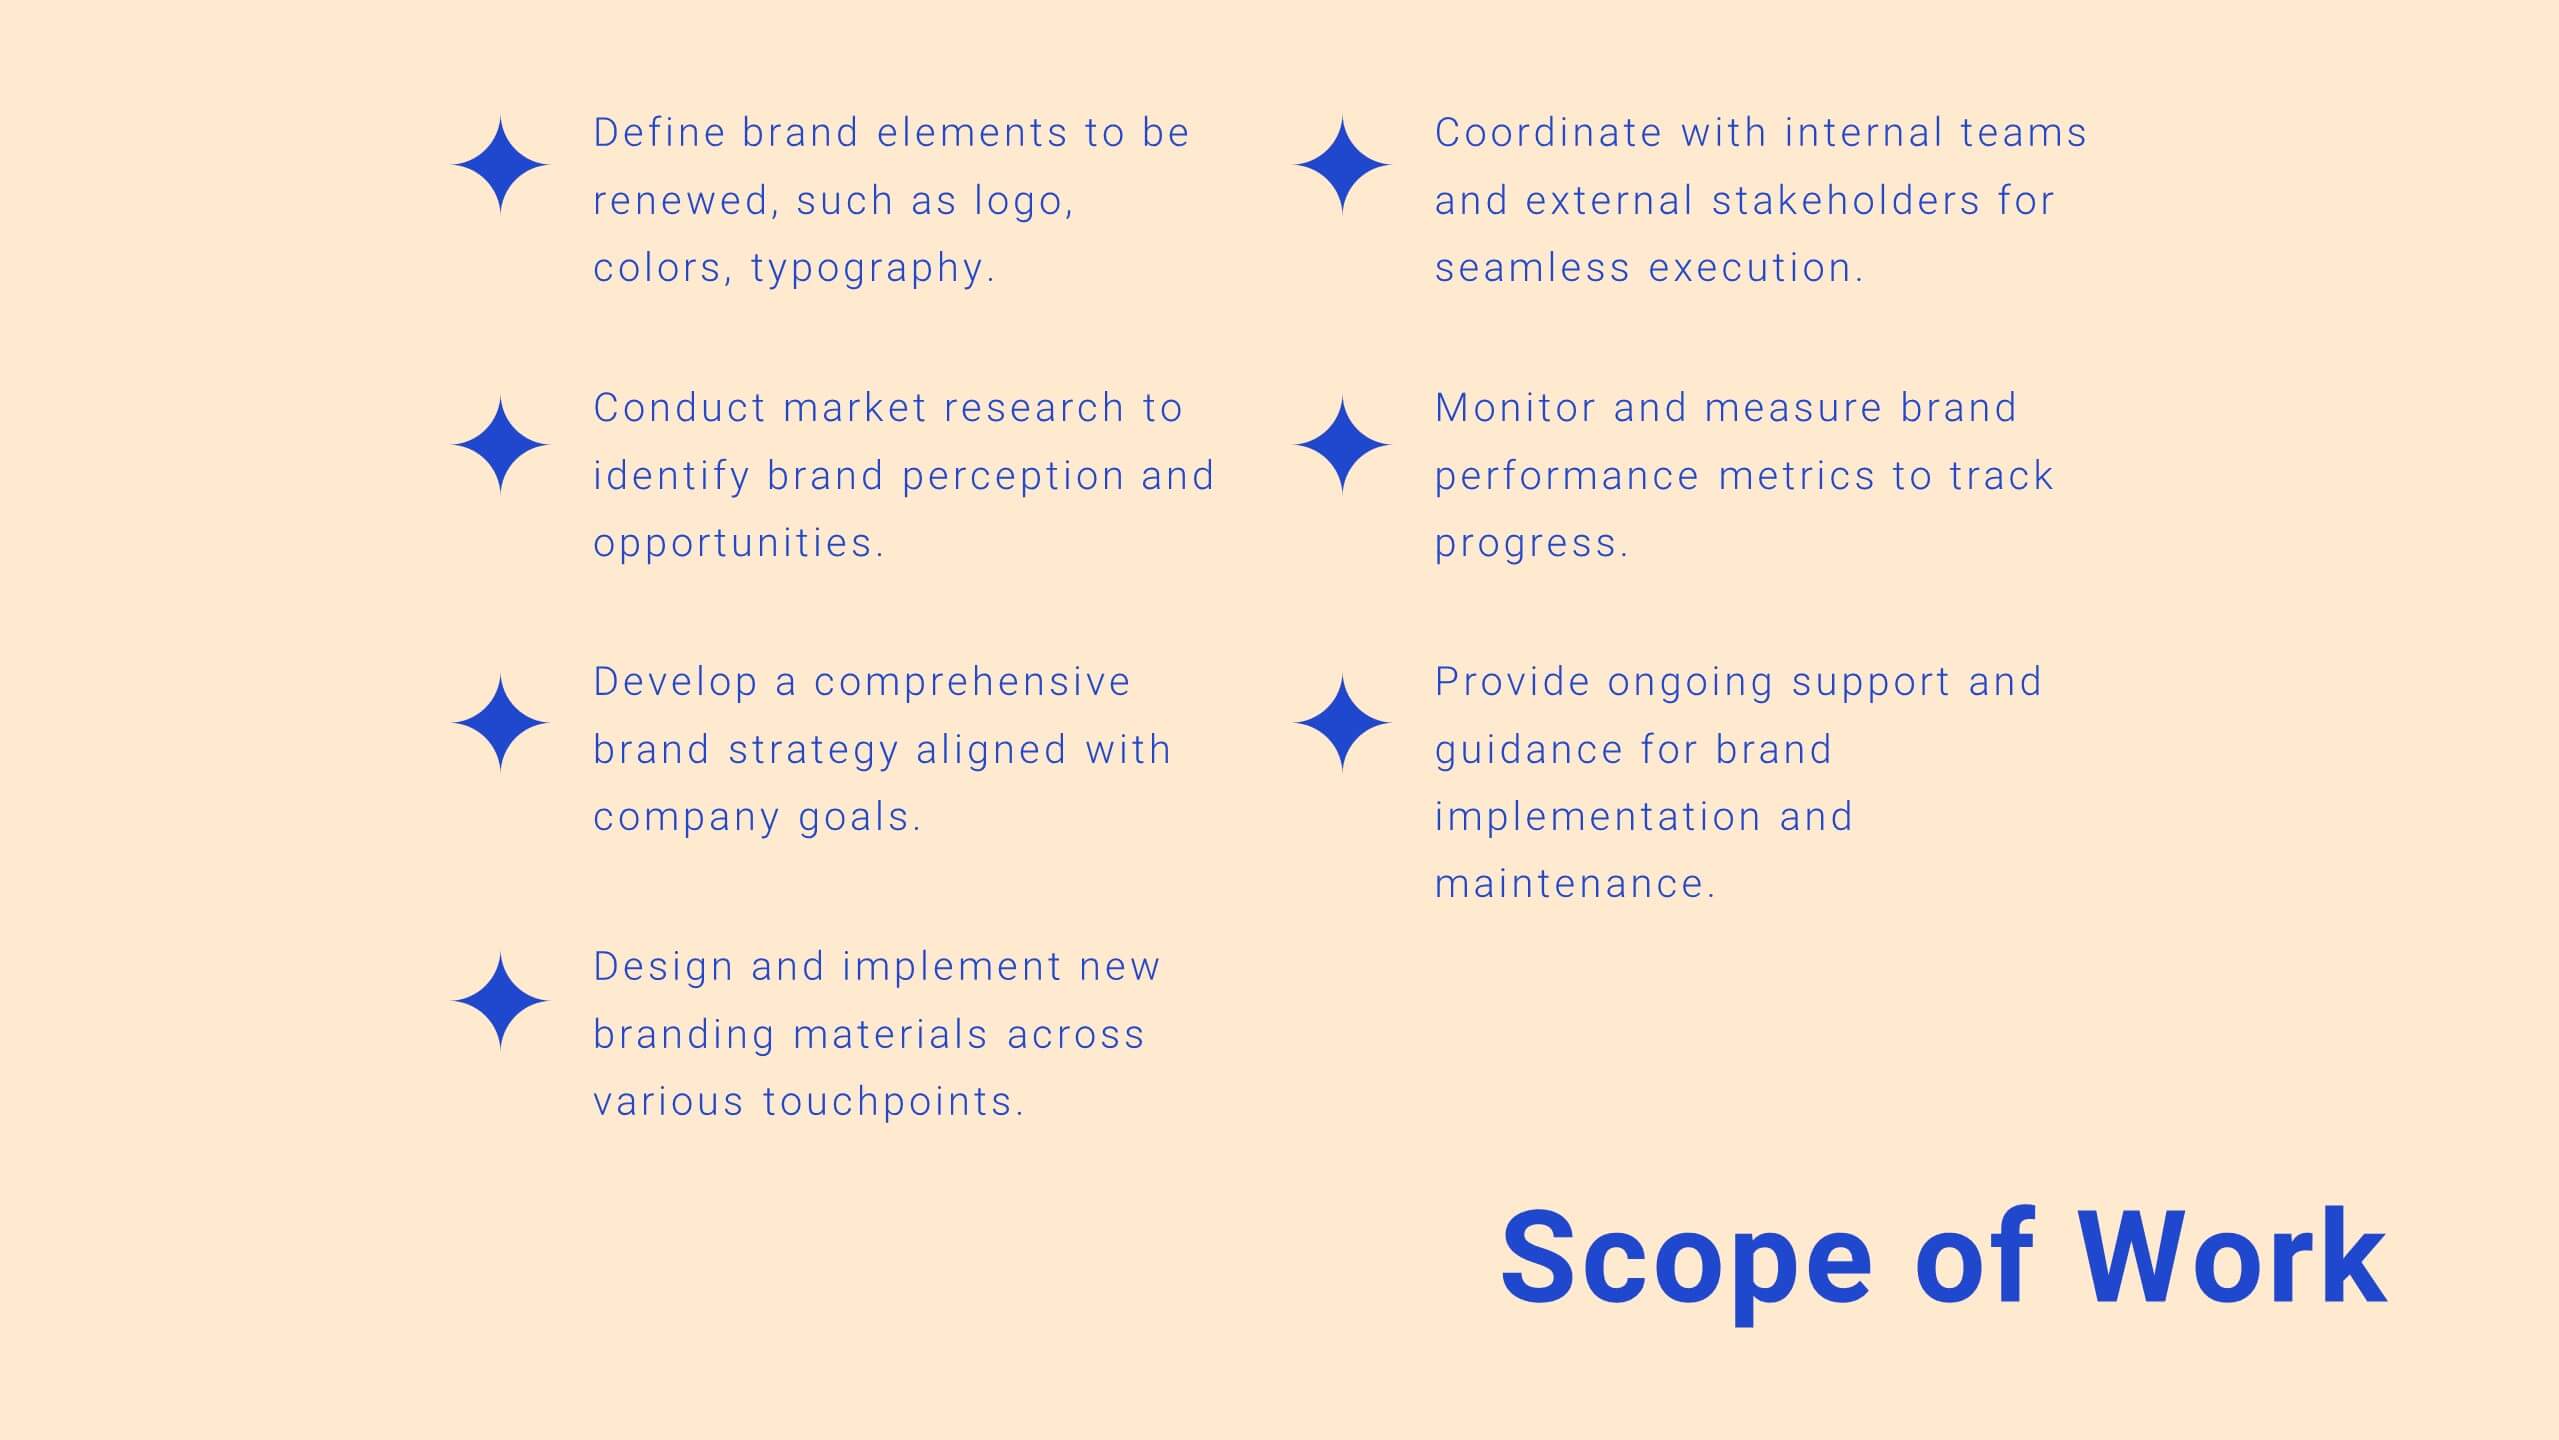
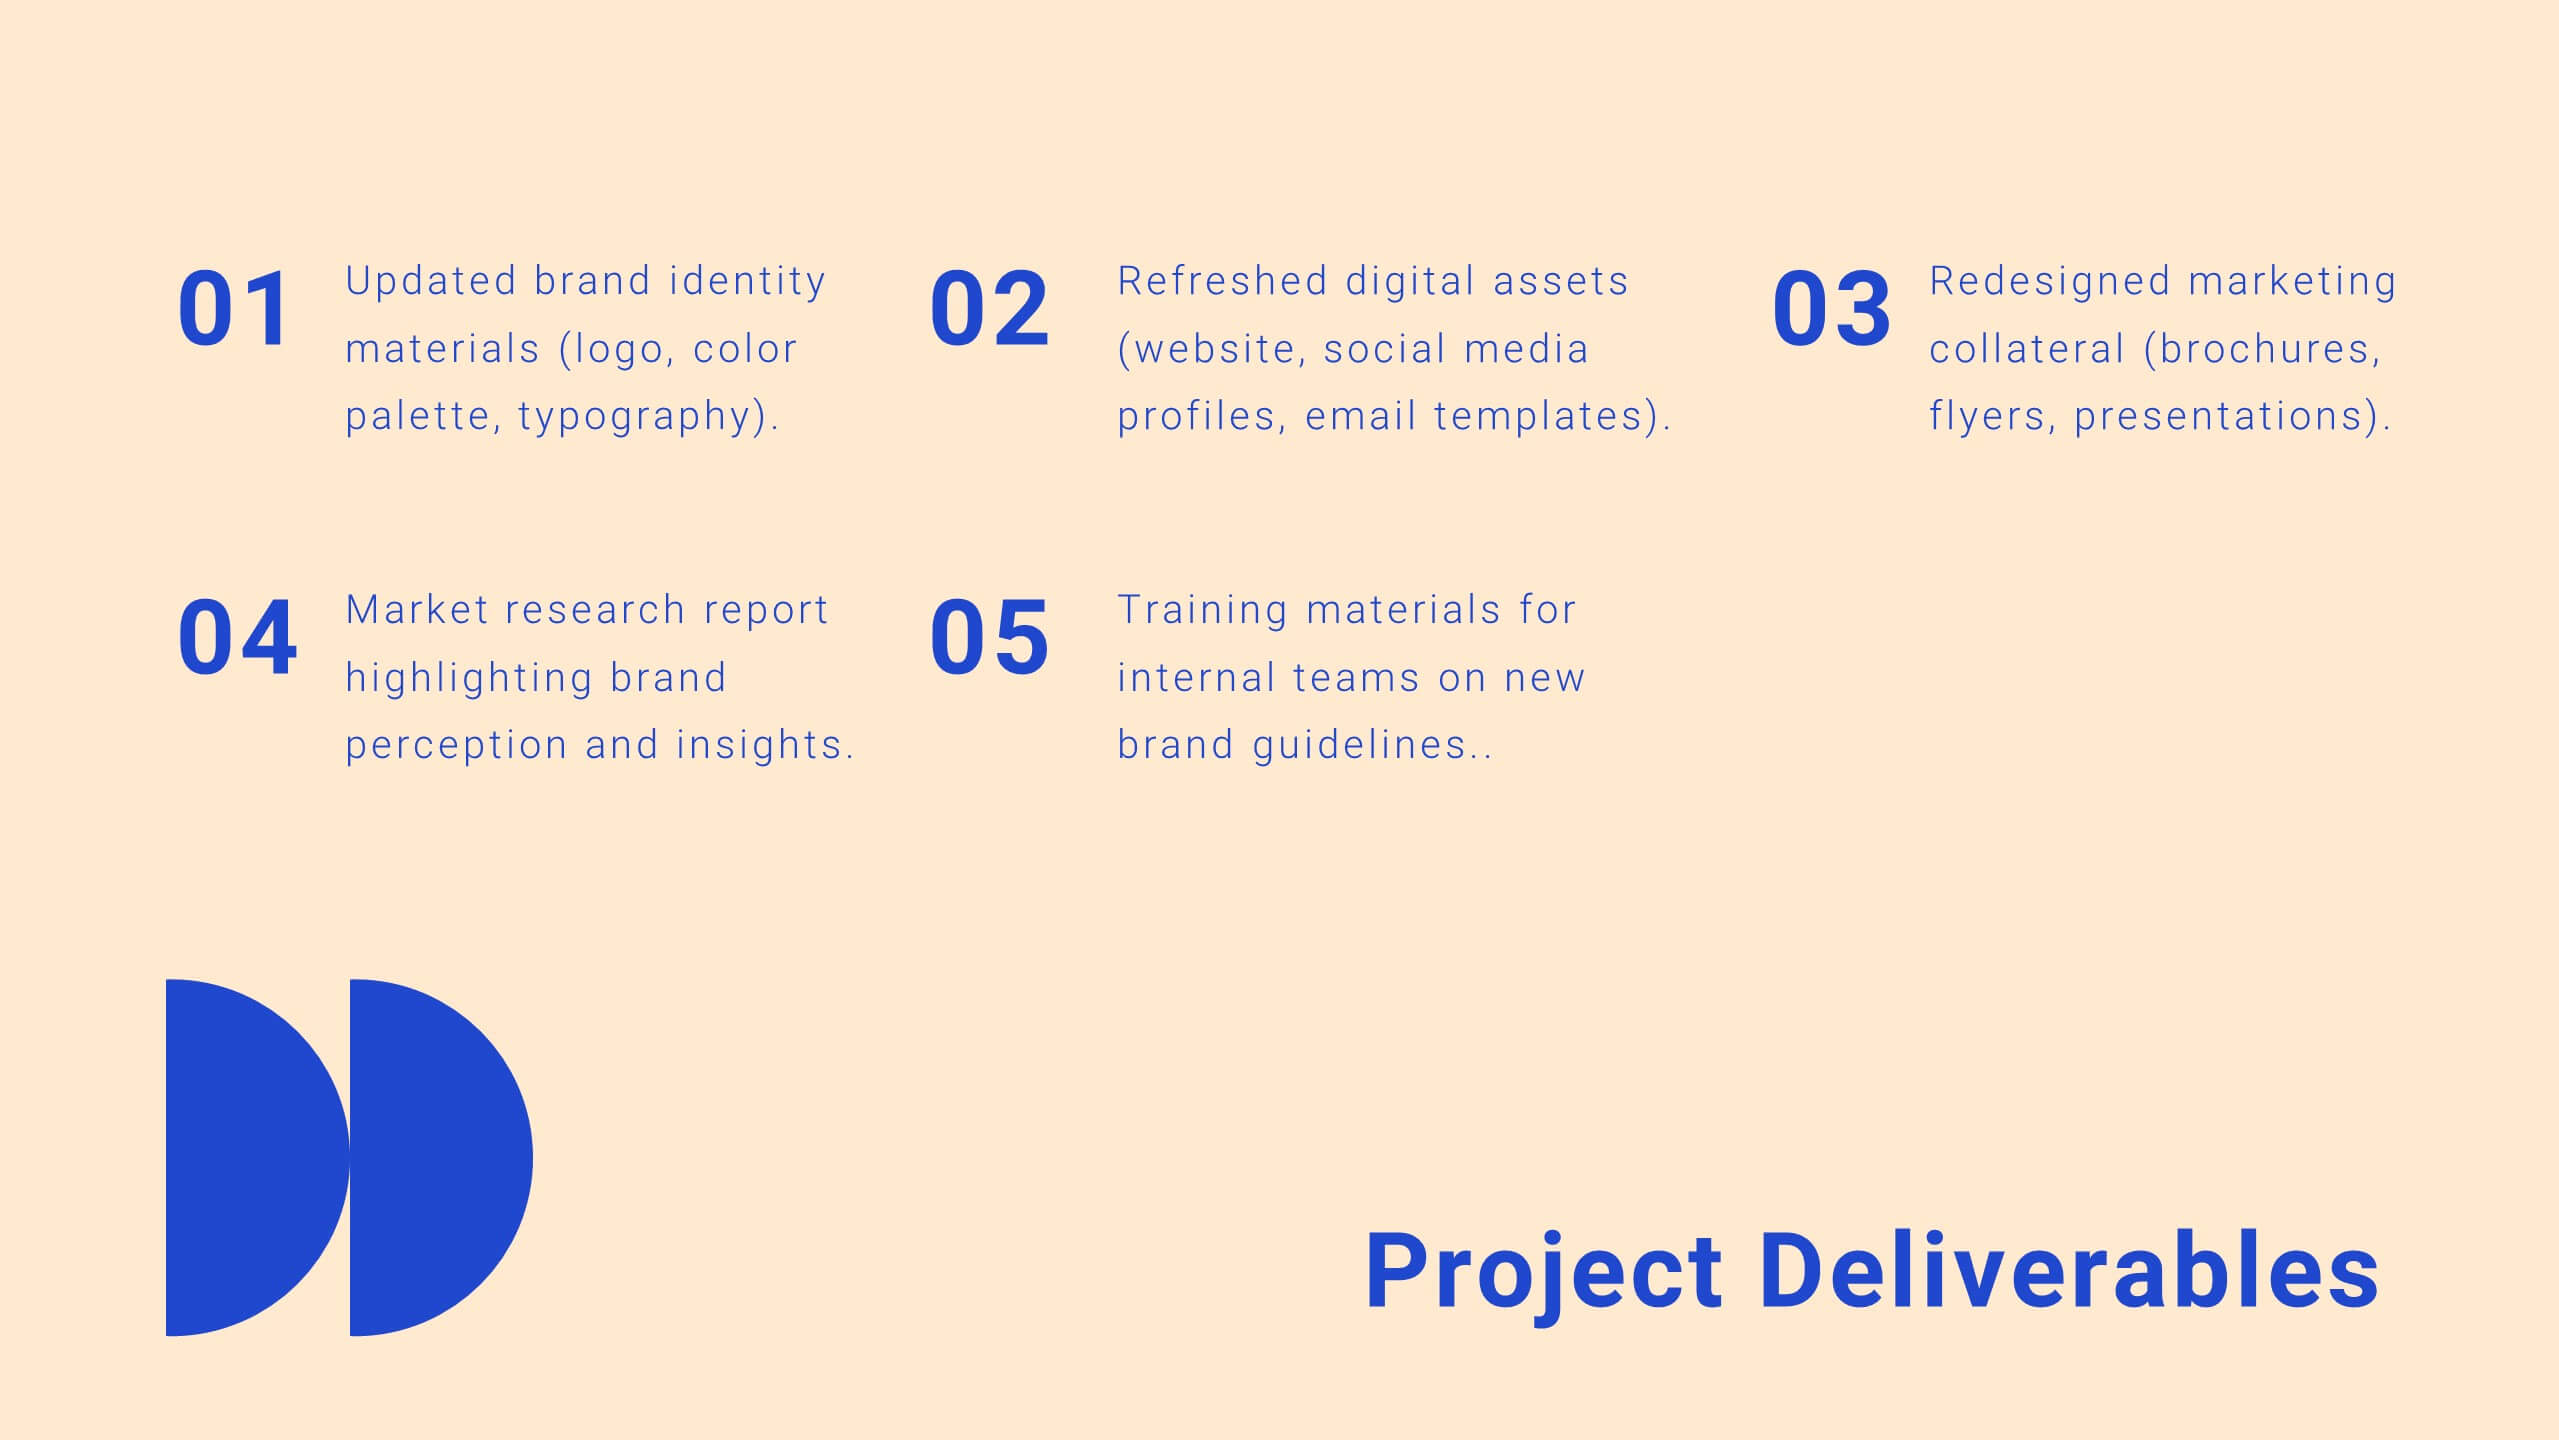
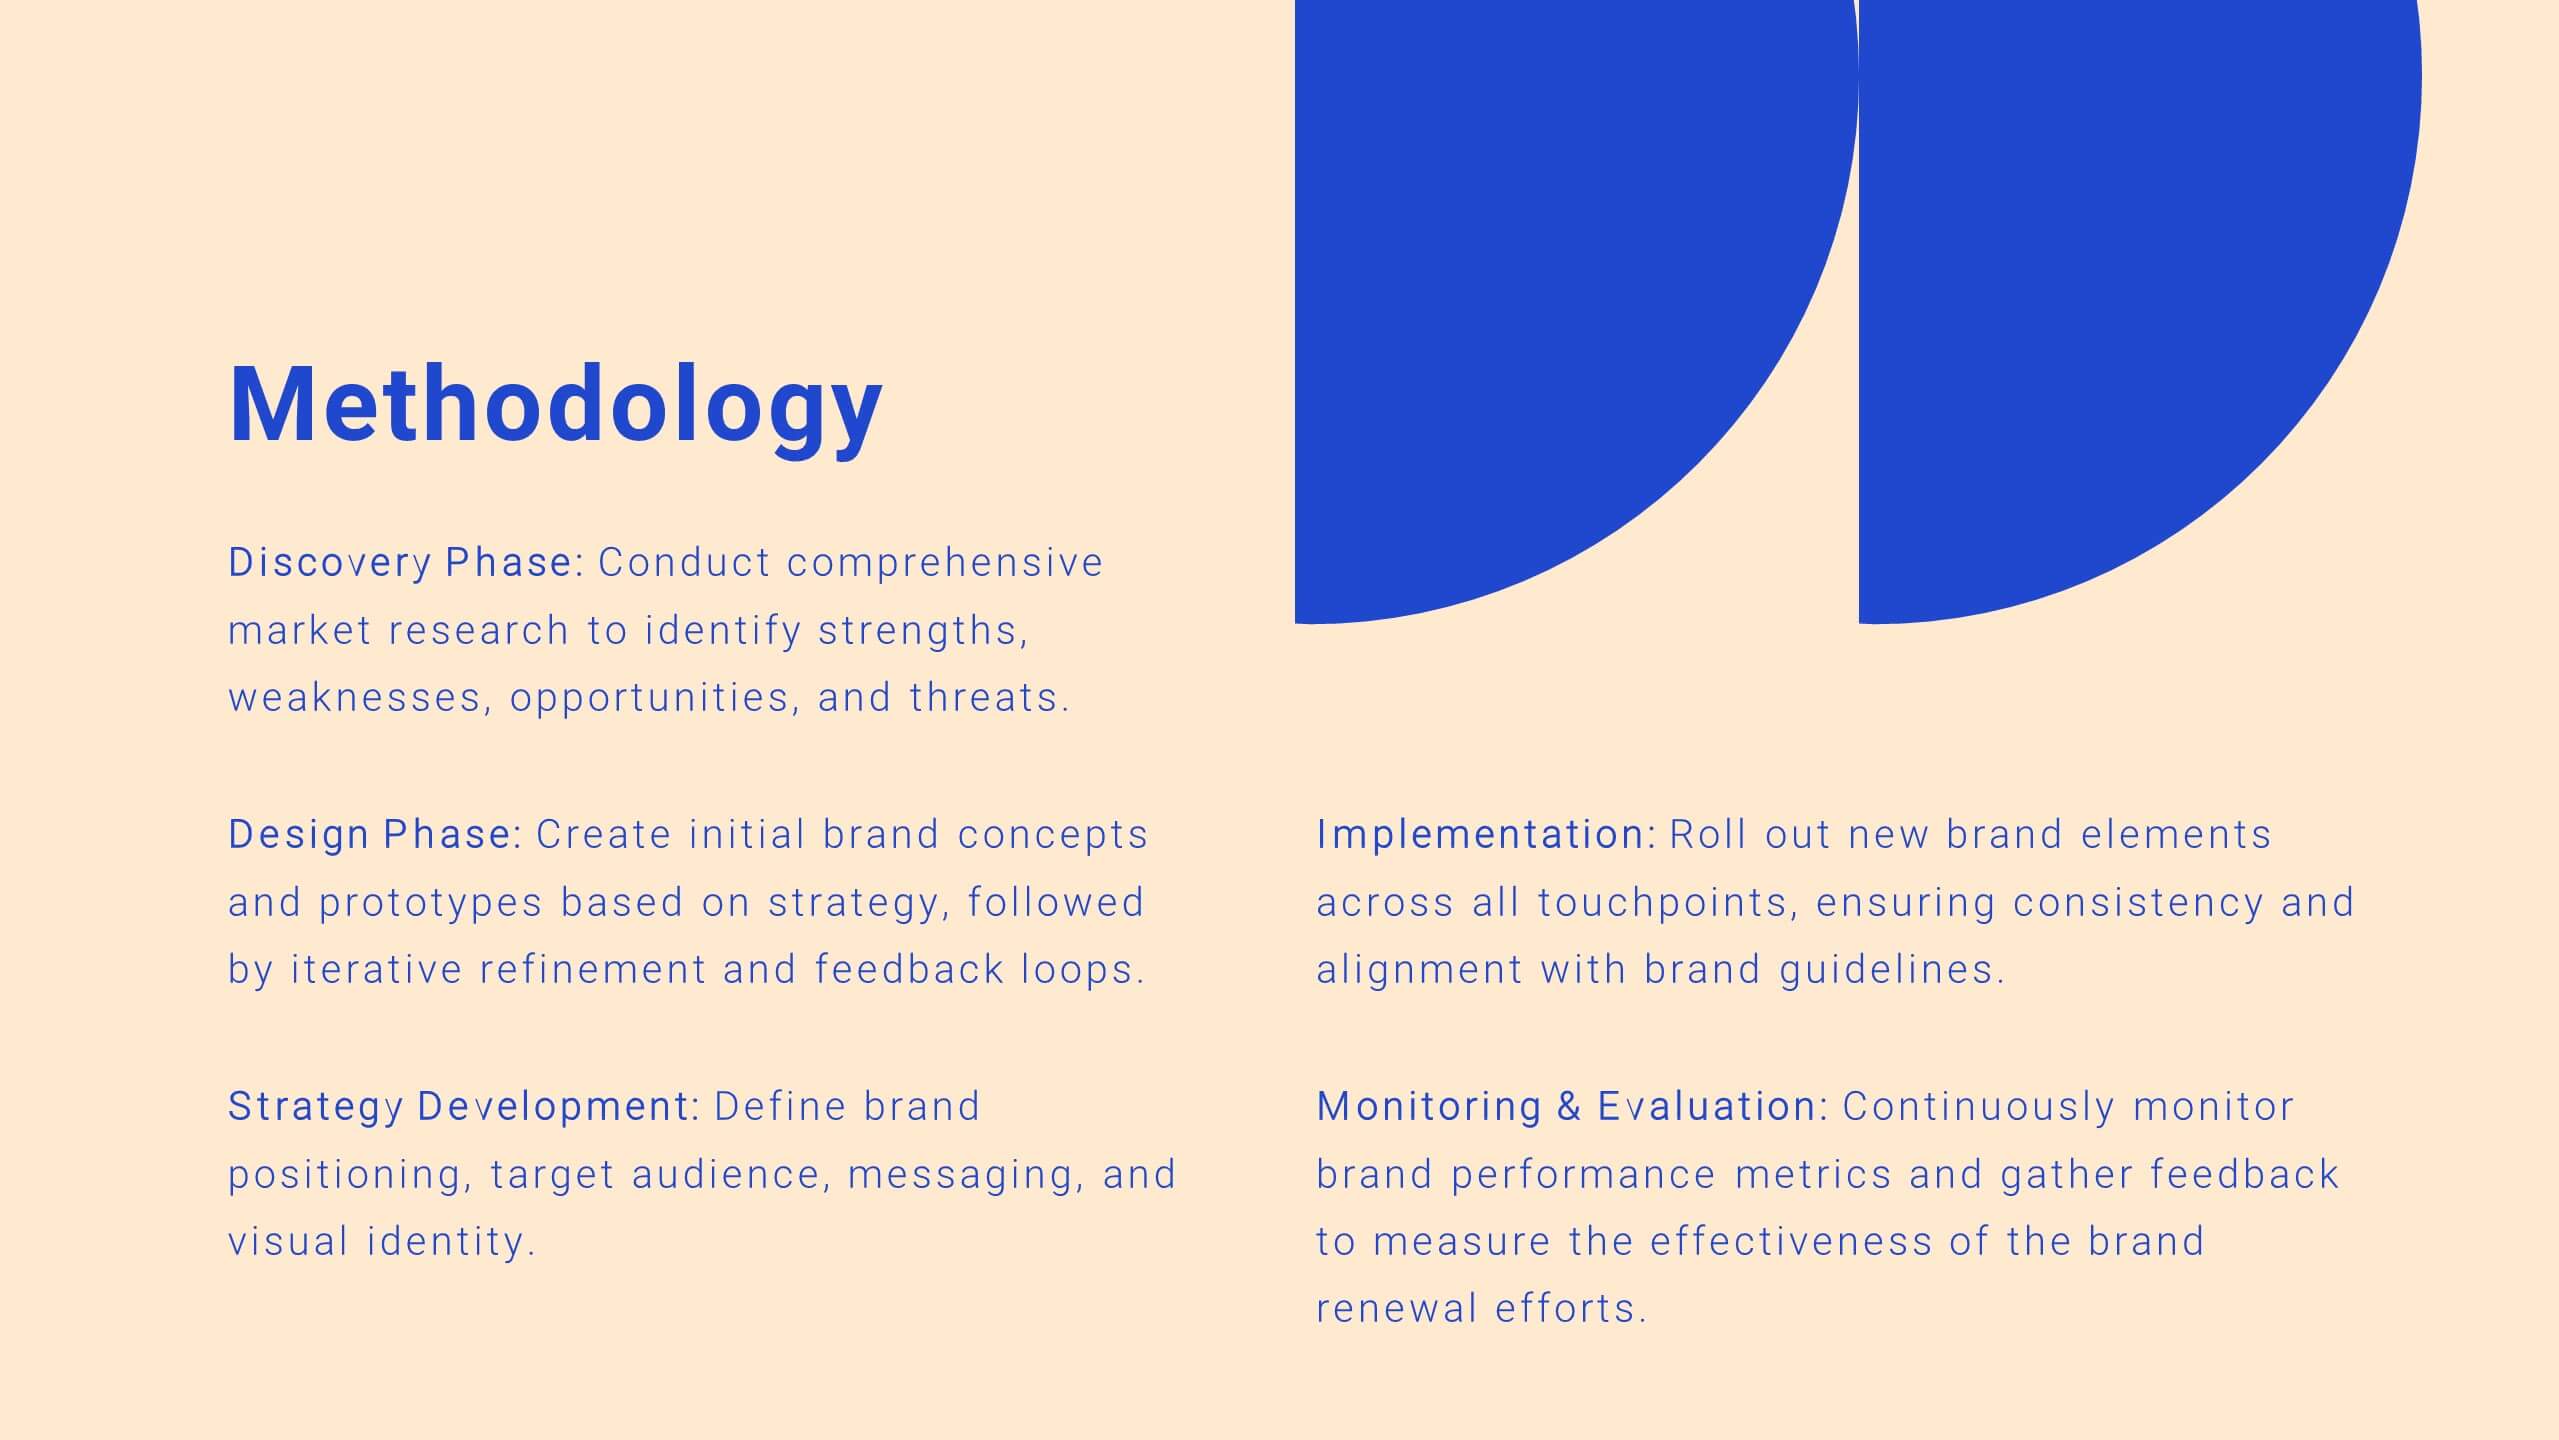
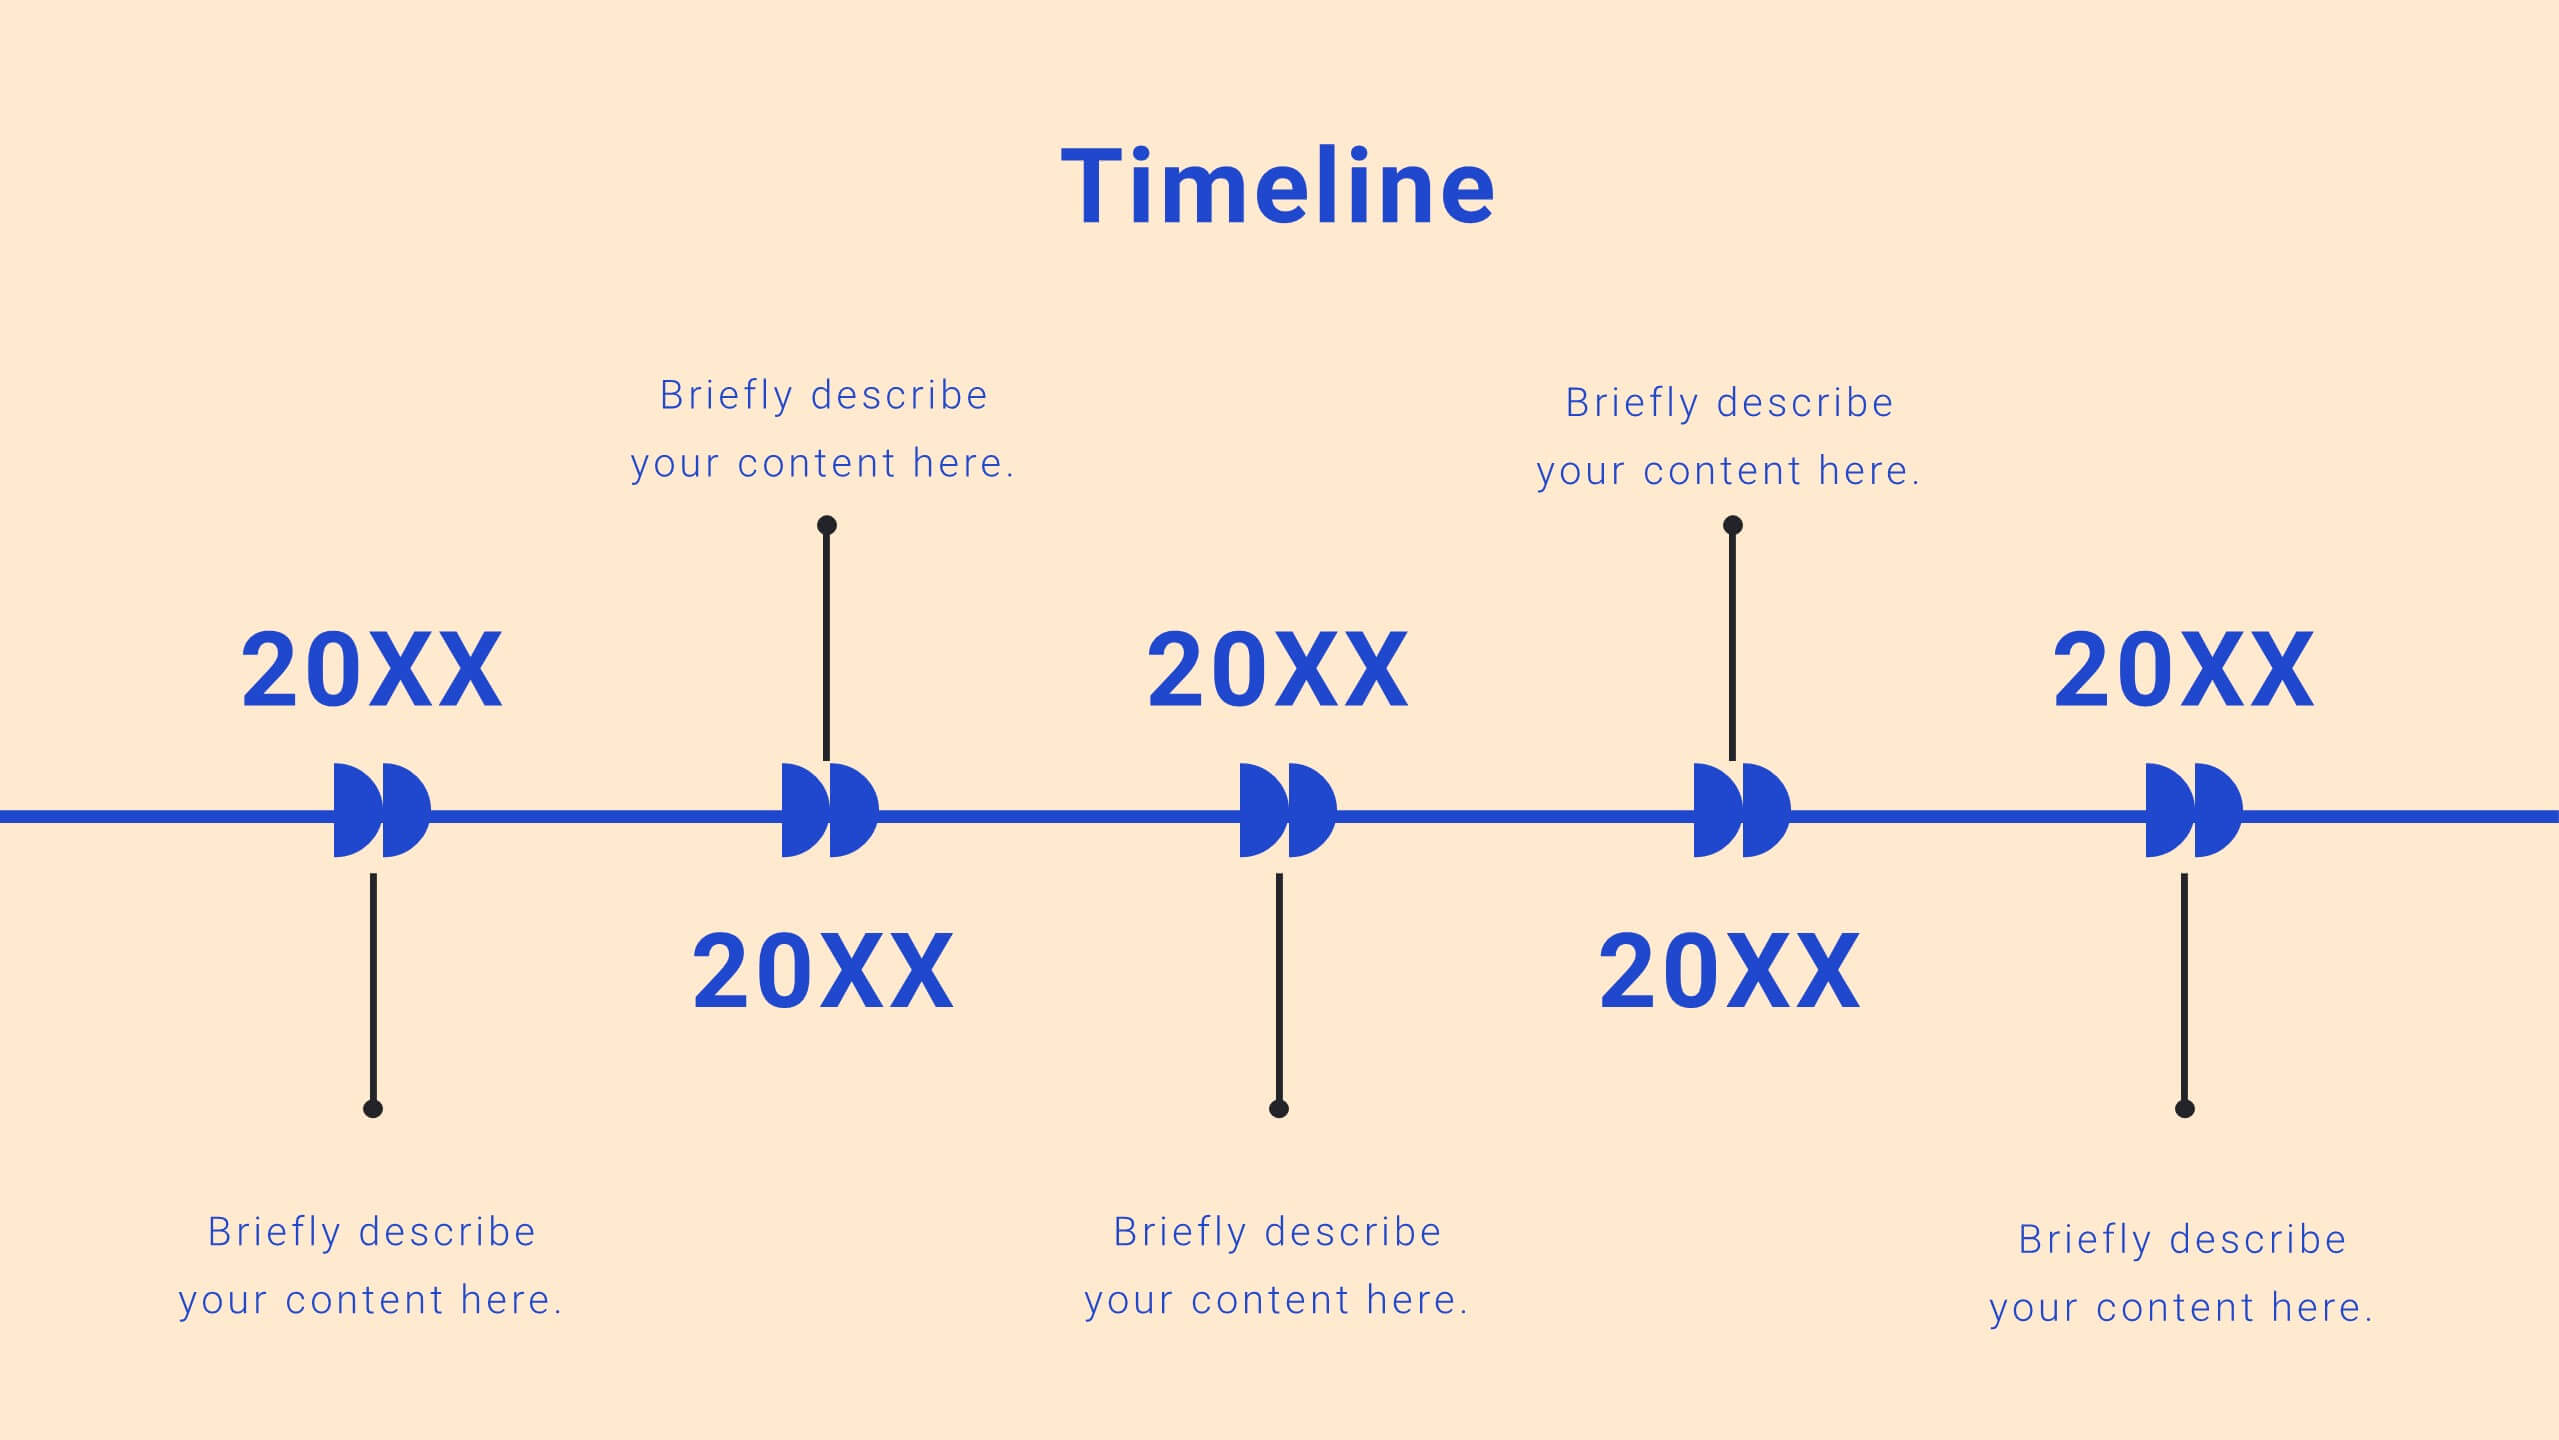
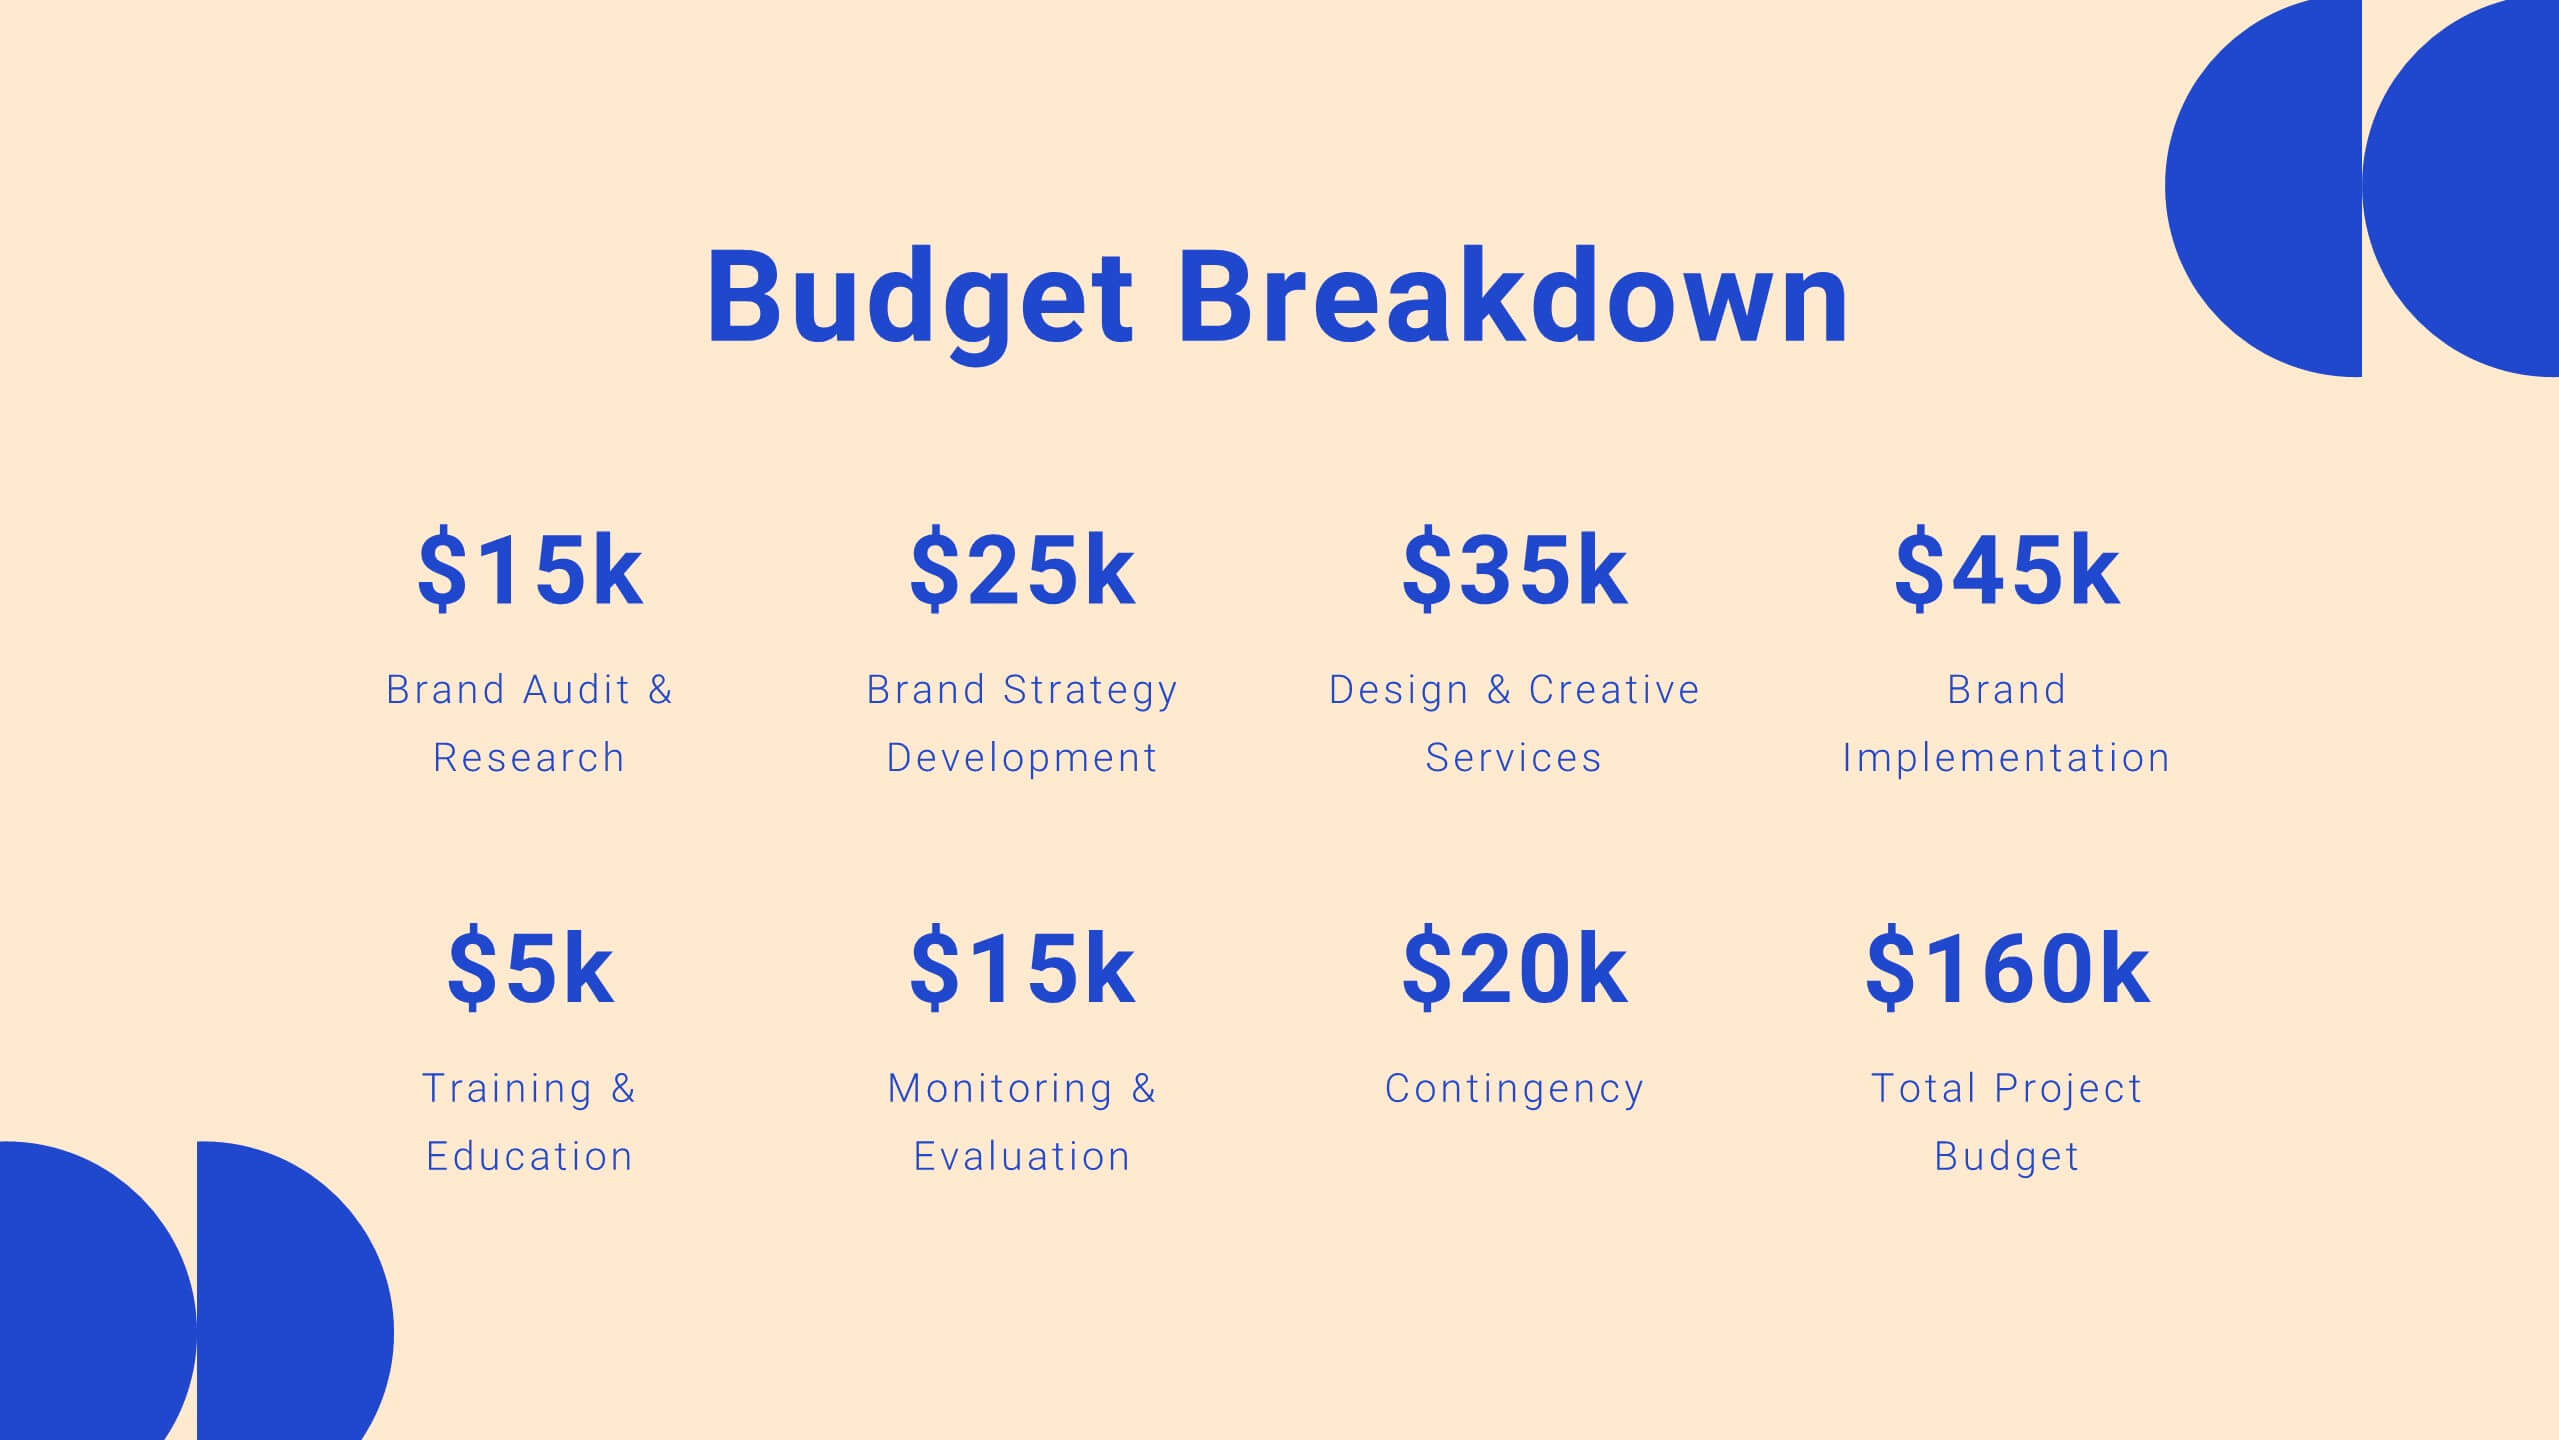
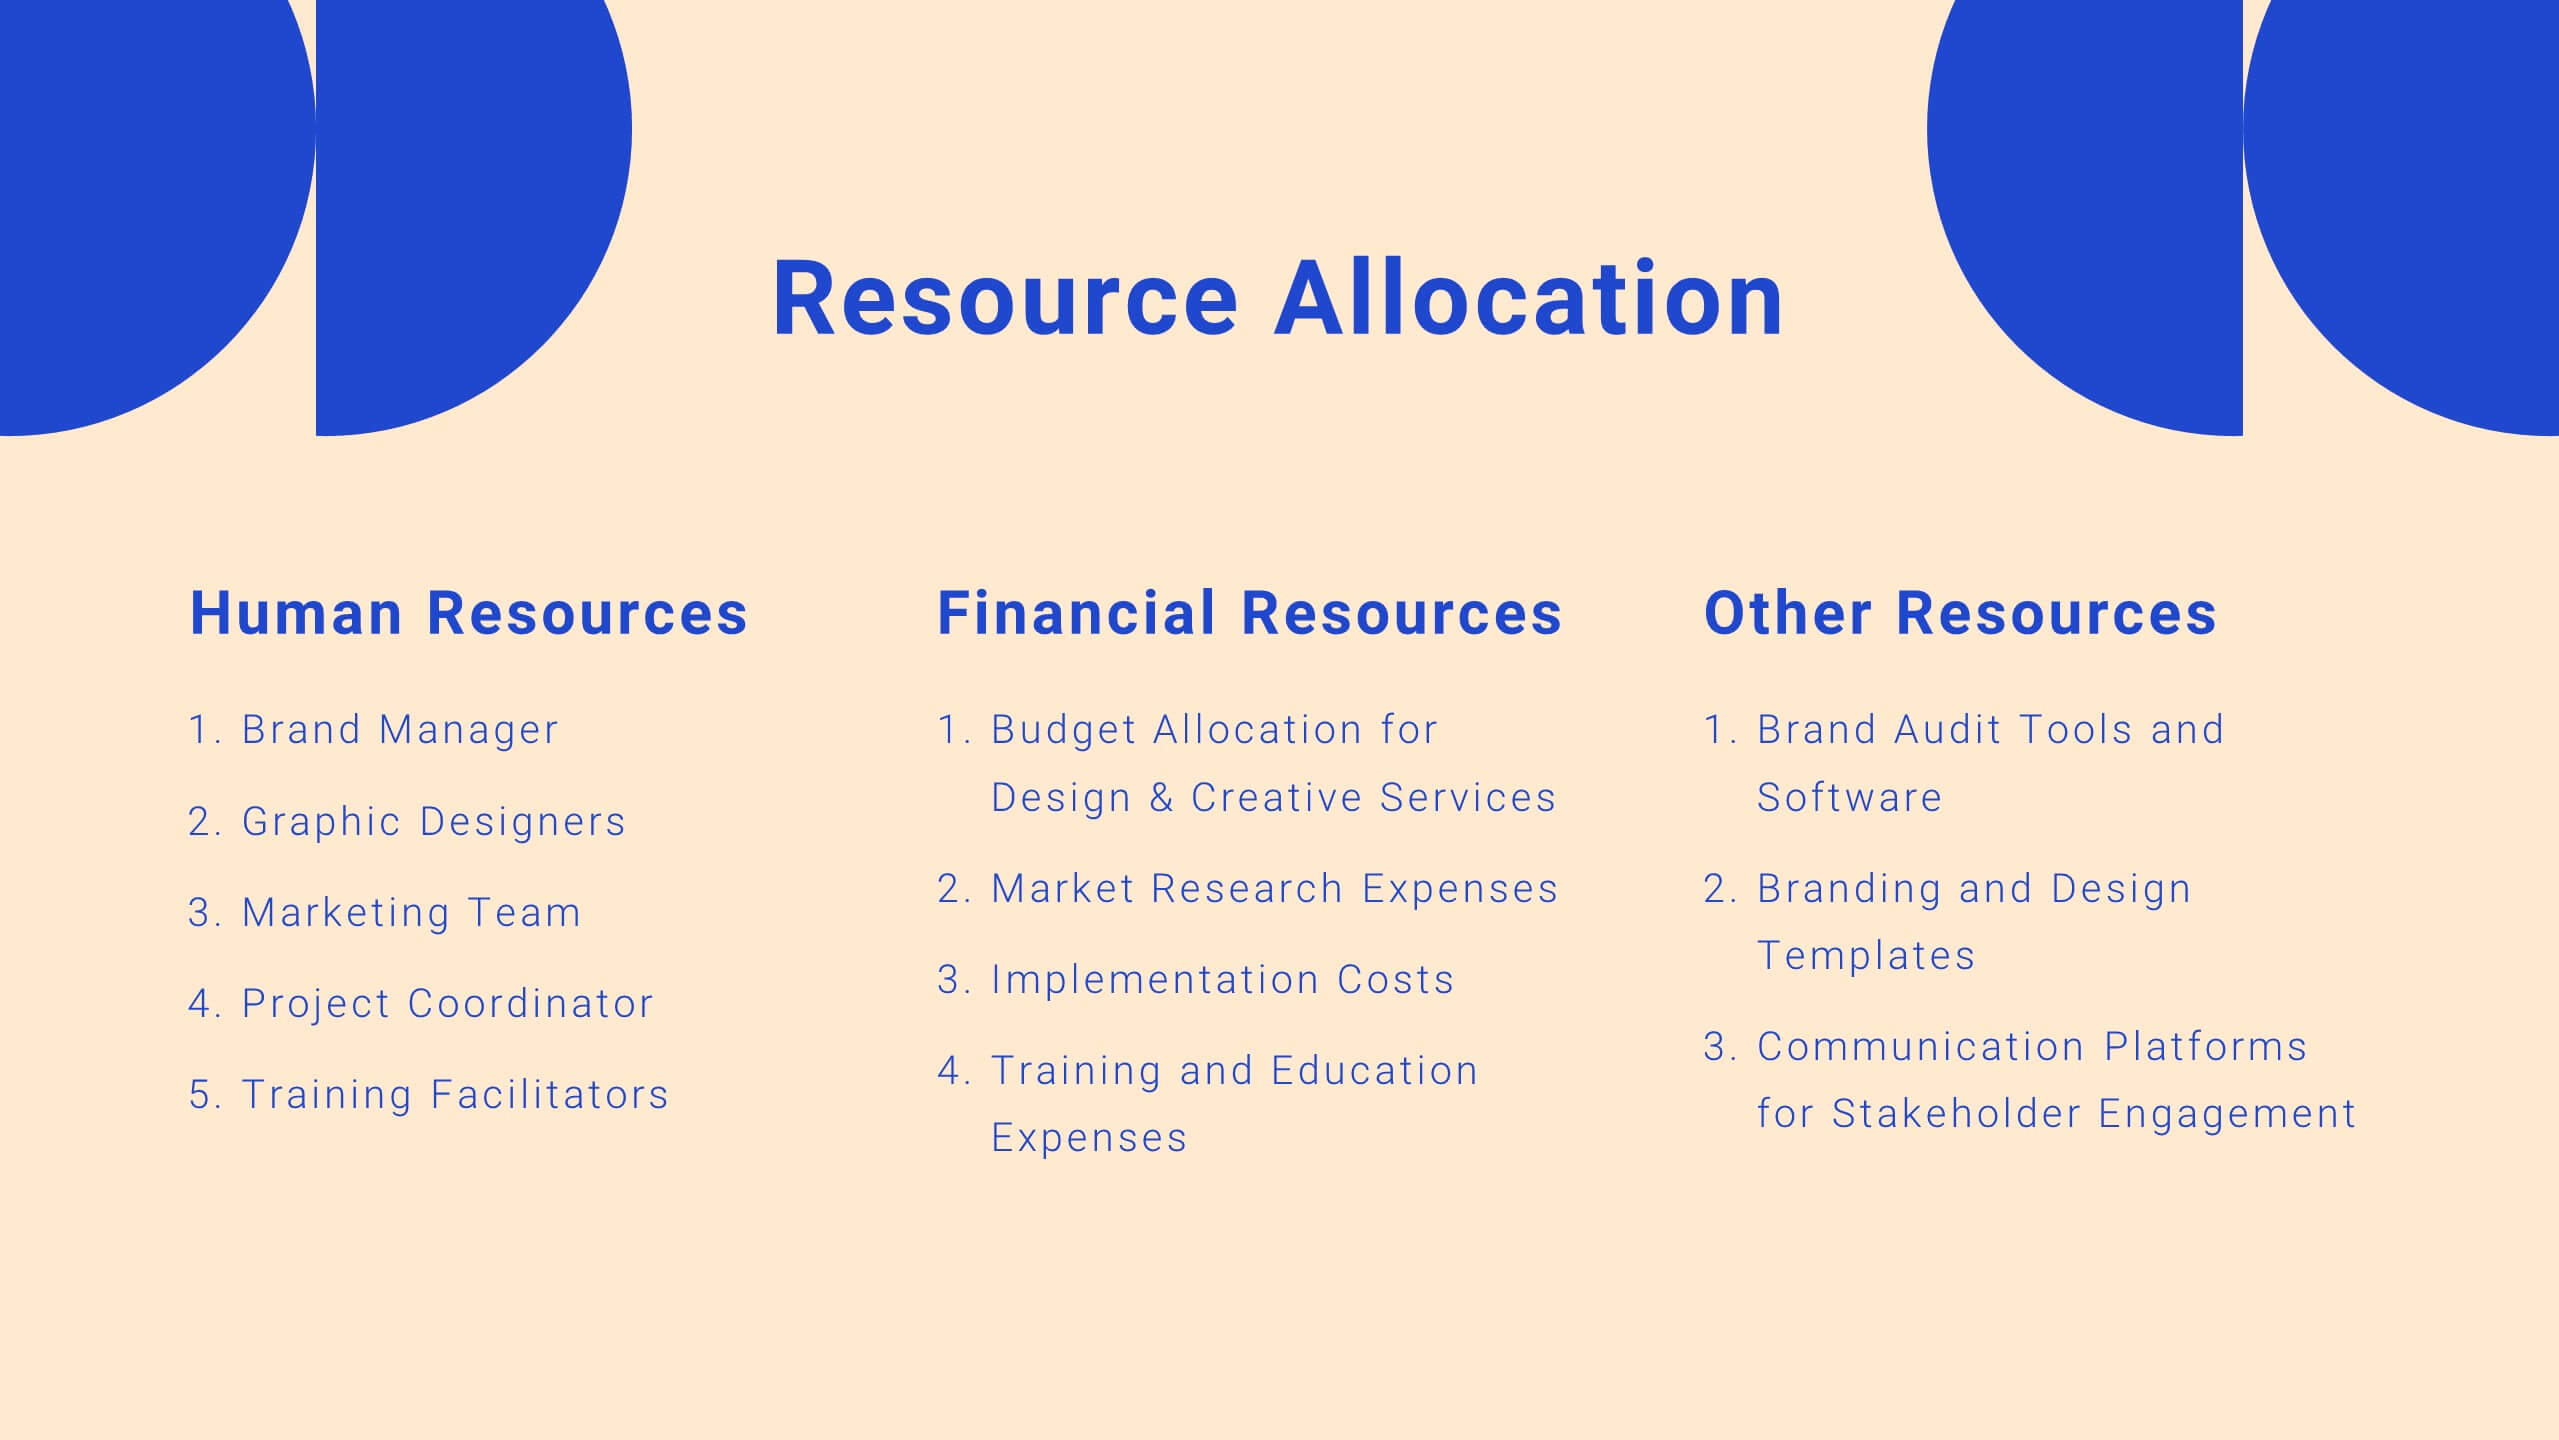
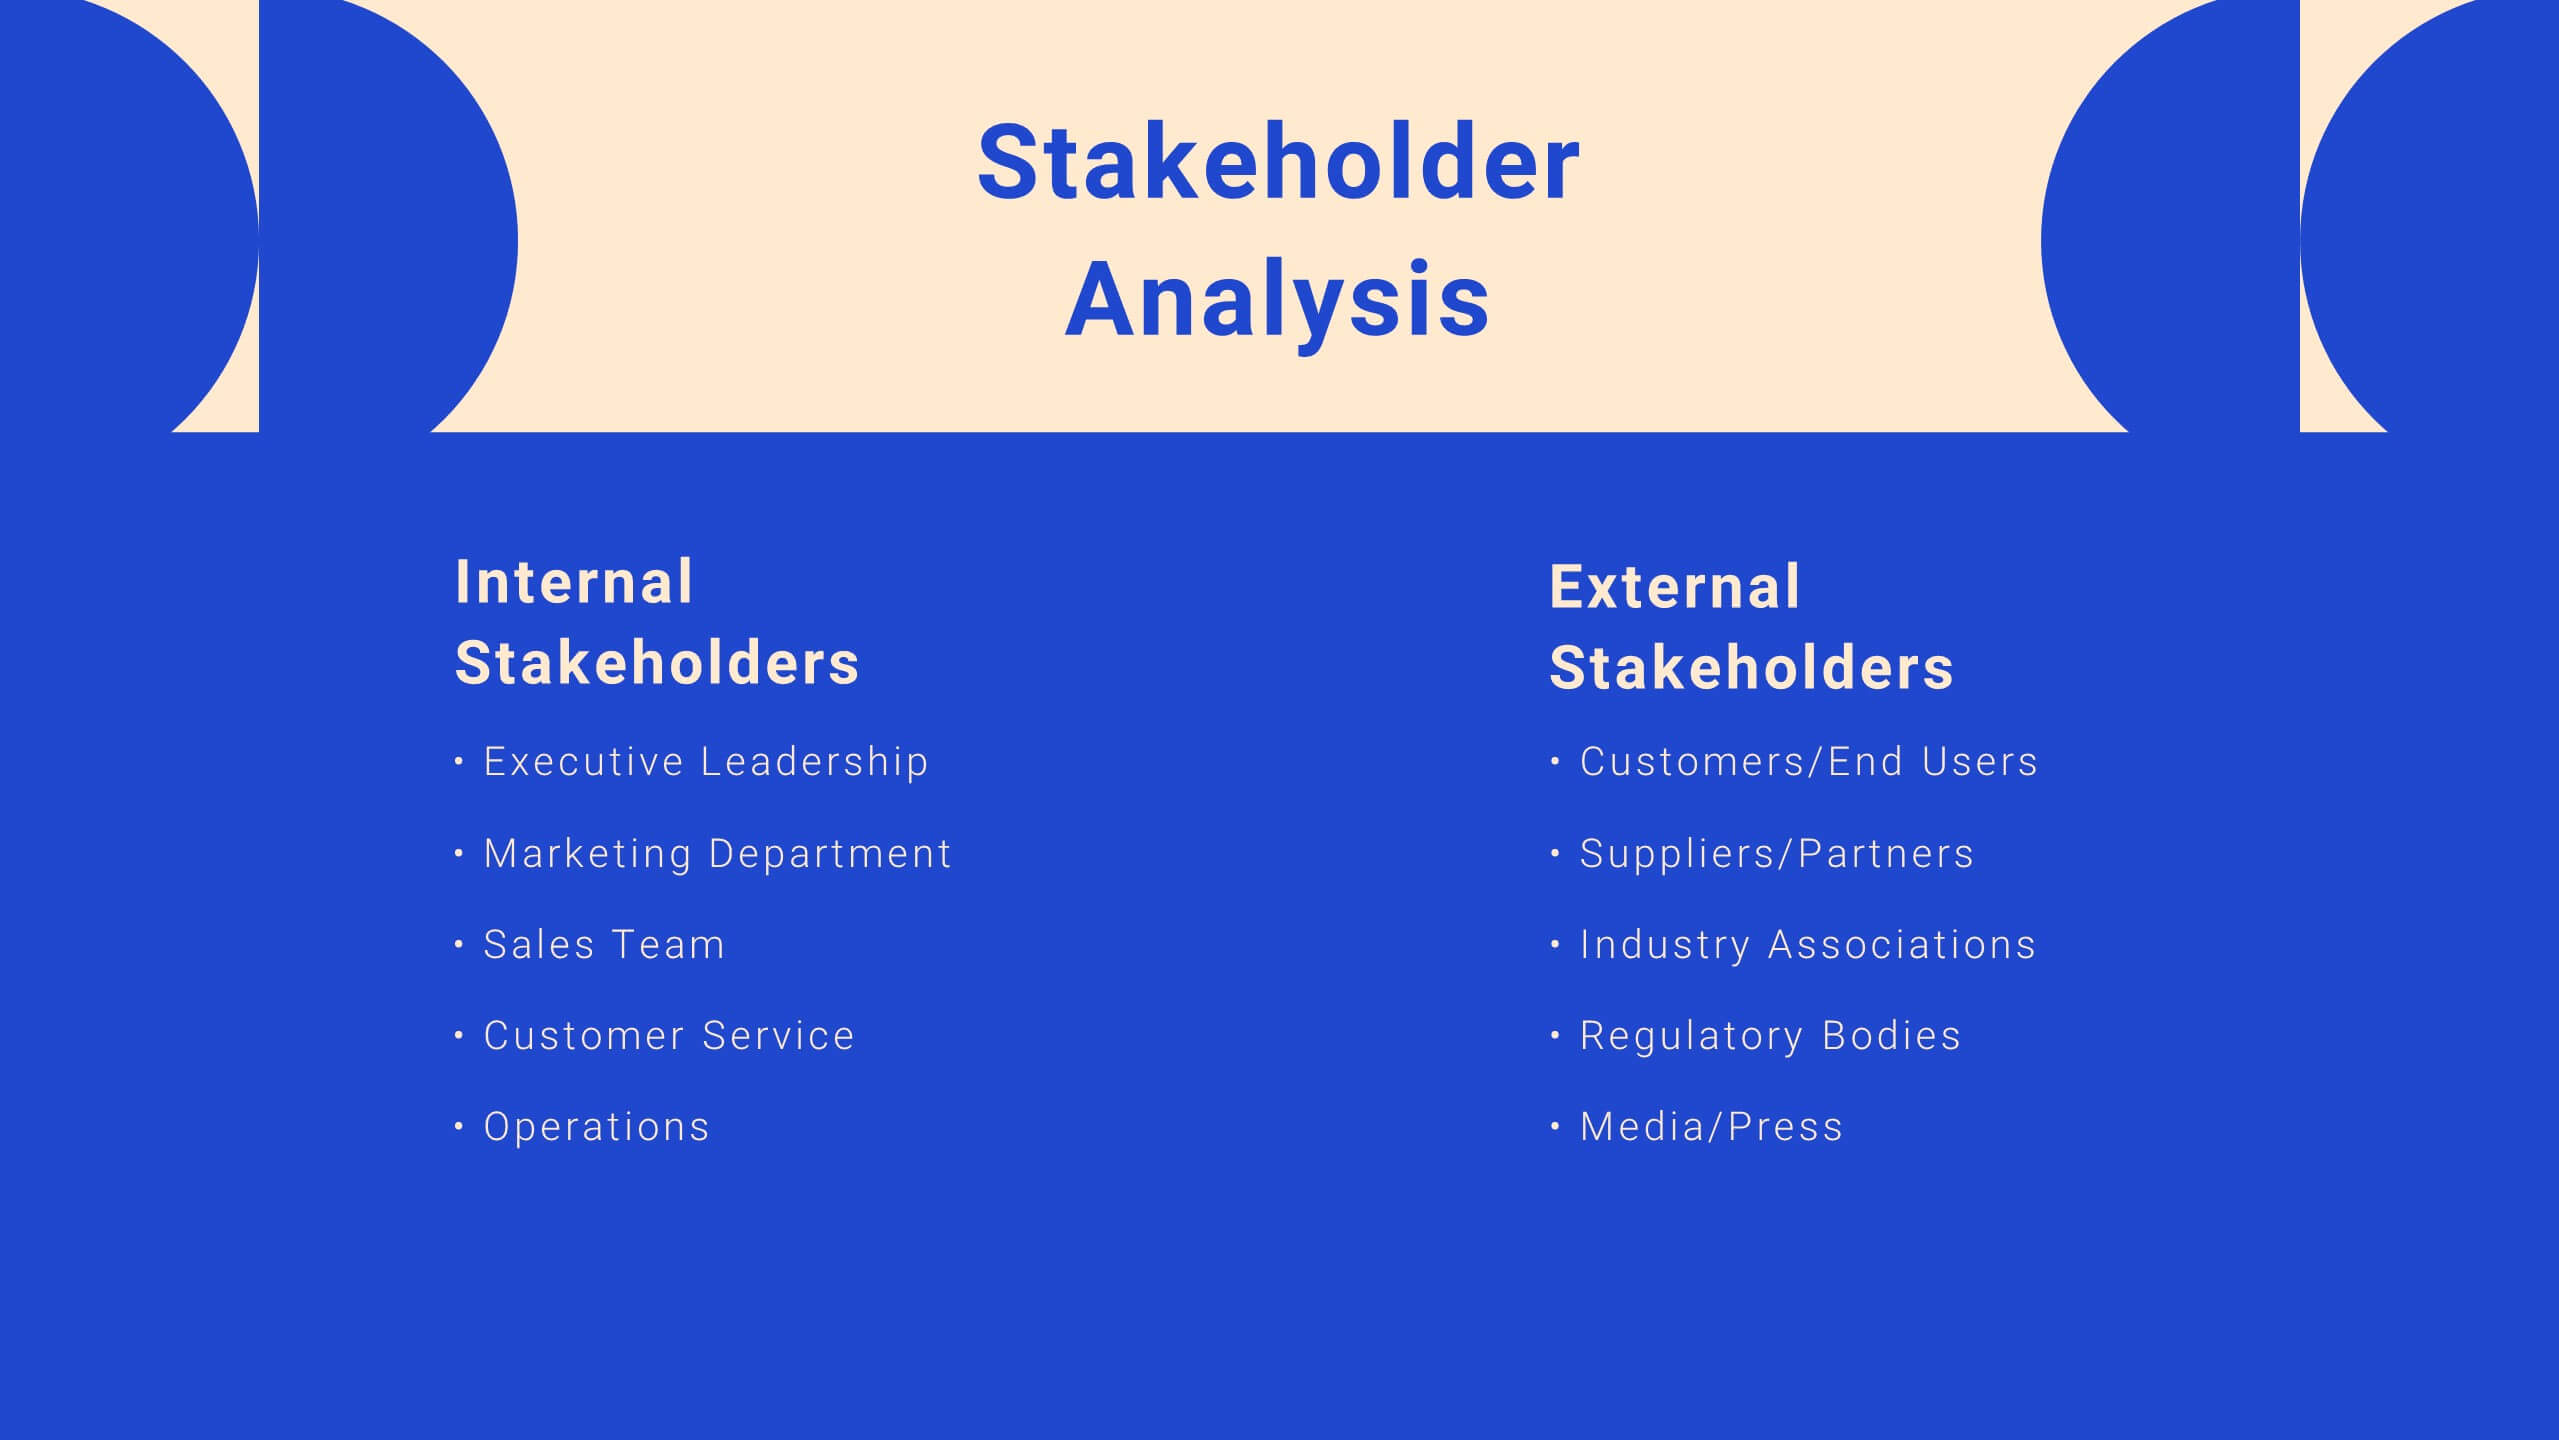
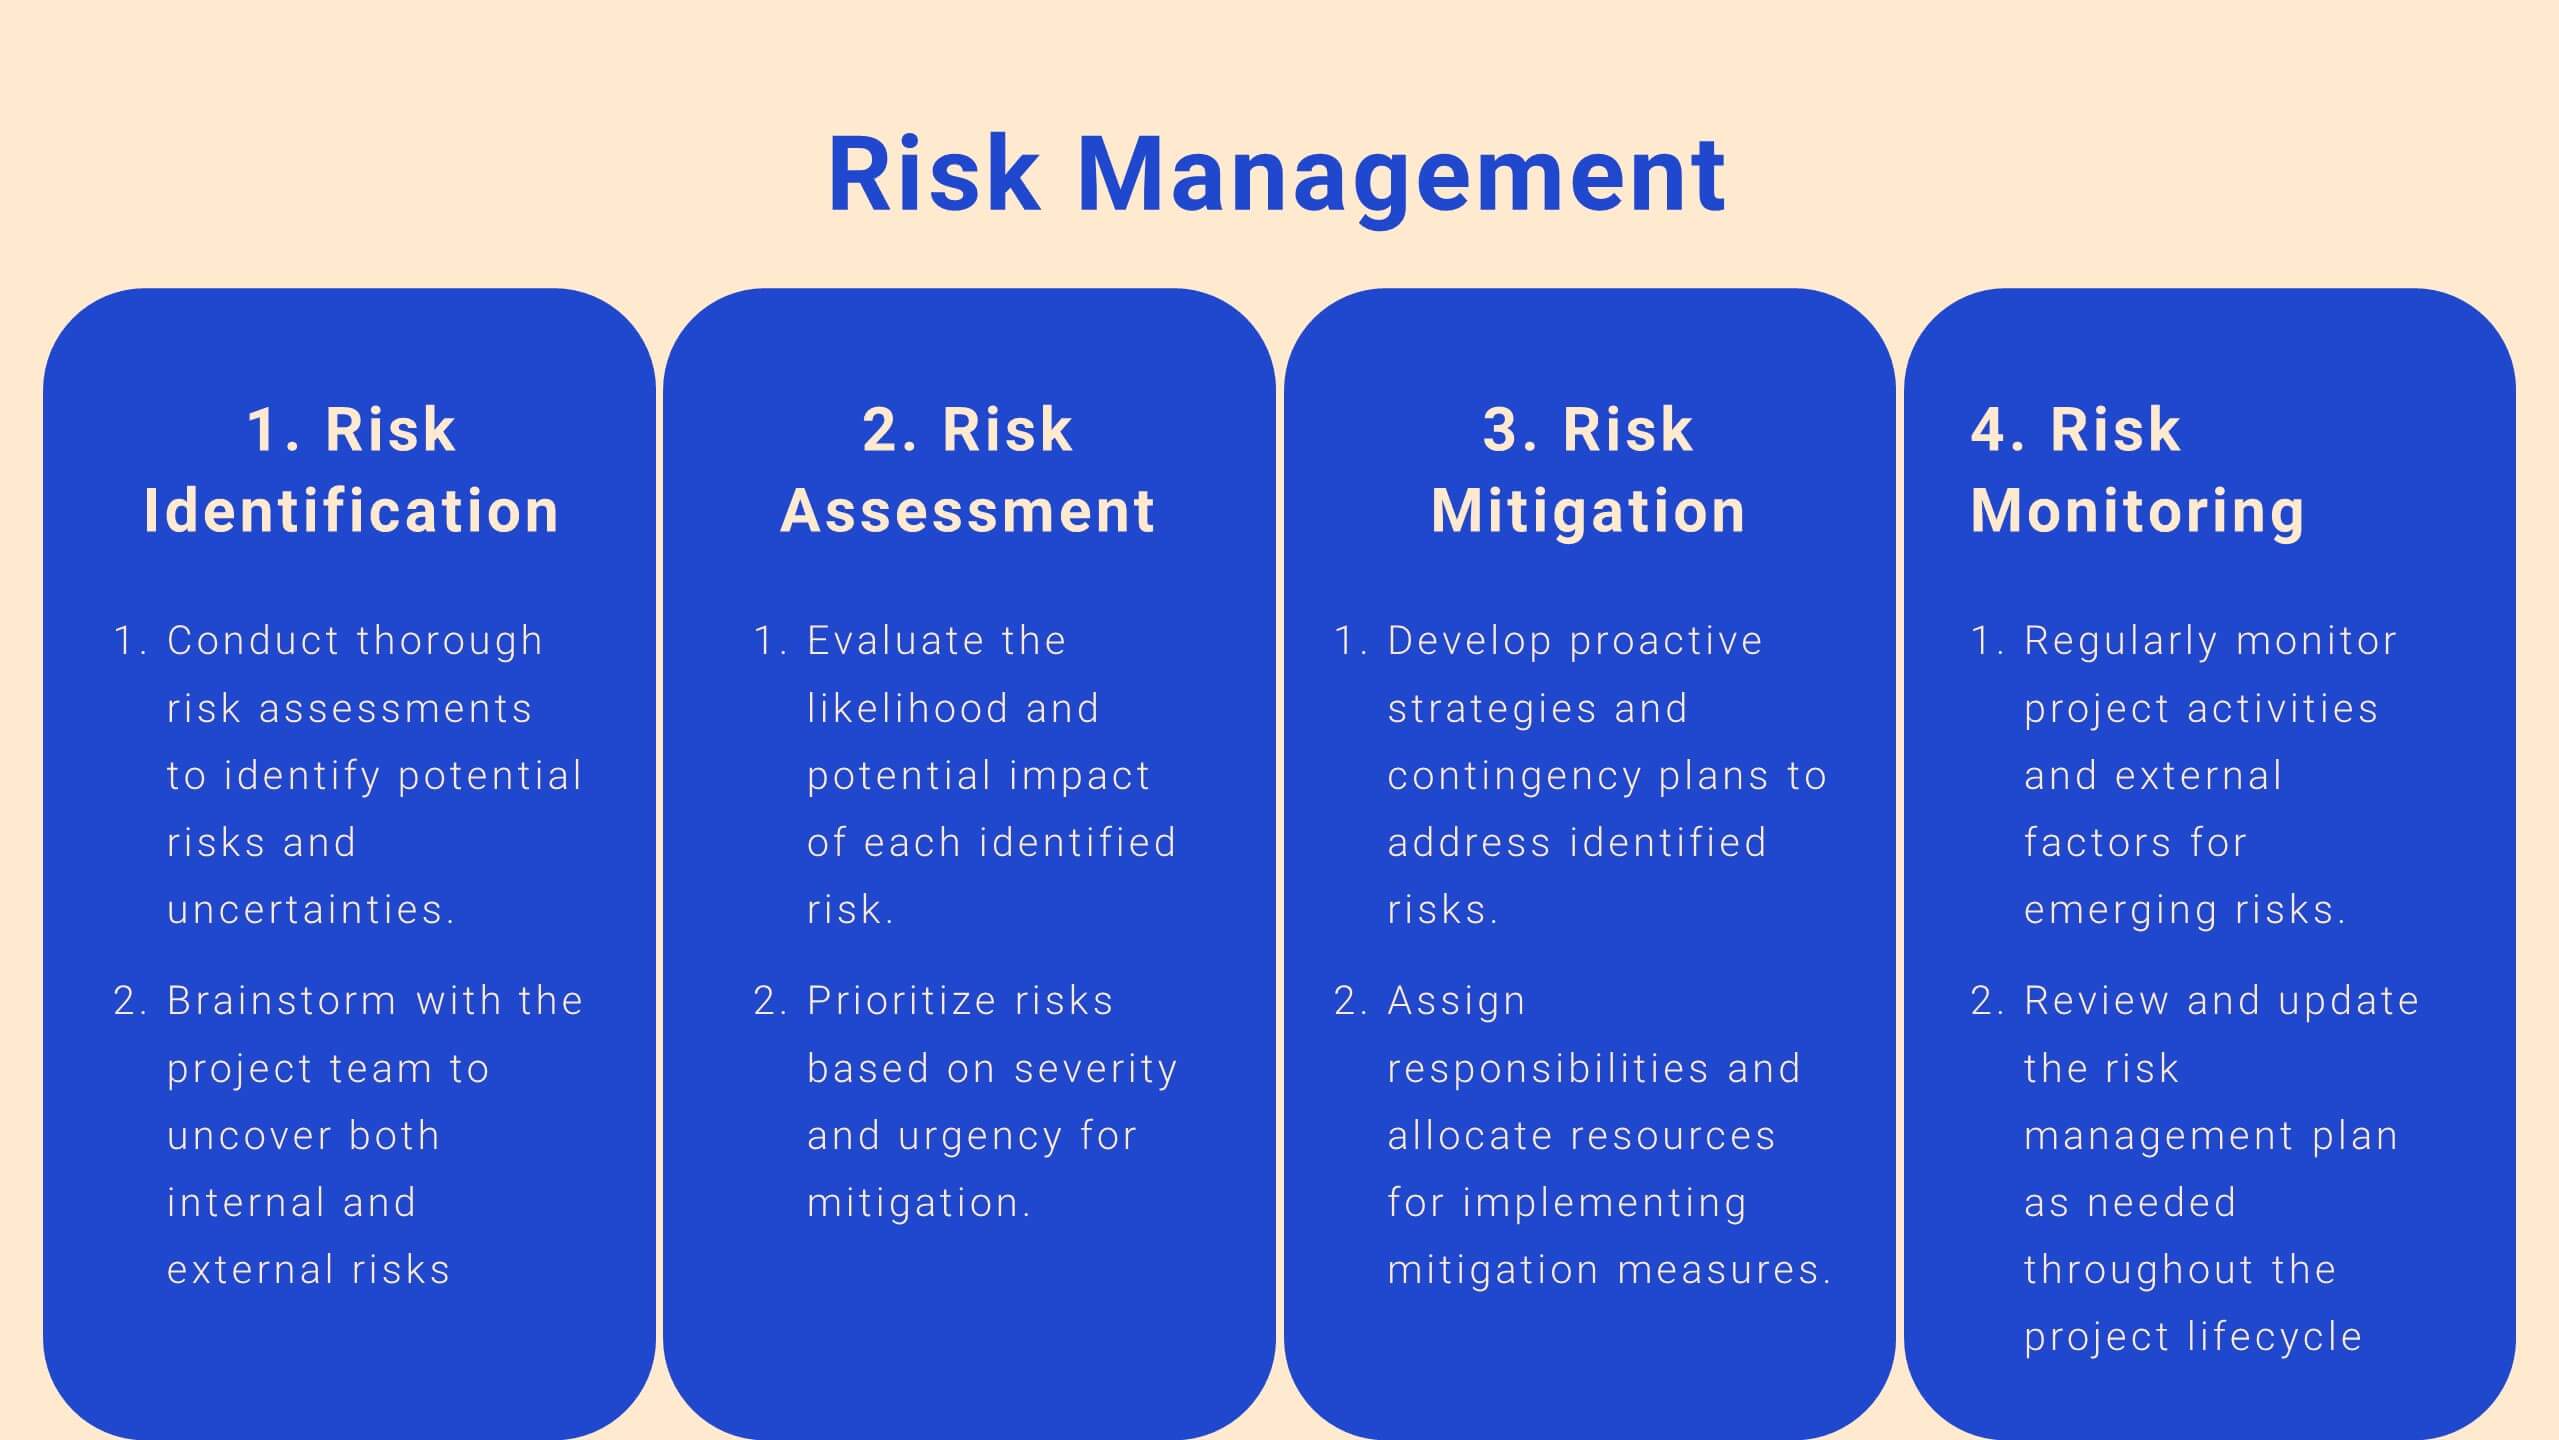
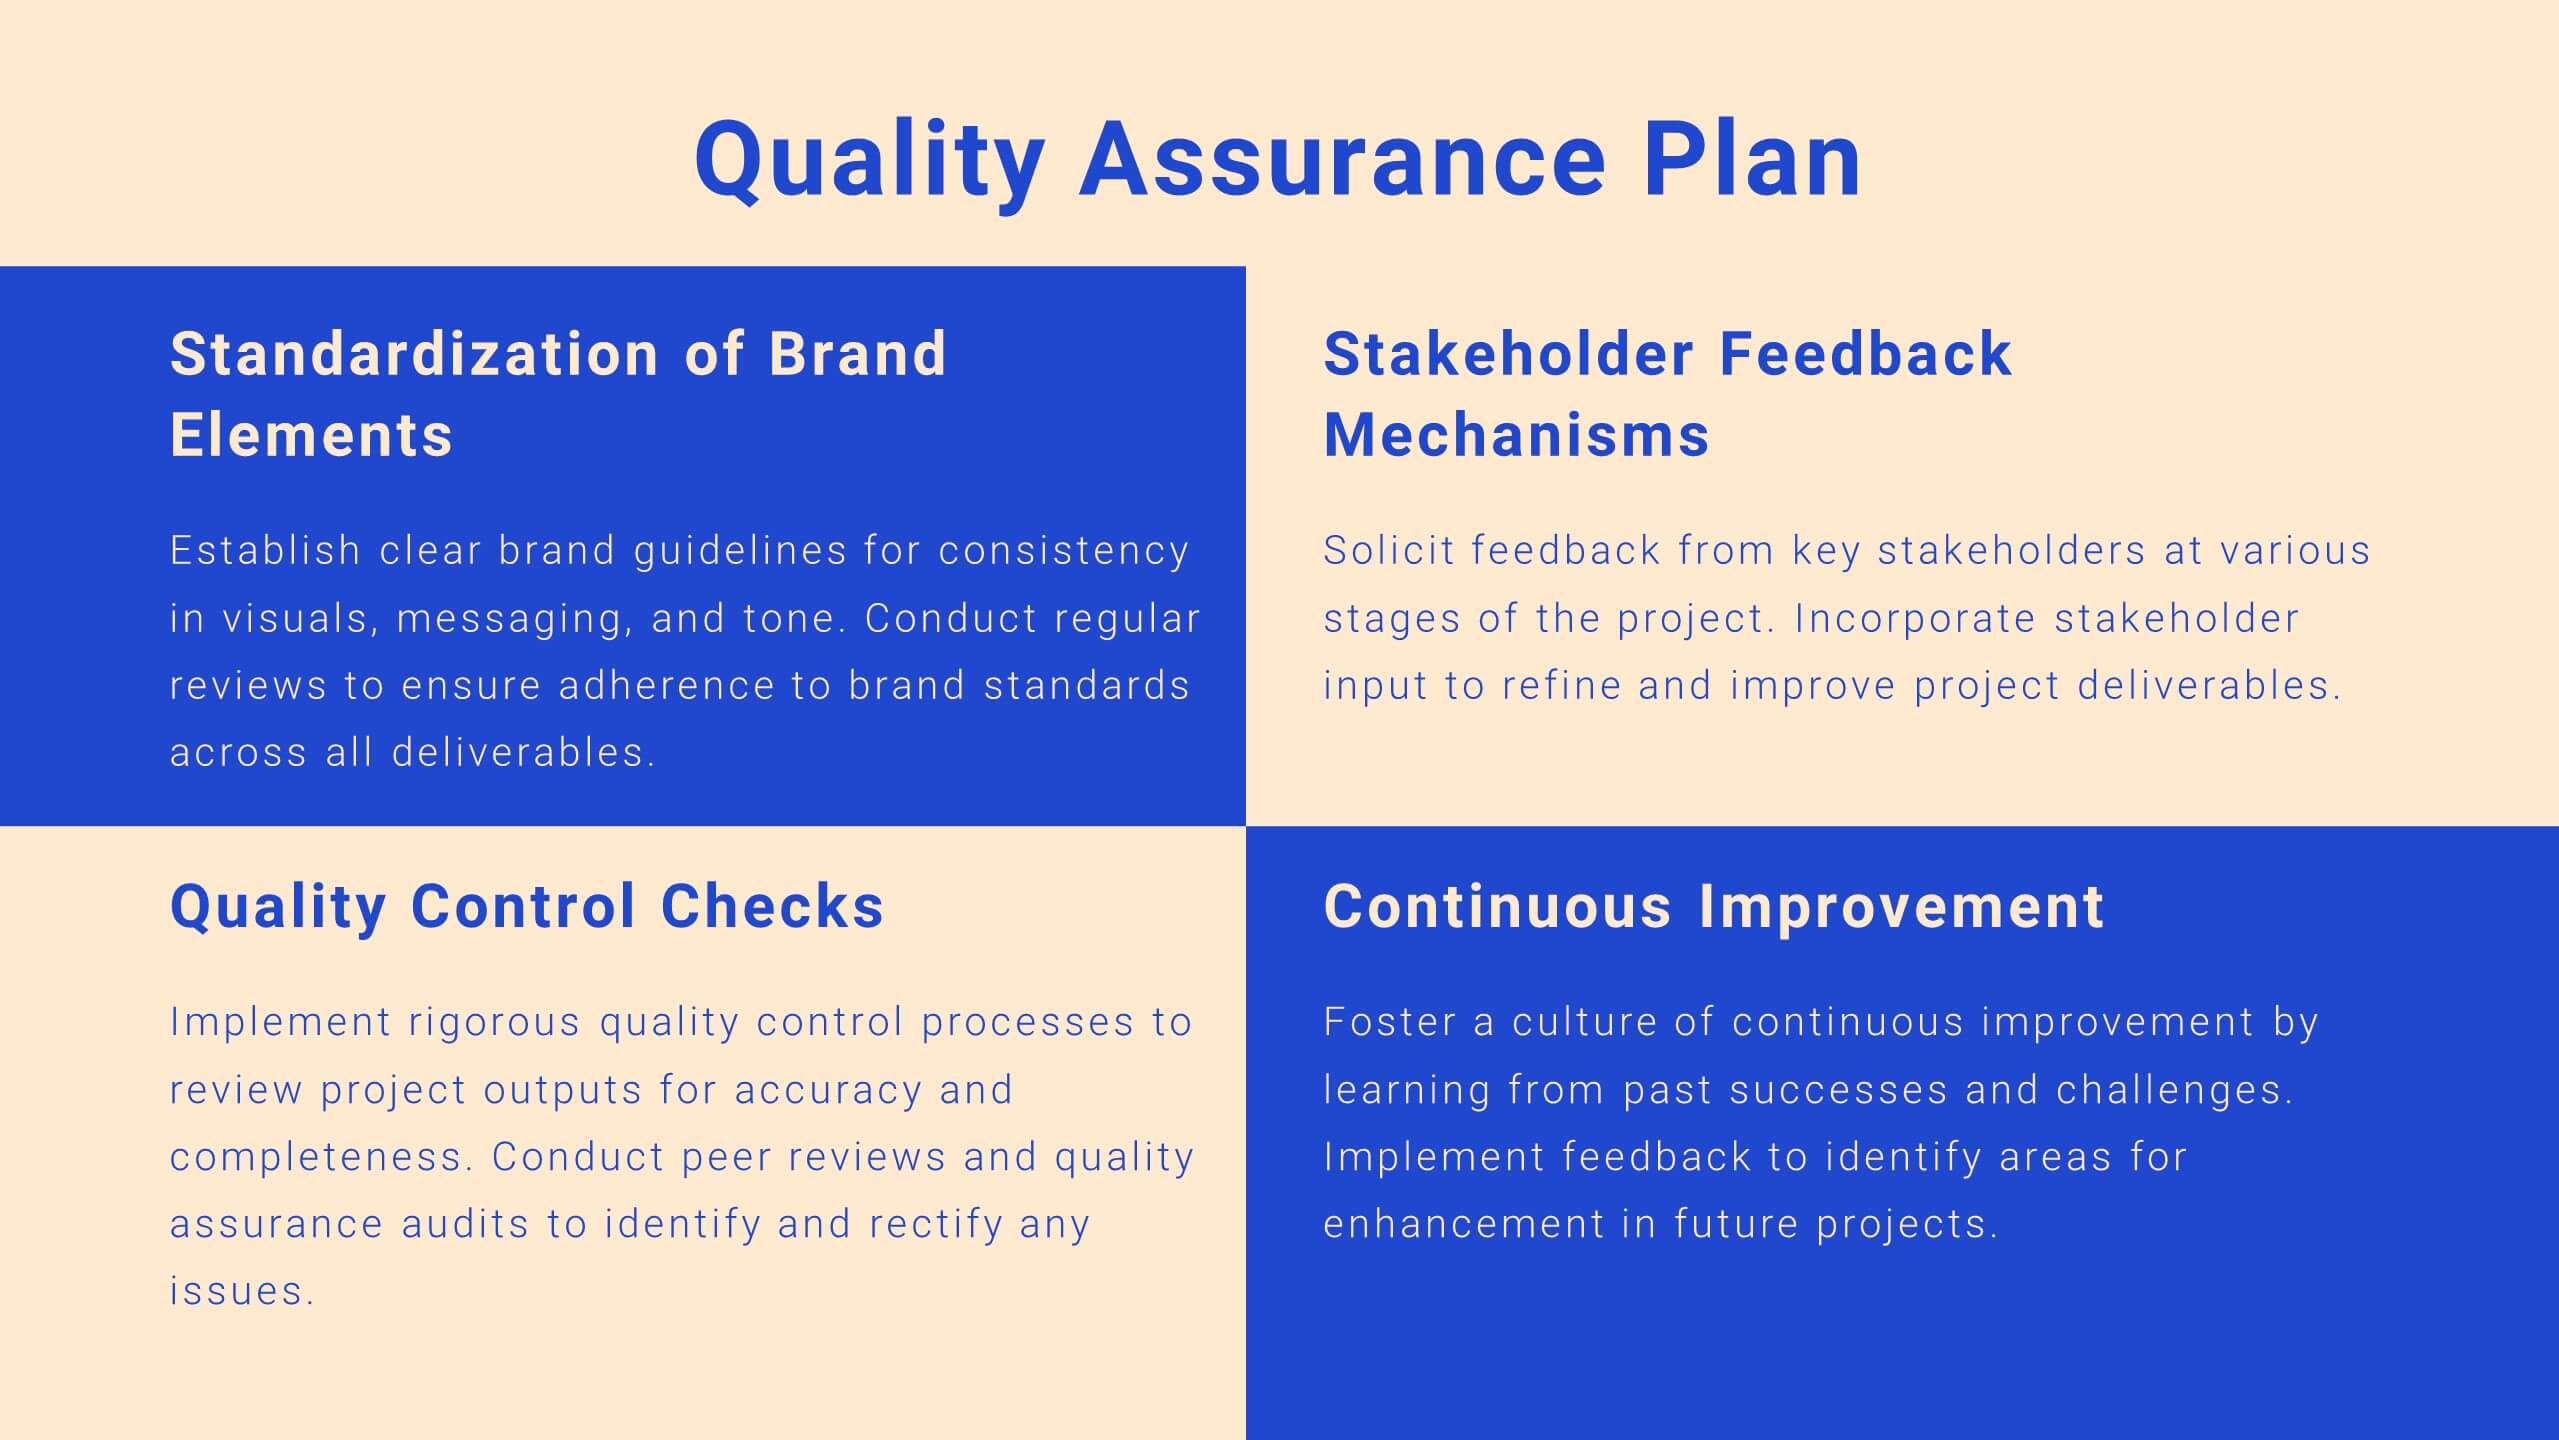
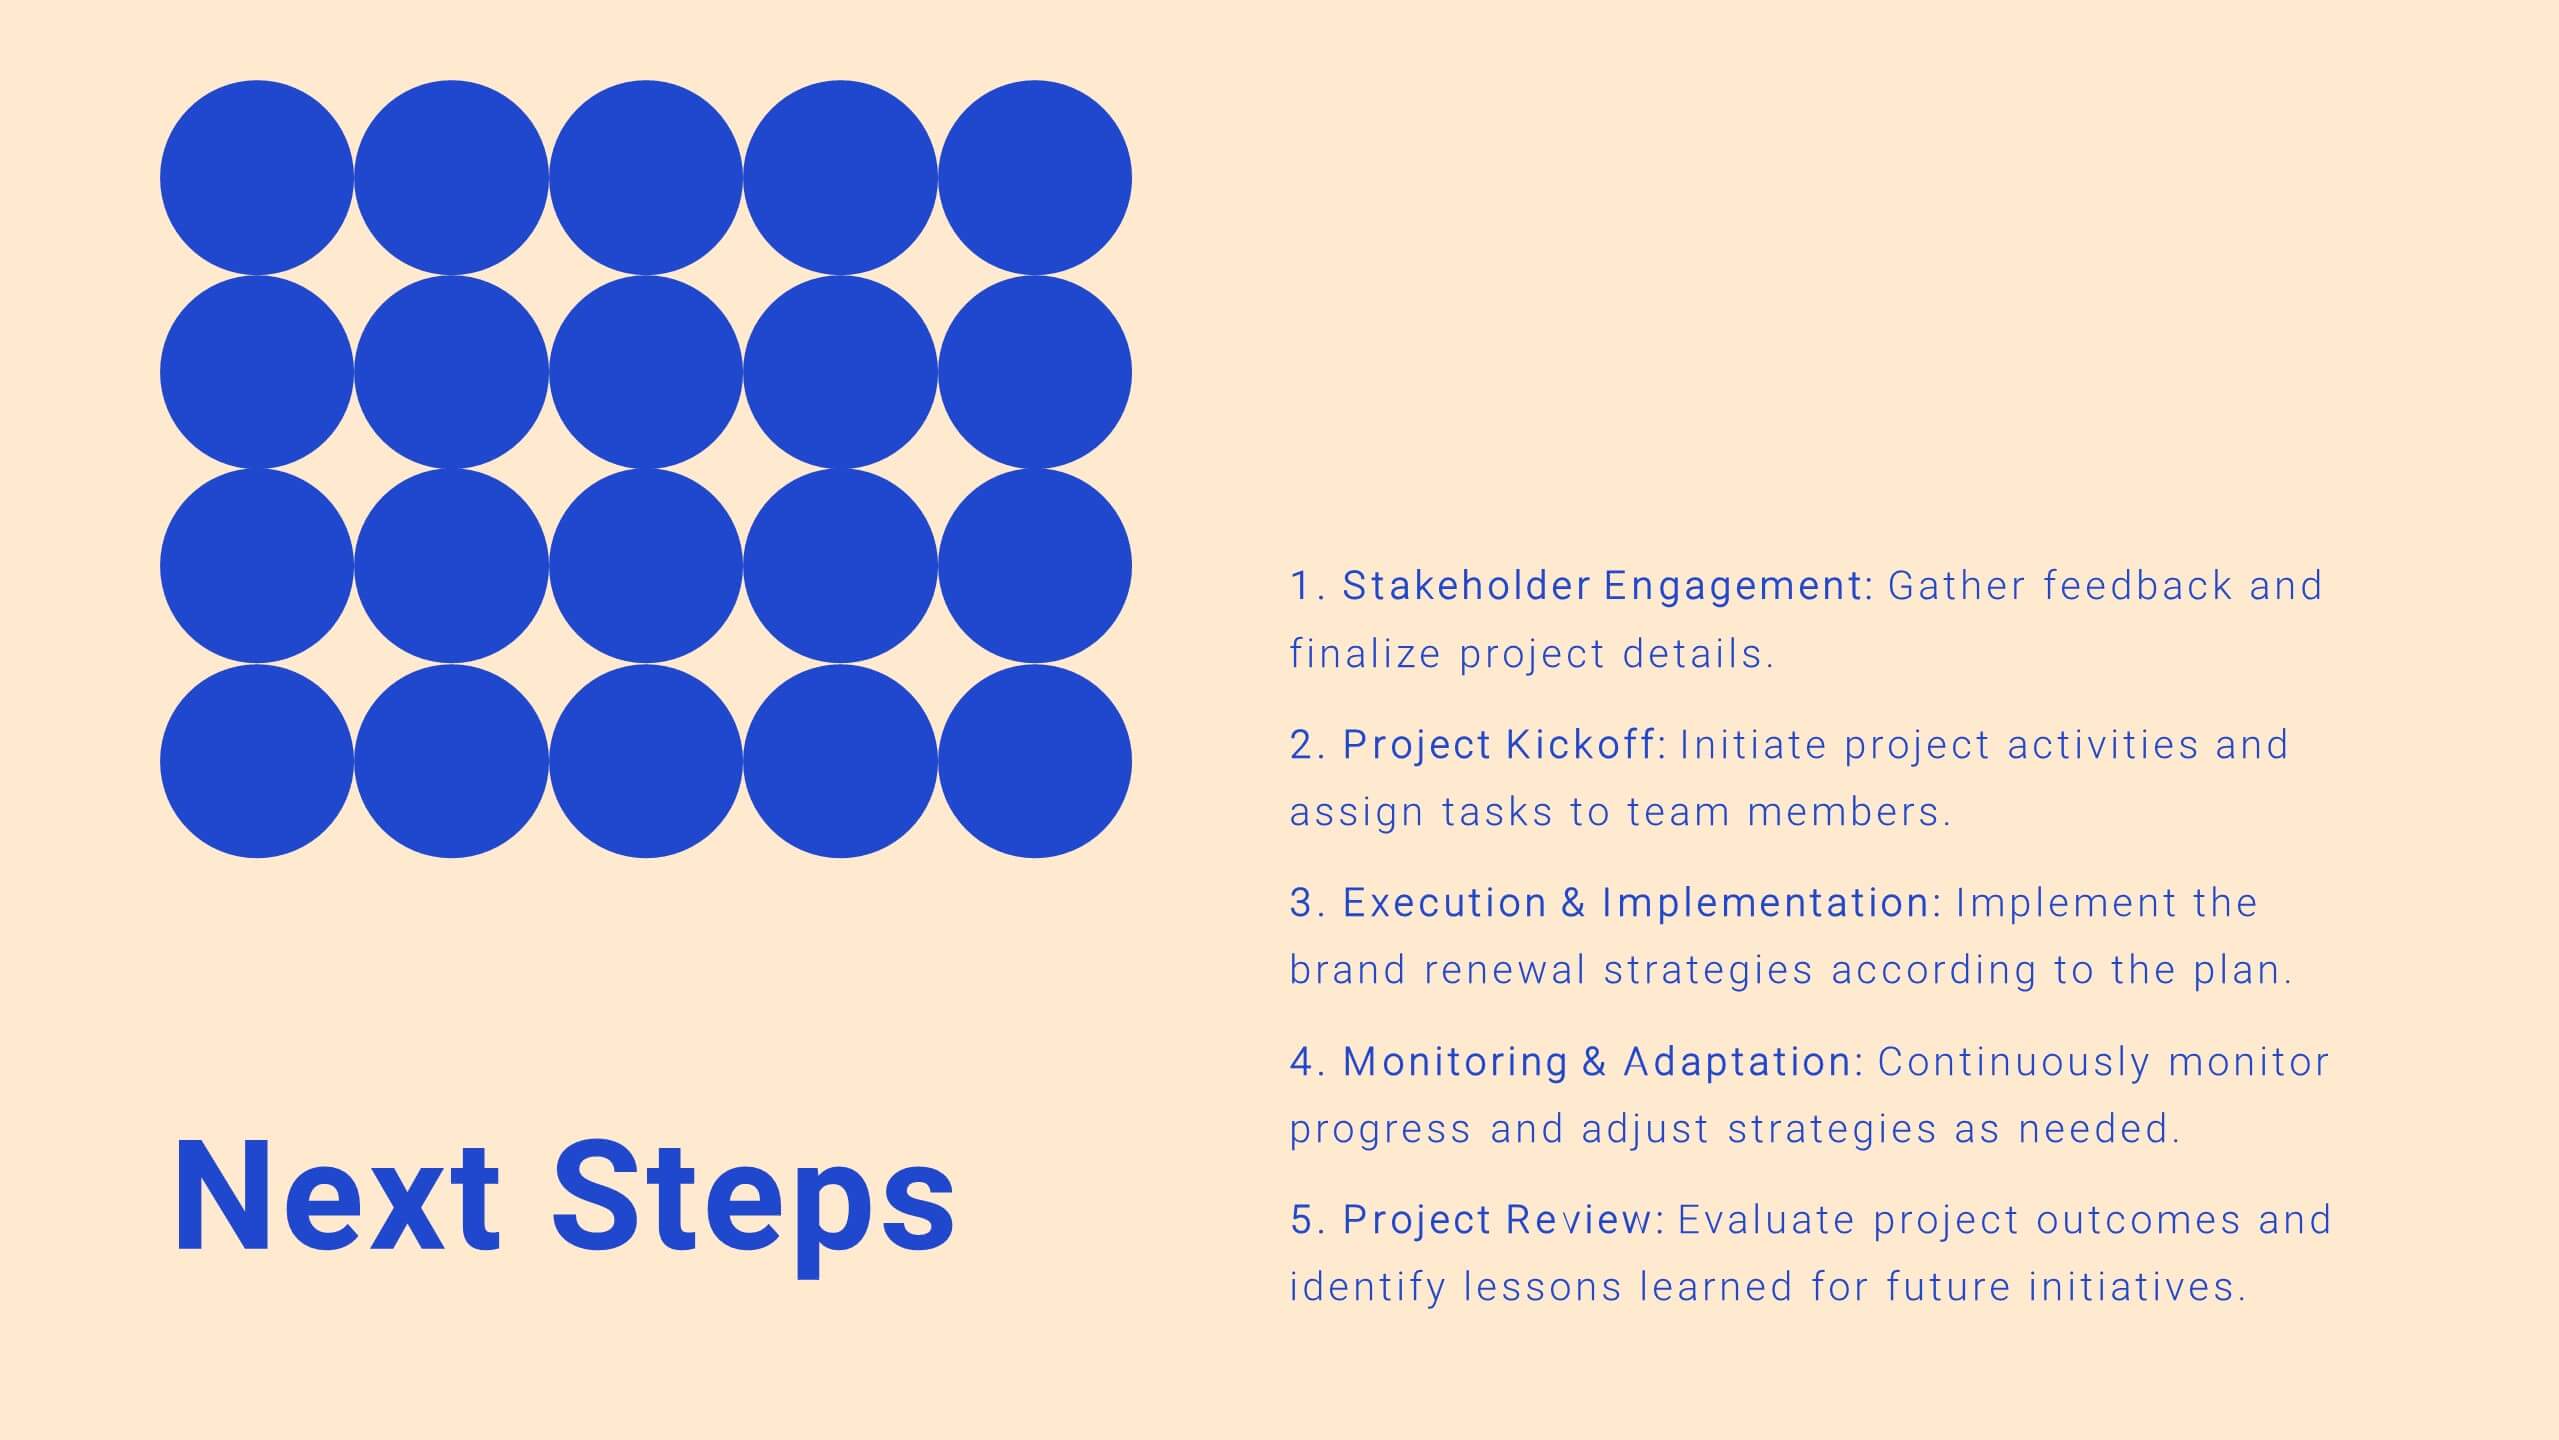
Drift Agile Project Plan Presentation
Take control of your projects with this comprehensive project plan template! From introductions to detailed objectives, this template covers scope of work, methodology, timelines, budget breakdowns, and risk management. Ideal for ensuring your project stays on track, it also includes stakeholder analysis and quality assurance plans. Compatible with PowerPoint, Keynote, and Google Slides.


5 diapositivas
Professional Business Proposal Presentation
Make your pitch stand out with a polished, minimal design that highlights every key stage of your business strategy. This clean visual layout is perfect for outlining project phases, services, or data-driven insights with clarity and impact. Fully compatible with PowerPoint, Keynote, and Google Slides for easy customization.