


Características


¿Tienes alguna pregunta?
Recomendar


4 diapositivas
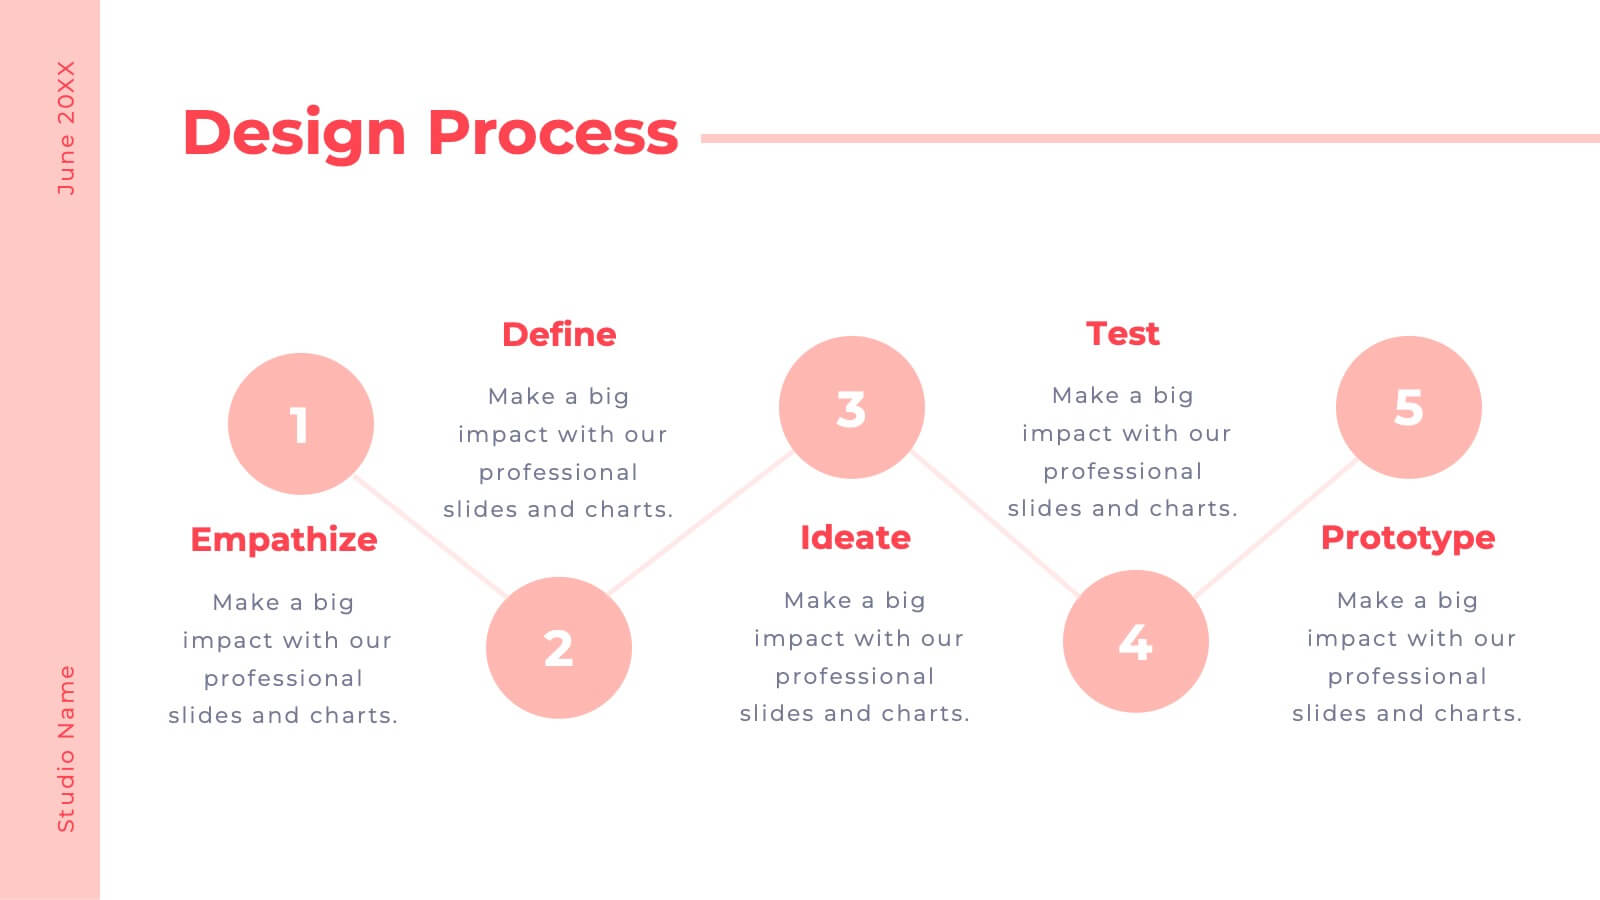
Market Entry Strategic Plan Layout
Break down your go-to-market strategy with the Market Entry Strategic Plan Layout Presentation. This slide is designed to help you visually outline four key initiatives or phases in your market entry approach, anchored by a central launch icon. The horizontal color-gradient layout ensures clarity while guiding viewers through each step. Fully editable in PowerPoint, Keynote, and Google Slides.


12 diapositivas
Leadership Development and Growth
Highlight leadership skills with this dynamic radar chart template, ideal for tracking individual or team competencies across six core areas. Use this layout to visualize progress in communication, strategy, vision, influence, adaptability, and accountability. Great for HR reviews, training evaluations, or performance dashboards. Fully editable in PowerPoint, Keynote, and Google Slides.


7 diapositivas
Venn Diagram Infographic Presentation Template
A Venn diagram is a type of chart that uses circles to show the similarities and differences between two or more sets of items. The circles overlap in the areas where the items have something in common, and the non-overlapping areas show the items that are unique to each set. This template is perfect for showing how different things are alike and different. This template includes lots of diagrams with circles that you can customize to show all the similarities between your different information. You can also add pictures and charts to make it look more appealing with your personal data.


4 diapositivas
Company Vision and Long-Term Goals Presentation
Present your company’s future with clarity and impact using this Company Vision and Long-Term Goals slide. Featuring a bar chart-style graphic with ascending growth stages, this template allows you to showcase strategic milestones, business values, or development phases. Each bar is paired with icons and editable text to highlight specific goals, making it ideal for leadership meetings, strategic planning, or investor pitches. Clean, modern, and customizable in PowerPoint, Keynote, and Google Slides.


8 diapositivas
Geometric Design Elements Presentation
The "Geometric Design Elements" presentation template features a modern layout utilizing geometric shapes to organize and present data effectively. Each slide provides a unique configuration of circles or connected shapes, facilitating clear visualization of interconnected topics or categories. These design elements are ideal for displaying business insights, relationships between concepts, or summarizing key points in a visually appealing and easily digestible format. The use of varied colors helps to distinguish between different sections or ideas, enhancing the viewer's ability to follow and absorb the presented information efficiently. This template is suitable for business presentations that require a balance of aesthetic appeal and functional design to communicate complex information clearly.


7 diapositivas
Technology Infographic Presentation Template
A technology infographic is a visual representation of information or data related to technology. The purpose of this template is to present your complex information in a simple, easy-to-understand manner. This template contains pre-designed layouts and images that can be used to structure your content in a variety of ways. This template is perfect to use to help explain technology-related topics such as software, hardware, cybersecurity, and more. Infographics are commonly used in the technology industry to help educate people about the latest trends, products, and services.


4 diapositivas
Stakeholder Analysis and Engagement Presentation
Enhance your strategic planning with our Stakeholder Analysis and Engagement Presentation template. Designed to map influence and interest effectively, this tool aids in identifying key stakeholders and tailoring engagement strategies. It’s compatible with PowerPoint, Keynote, and Google Slides, perfect for impactful presentations and workshops.


20 diapositivas
Mythion Business Idea Pitch Deck Presentation
Communicate your business vision with clarity and impact using this comprehensive pitch deck presentation template. Perfect for entrepreneurs, startups, and innovators, this template is designed to help you effectively present your idea to investors, stakeholders, or partners. Cover every essential aspect of your business journey with slides dedicated to the problem statement, solutions, market overview, and target audience. Showcase your business model, revenue projections, and unique selling proposition with visually appealing layouts. Highlight your marketing strategy, growth projections, and funding requirements to build a strong, persuasive case. Fully customizable and compatible with PowerPoint, Google Slides, and Keynote, this template allows you to tailor each slide to suit your business identity and goals. Whether you're pitching a new idea or seeking investment, this template ensures you present with professionalism and confidence.


6 diapositivas
Organized TOC Page for Reports Presentation
Make your reports easy to navigate with this Organized Table of Contents slide. Featuring modern icons, image placeholders, and clean formatting, it’s perfect for business briefs, analytics, and internal documents. Fully editable in PowerPoint, Keynote, and Google Slides—ideal for structuring complex information into a visually appealing and accessible format.


6 diapositivas
First-Time Buyer Tips Infographic
Navigate the thrilling world of first-time purchases with our "First Time Buyer Tips" Infographic Template. This vibrant tool is crafted to guide newcomers through the buying process with clarity and confidence. Each slide is a step-by-step beacon, illuminating the path with expert advice, from understanding budgeting basics to mastering negotiation tactics. Designed with the novice buyer in mind, this template features a series of easy-to-follow visuals and succinct tips that demystify the complexities of making major purchases. The clean, engaging design ensures that each piece of advice is both accessible and memorable, ideal for personal finance websites, real estate blogs, or consumer education workshops. Customize the color schemes, fonts, and layouts to align with your branding, making it a seamless addition to your educational materials. Equip your audience with the knowledge they need to make informed, confident decisions with this indispensable guide.


27 diapositivas
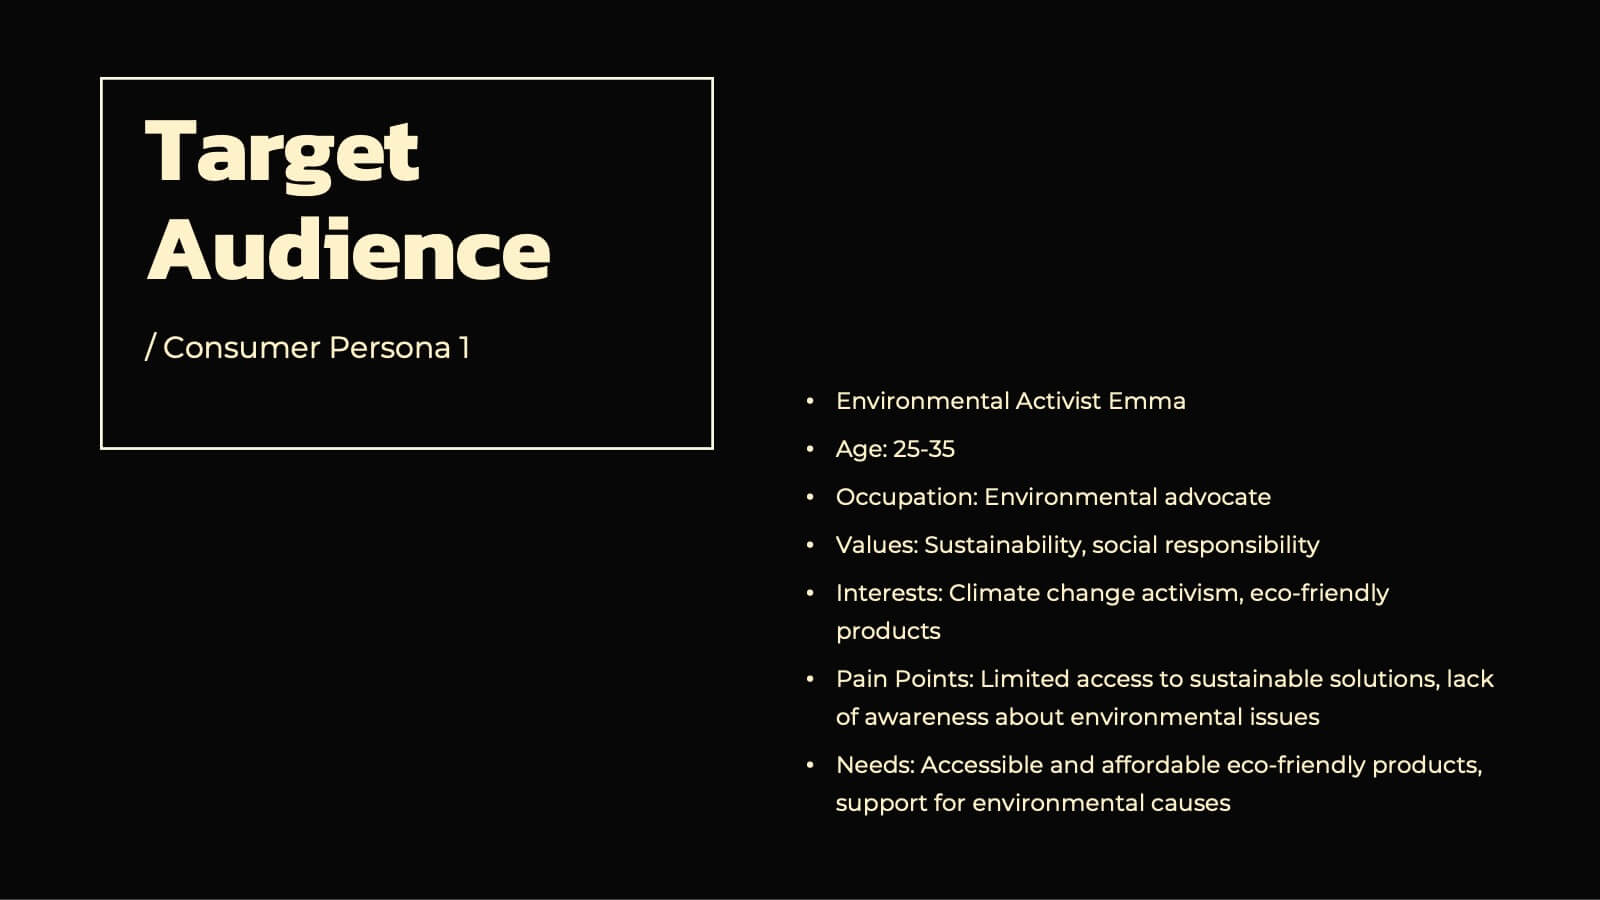
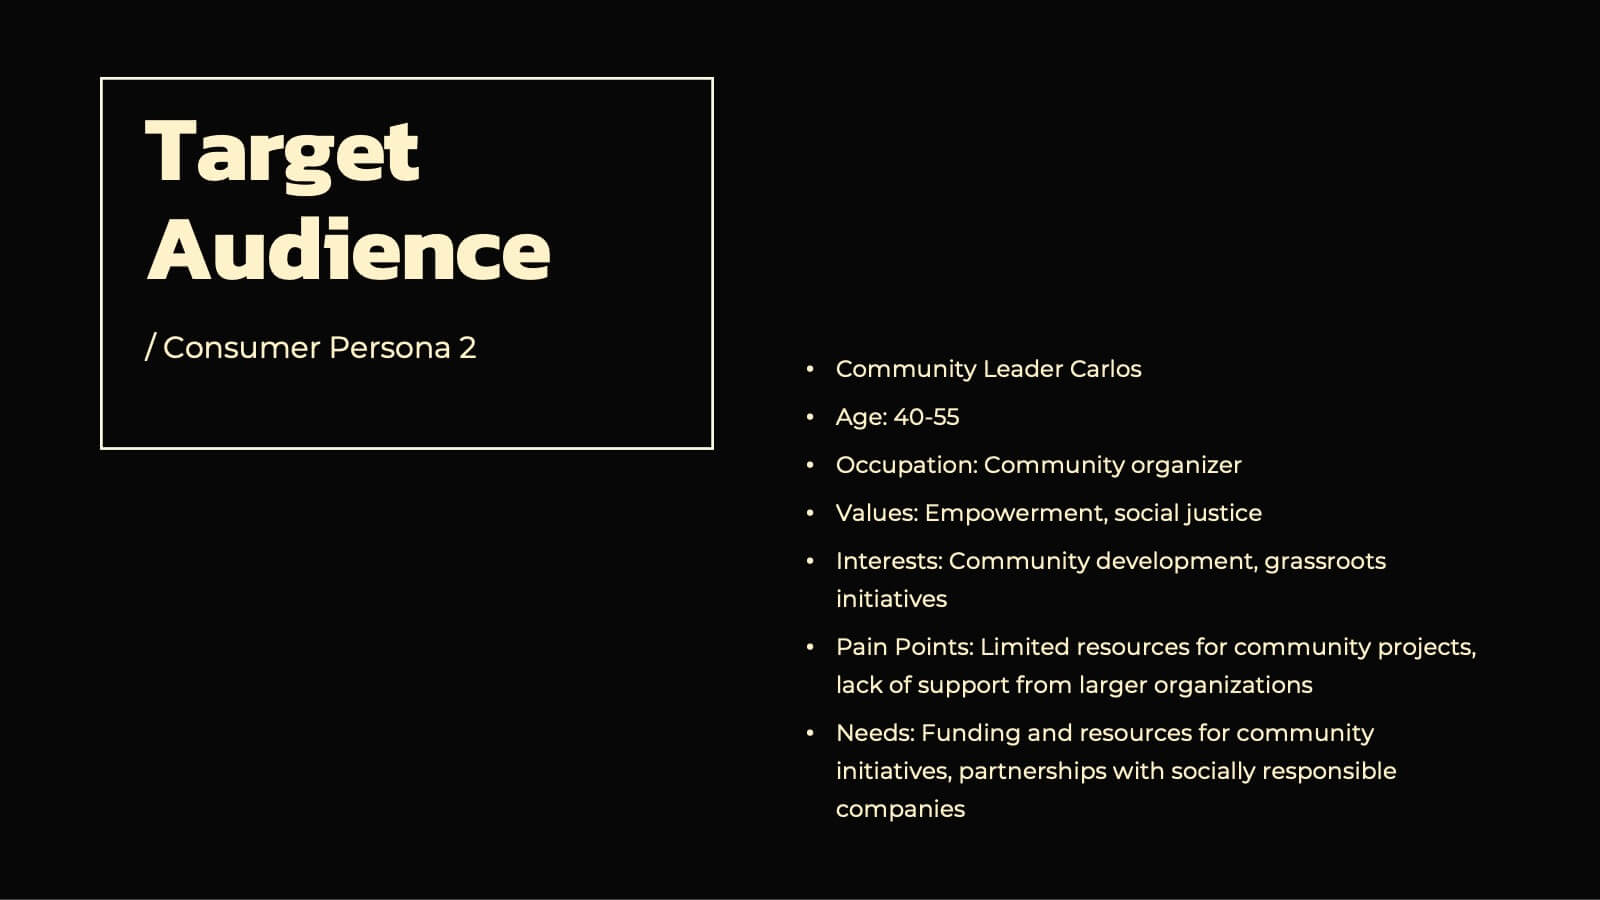
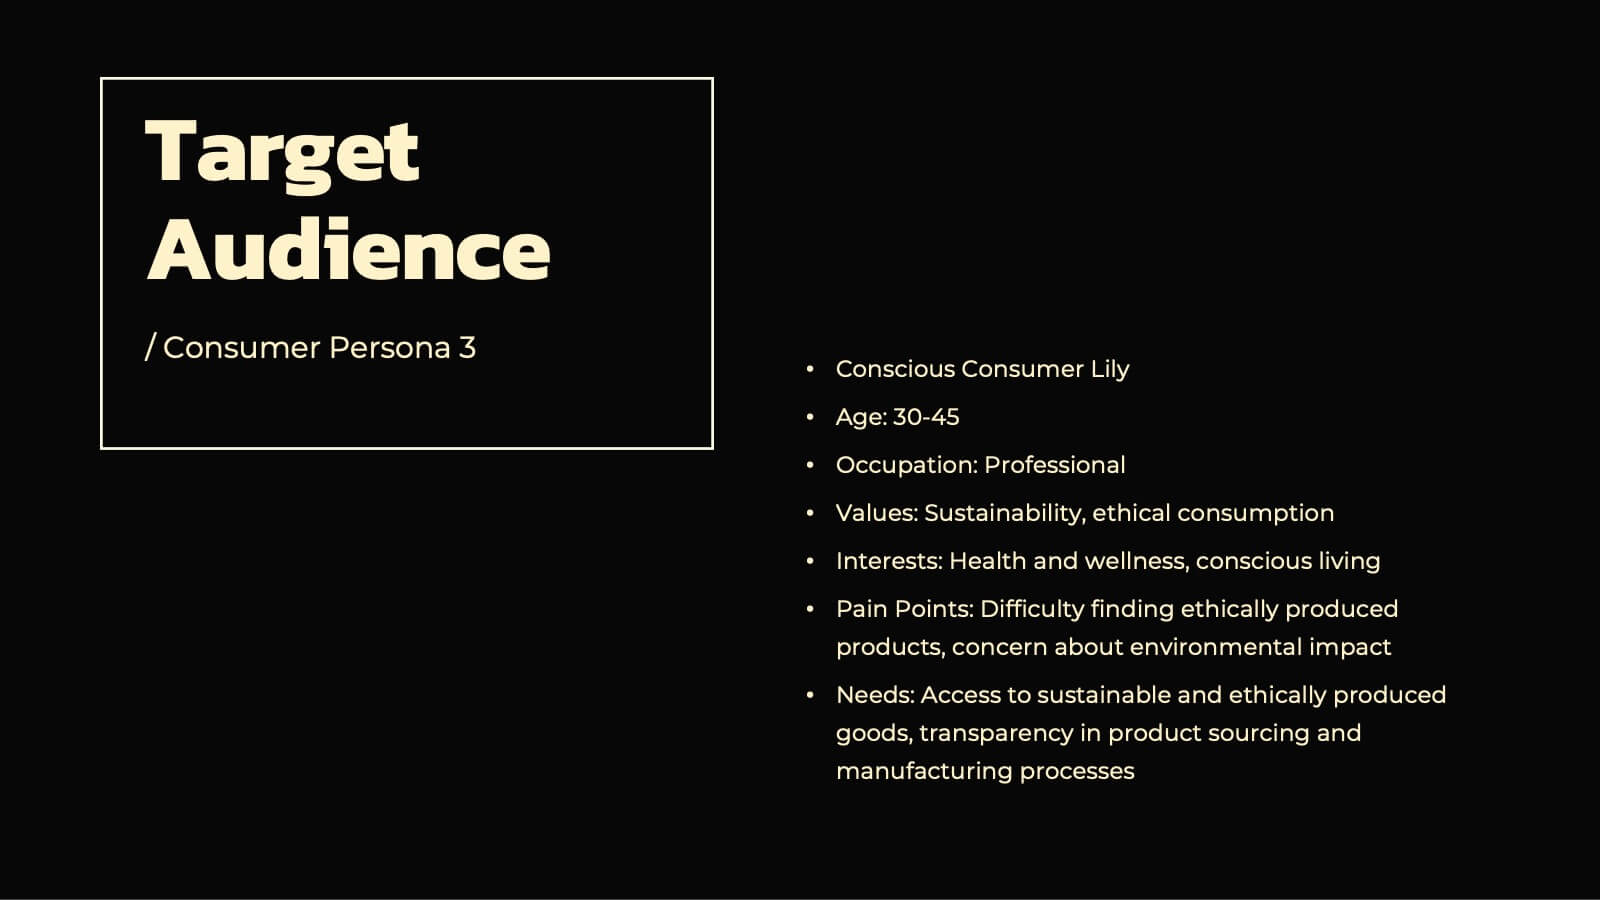
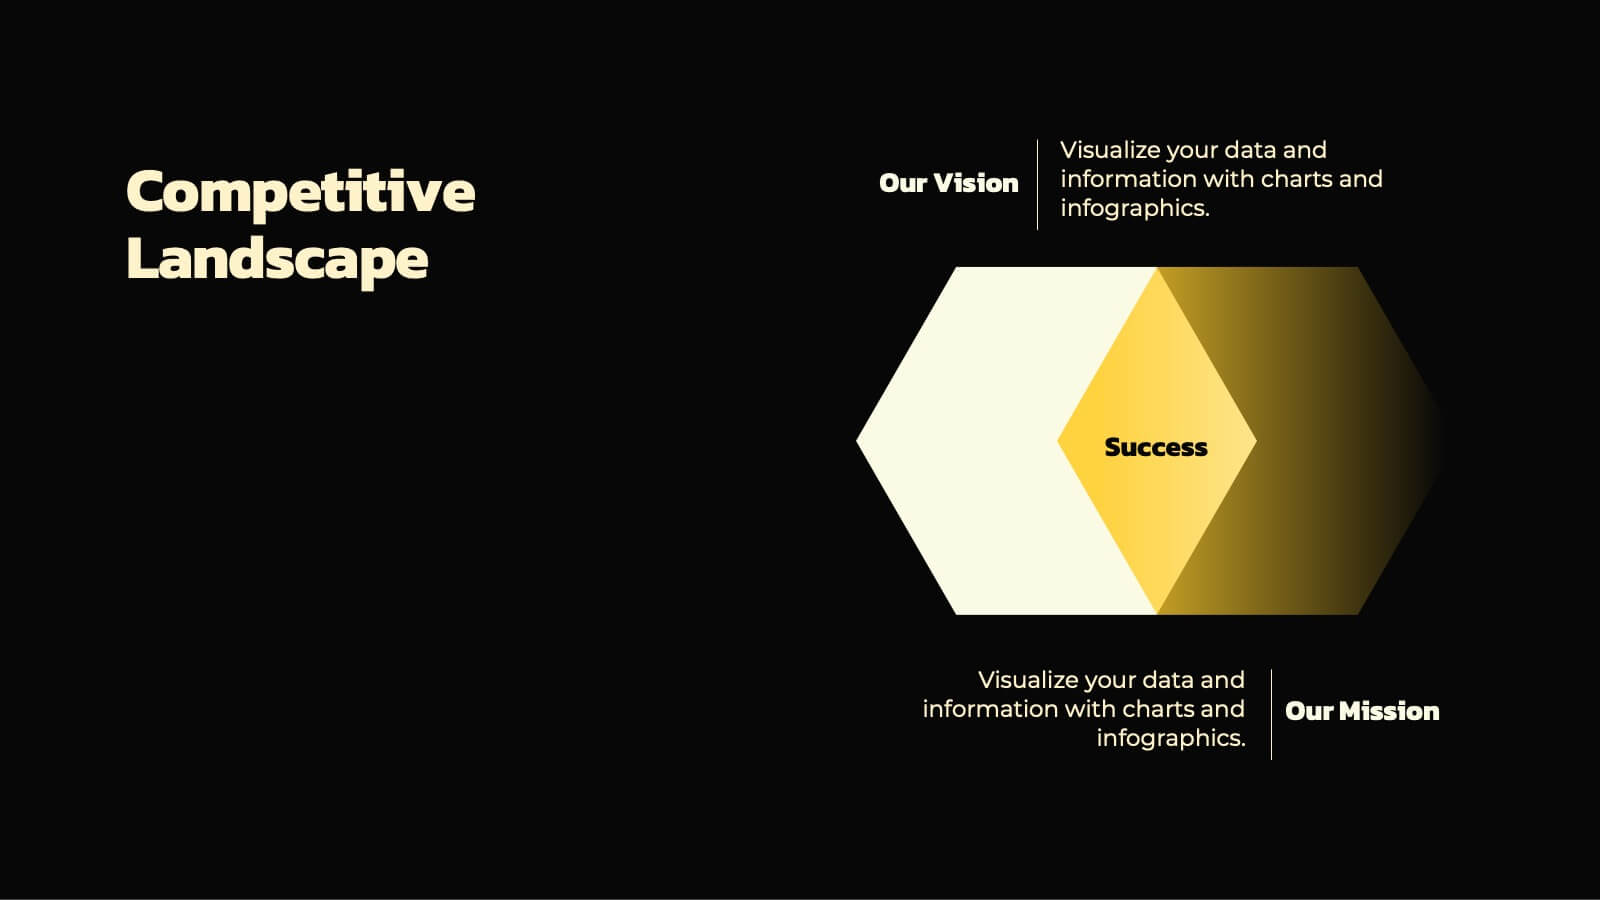
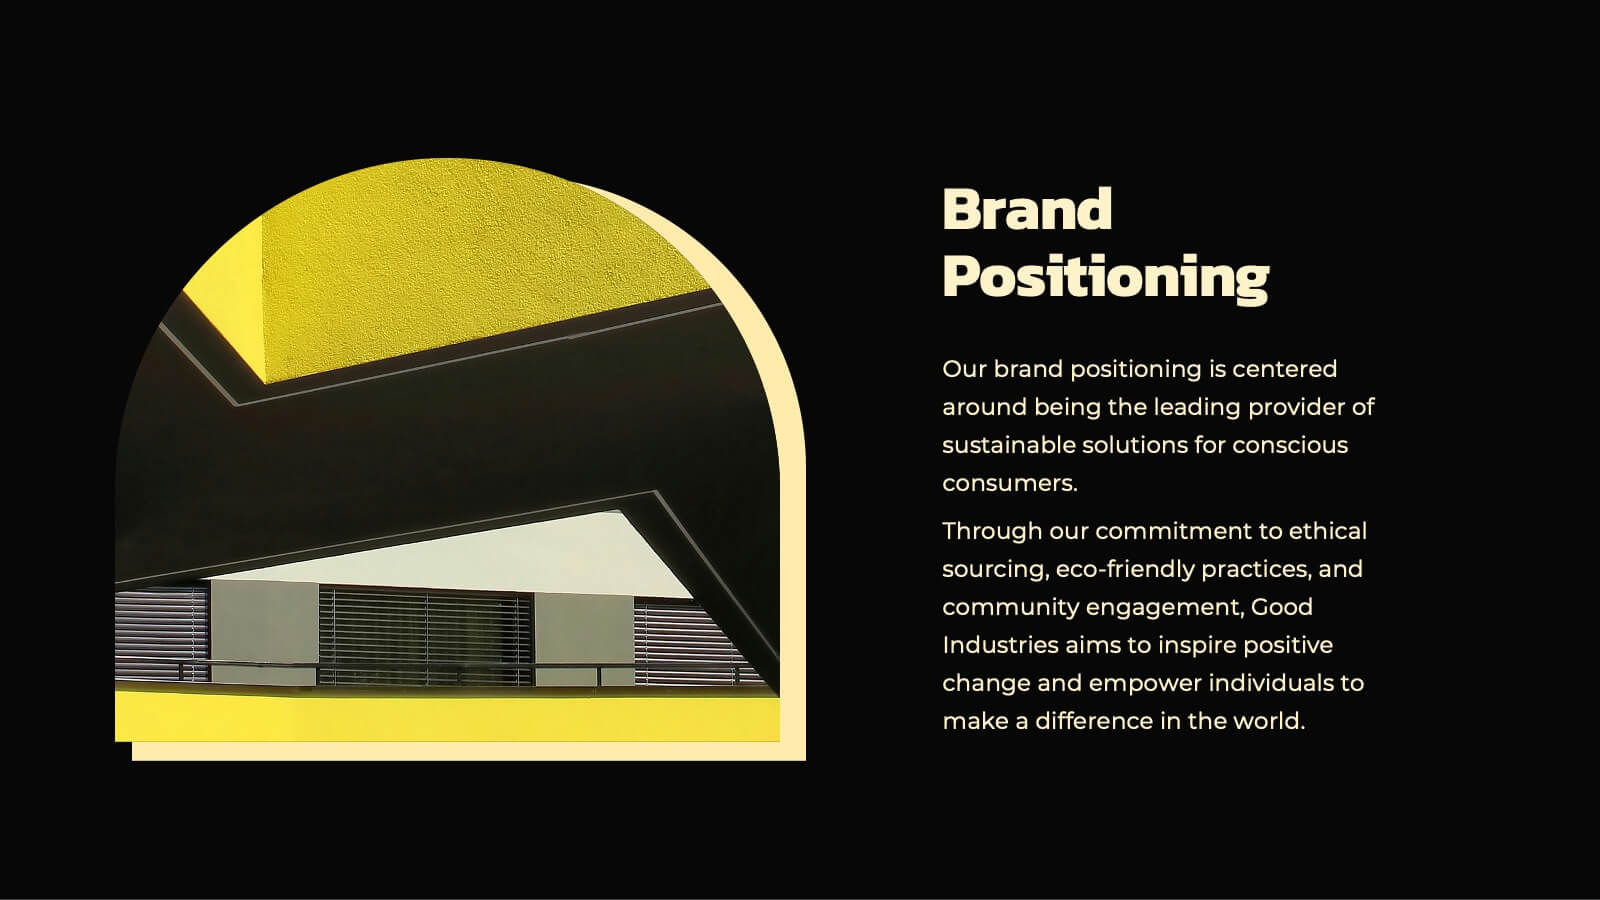
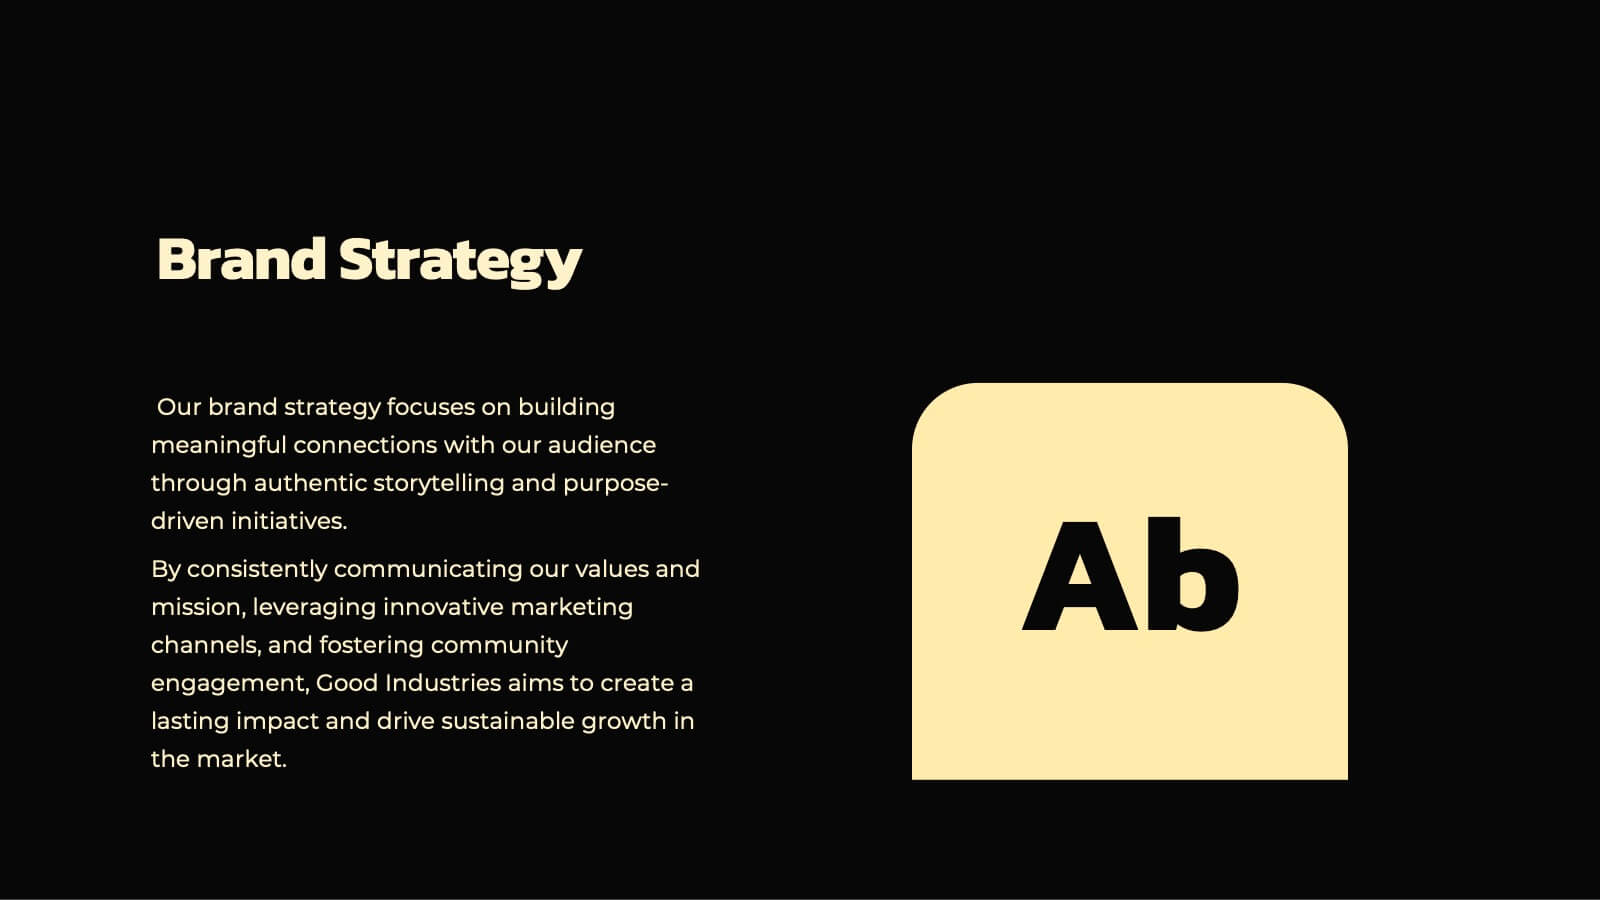
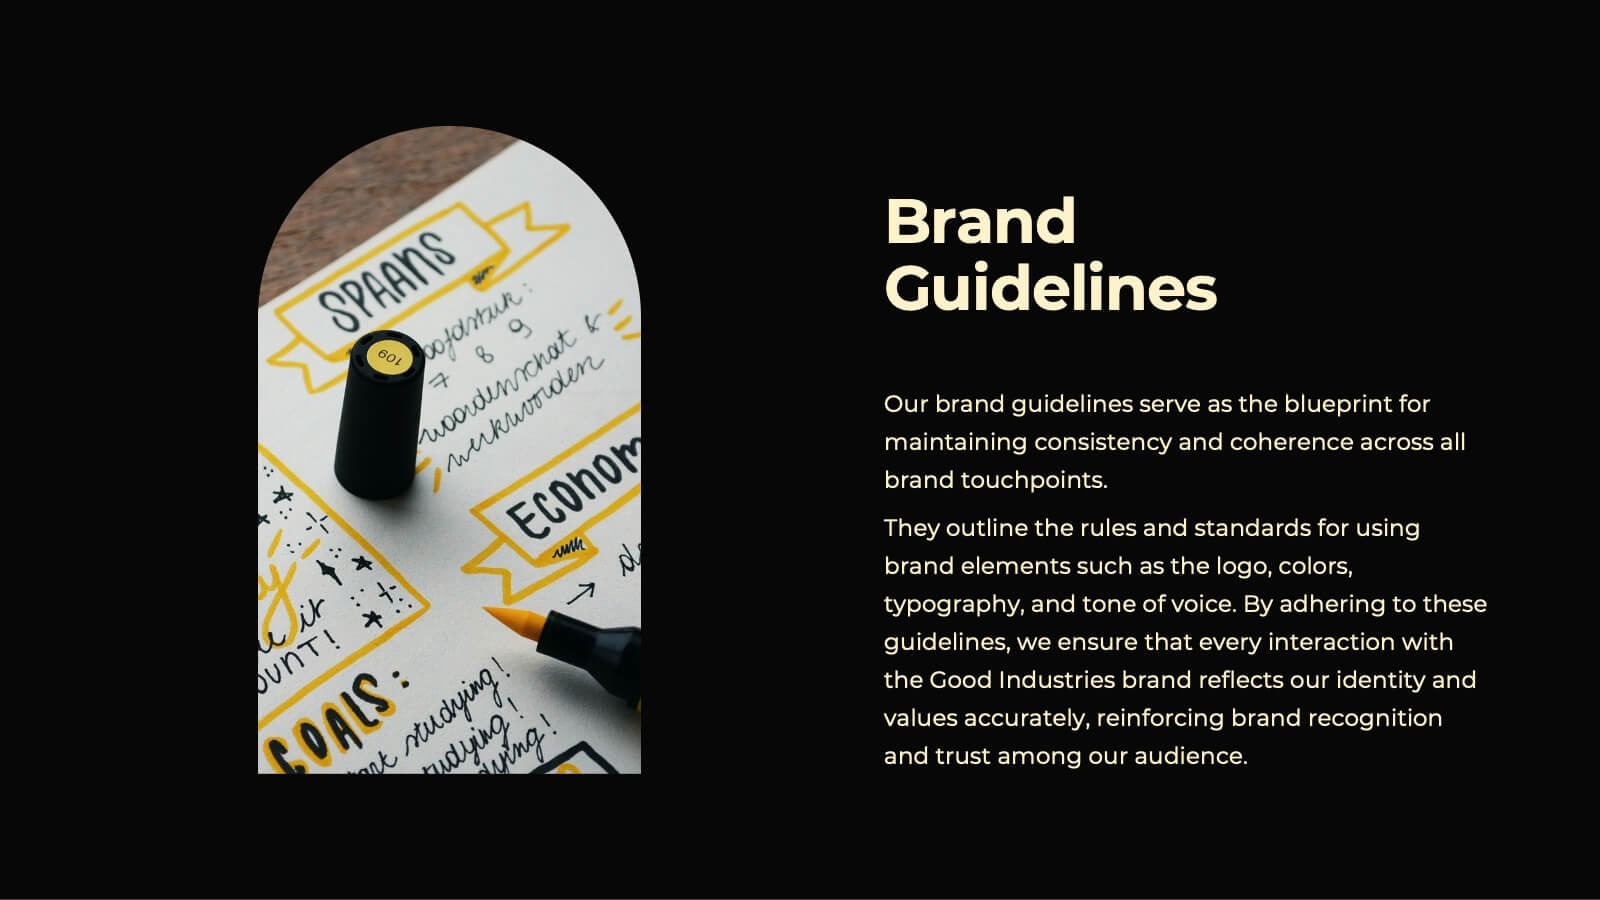
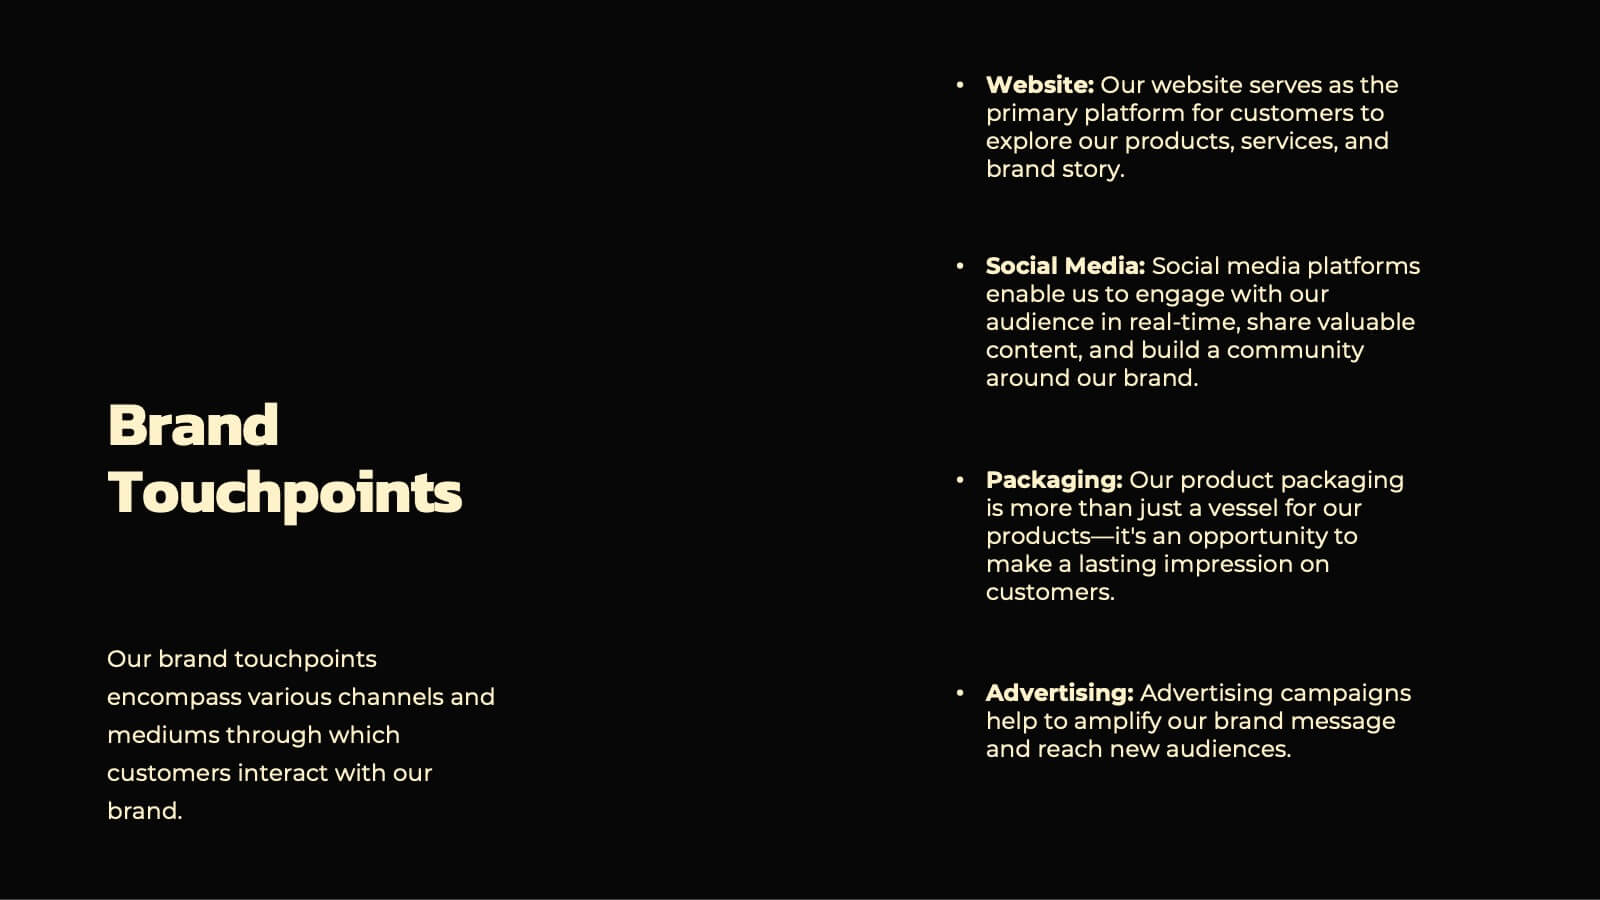
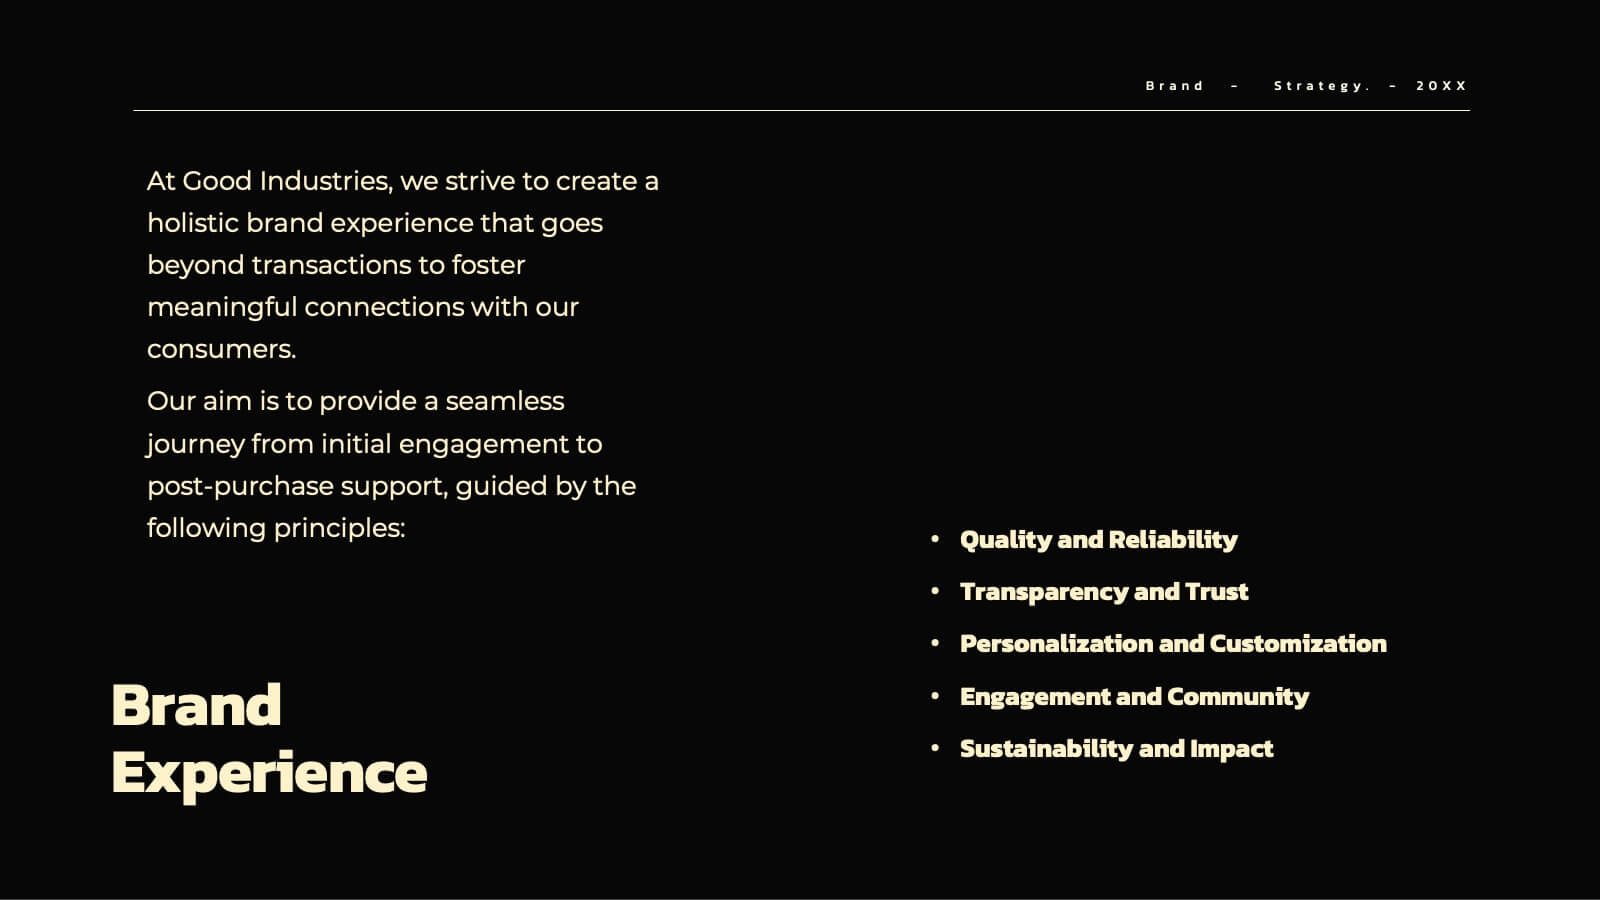
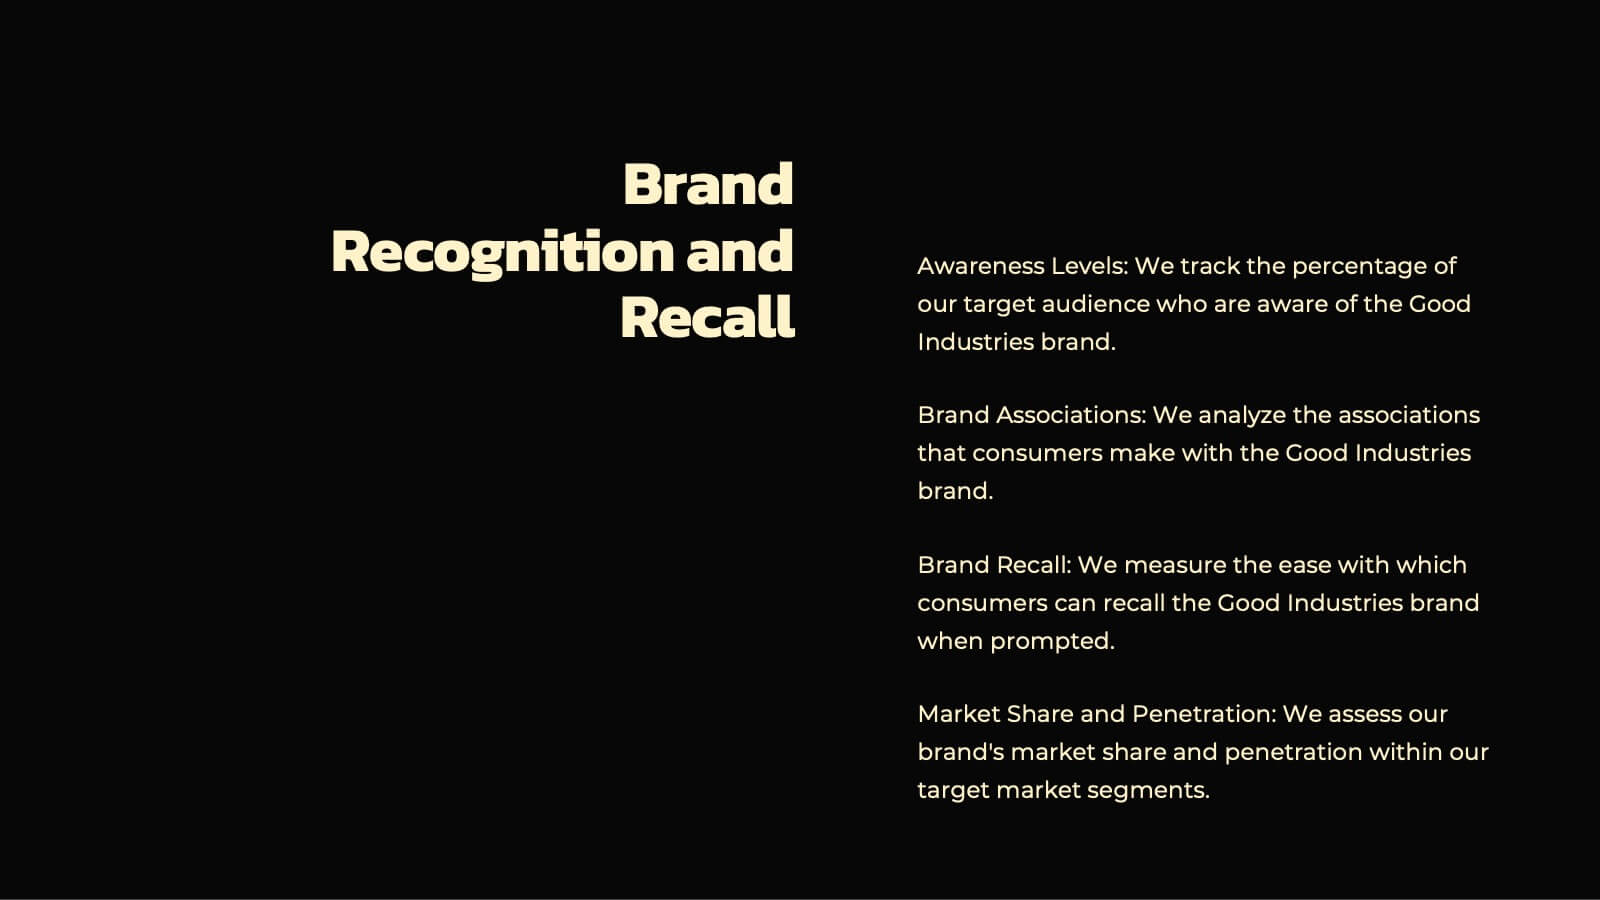
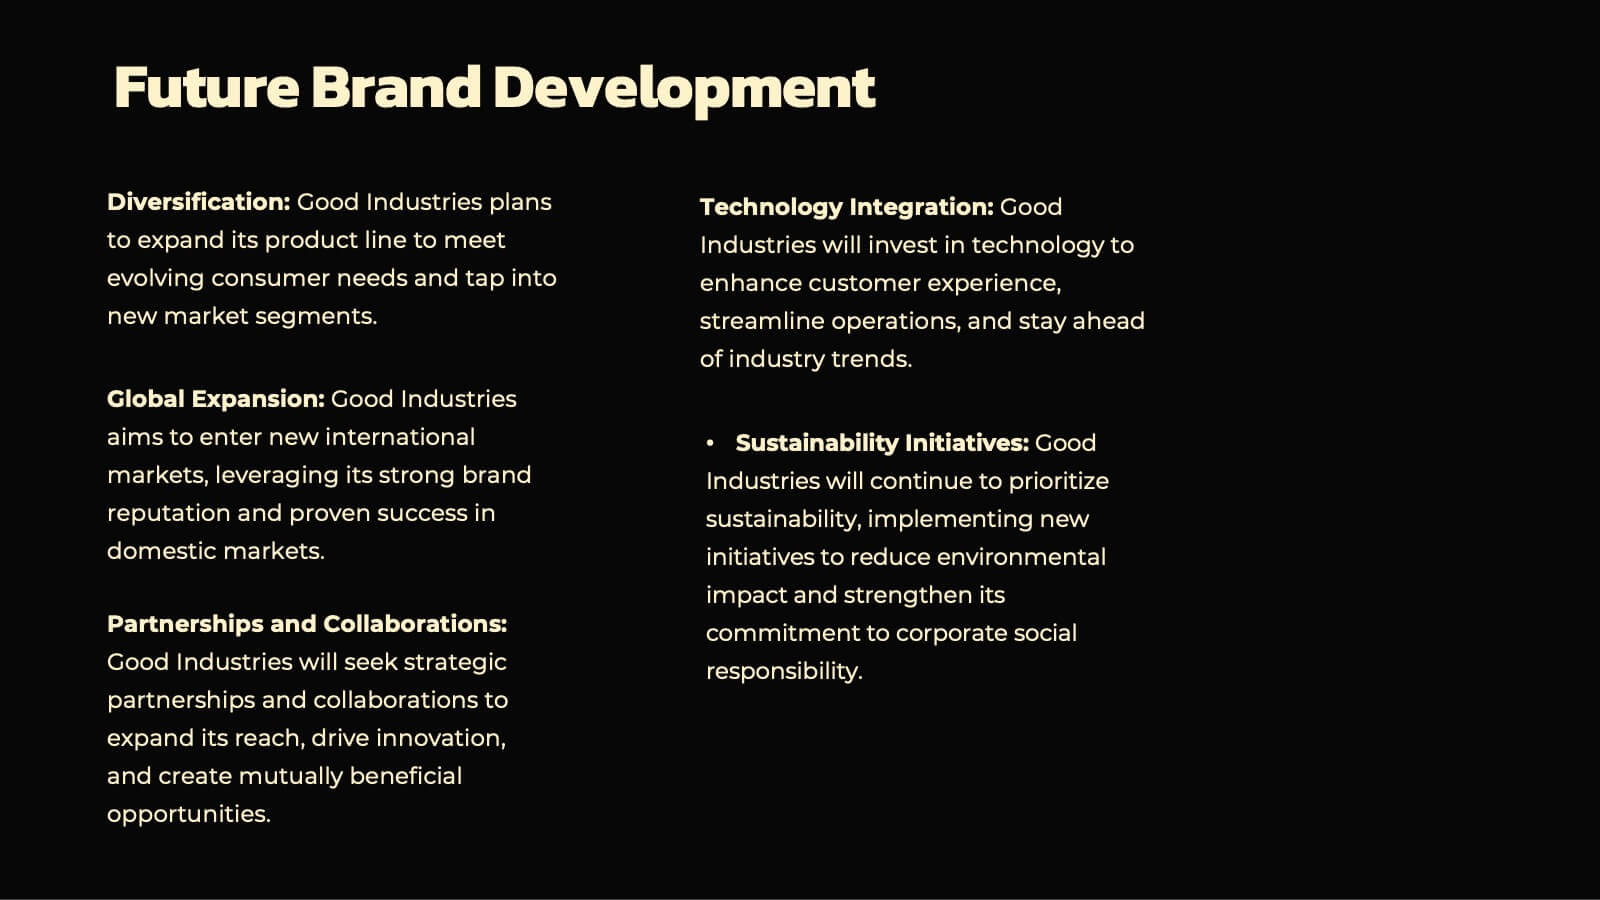
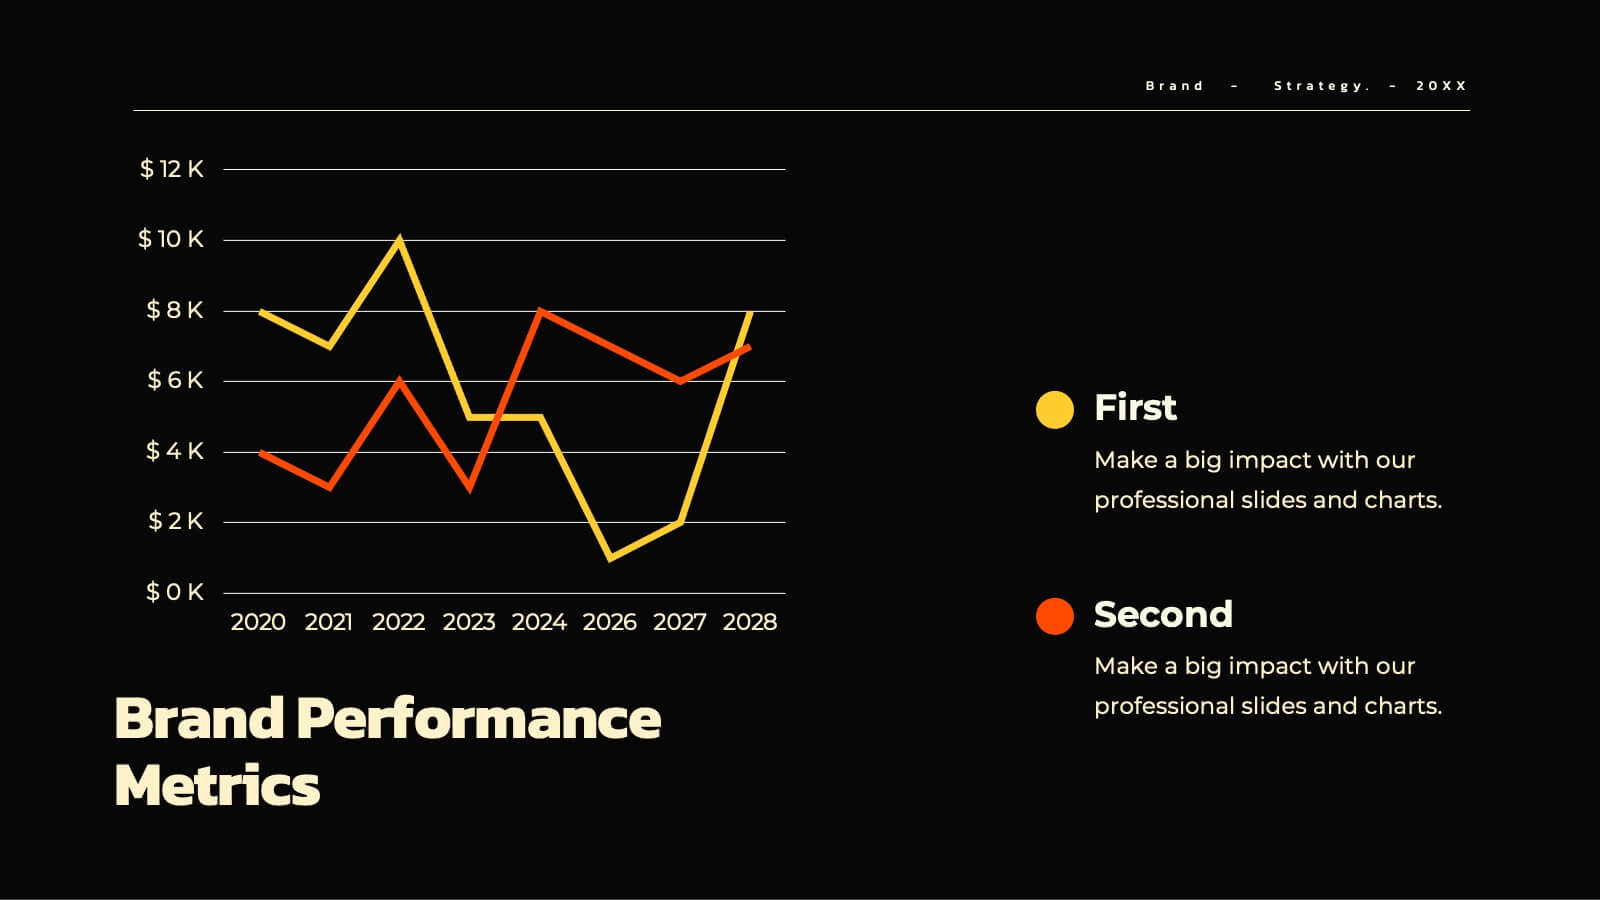
Aqua Brand Strategy Report Presentation
Make waves with this fresh, aqua-inspired presentation template, perfect for delivering a standout brand strategy report! Designed to help you showcase your brand's vision, market positioning, and strategic goals, it features a clean, modern layout that grabs attention. Compatible with PowerPoint, Keynote, and Google Slides for effortless customization.


21 diapositivas
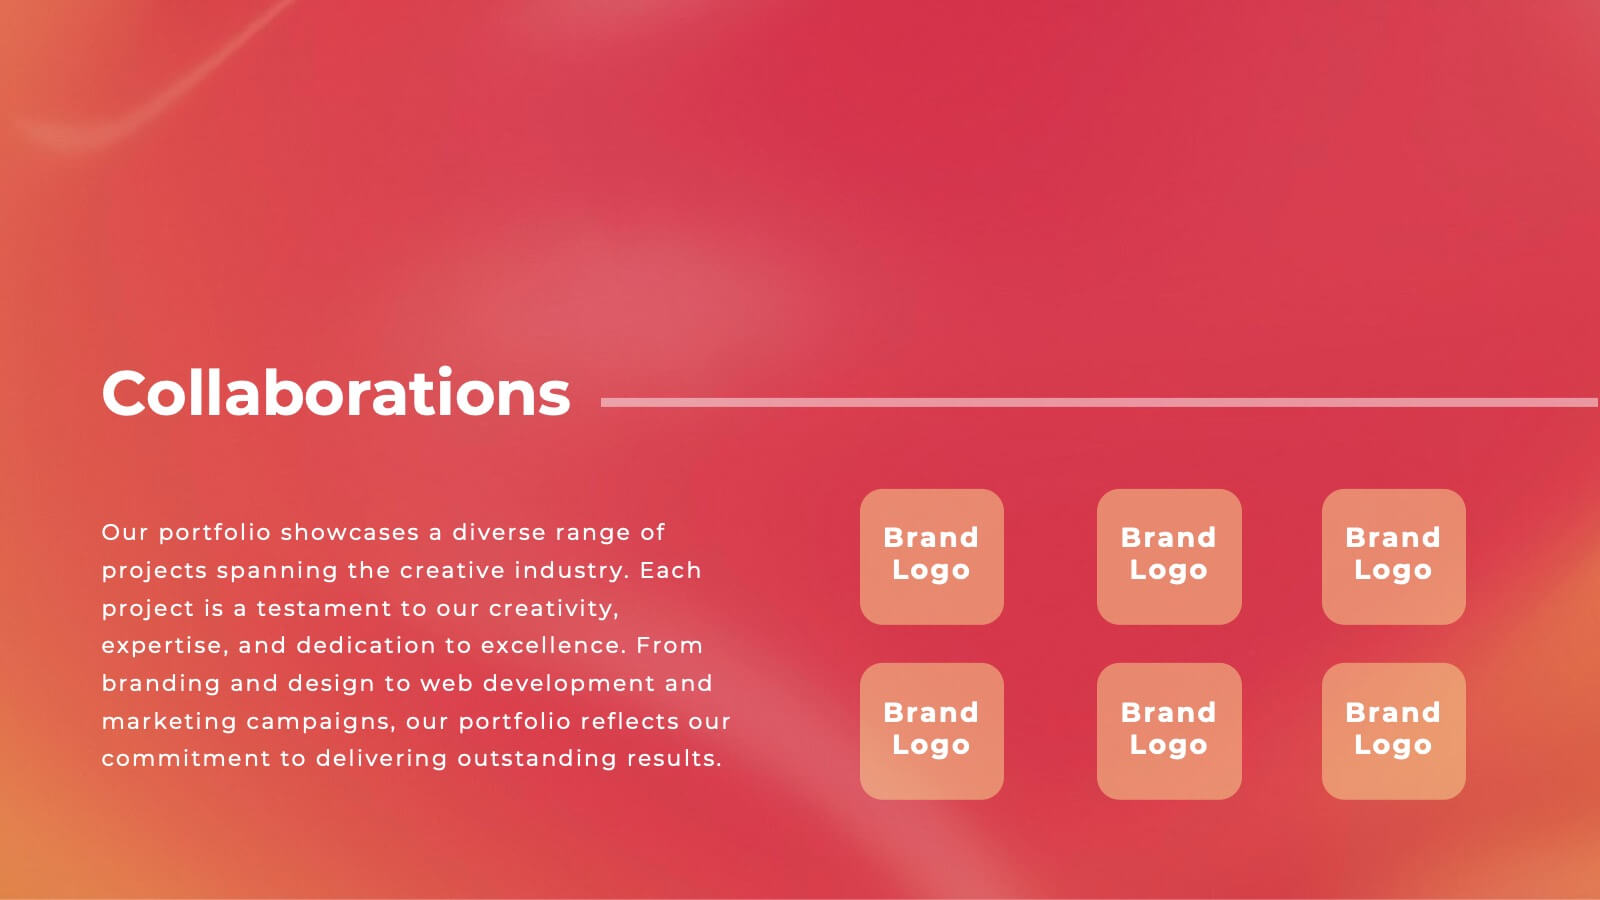
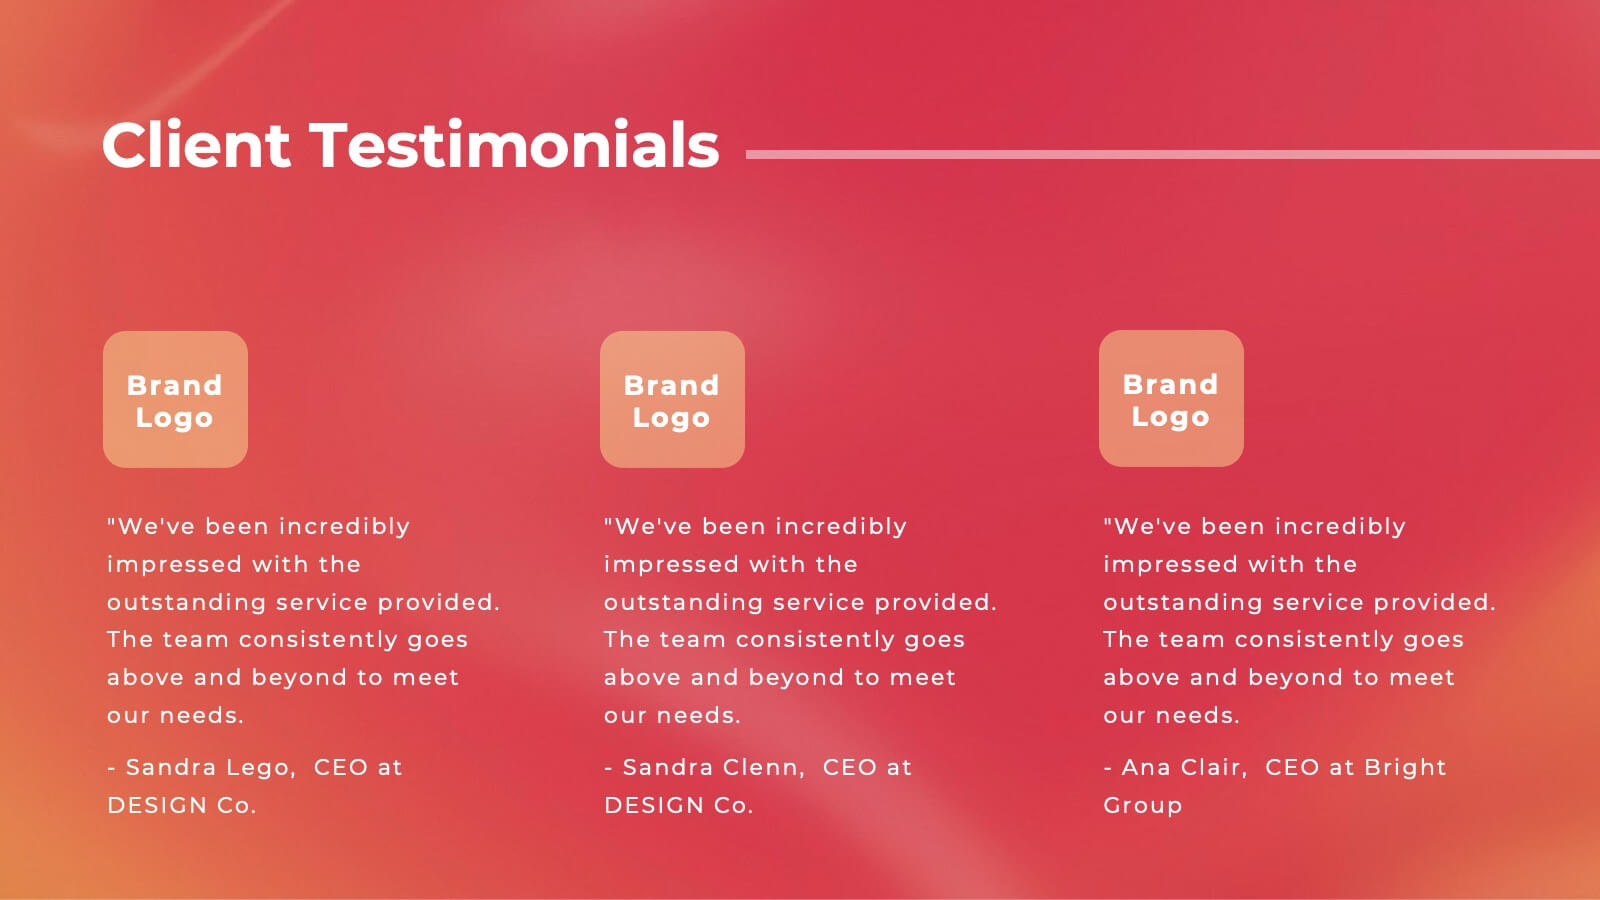
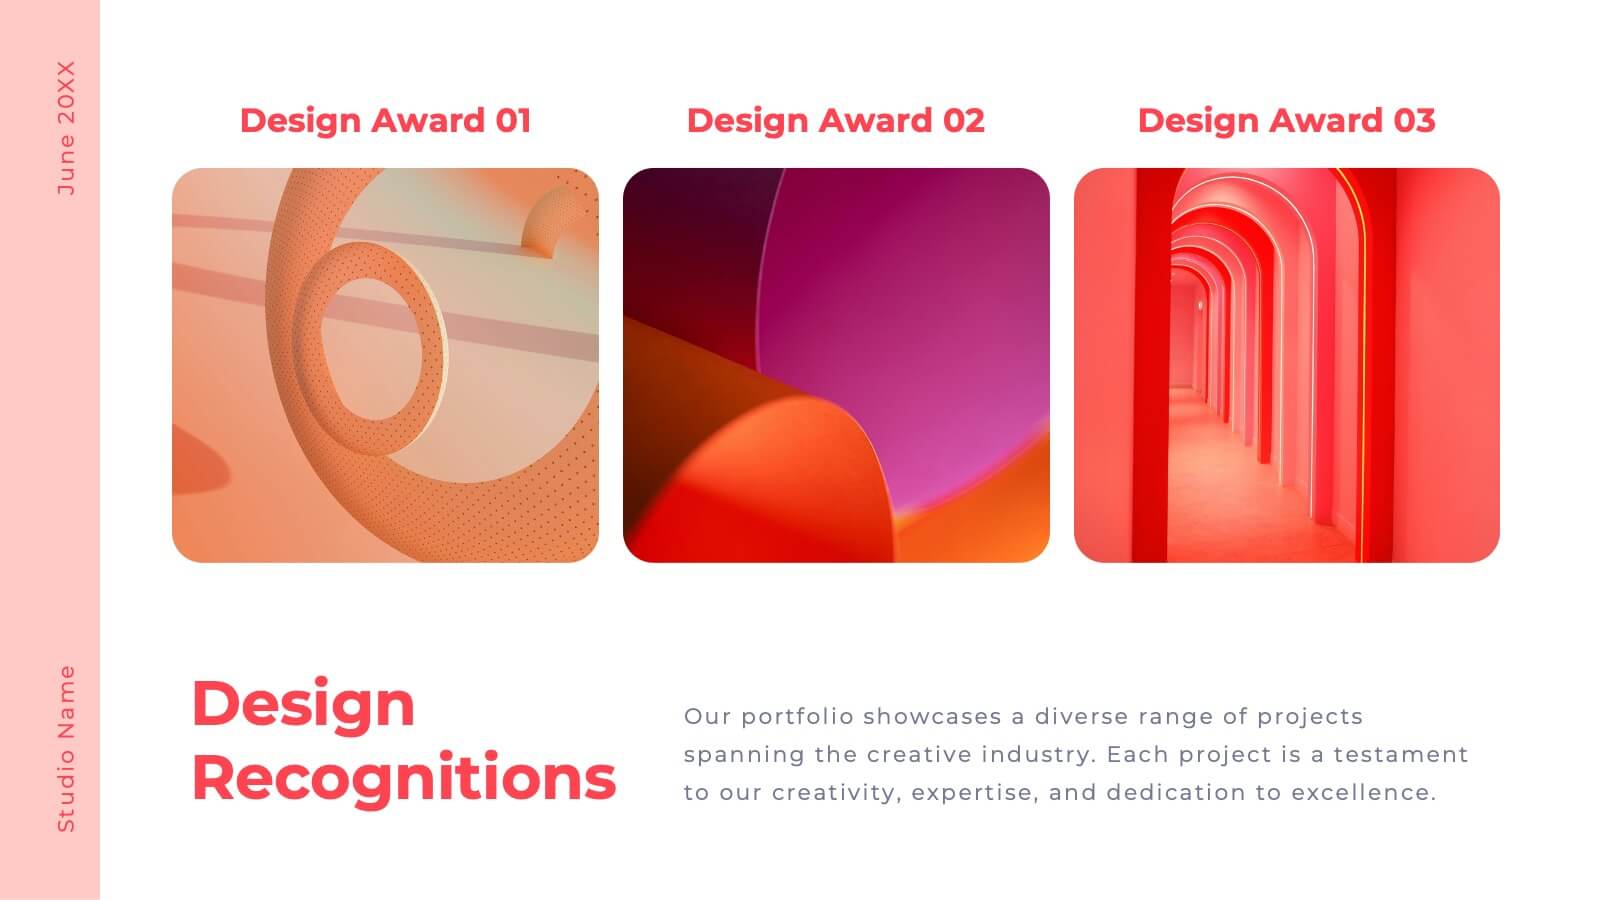
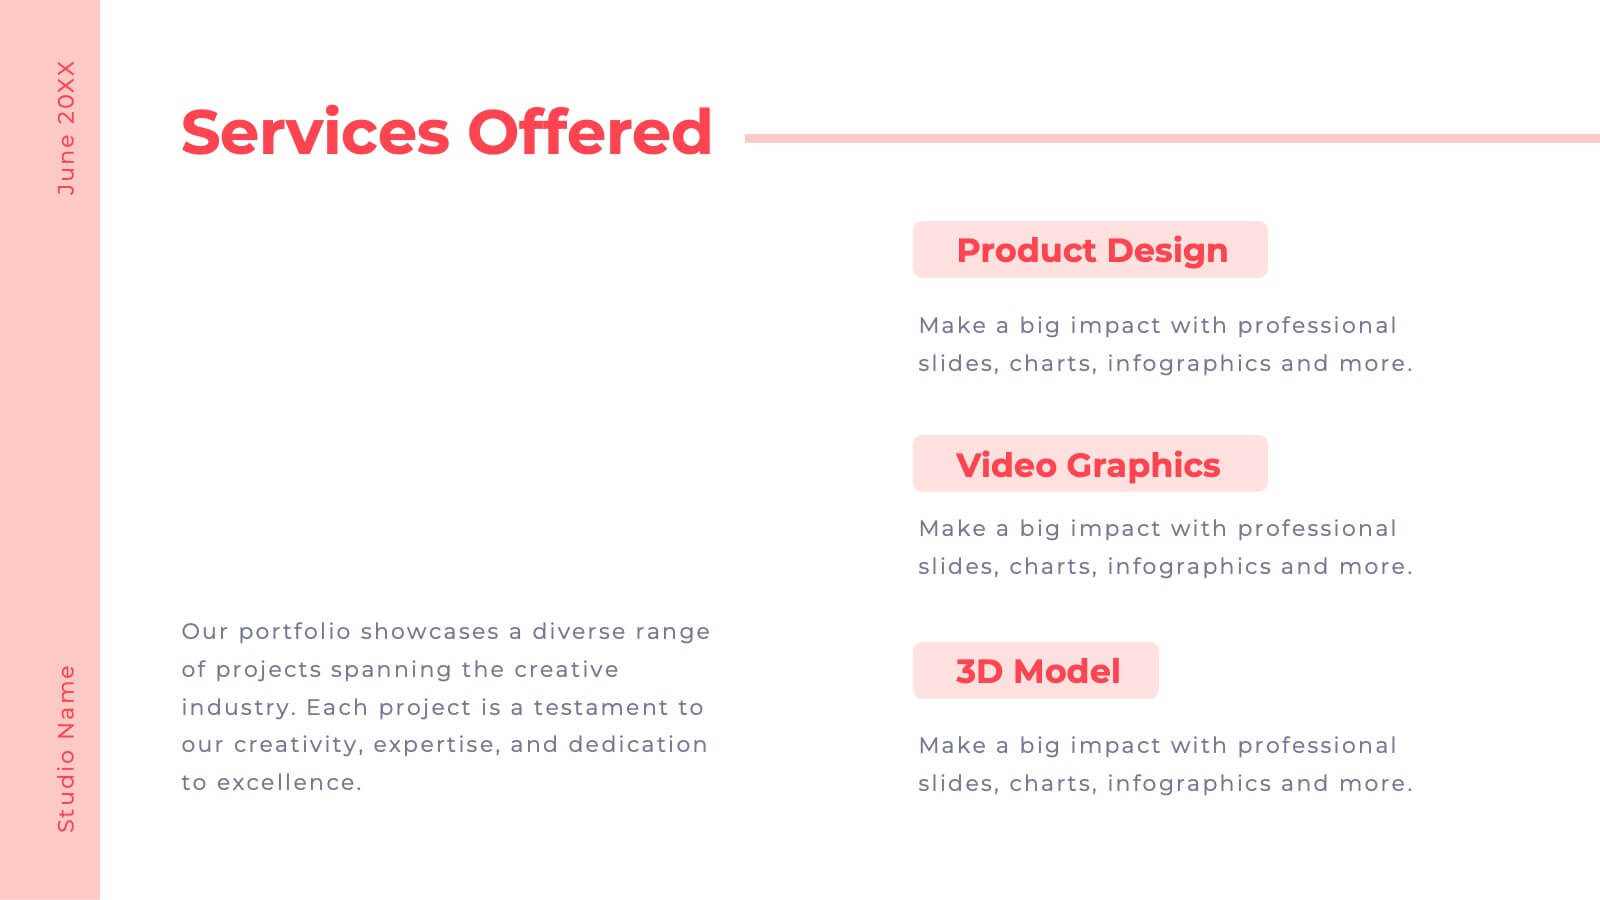
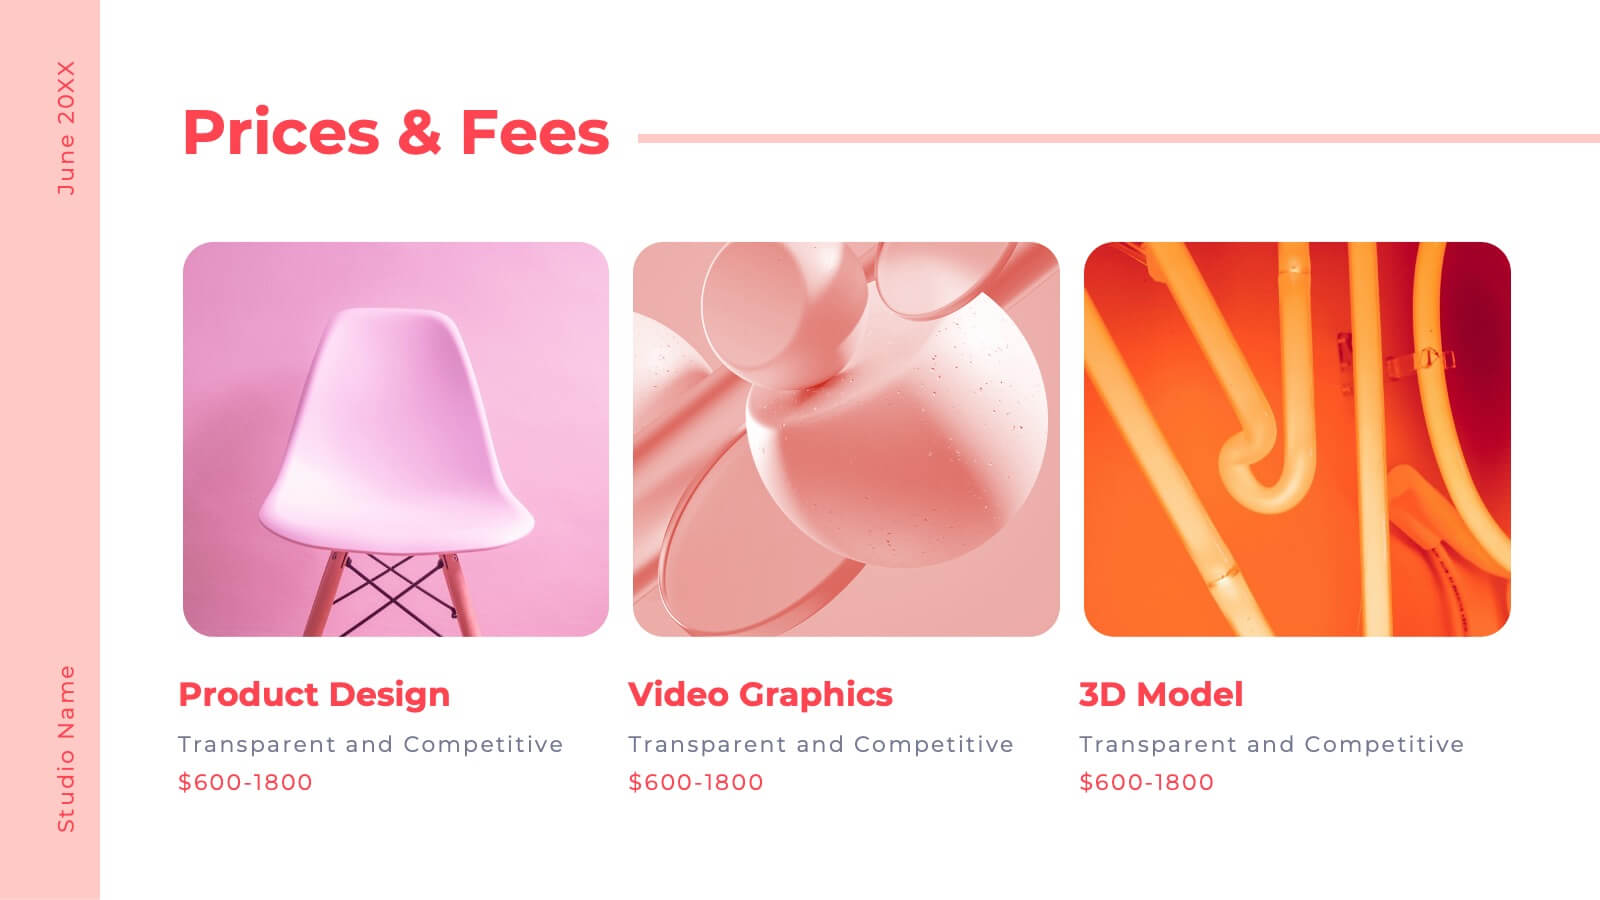
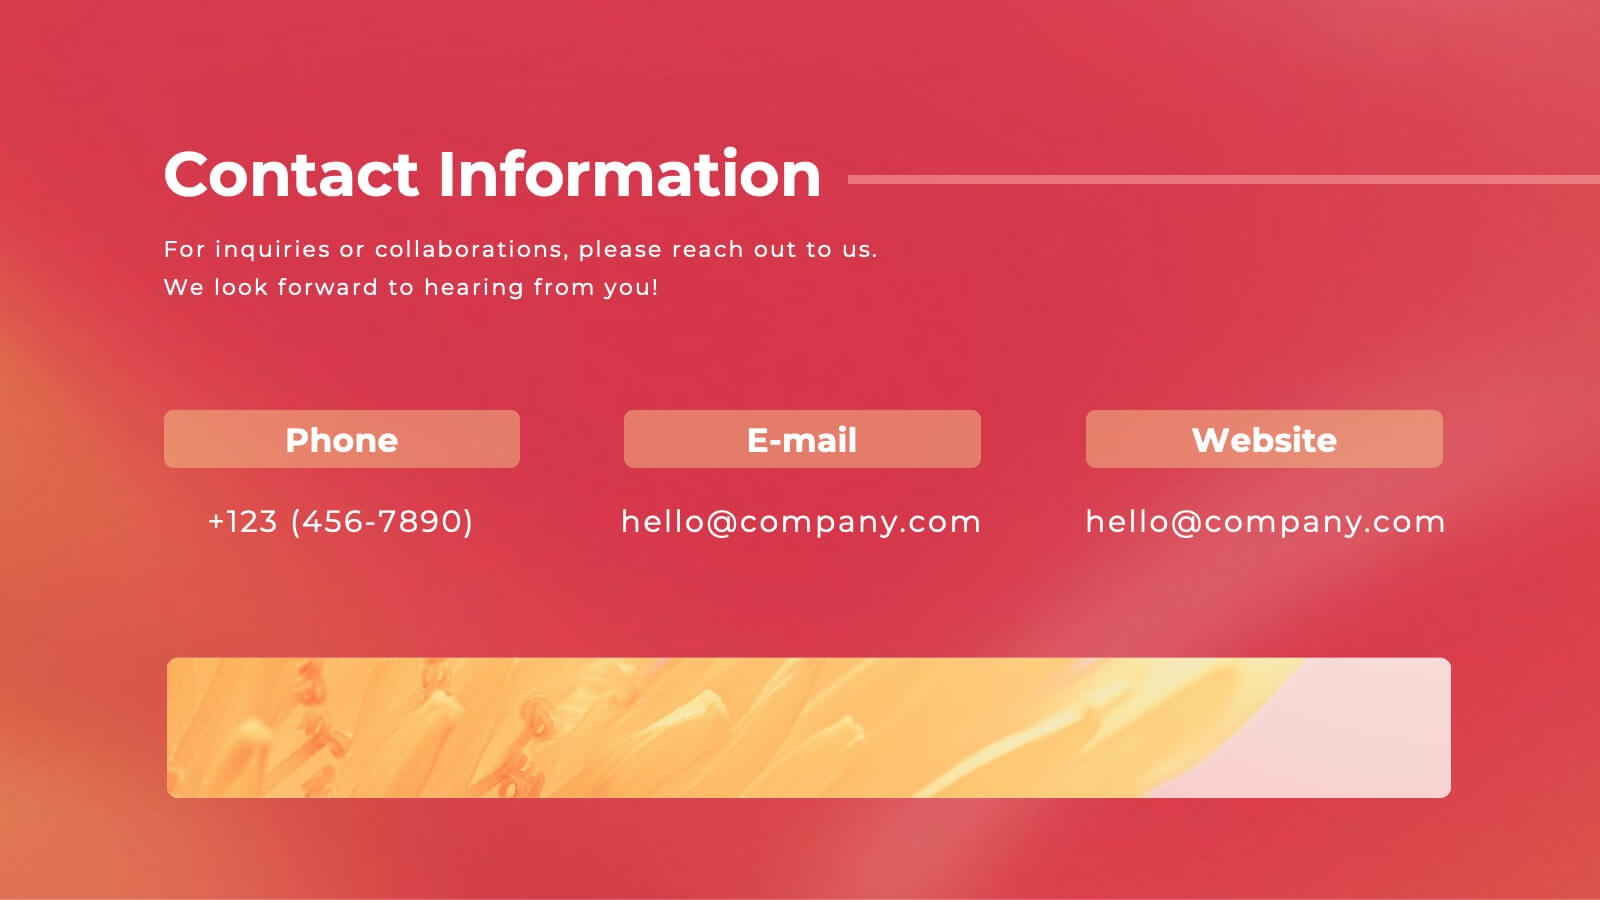
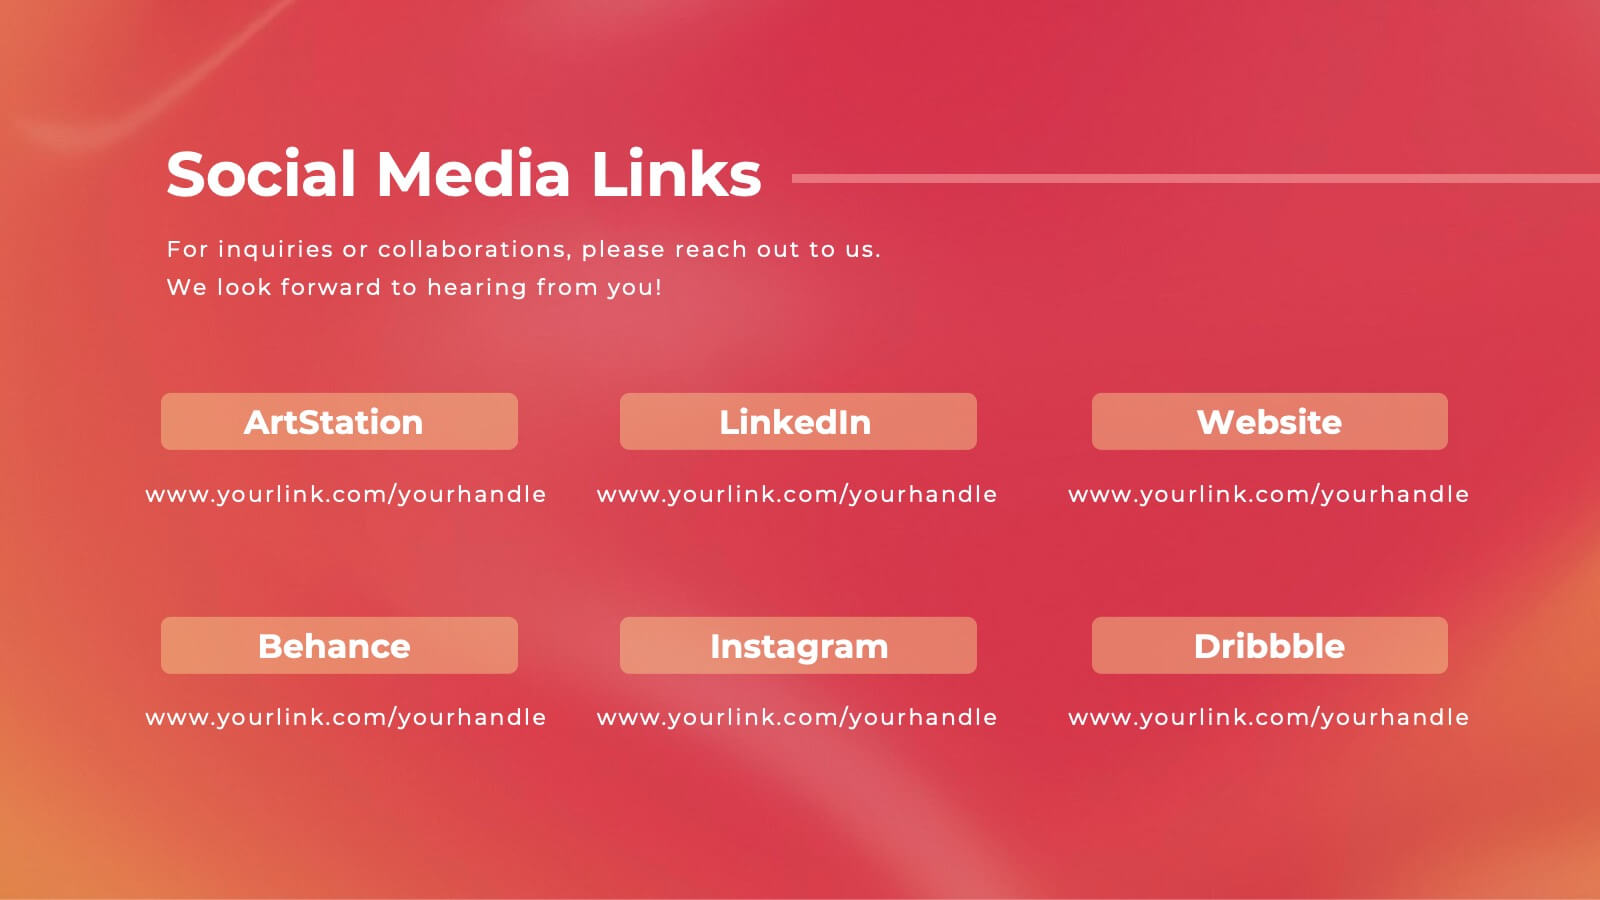
Inventra Creative Portfolio Presentation
Make a lasting impression with this sleek and modern creative portfolio presentation template. Perfect for showcasing your artistic journey, featured projects, unique style, and client testimonials. Highlight your creative process, pricing, and services with a bold and professional layout. Fully customizable in PowerPoint, Keynote, and Google Slides.
20 diapositivas
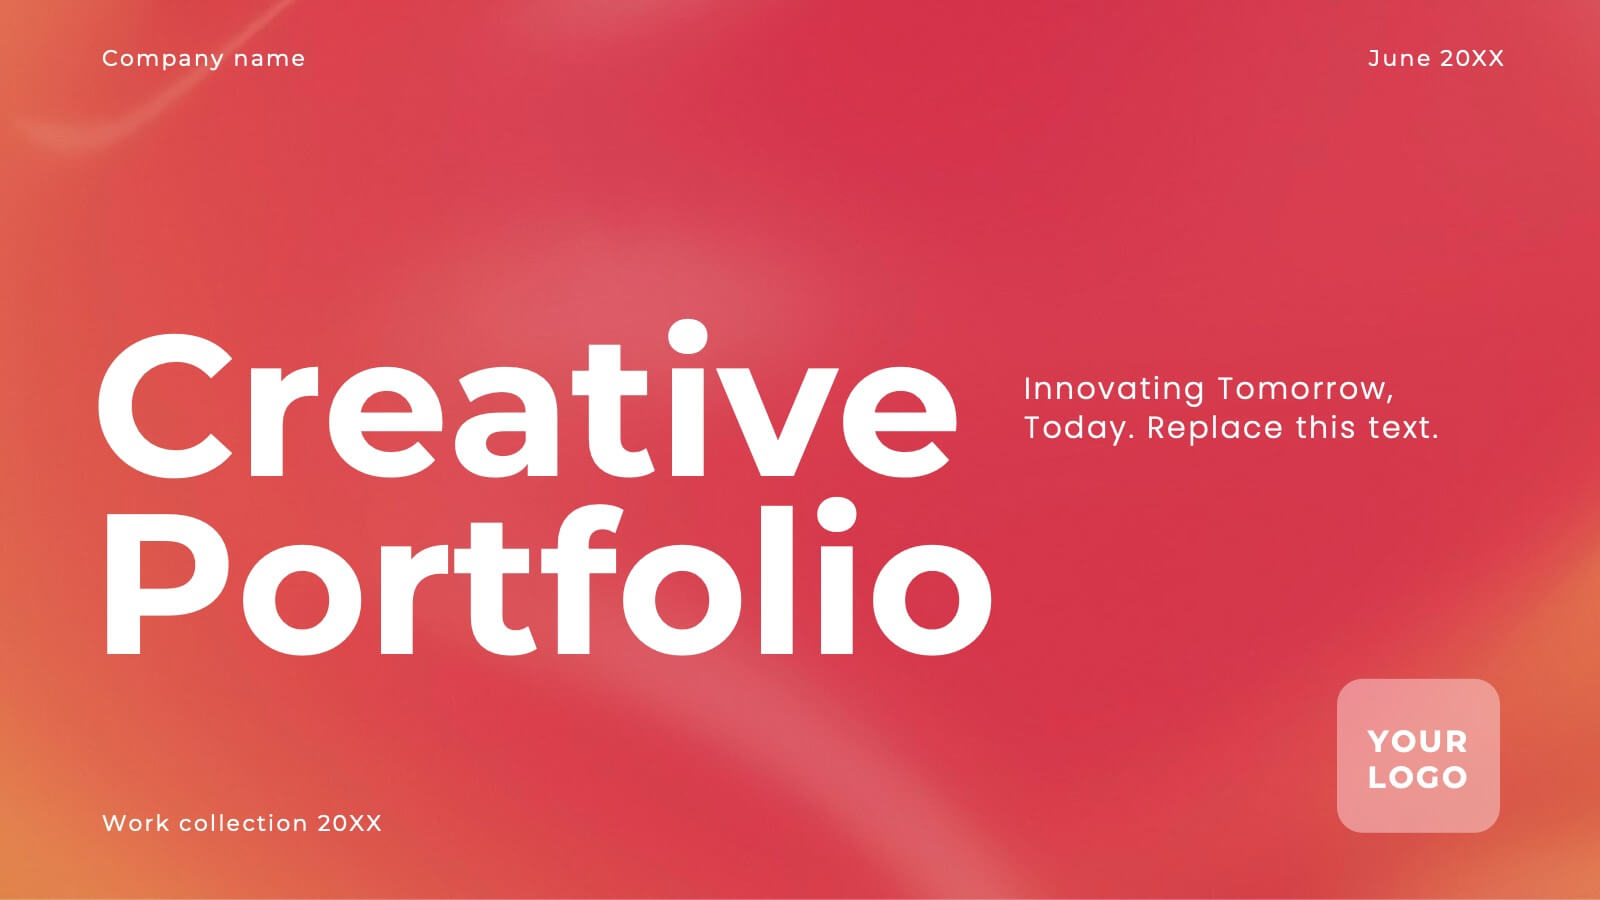
Valor Creative Portfolio Presentation
Step into creativity with this stunning portfolio template! Showcase your projects, design philosophy, and client testimonials with style and flair. Ideal for designers, artists, and creatives wanting to impress. Compatible with PowerPoint, Keynote, and Google Slides, this template elevates every portfolio to new heights. Perfect for making a lasting impact.
6 diapositivas
Investment Insights and Budget Tracker Presentation
Stay on top of your financial strategy with the Investment Insights and Budget Tracker Presentation. This slide layout organizes six financial metrics or priorities into clear, color-coded blocks—ideal for summarizing investment options, budget breakdowns, or cost categories. Perfect for finance teams, analysts, or consultants. Fully editable in Canva, PowerPoint, Google Slides, and Keynote.


6 diapositivas
Venn Diagram
A Venn diagram is a visual representation of the relationships between different sets or groups. This infographic template consists of overlapping circles, each representing a specific set, and the overlapping parts indicates the elements that belong to multiple sets. Use this infographic to illustrate the relationships between different sets of data or concepts. The main components of the infographic are the circles or ellipses that represent the sets being compared. The size and position of the circles can be adjusted to reflect the data accurately. This infographic is fully customizable and compatible with Powerpoint, Keynote, and Google Slides.


7 diapositivas
Puzzle Communication Infographic
Piece together the art of effective communication with our puzzle communication infographic. Set on a sleek white foundation, complemented by the enigma of purple, the zest of orange, and the passion of red, this template ingeniously utilizes puzzle pieces to symbolize interconnected communication elements. Enhanced with inventive infographics, representative icons, and adjustable image placeholders, it offers a comprehensive exploration of communication dynamics. Exquisitely crafted for Powerpoint, Keynote, or Google Slides. An indispensable tool for communication specialists, team leads, trainers, or anyone keen on enhancing interpersonal exchanges.


6 diapositivas
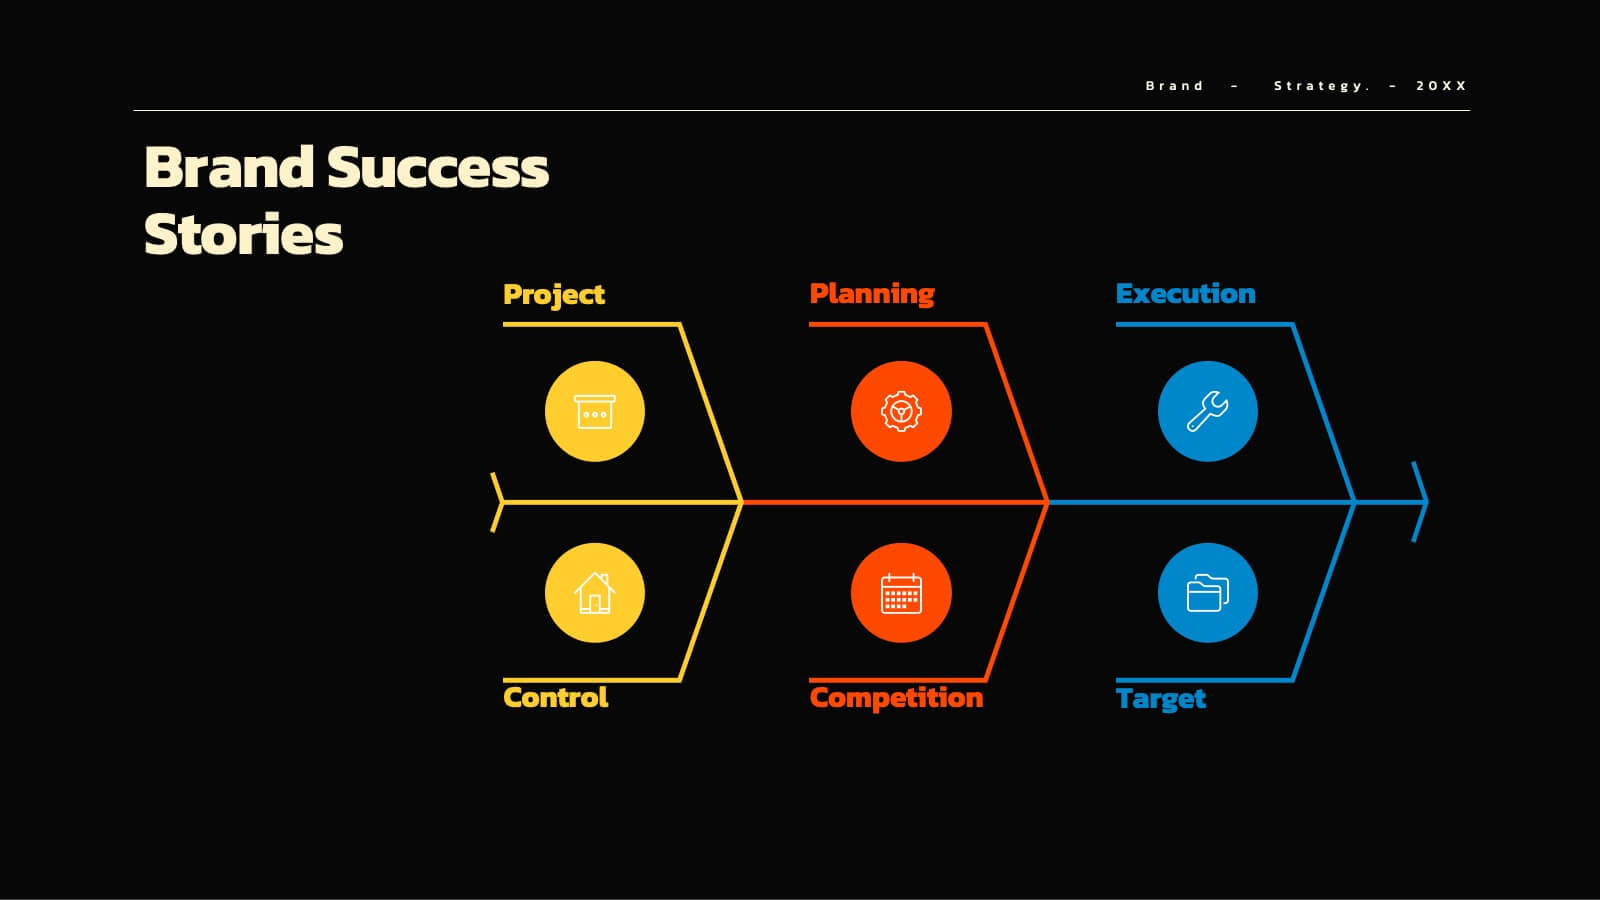
Root Cause Investigation Framework Presentation
Uncover the "why" behind your challenges with the Root Cause Investigation Framework Presentation. Designed around the classic fishbone (Ishikawa) diagram, this slide helps teams visually identify and organize contributing factors across multiple categories. With editable sections and bold color coding, it’s ideal for quality management, Six Sigma, and process improvement. Compatible with PowerPoint, Keynote, and Google Slides.