


Características


¿Tienes alguna pregunta?
Recomendar


4 diapositivas
Marketing Campaign Action Plan Presentation
Drive impactful marketing results with the Marketing Campaign Action Plan presentation. This structured and visually engaging template helps you outline campaign objectives, key strategies, and execution steps in a clear, step-by-step format. Designed for marketers, strategists, and business teams, this fully editable slide ensures seamless planning and tracking of marketing initiatives. Compatible with PowerPoint, Keynote, and Google Slides.


7 diapositivas
Strategic Solution Framework
Present your business strategies clearly with this strategic solution framework slide. Designed with a semi-circular puzzle diagram, it’s perfect for showcasing interconnected solutions, phased plans, or collaborative initiatives. Ideal for business meetings, consulting proposals, and corporate strategy sessions. Fully editable and compatible with PowerPoint, Keynote, and Google Slides.


4 diapositivas
Efficient Workflow Management Presentation
Optimize productivity with the Efficient Workflow Management template, designed to streamline processes and improve task coordination. Ideal for project managers, teams, and businesses, this template visually maps workflows, helping to identify bottlenecks and enhance efficiency. Fully customizable and compatible with PowerPoint, Keynote, and Google Slides for seamless presentations.


6 diapositivas
Europe Regions Infographic
Europe is a diverse continent with various regions that have their own unique characteristics and cultural identities. This infographic provides an overview of the different regions in Europe. It is designed to help viewers understand the diverse geography, culture, and characteristics of each region within Europe. The template features a map of Europe that highlights the various regions. Viewers can easily identify and explore each region on the map. The template includes slides dedicated to providing key information such as capital cities and major landmarks. The template incorporates statistical data to showcase key facts and figures about each region.


8 diapositivas
Early Detection and Prevention of Breast Cancer Presentation
Take a proactive approach to health with the Early Detection and Prevention of Breast Cancer template, designed to emphasize essential awareness and prevention strategies. This template, compatible with PowerPoint, Keynote, and Google Slides, uses intuitive icons and a clean design to effectively communicate key prevention measures and screening importance, ideal for healthcare seminars and community health initiatives.


6 diapositivas
Alphabet Infographic and Typography Layout Presentation
Showcase key information with visual flair using this Alphabet Infographic and Typography Layout. The bold letter "A" is constructed from geometric shapes, each linked to editable text areas—ideal for presenting 6 grouped ideas or segmented data. Fully compatible with PowerPoint, Canva, and Google Slides. Perfect for modern, clean presentations.


6 diapositivas
Community Ecology Infographic
Ecology is the scientific study of the interactions between organisms and their environment. This infographic template is an informative representation of the interactions and relationships among different species in a specific ecological community. It highlights the key concepts and principles of community ecology, helping the audience understand the intricate connections that exist in nature. This infographic features an illustration of a diverse ecosystem, showcasing various plants, animals, and microorganisms that coexist within the community. The illustration visually represents the complexity and diversity of the community.


7 diapositivas
Solutions to Problems Infographic
These slides are designed to outline and explore solutions to identified problems in a clear and effective manner. Each slide uses a clean layout with a consistent color theme that enhances readability and focus. They effectively combine text and graphical elements to showcase problem-solving strategies, making the slides ideal for business presentations or strategic meetings. The inclusion of icons and diagrams aids in visualizing the problem-solving process, and the structured design ensures that the information is presented in a logical sequence. This approach not only aids in communicating the solutions effectively but also engages the audience by making complex information easier to understand. These templates can be adapted for various industries and scenarios, where clear communication of problem-solving steps is crucial. They are especially useful for team discussions, stakeholder presentations, and strategic planning sessions.


22 diapositivas
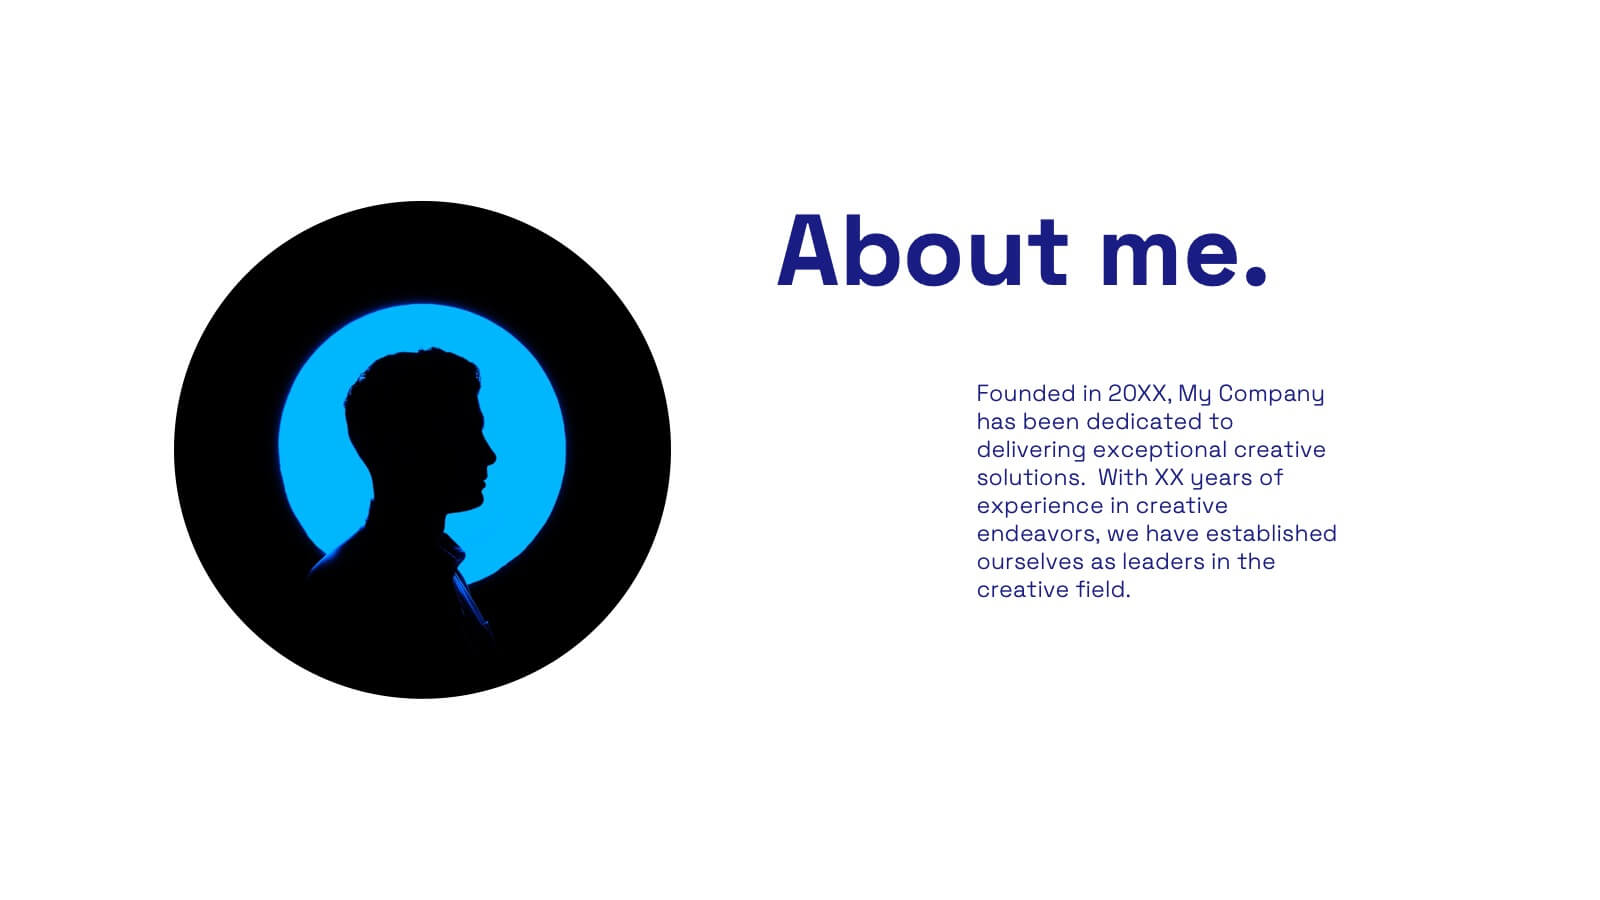
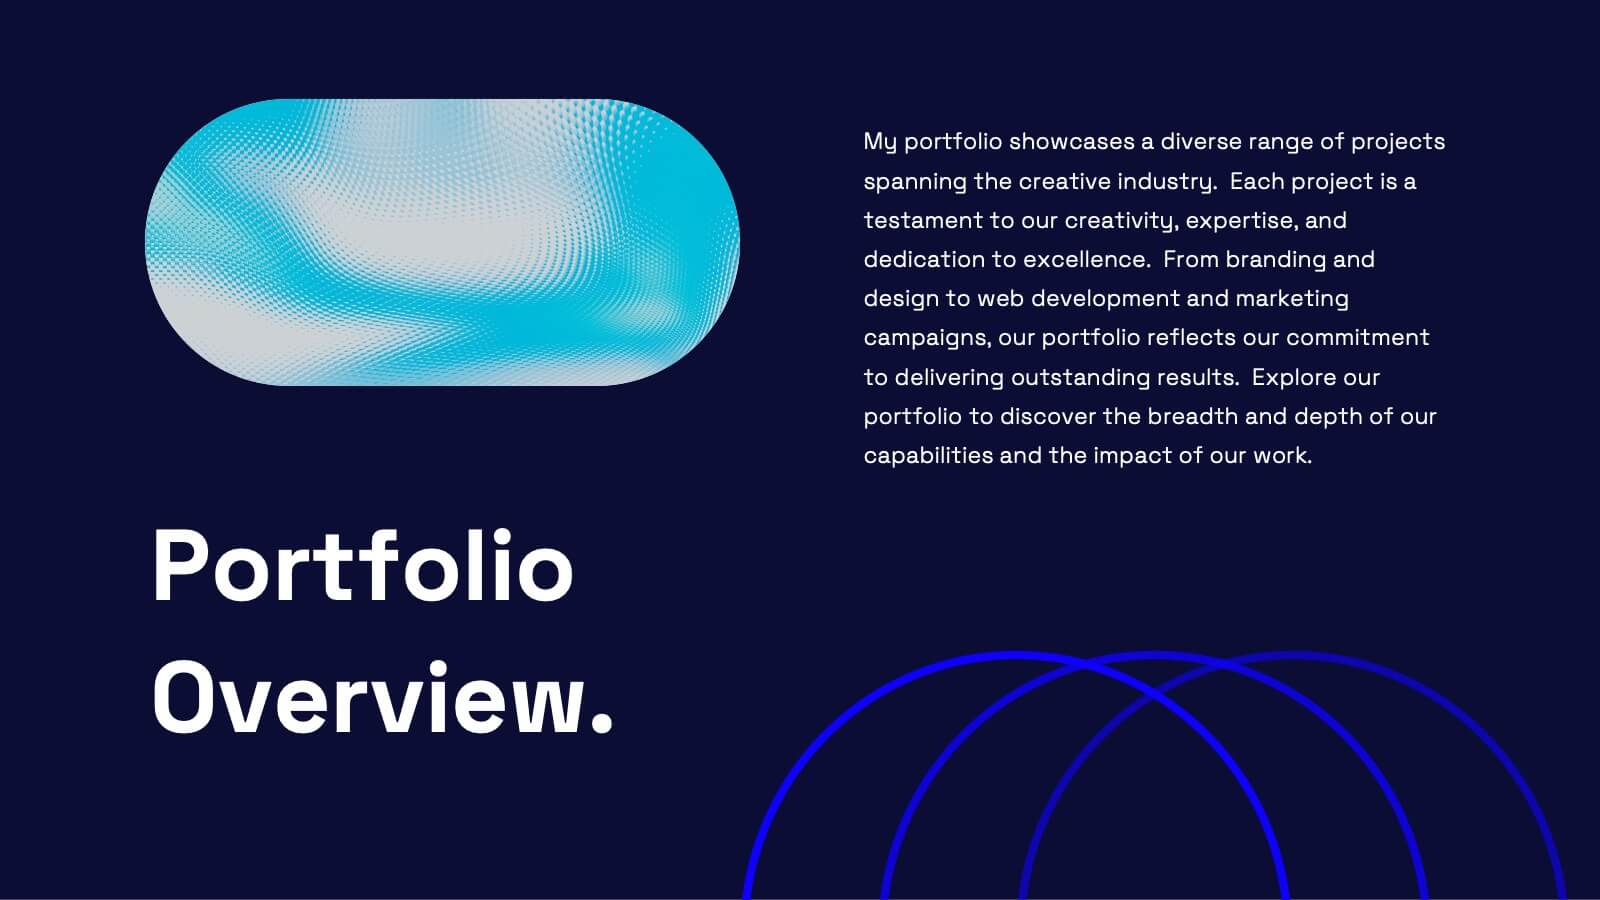
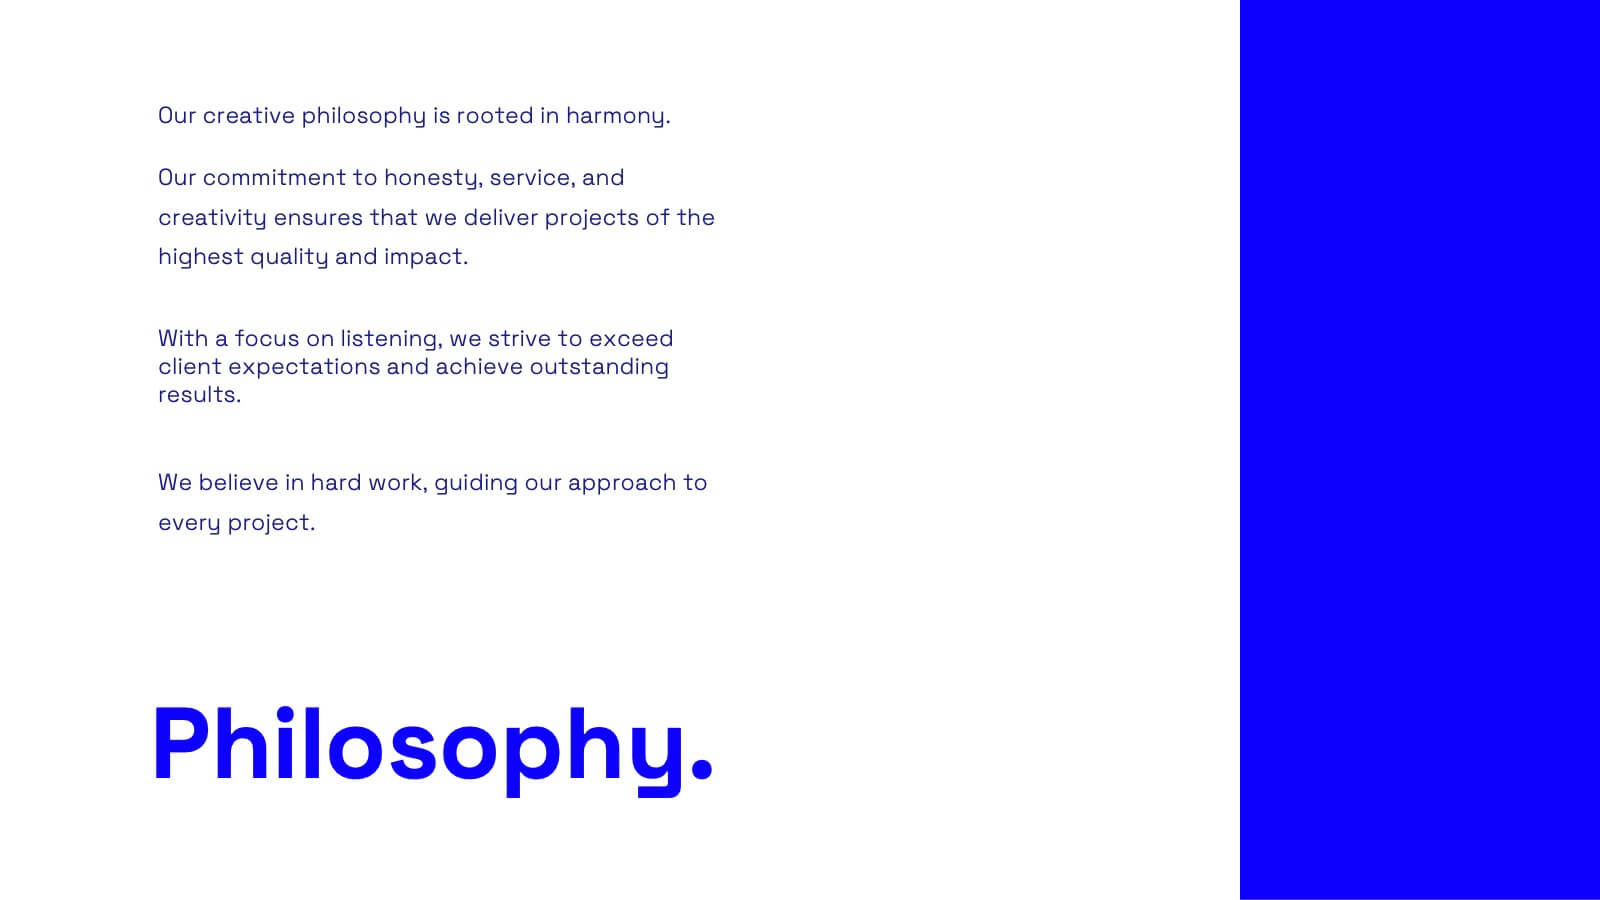
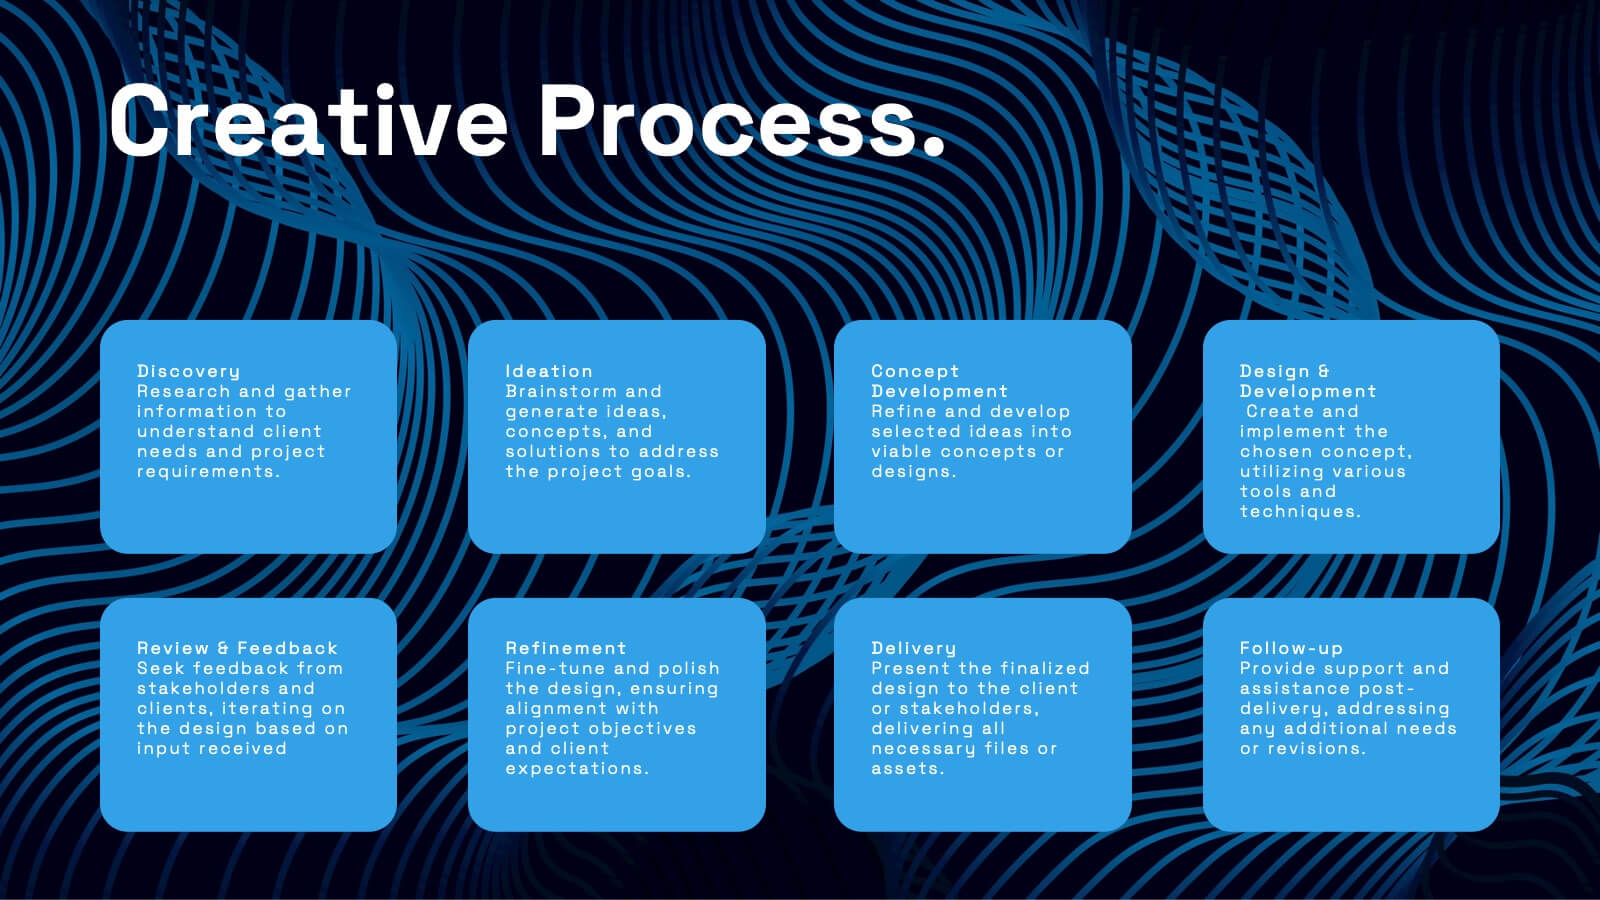
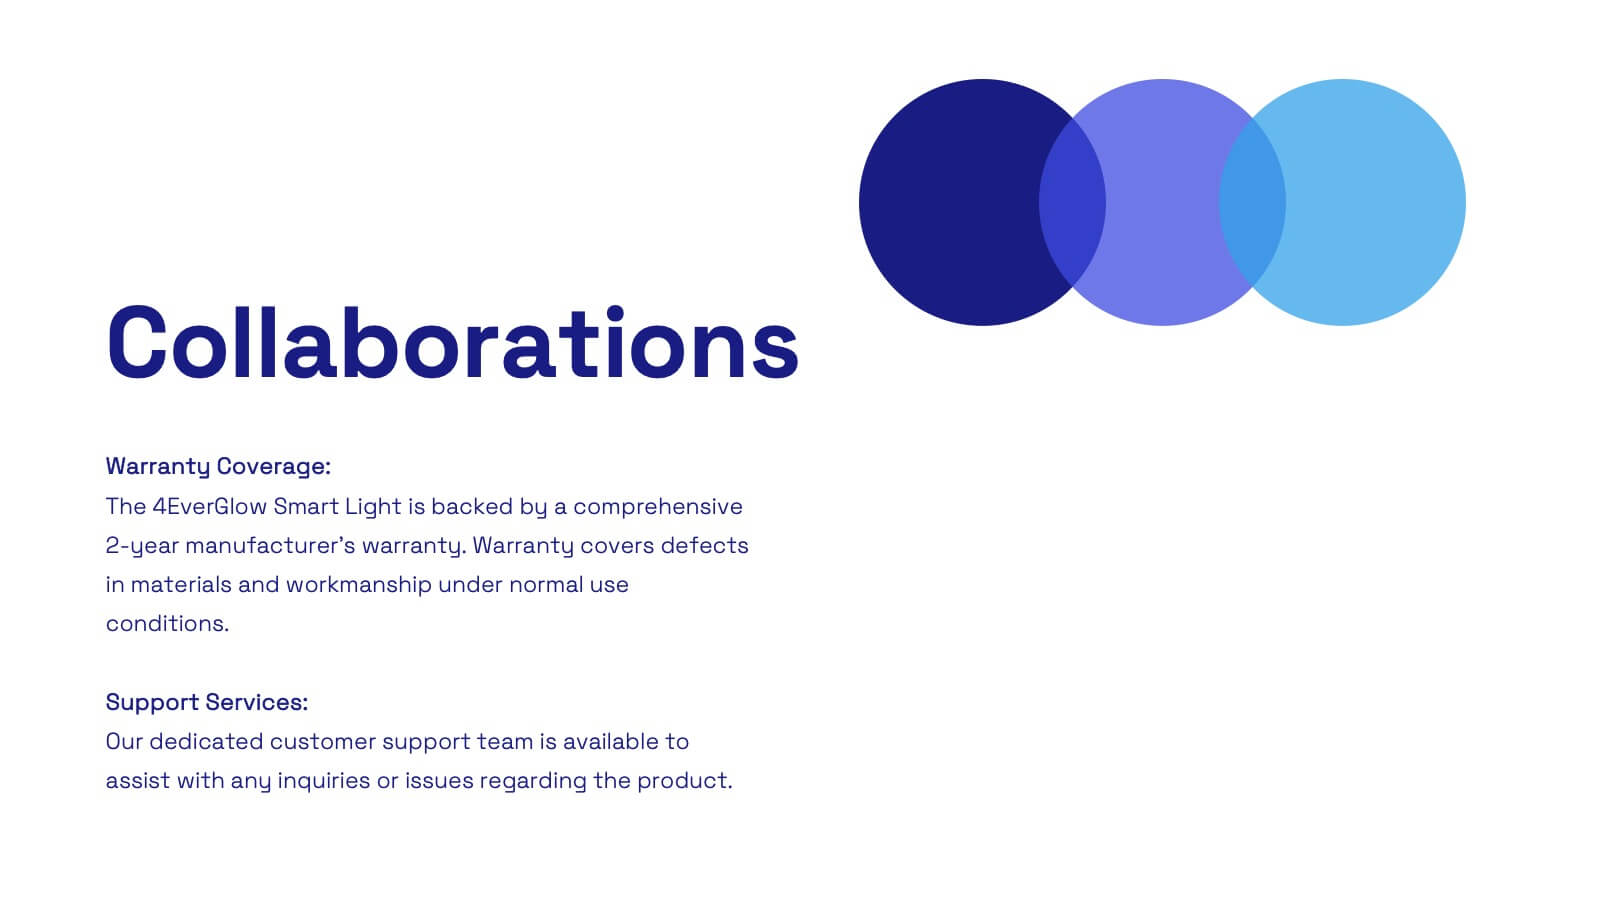
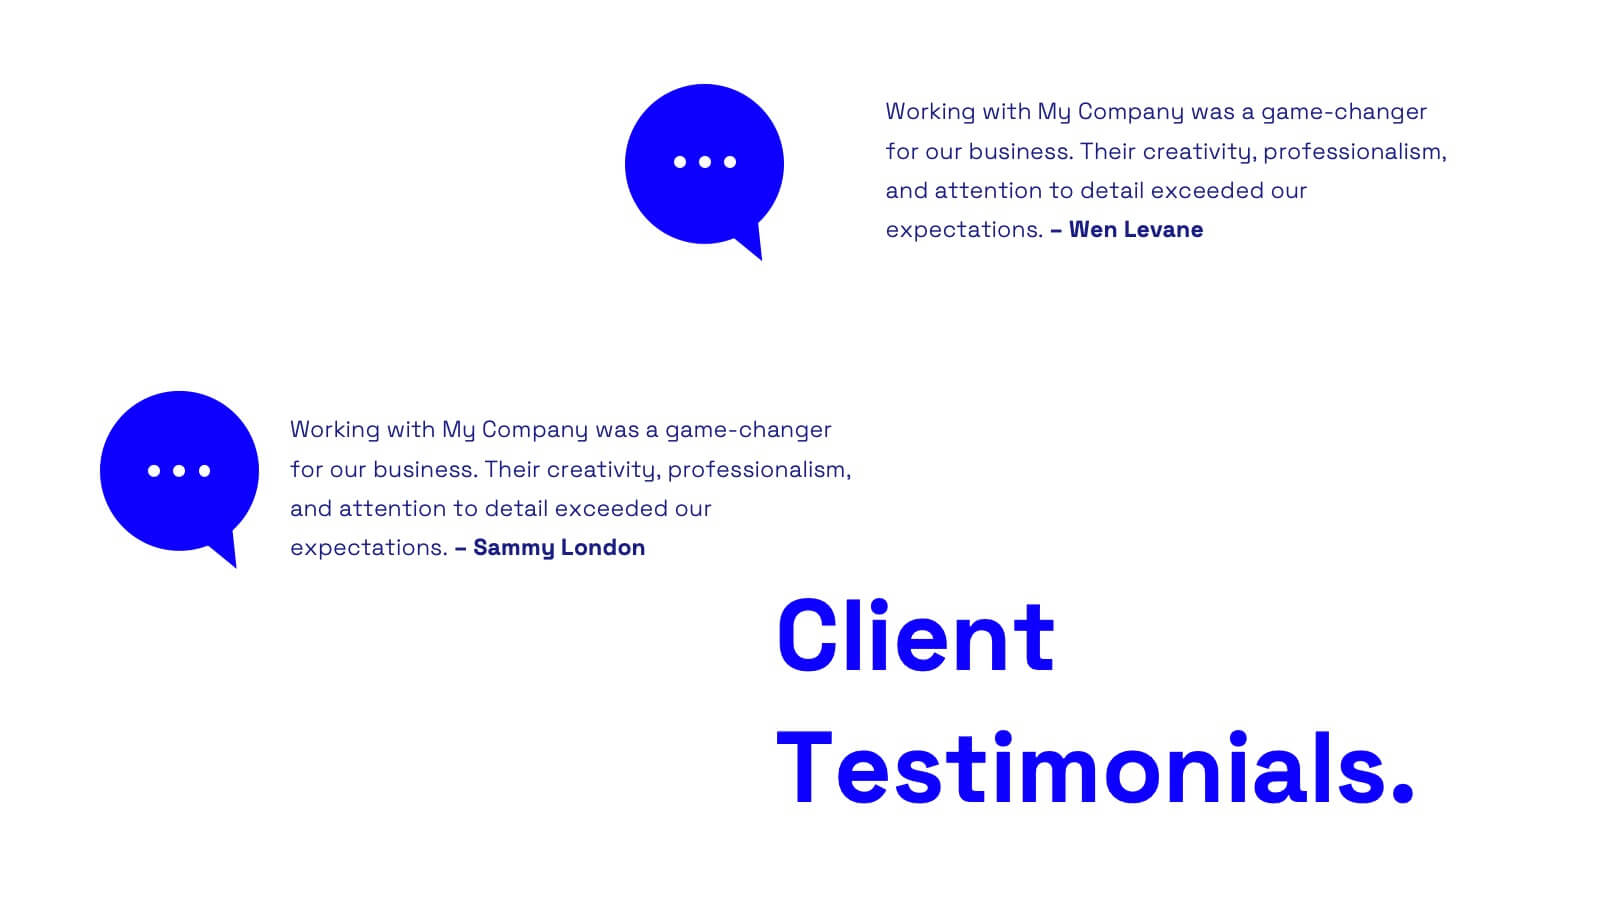
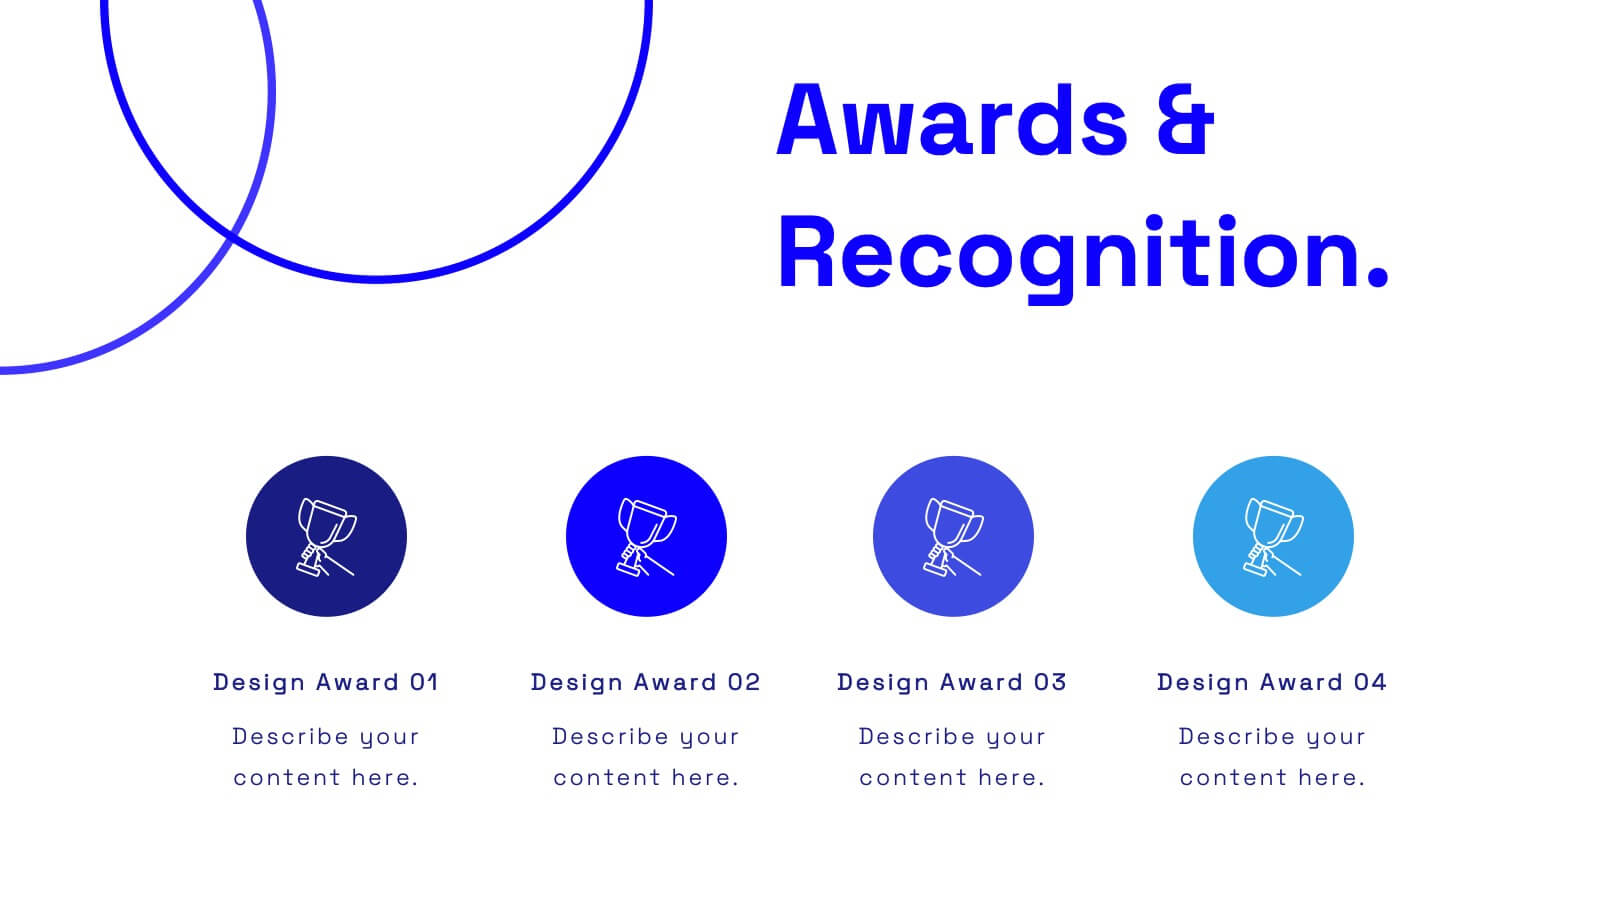
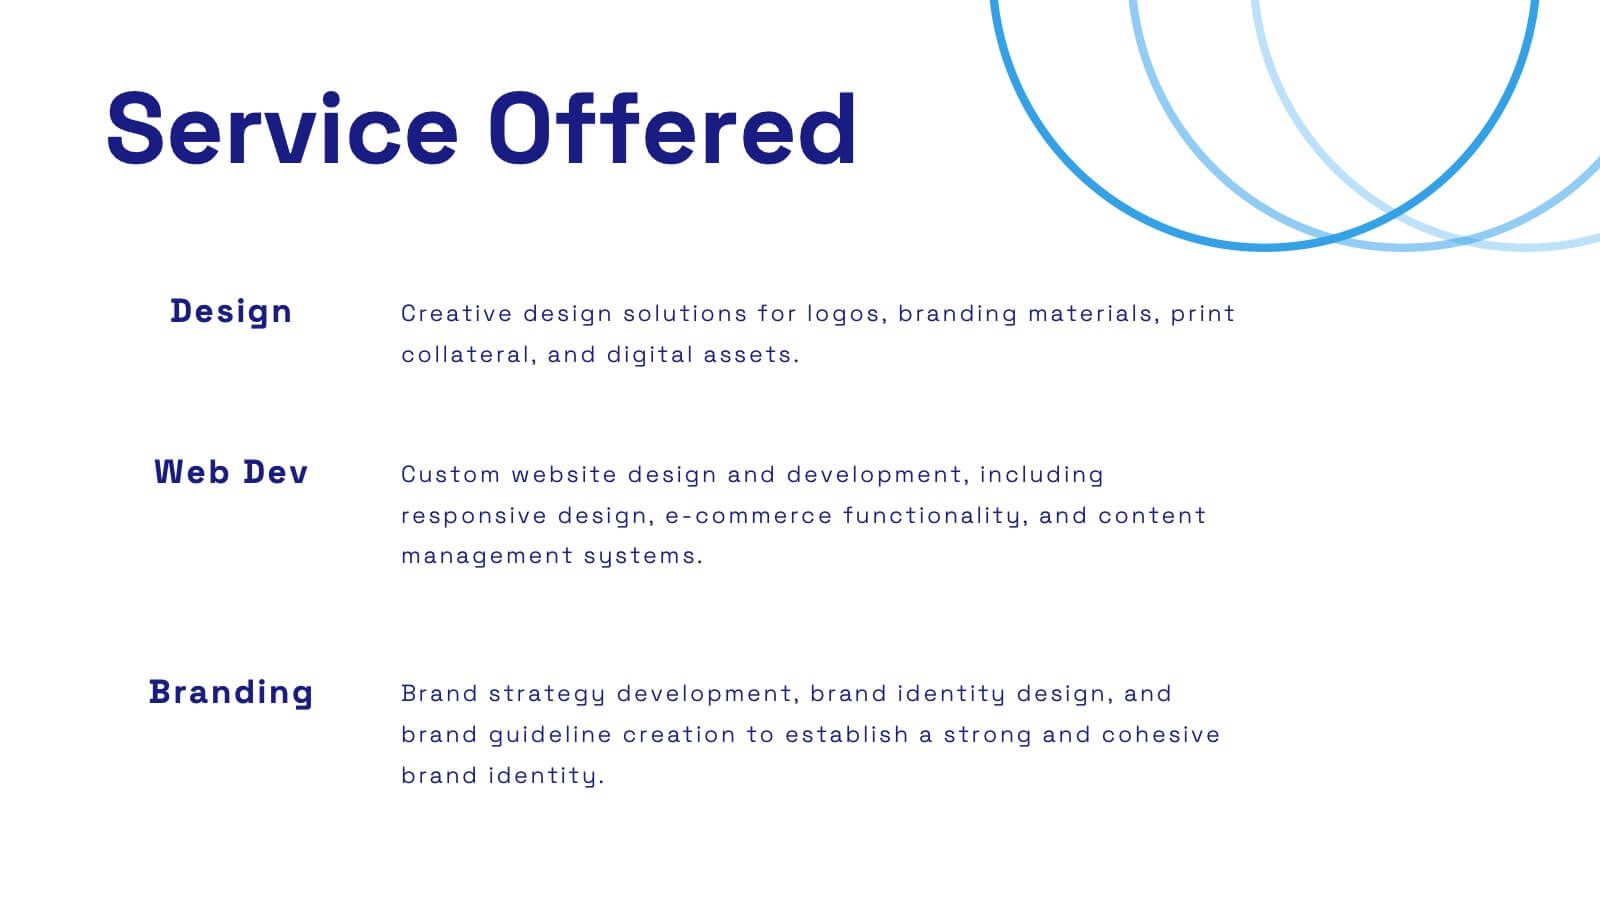
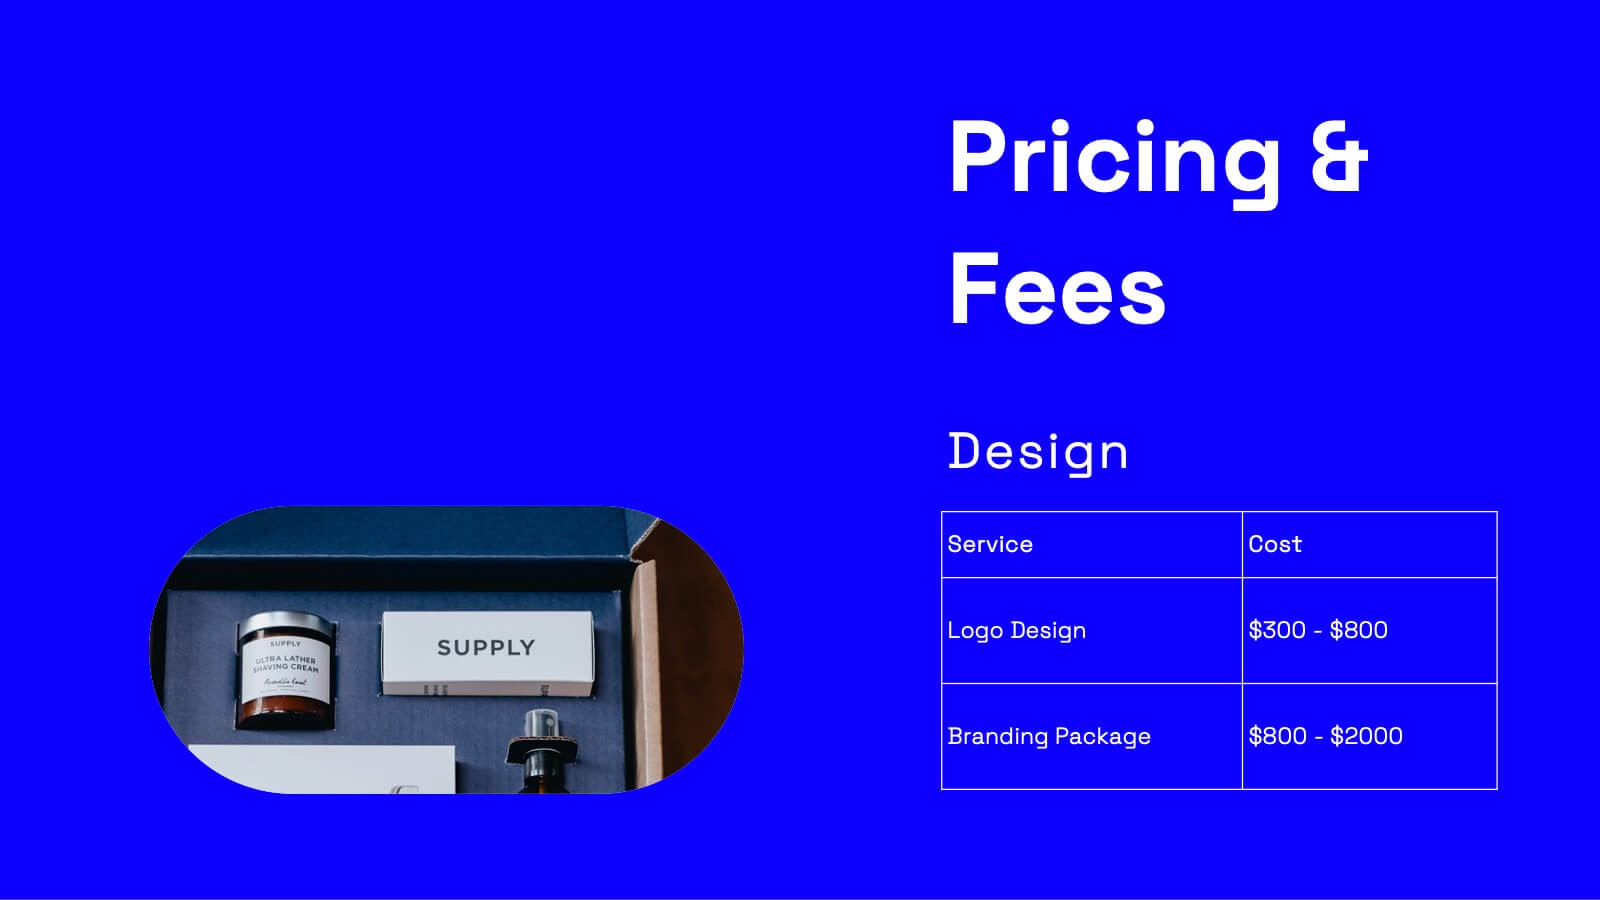
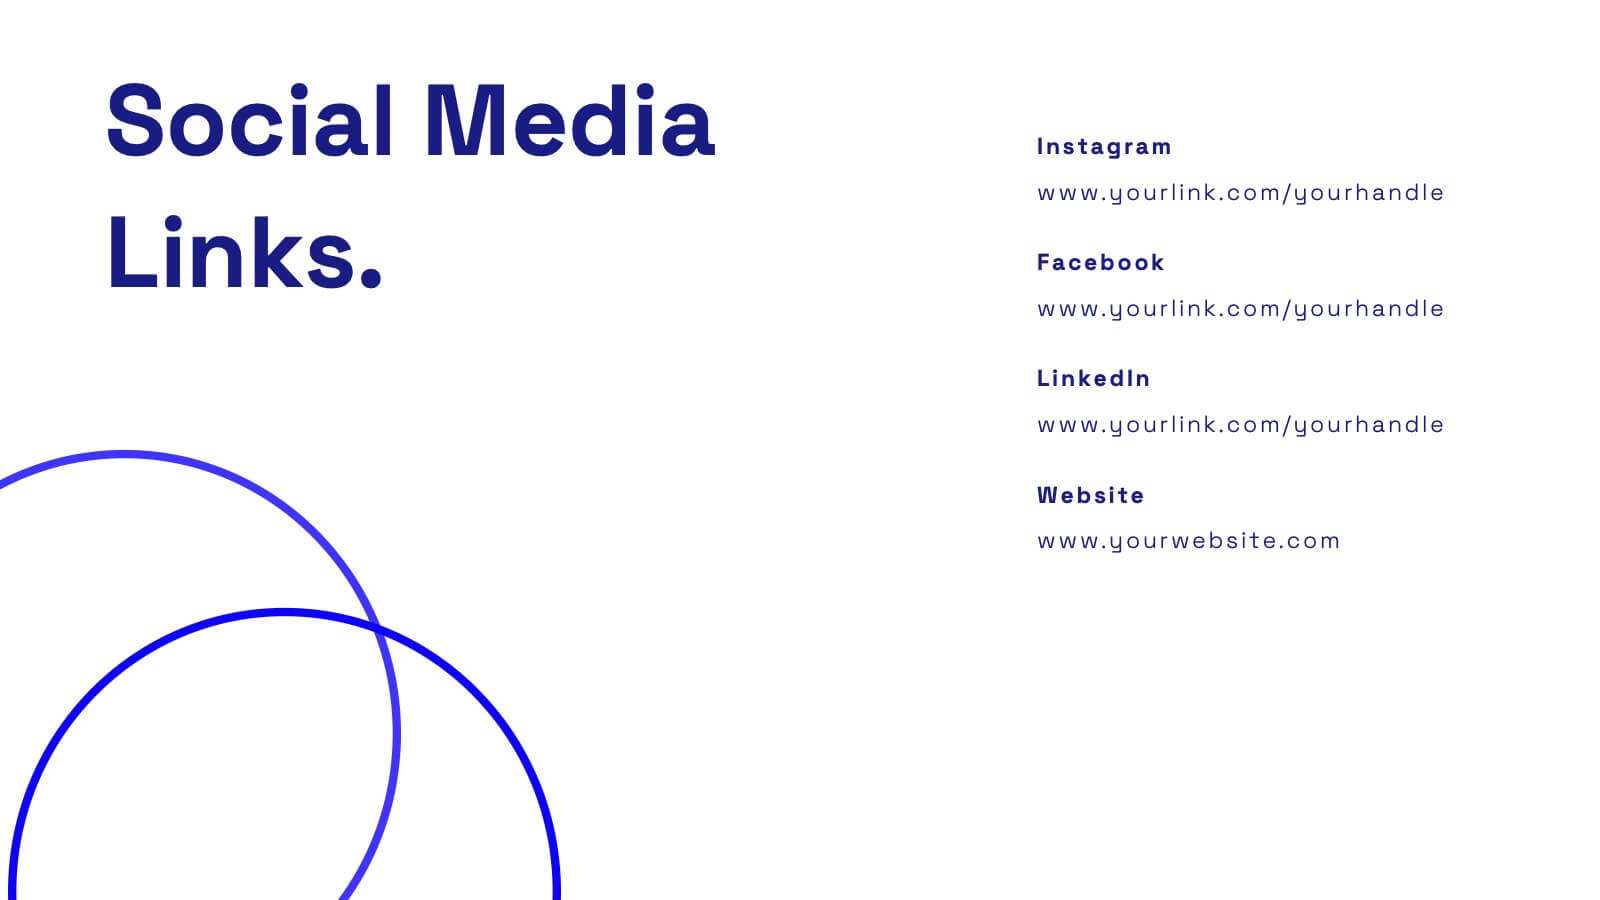
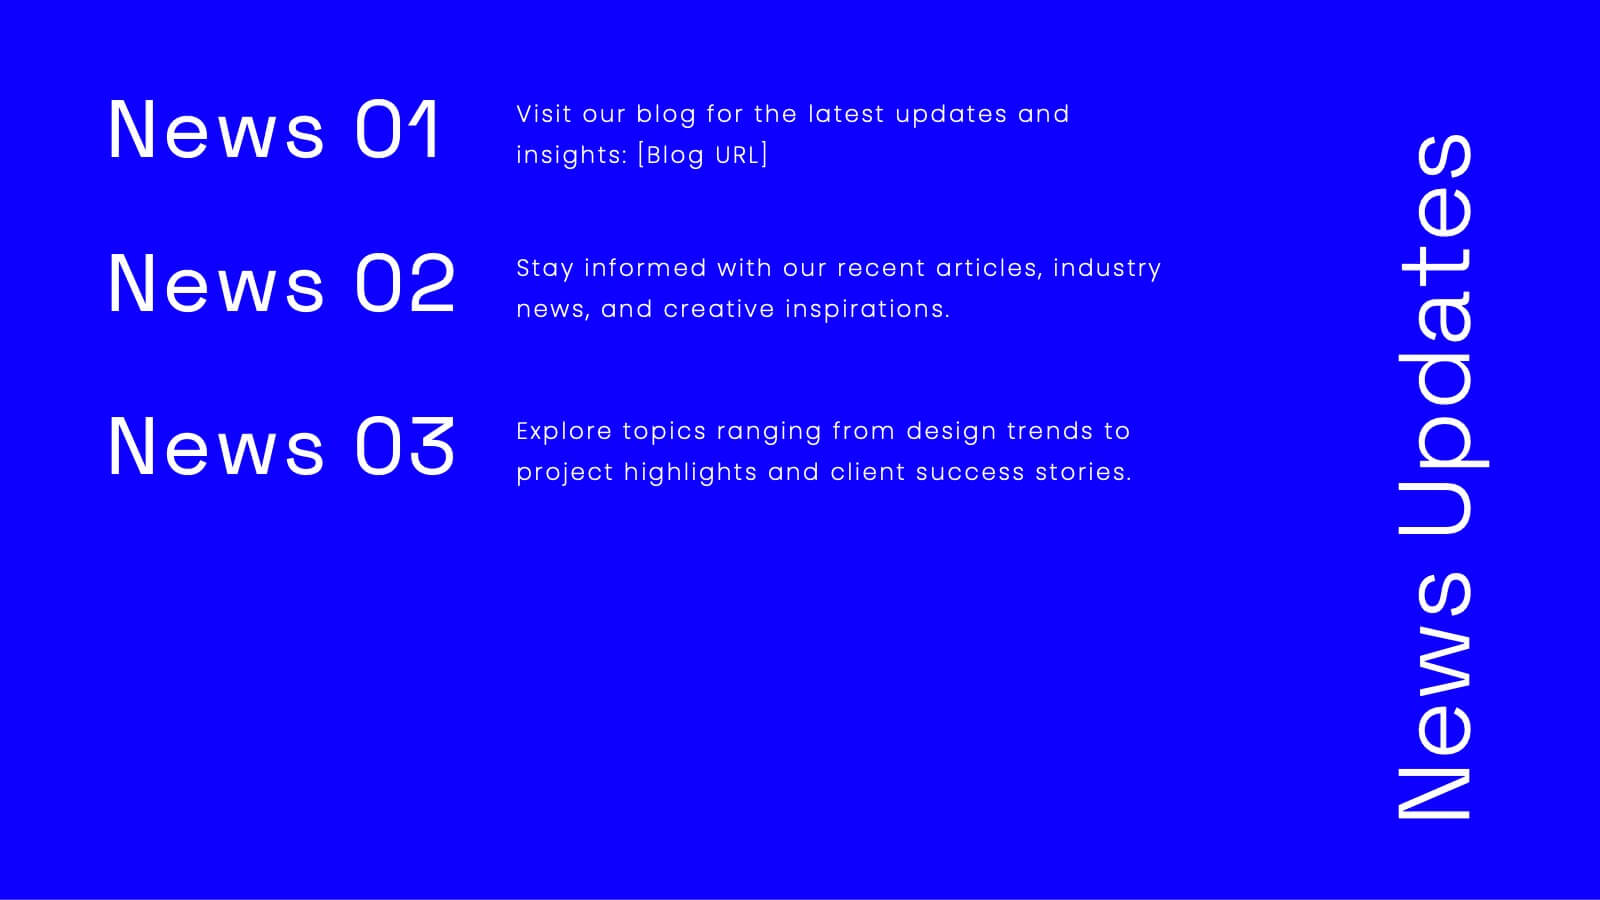
Wanderer Professional Portfolio Showcase Presentation
Showcase your creative work with this sleek, modern portfolio template. Perfect for highlighting your projects, philosophy, and client testimonials, it features a professional design with a dynamic layout. Display your awards, services offered, and pricing clearly to impress potential clients. Compatible with PowerPoint, Keynote, and Google Slides, it ensures seamless presentations on any platform.


4 diapositivas
HR Workflow and Policy Overview Presentation
Streamline organizational processes with the HR Workflow and Policy Overview template. Featuring a clear flowchart design, this layout is ideal for mapping HR procedures, compliance steps, and policy implementation. Fully customizable in Canva, PowerPoint, and Google Slides to align with your company’s branding and human resources management needs.


6 diapositivas
Detailed Case Analysis Report Presentation
Turn complex findings into a clear and engaging story with this modern, data-focused layout. Ideal for professionals presenting research, performance reviews, or audit results, it helps you organize insights with precision and clarity. Fully editable and compatible with PowerPoint, Keynote, and Google Slides for effortless customization and presentation delivery.


10 diapositivas
Marketing Funnel Diagram Presentation
Optimize your sales strategy with this Marketing Funnel Diagram template. Ideal for visualizing customer journeys, lead conversion, and sales processes, this design is fully editable to fit your business needs. Customize colors, text, and icons easily. Compatible with PowerPoint, Keynote, and Google Slides for seamless presentations and collaboration.


6 diapositivas
Team Workflow Strategy Process Diagram Presentation
Illustrate your team’s workflow from start to success with the Team Workflow Strategy Process Diagram Presentation. This slide design uses a horizontal sequence of arrow-shaped blocks, each representing a distinct step assigned to a team role or function. It’s perfect for project pipelines, task delegation, or process alignment across departments. Clear icons and editable text fields help keep communication streamlined. Compatible with PowerPoint, Keynote, and Google Slides.


6 diapositivas
Organizational Analysis McKinsey 7S
Visualize internal alignment and strategic effectiveness using this Organizational Analysis McKinsey 7S template. Ideal for consultants, business leaders, and HR professionals, it clearly outlines all seven interconnected elements—Style, Staff, Skills, Structure, Systems, Strategy, and Shared Values. Fully editable in PowerPoint, Keynote, and Google Slides.


5 diapositivas
Identifying Problems in Projects Presentation
Kickstart your analysis with a bold, colorful layout that makes uncovering project issues feel clear and structured. This presentation helps you outline challenges, compare causes, and guide teams toward practical solutions using a simple, organized flow. Fully compatible with PowerPoint, Keynote, and Google Slides.


6 diapositivas
IT Operations Workflow Strategy Presentation
Optimize your IT strategy with the IT Operations Workflow Strategy Presentation. This vertically aligned timeline slide illustrates six sequential steps, each paired with a bold icon and title placeholder—perfect for outlining operational procedures, tech stack implementation, or process audits. Color-coded markers help distinguish each stage clearly. Fully editable in PowerPoint, Keynote, and Google Slides.


5 diapositivas
Topic Web Mind Mapping
Visualize your ideas with clarity and structure using the Topic Web Mind Mapping Presentation. Perfect for brainstorming, educational planning, or strategic thinking, this layout helps you centralize a core concept and expand with five supporting branches. Customize easily in PowerPoint, Keynote, or Google Slides to fit any topic or audience.