


Características


¿Tienes alguna pregunta?
Recomendar


7 diapositivas
Science Infographic Presentation Template
A science infographic is a visual representation of scientific information or knowledge that aims to simplify and communicate complex scientific concepts in a clear and concise way. This template uses charts, images, and other elements to convey information, making it easier for your audience to understand and retain scientific information. Use this Science infographic to cover a wide range of scientific topics, from biology and physics to climate change and space exploration. This can be used in various settings, such as in educational settings, scientific publications, and popular media.


4 diapositivas
Food Business Concept Pitch Presentation
Bring your culinary vision to life with the Food Business Concept Pitch Presentation. This unique avocado-shaped layout helps you outline up to four key ideas—from menu innovation to service strategy. Perfect for chefs, restaurateurs, or food startups. Fully editable in PowerPoint, Canva, and Google Slides for easy customization.

21 diapositivas
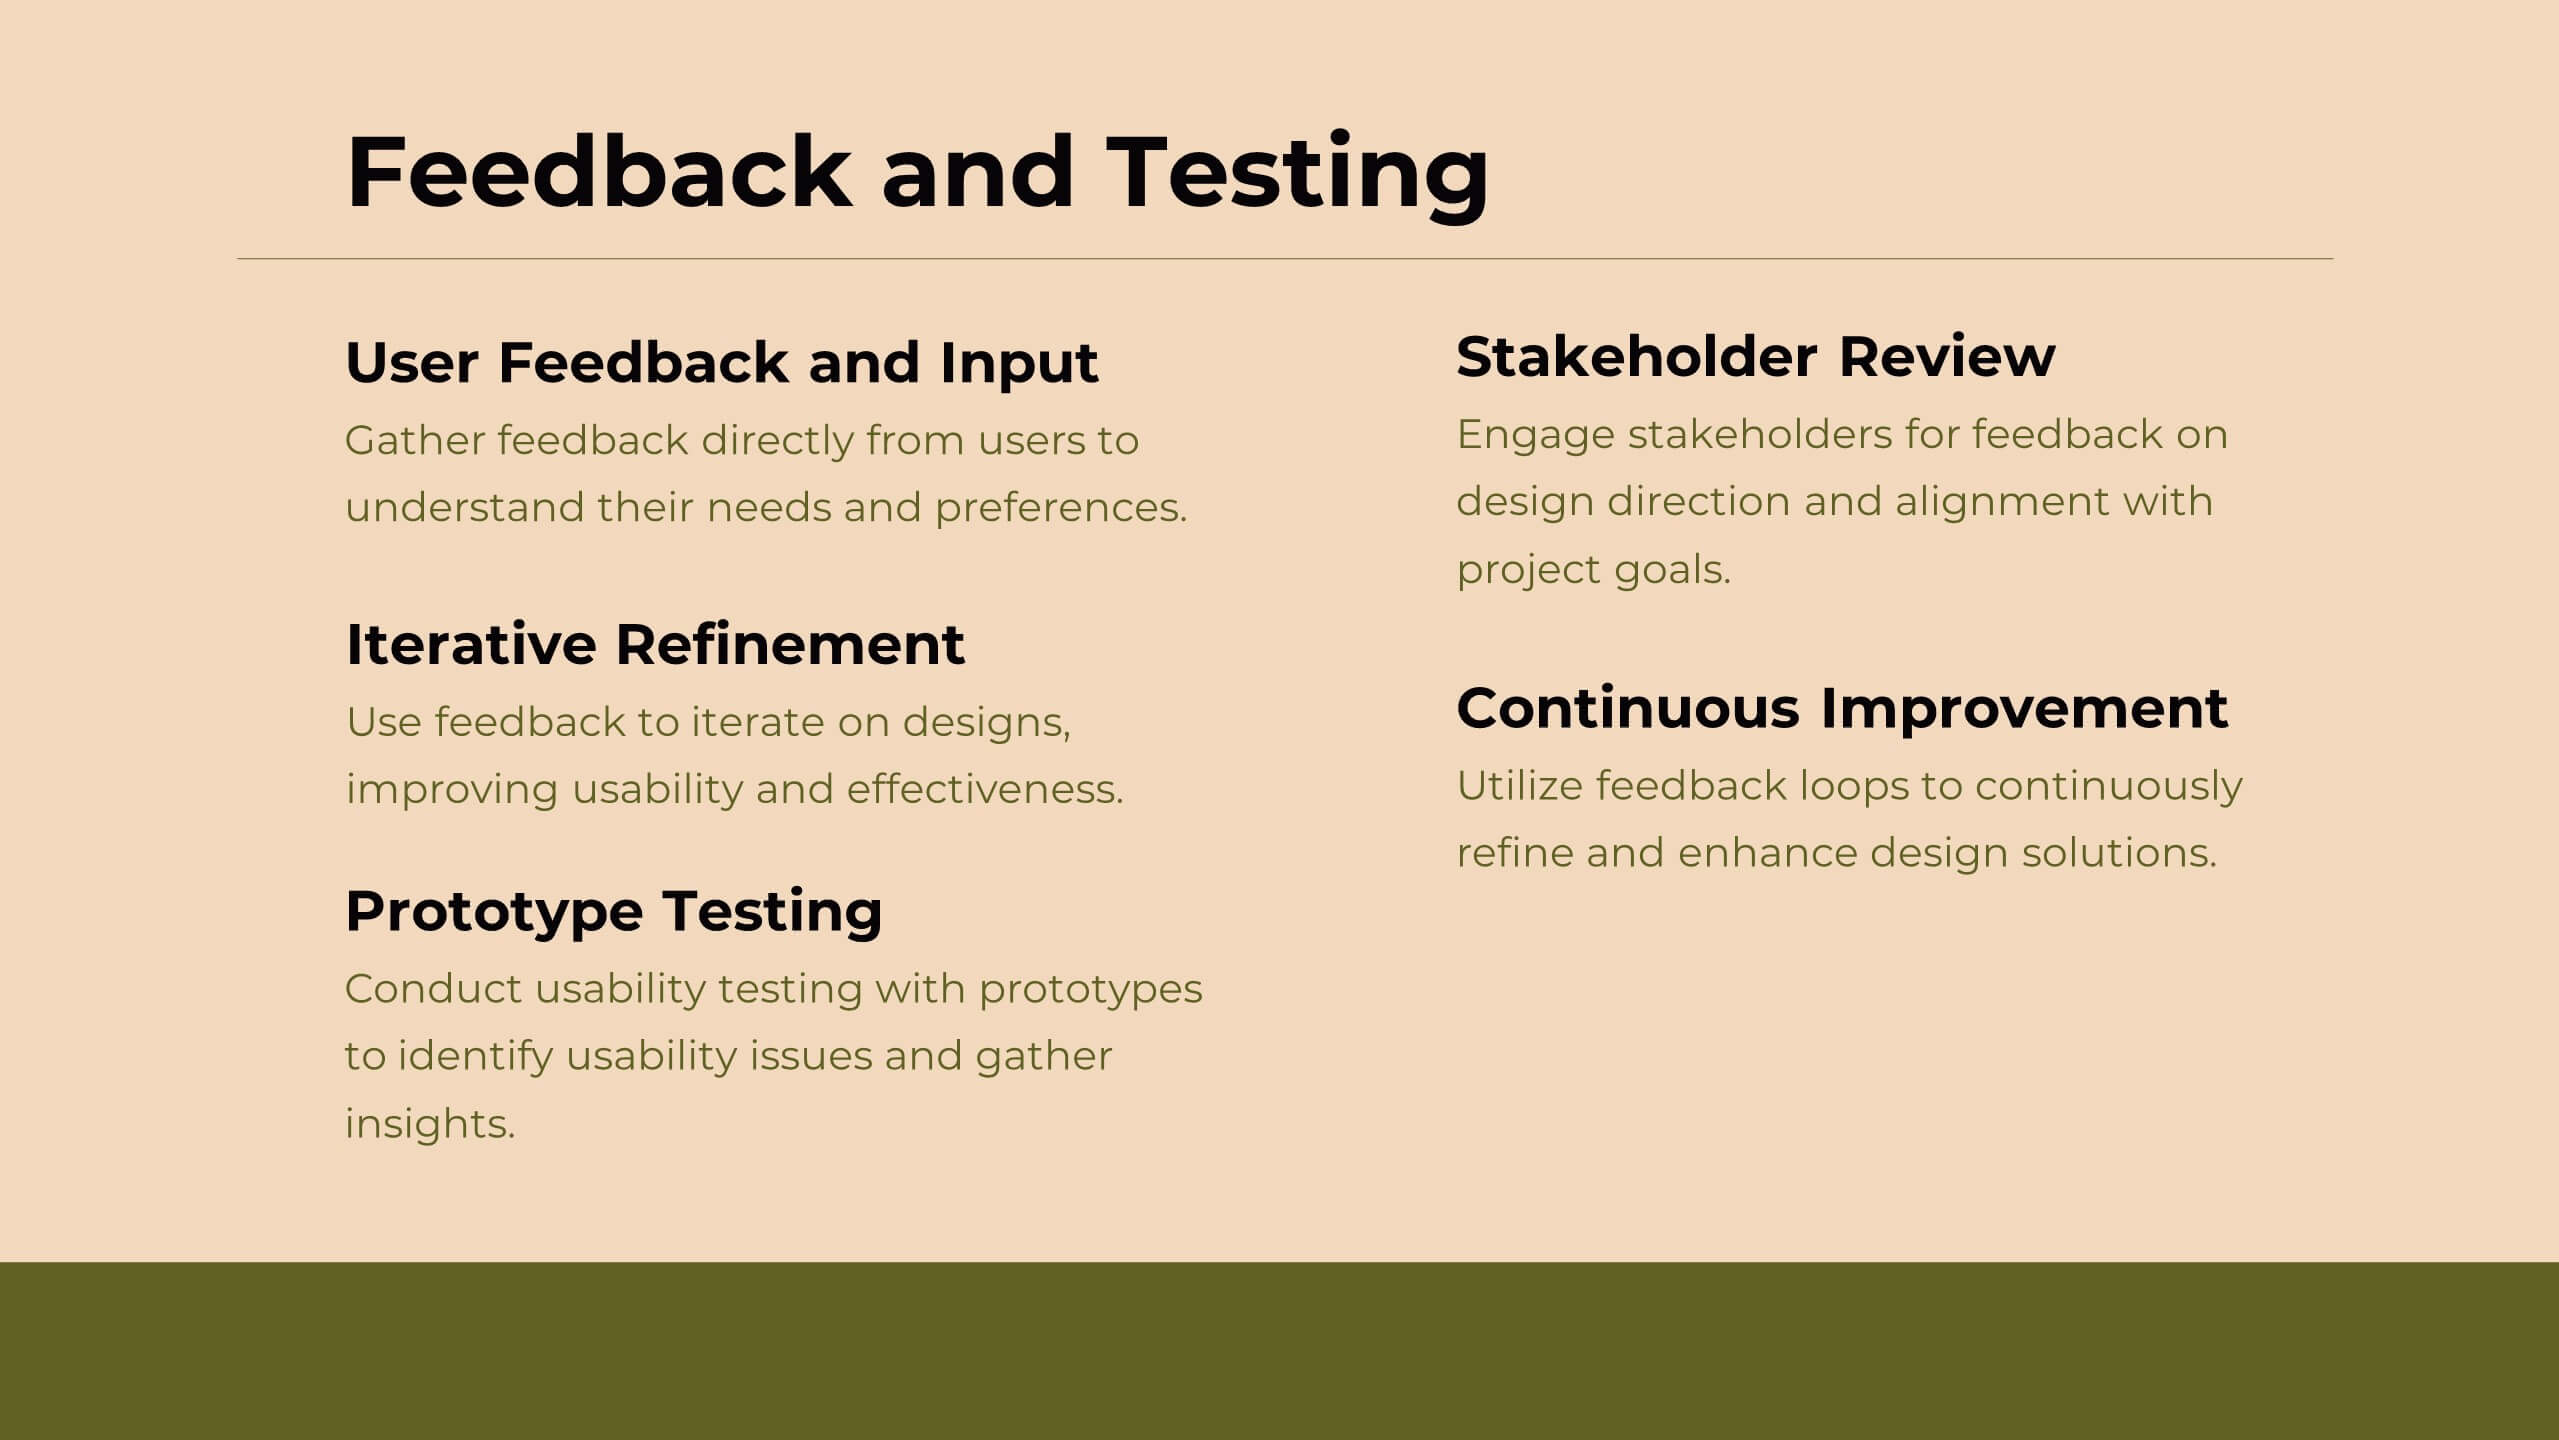
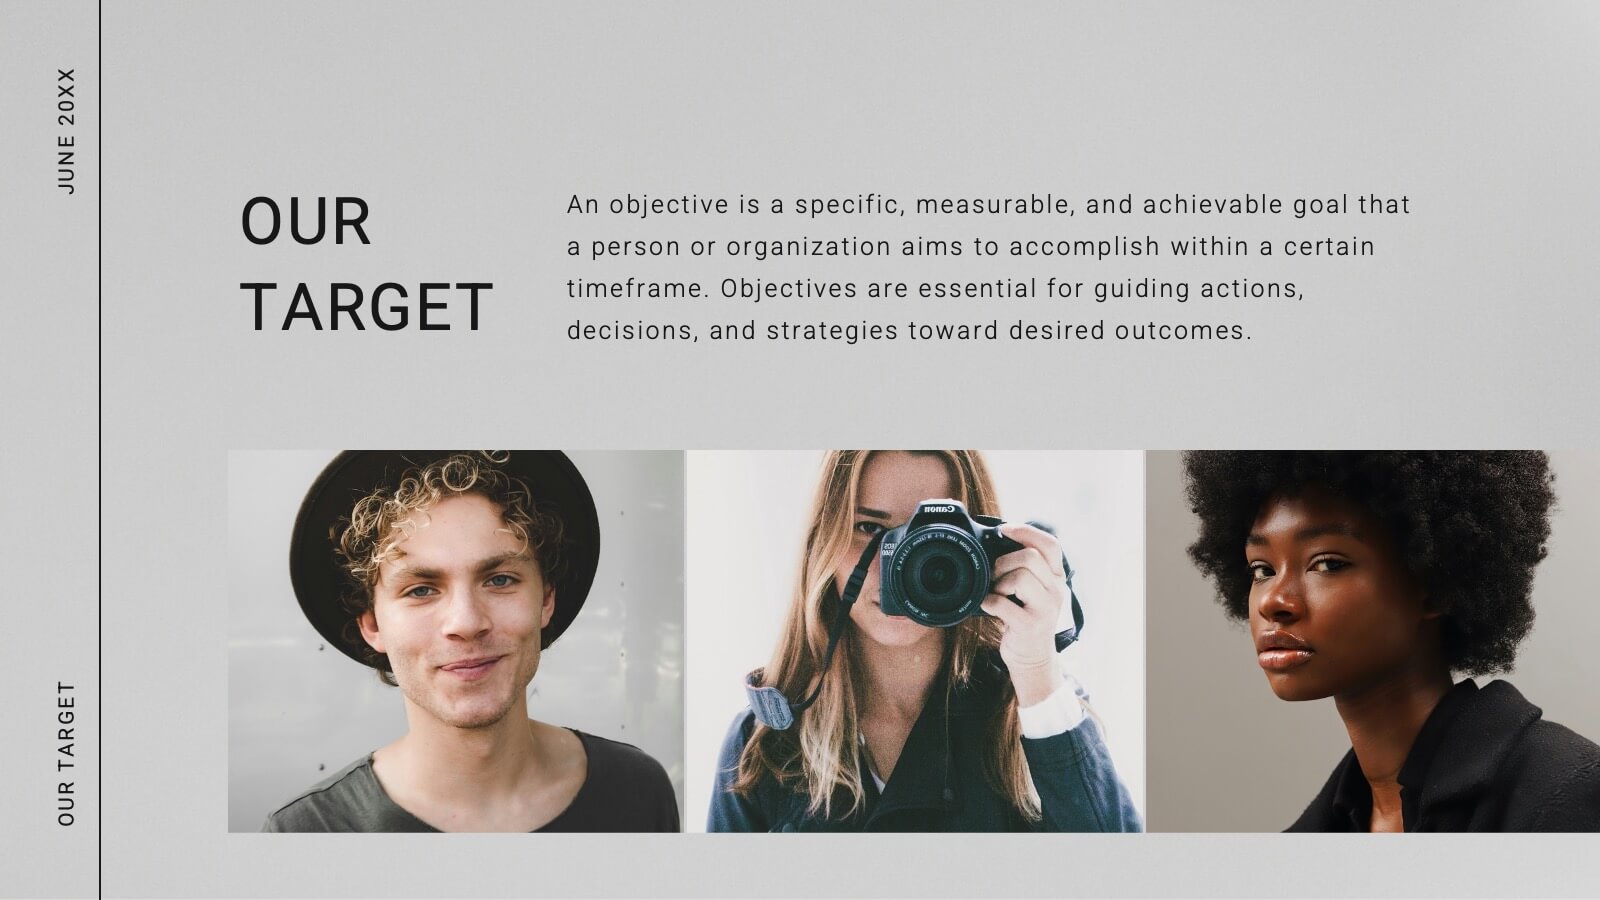
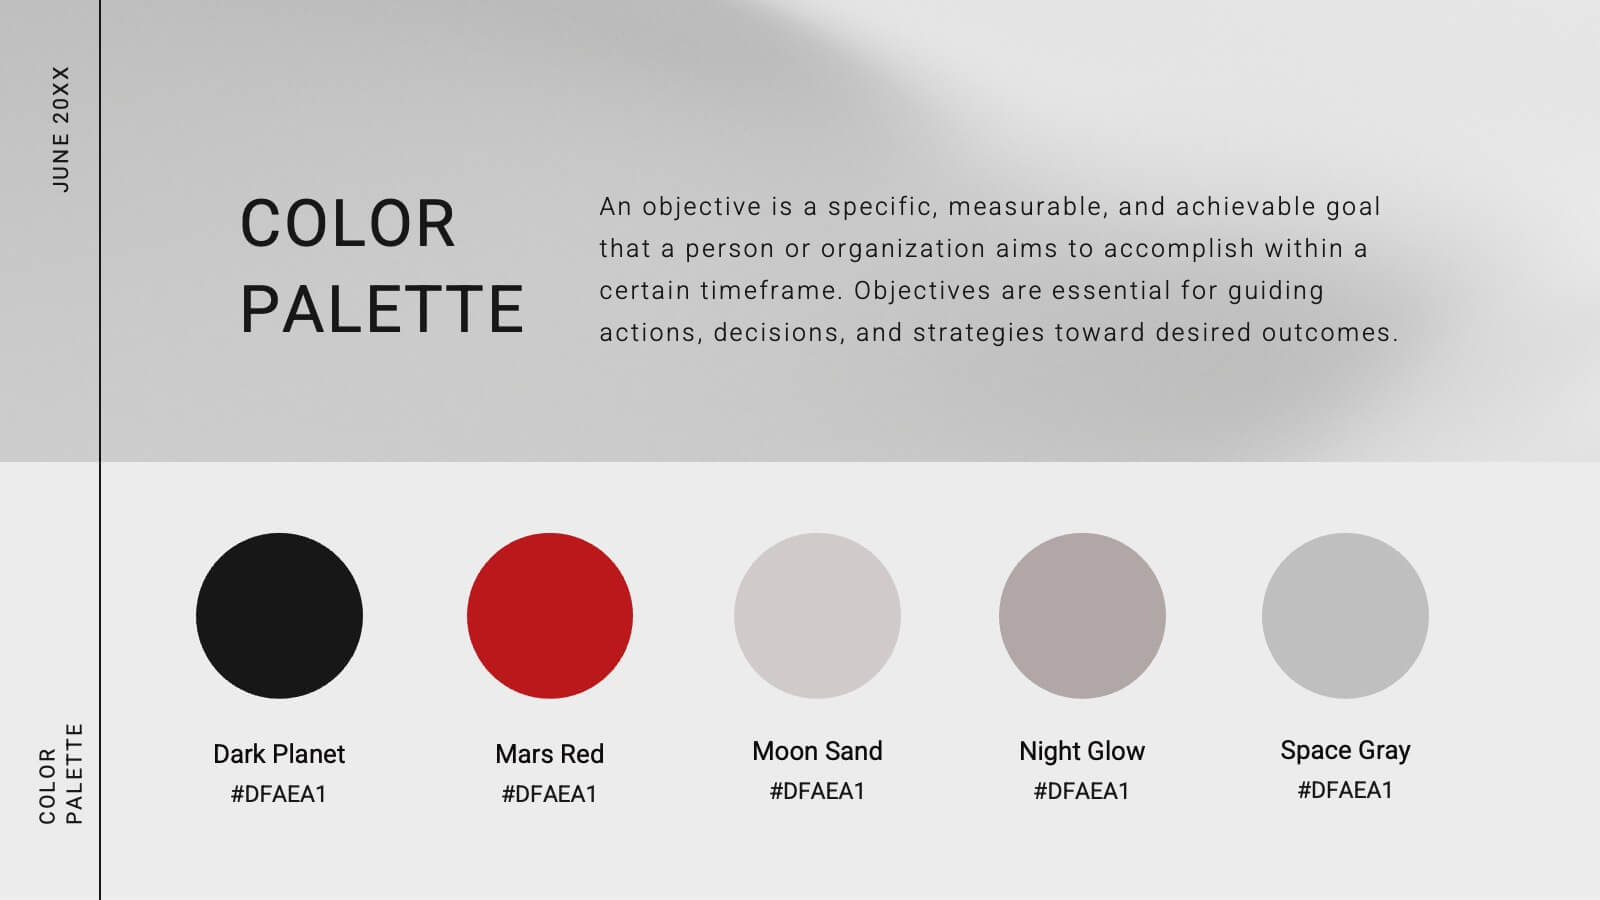
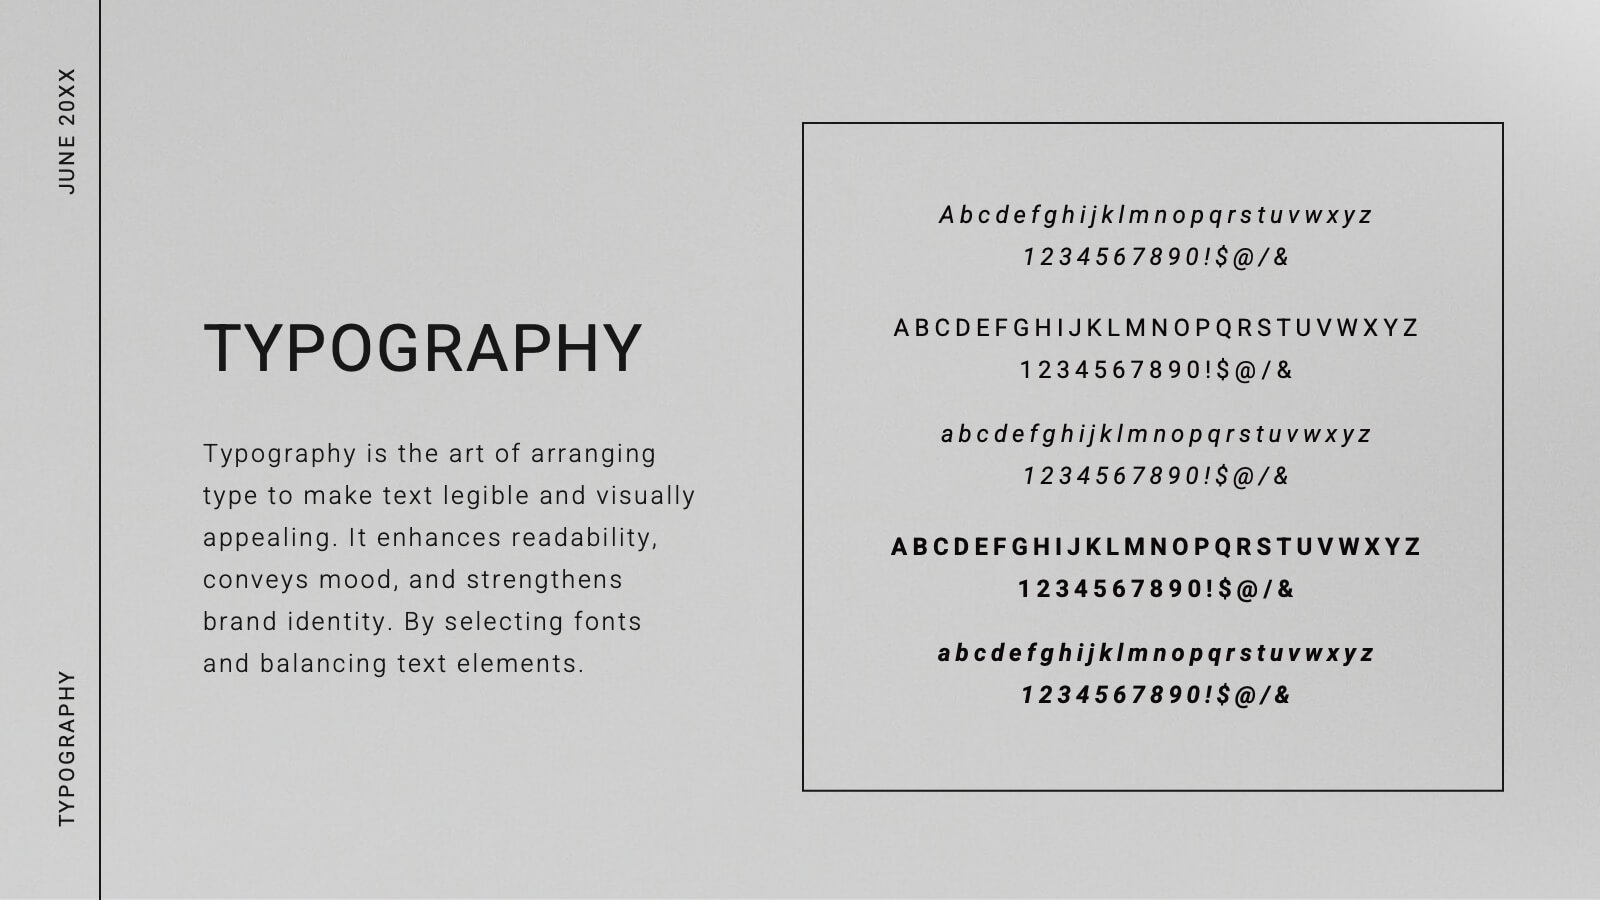
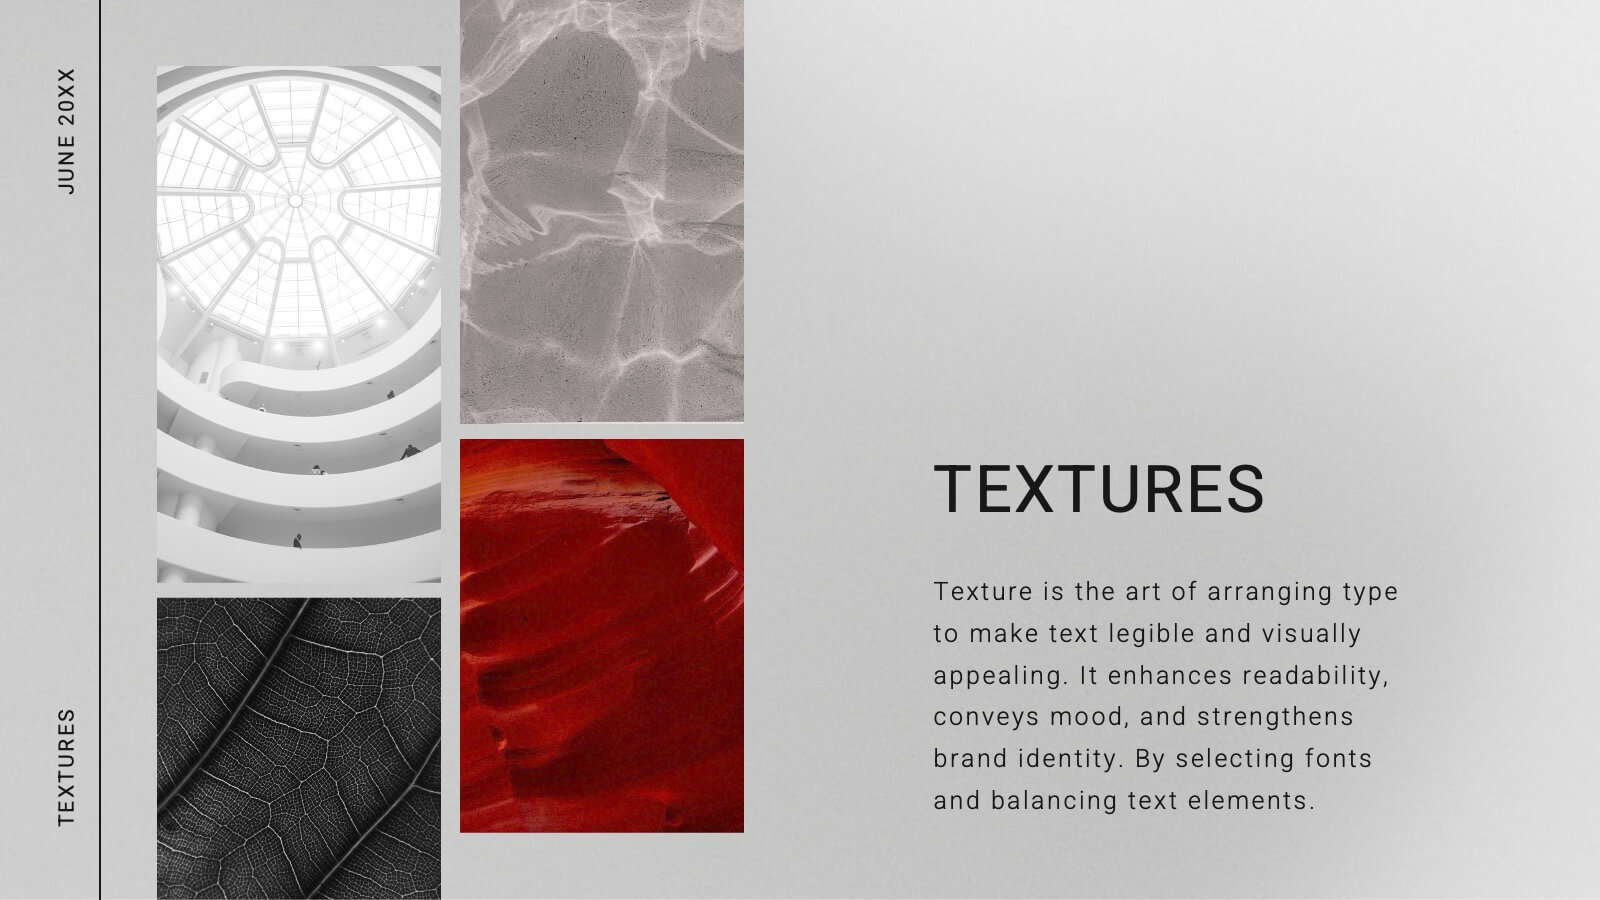
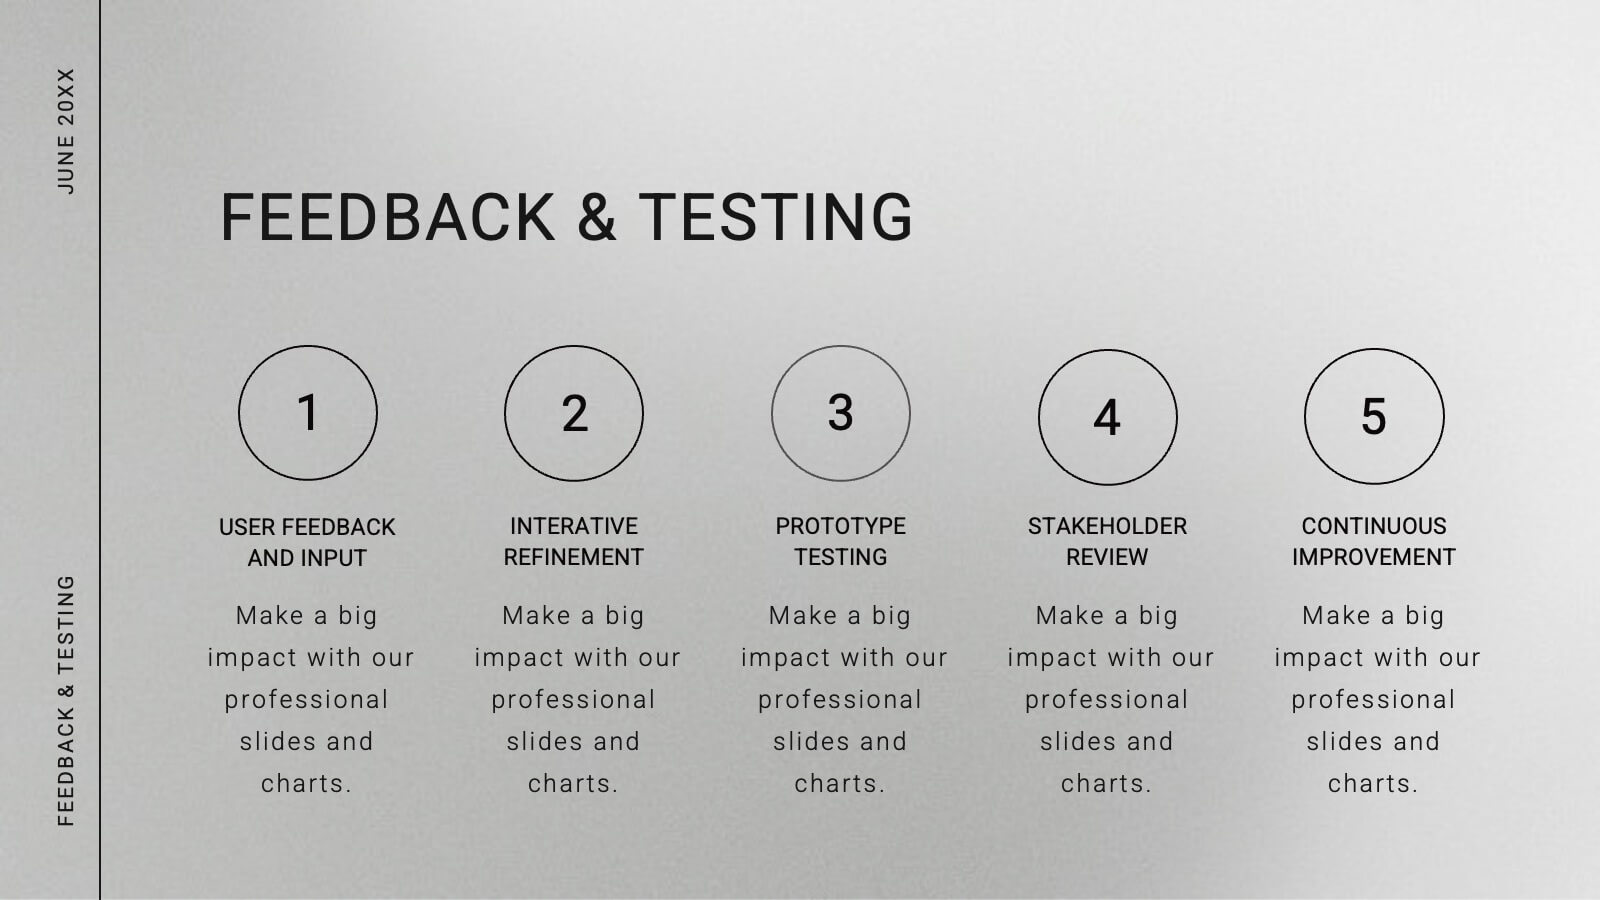
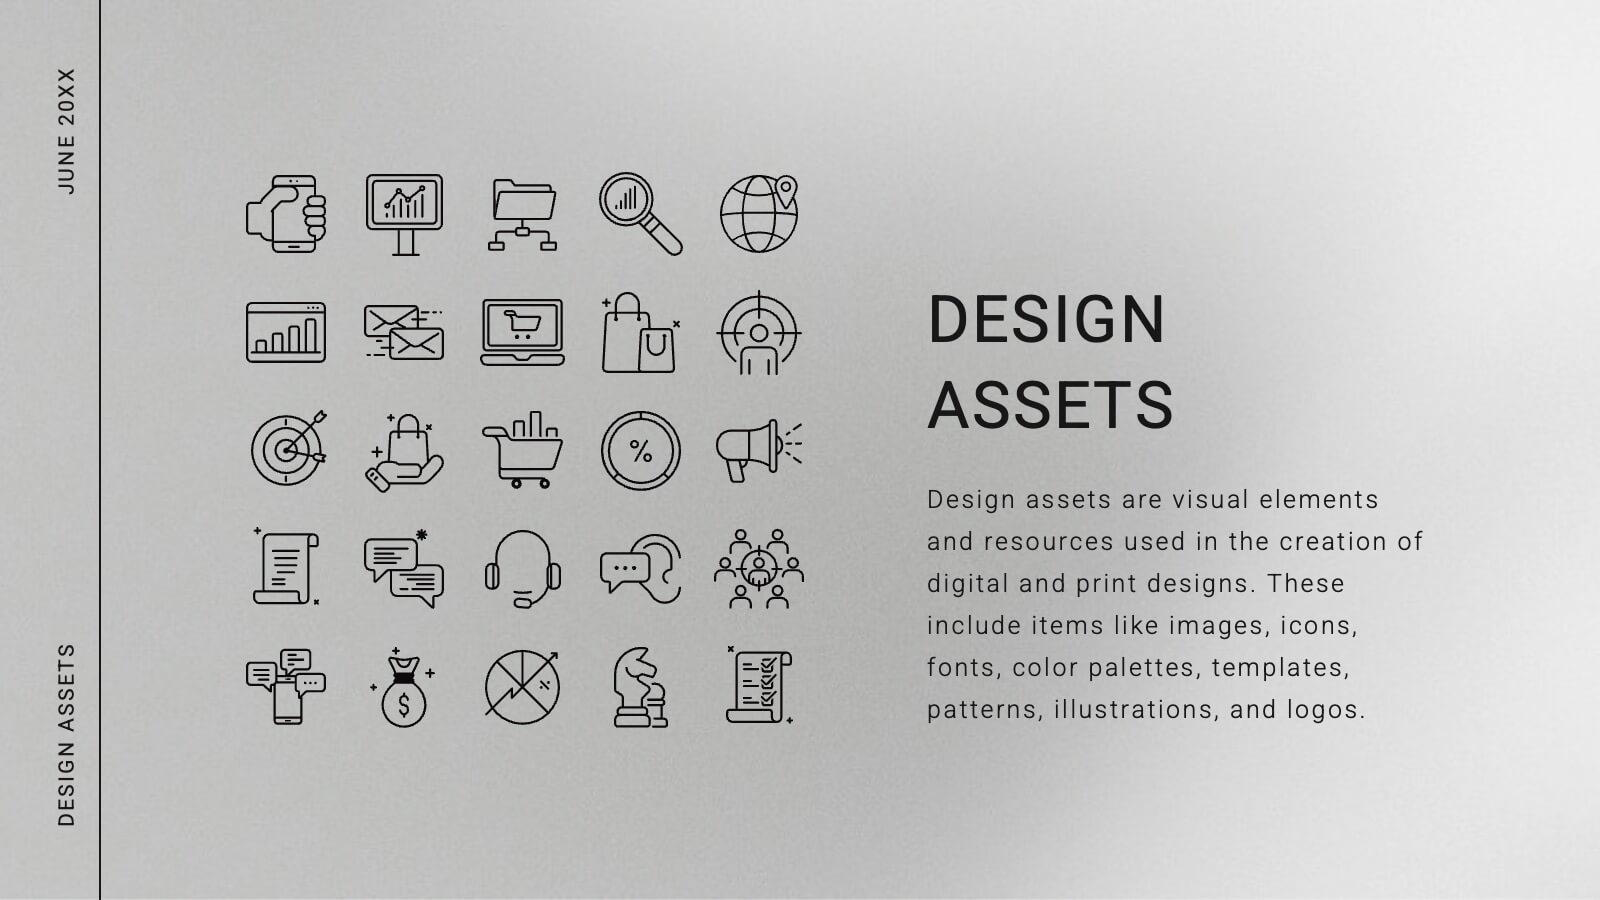
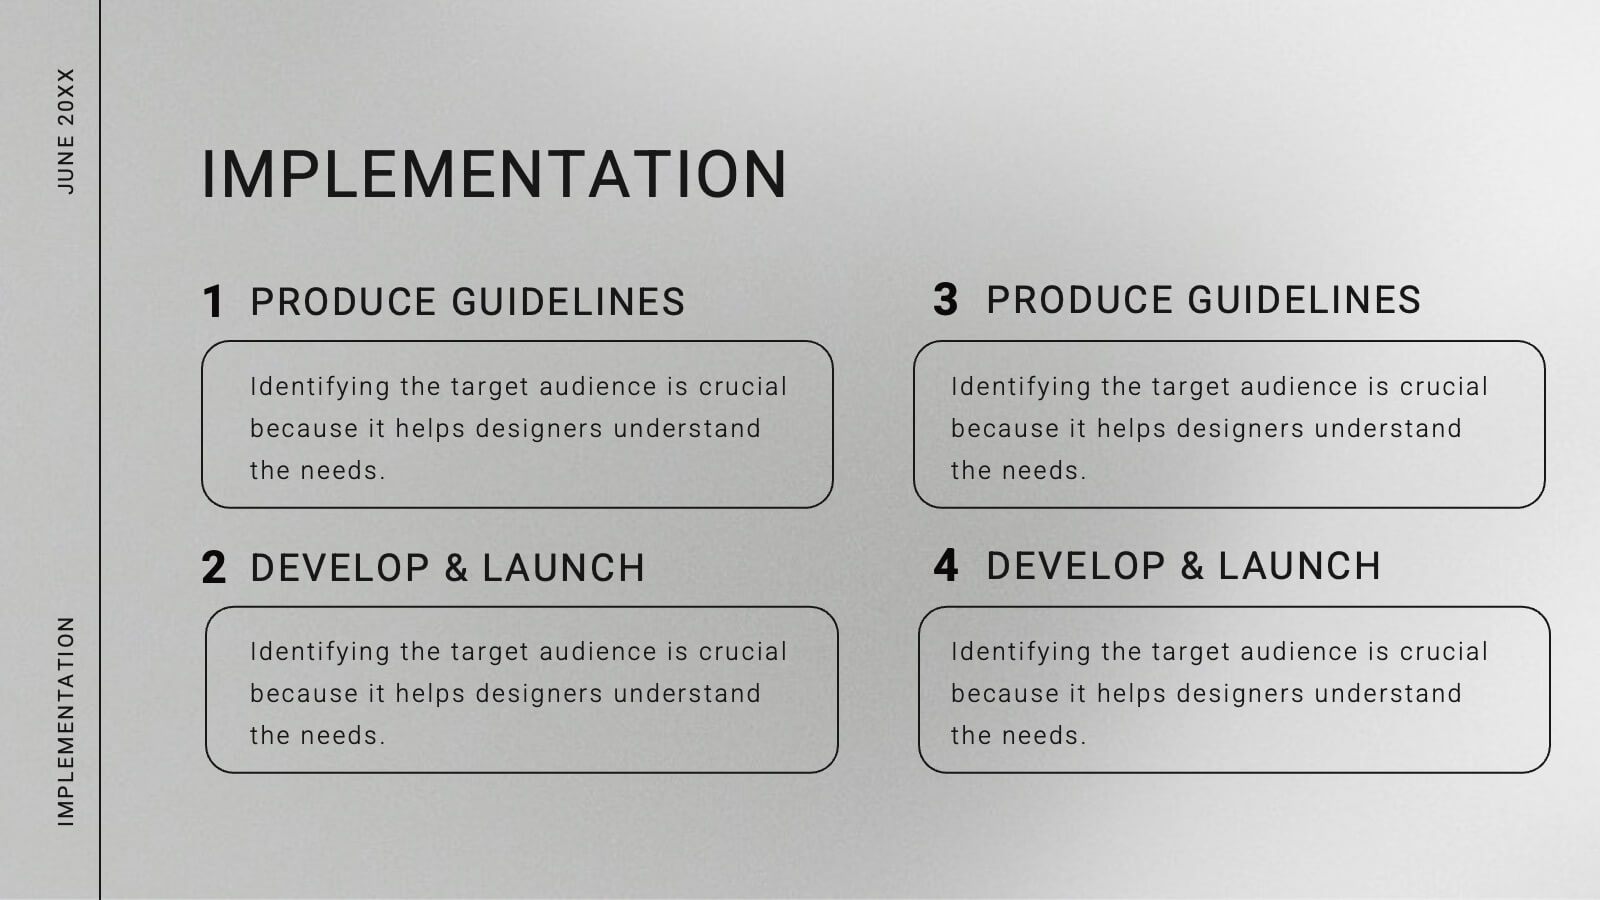
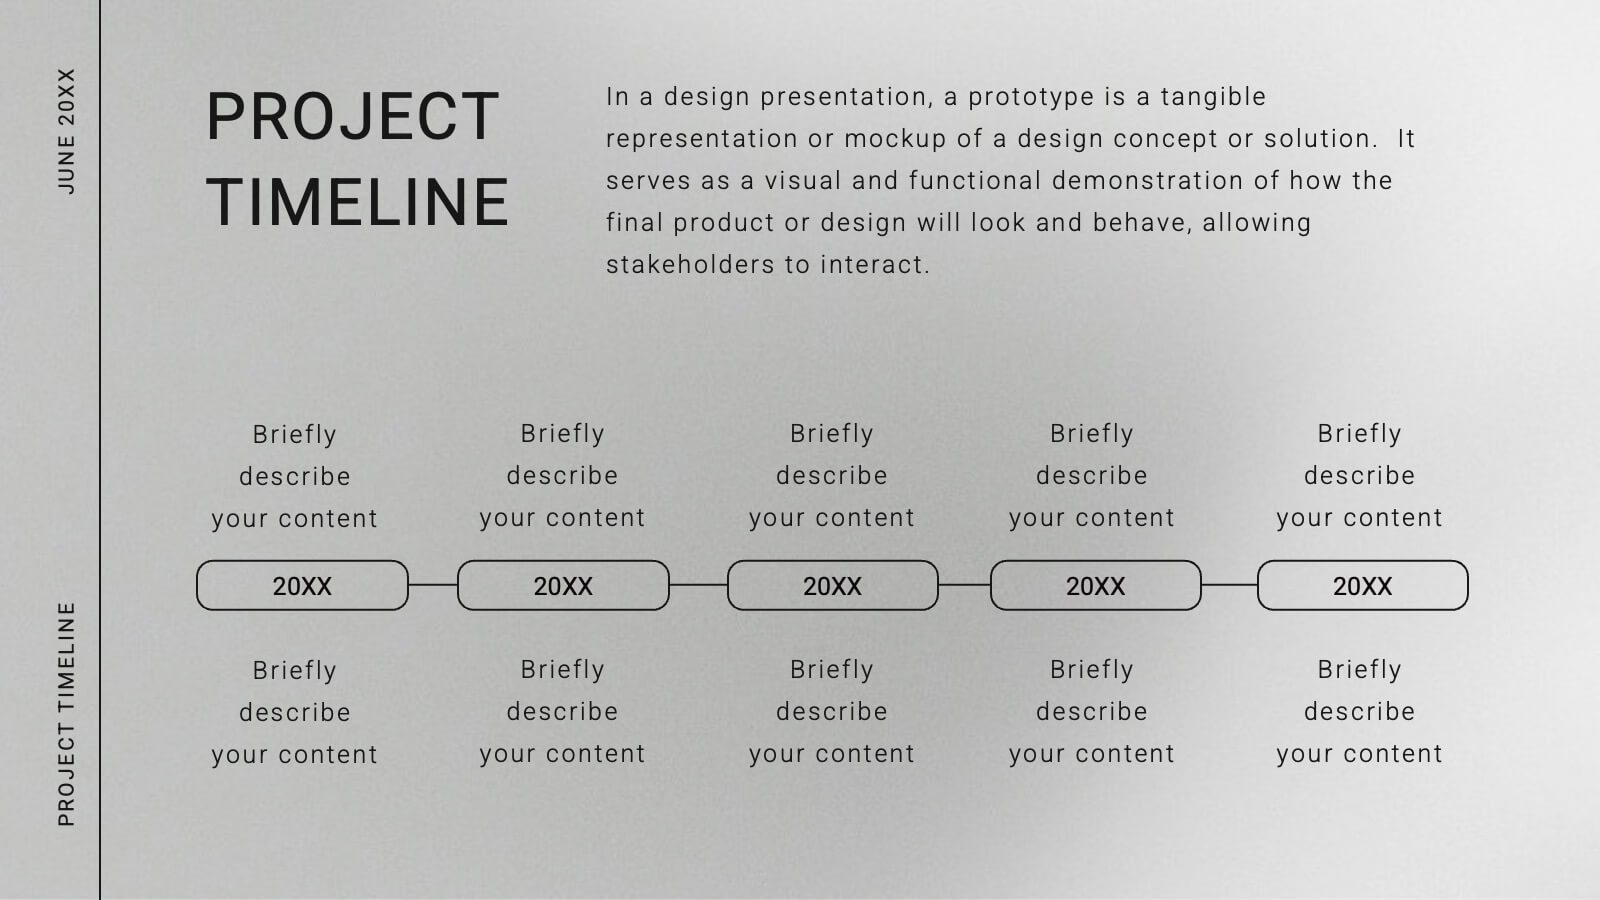
Delta Design Strategy Proposal Presentation
Transform your design strategy with this elegant proposal template! Perfect for presenting design briefs, target audience insights, and concept development. Ideal for designers and creative teams aiming to align vision and execution. Compatible with PowerPoint, Keynote, and Google Slides, this template ensures your design strategy is clear, professional, and compelling. Elevate your projects today!


6 diapositivas
Business Growth and Progress Metrics Presentation
Showcase milestones, trends, and business wins with this sleek bar chart and line graph combo. Designed to illustrate upward momentum, each slide highlights progress using a trophy peak icon, 5 key steps, and editable labels. Ideal for quarterly reviews, growth tracking, and strategic updates. Fully compatible with PowerPoint, Keynote, and Google Slides.


5 diapositivas
End-to-End Process Flow Framework Presentation
Visualize your operations from start to finish with the End-to-End Process Flow Framework Presentation. This clean, arrow-based layout is perfect for outlining workflows, project stages, or business processes step by step. Fully customizable in Canva, PowerPoint, and Google Slides to suit any team or strategic need.


22 diapositivas
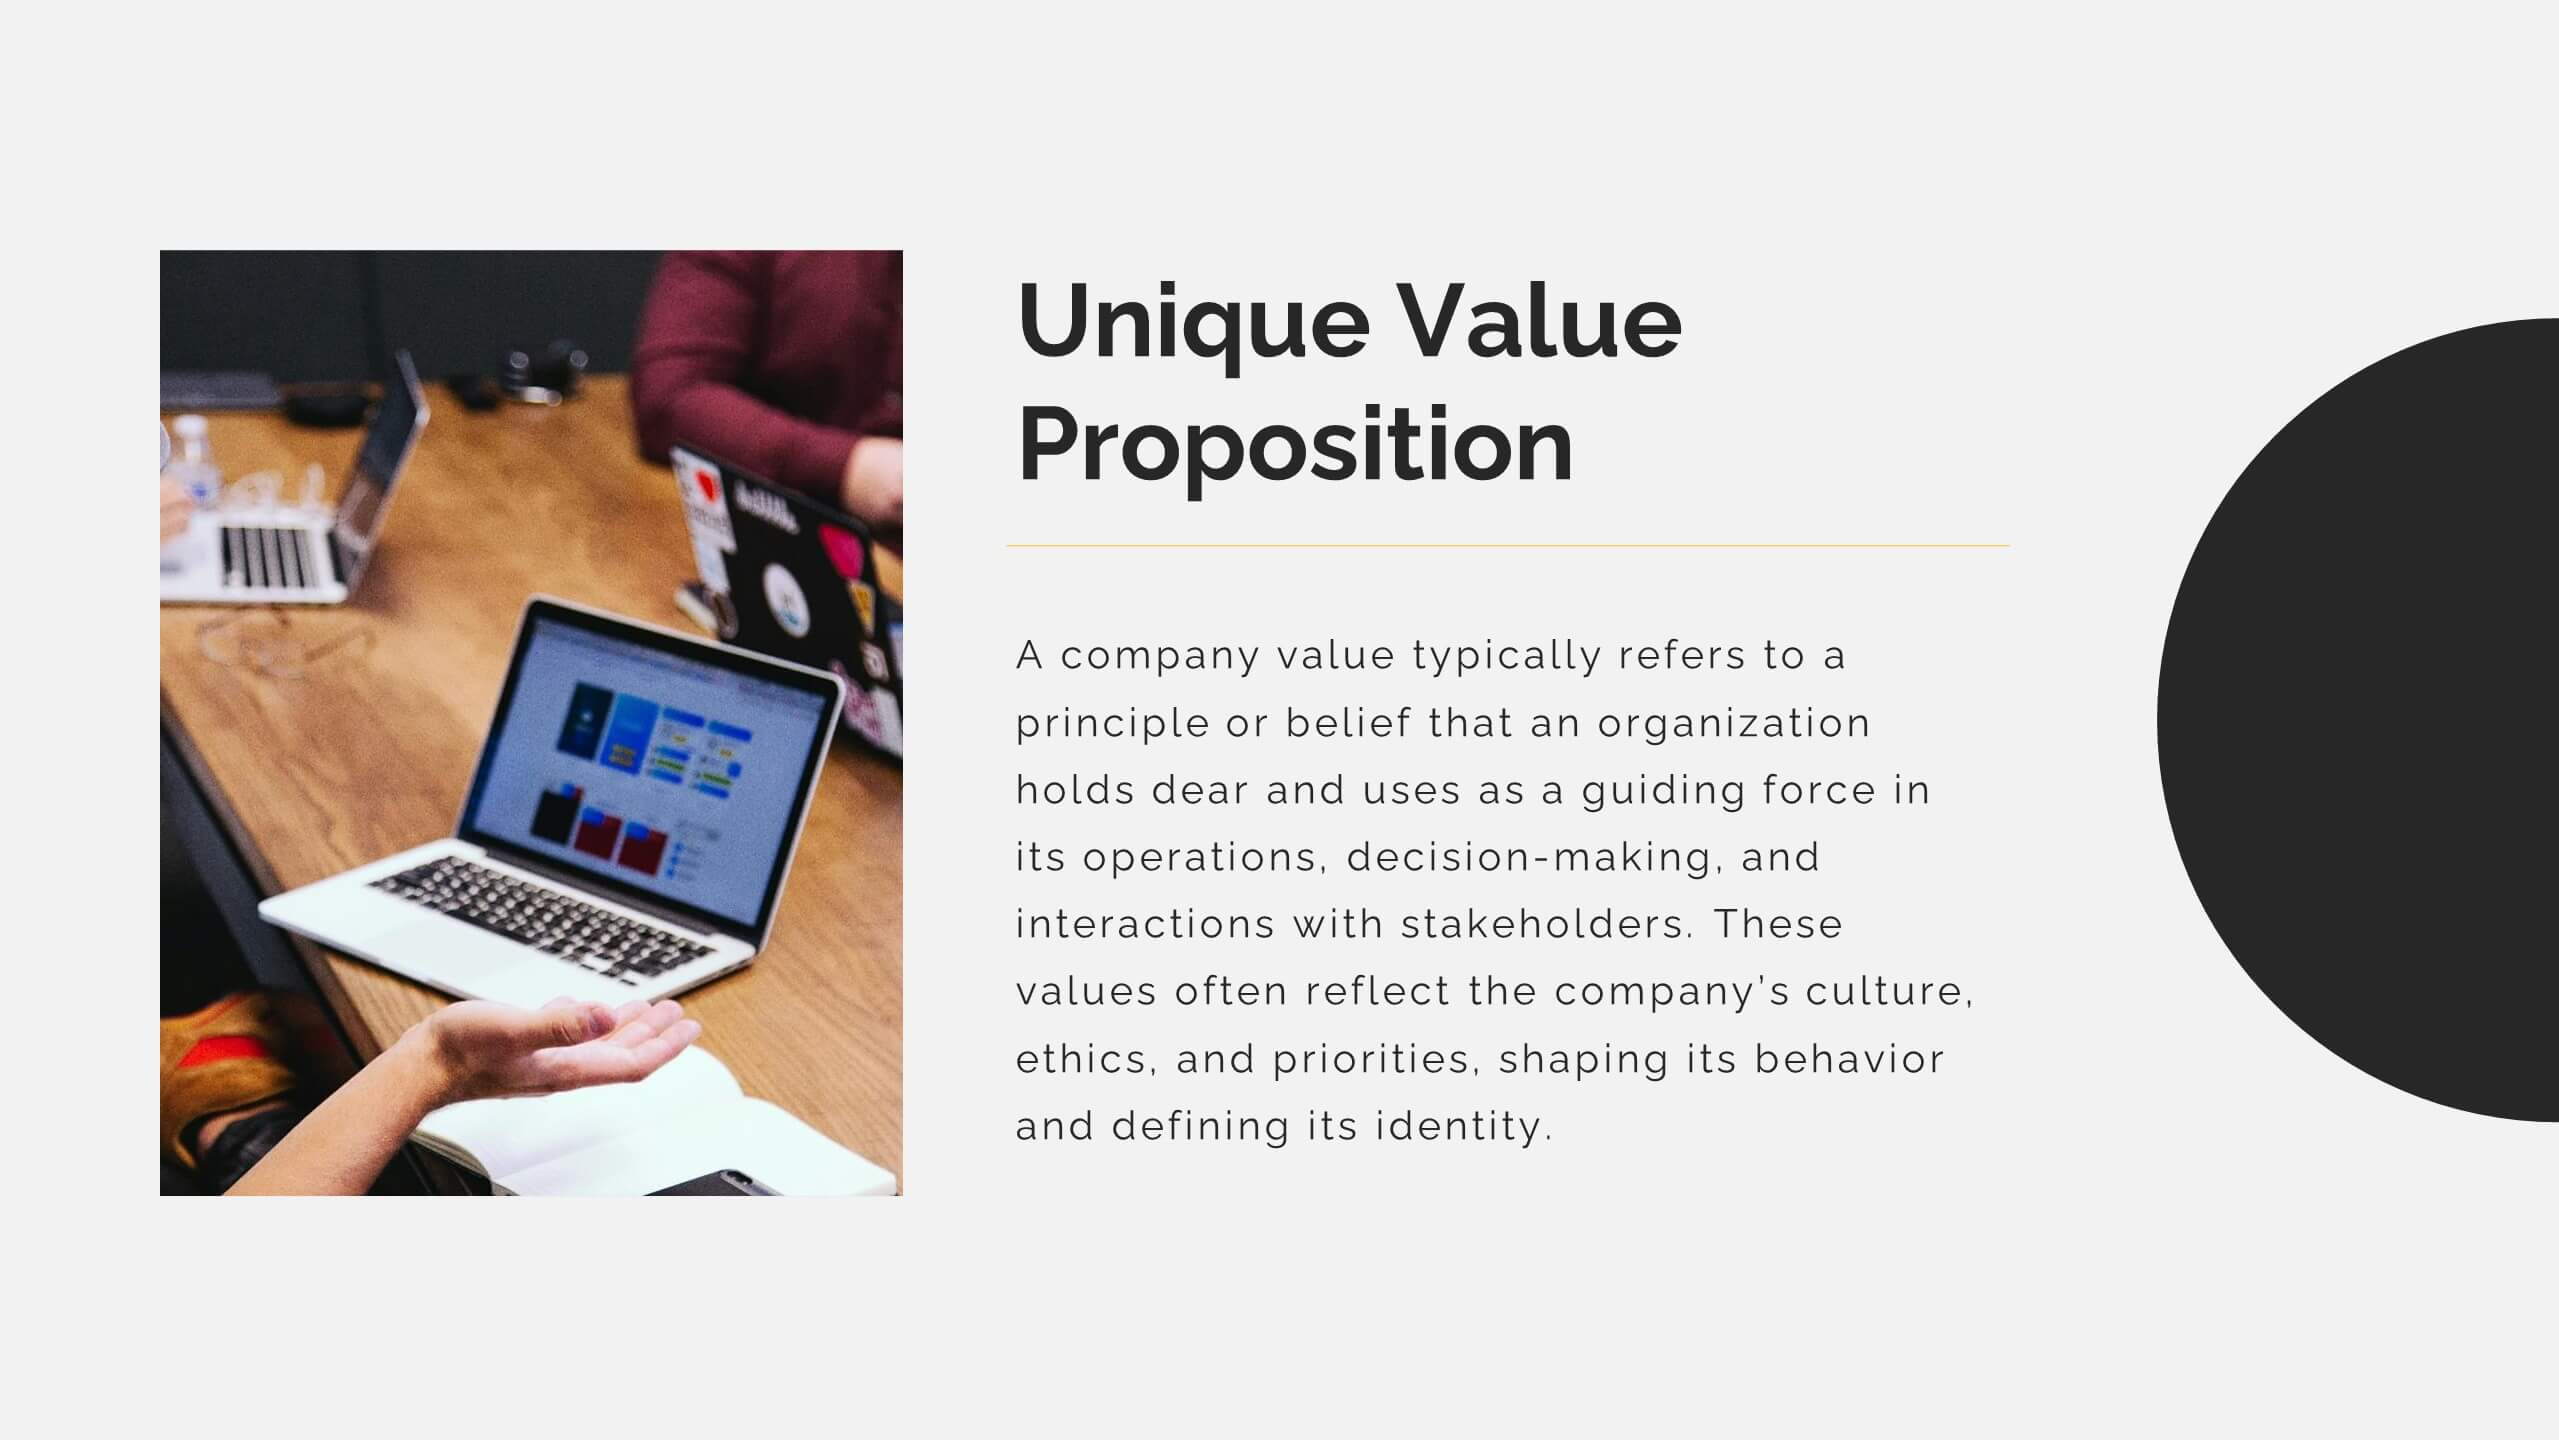
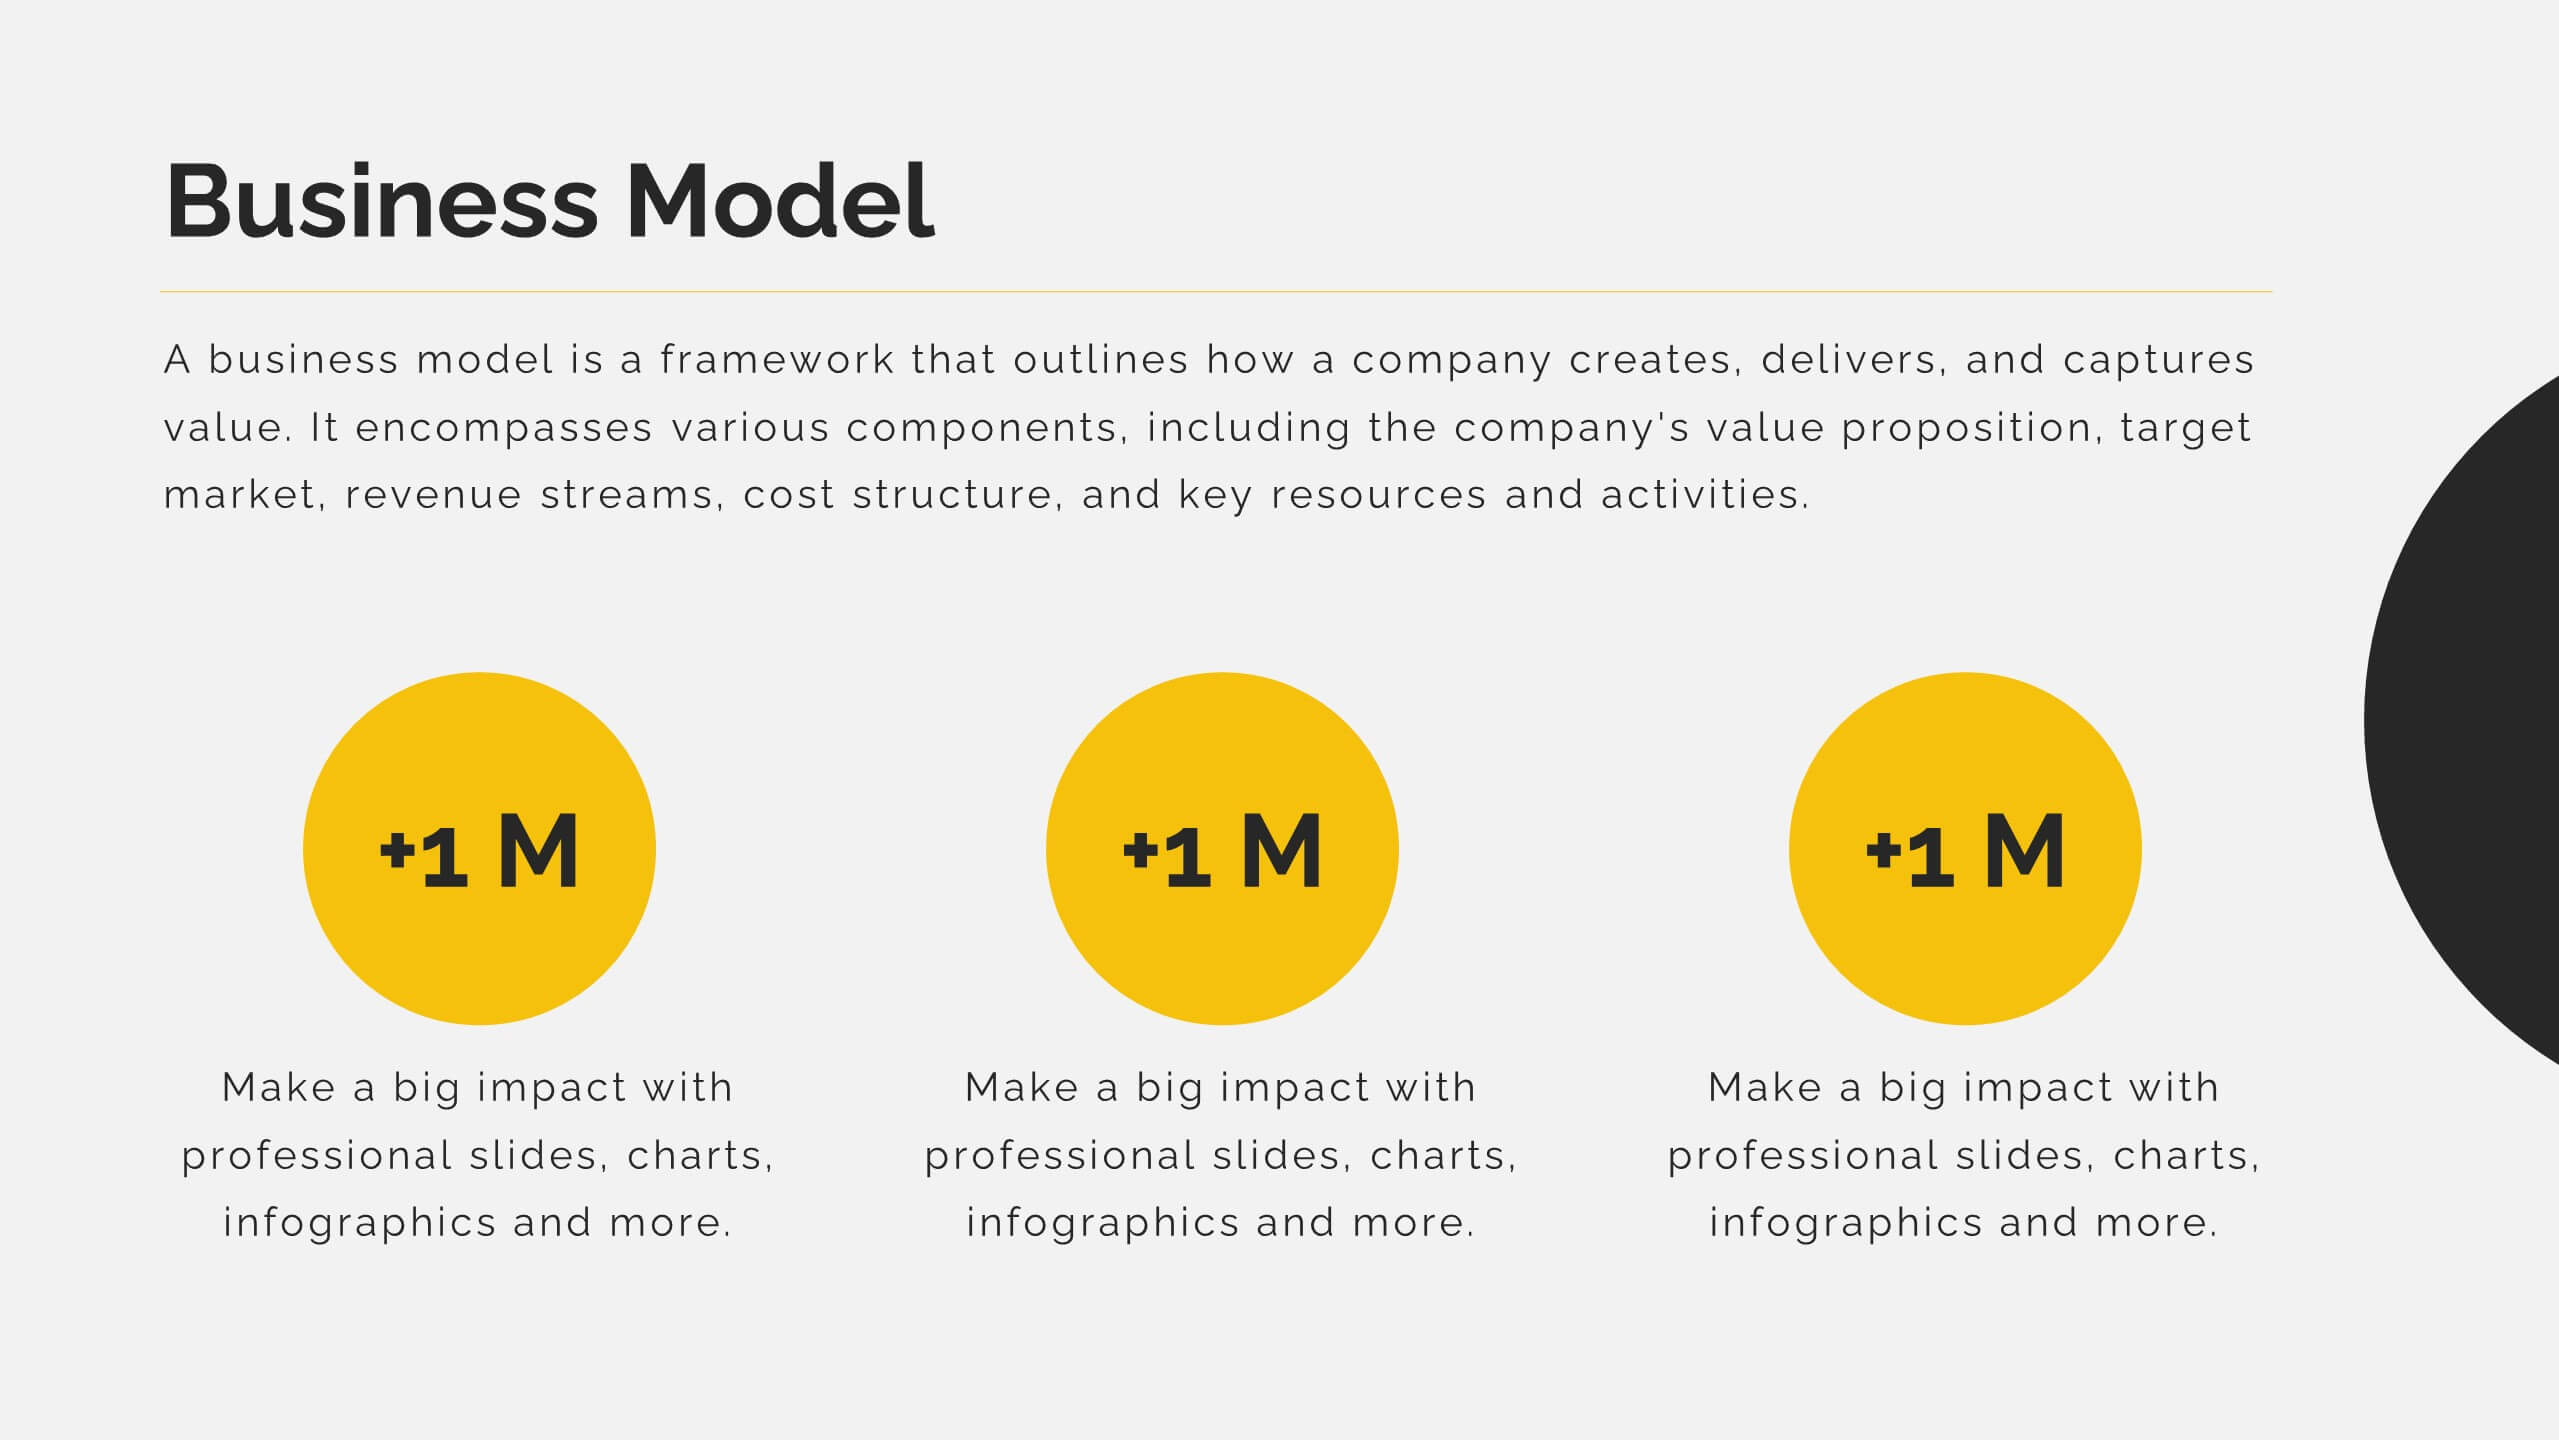
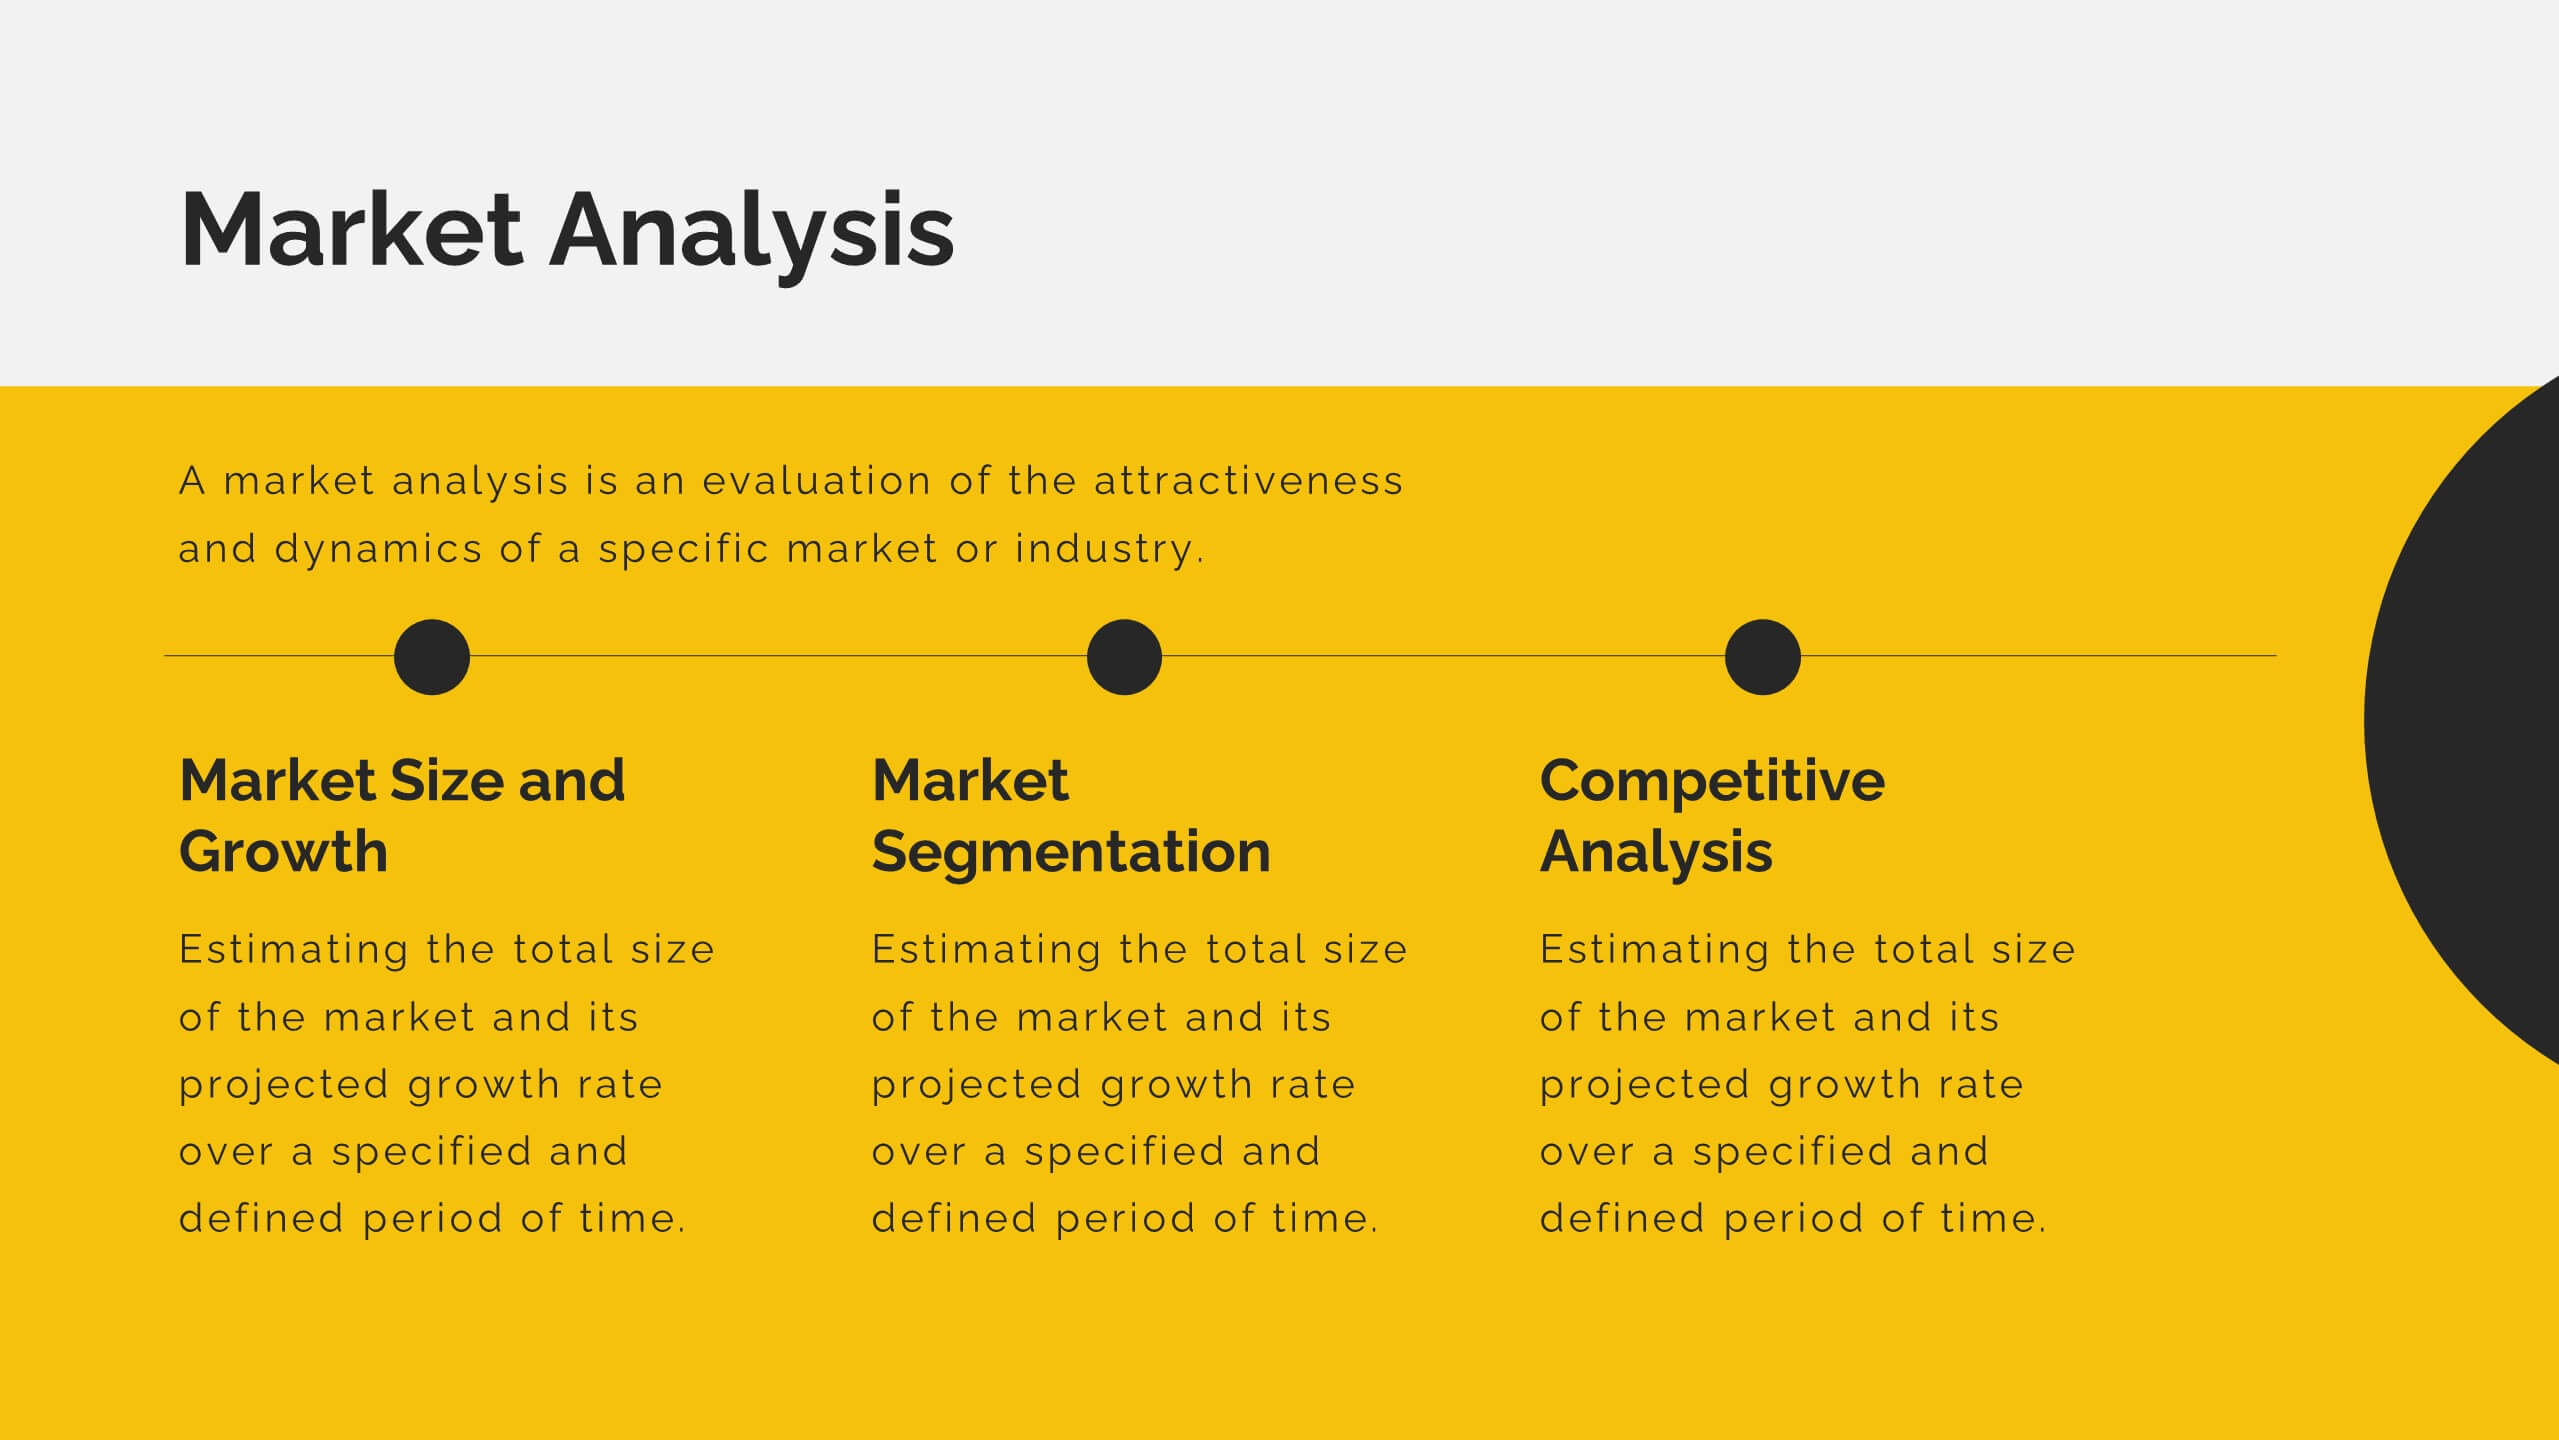
Mirage Startup Funding Proposal Presentation
Secure funding with this dynamic startup proposal template! Perfect for presenting your mission, vision, business model, and market analysis. Ideal for entrepreneurs aiming to impress investors and stakeholders. Compatible with PowerPoint, Keynote, and Google Slides, this template ensures your proposal is clear, professional, and compelling. Achieve your startup goals today!


6 diapositivas
Geographic Asia Overview Template Presentation
Discover insights across Asia with a clean, professional layout that brings your regional data to life. Perfect for showcasing demographics, market distribution, or geographic highlights, this visual map design ensures clarity and impact in every slide. Fully compatible with PowerPoint, Keynote, and Google Slides for effortless editing and presentation.


26 diapositivas
Flowers Bold Company Profile Presentation
Step into the enchanting garden of happy flowers, where petals dance and colors sing. Our template, awash in sunlit shades of pink, yellow, orange, and blue, encapsulates the very essence of floral joy. Bursting with vibrant graphics, whimsical icons, and cheerful image placeholders, it's a bouquet of design brilliance. Crafted to perfection for Powerpoint, Keynote, or Google Slides. A delightful pick for florists, garden enthusiasts, event planners, or anyone looking to infuse their presentation with a touch of nature's merriment. Blossom your ideas; let your presentations bloom with happiness.


6 diapositivas
Iceberg Business Infographic
Delve beneath the surface with our Iceberg Business Infographic, perfect for Powerpoint, Google Slides, and Keynote. This infographic is designed to illustrate the underlying factors that impact an organization's success. The iceberg metaphor visually represents the concept that only a small part of a company's situation is visible above the surface, while much more is hidden below. The customizable segments can be used to detail various aspects of business operations, risks, and opportunities that are not immediately apparent. By employing this Iceberg Business infographic, you can effectively communicate the complexities of business strategies.


4 diapositivas
RACI Matrix for Role Assignment Presentation
Simplify team roles and task ownership with this RACI Matrix for Role Assignment slide. Clearly map out who is Responsible, Accountable, Consulted, and Informed for each project task across team members. Ideal for project planning, team meetings, or stakeholder alignment. This structured matrix layout allows easy customization for names, tasks, and role indicators. Fully editable and compatible with PowerPoint, Keynote, and Google Slides.


4 diapositivas
Roadmap to Personal and Business Success Presentation
Guide your audience through a strategic journey with this roadmap-themed presentation. Featuring traffic cones on a winding path, it’s ideal for illustrating goals, milestones, or stages of development. Fully editable in PowerPoint, Keynote, and Google Slides—perfect for growth plans, personal development, project timelines, or business success strategies.

20 diapositivas
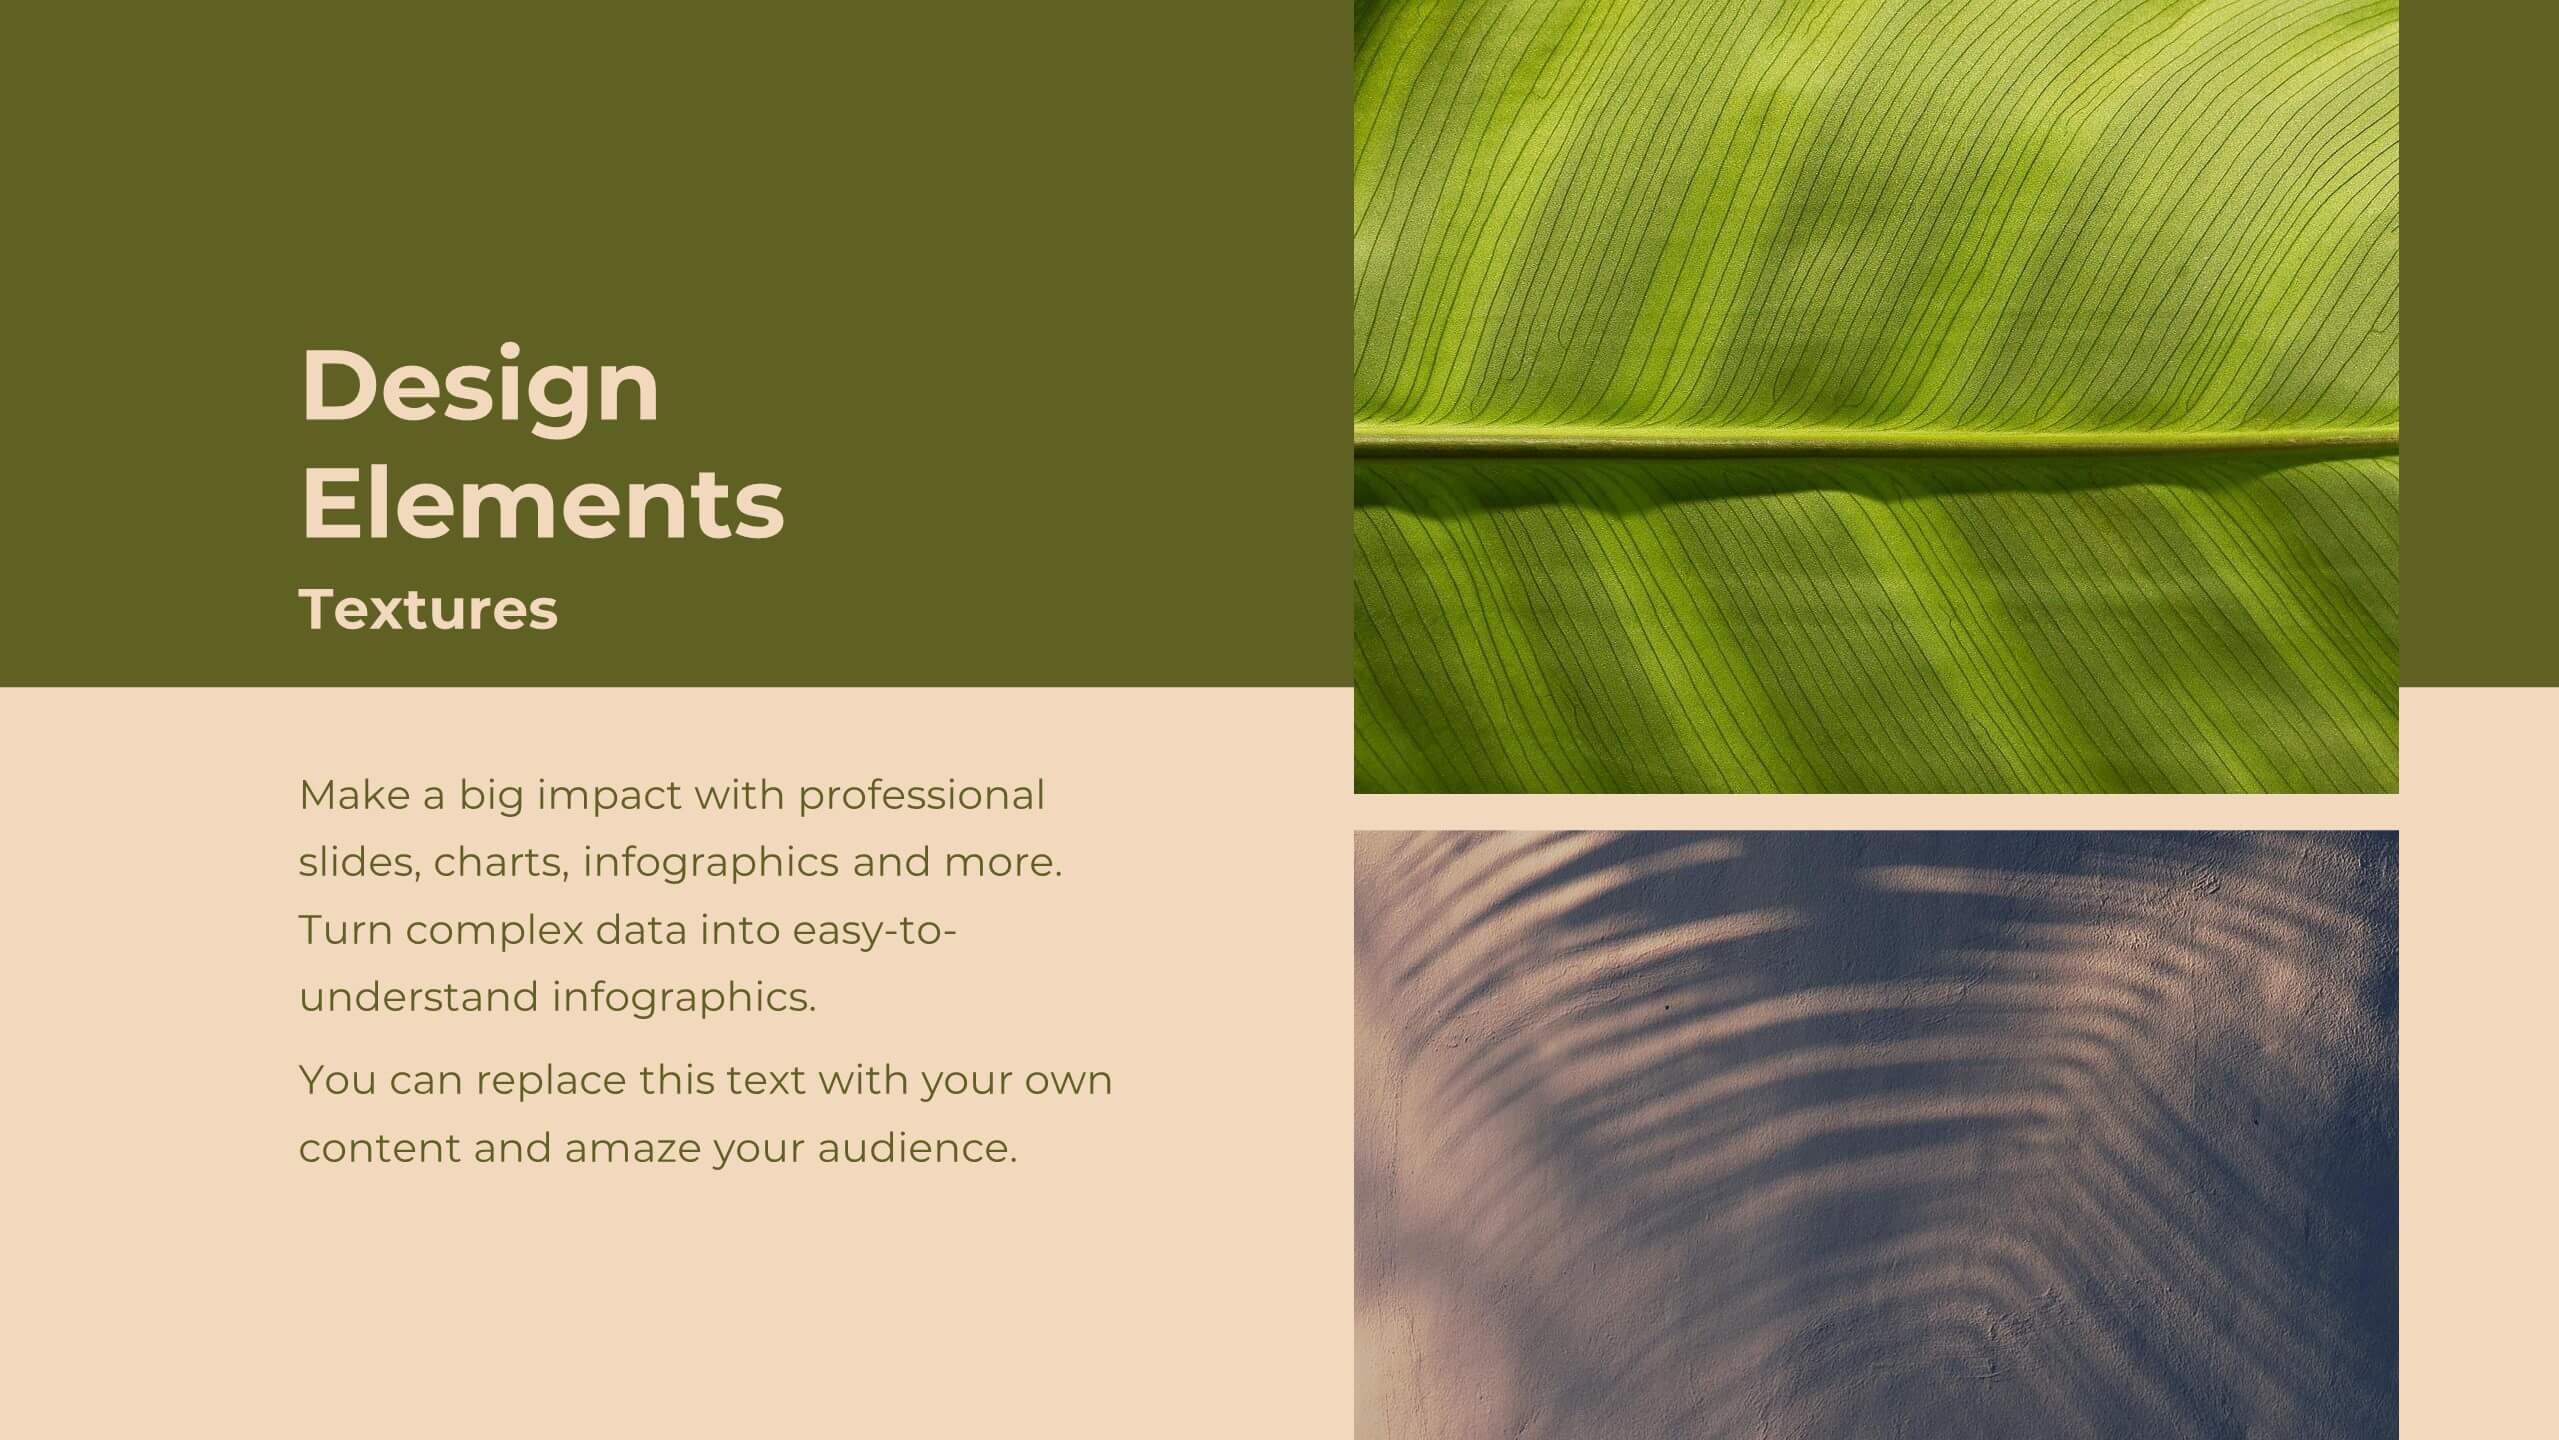
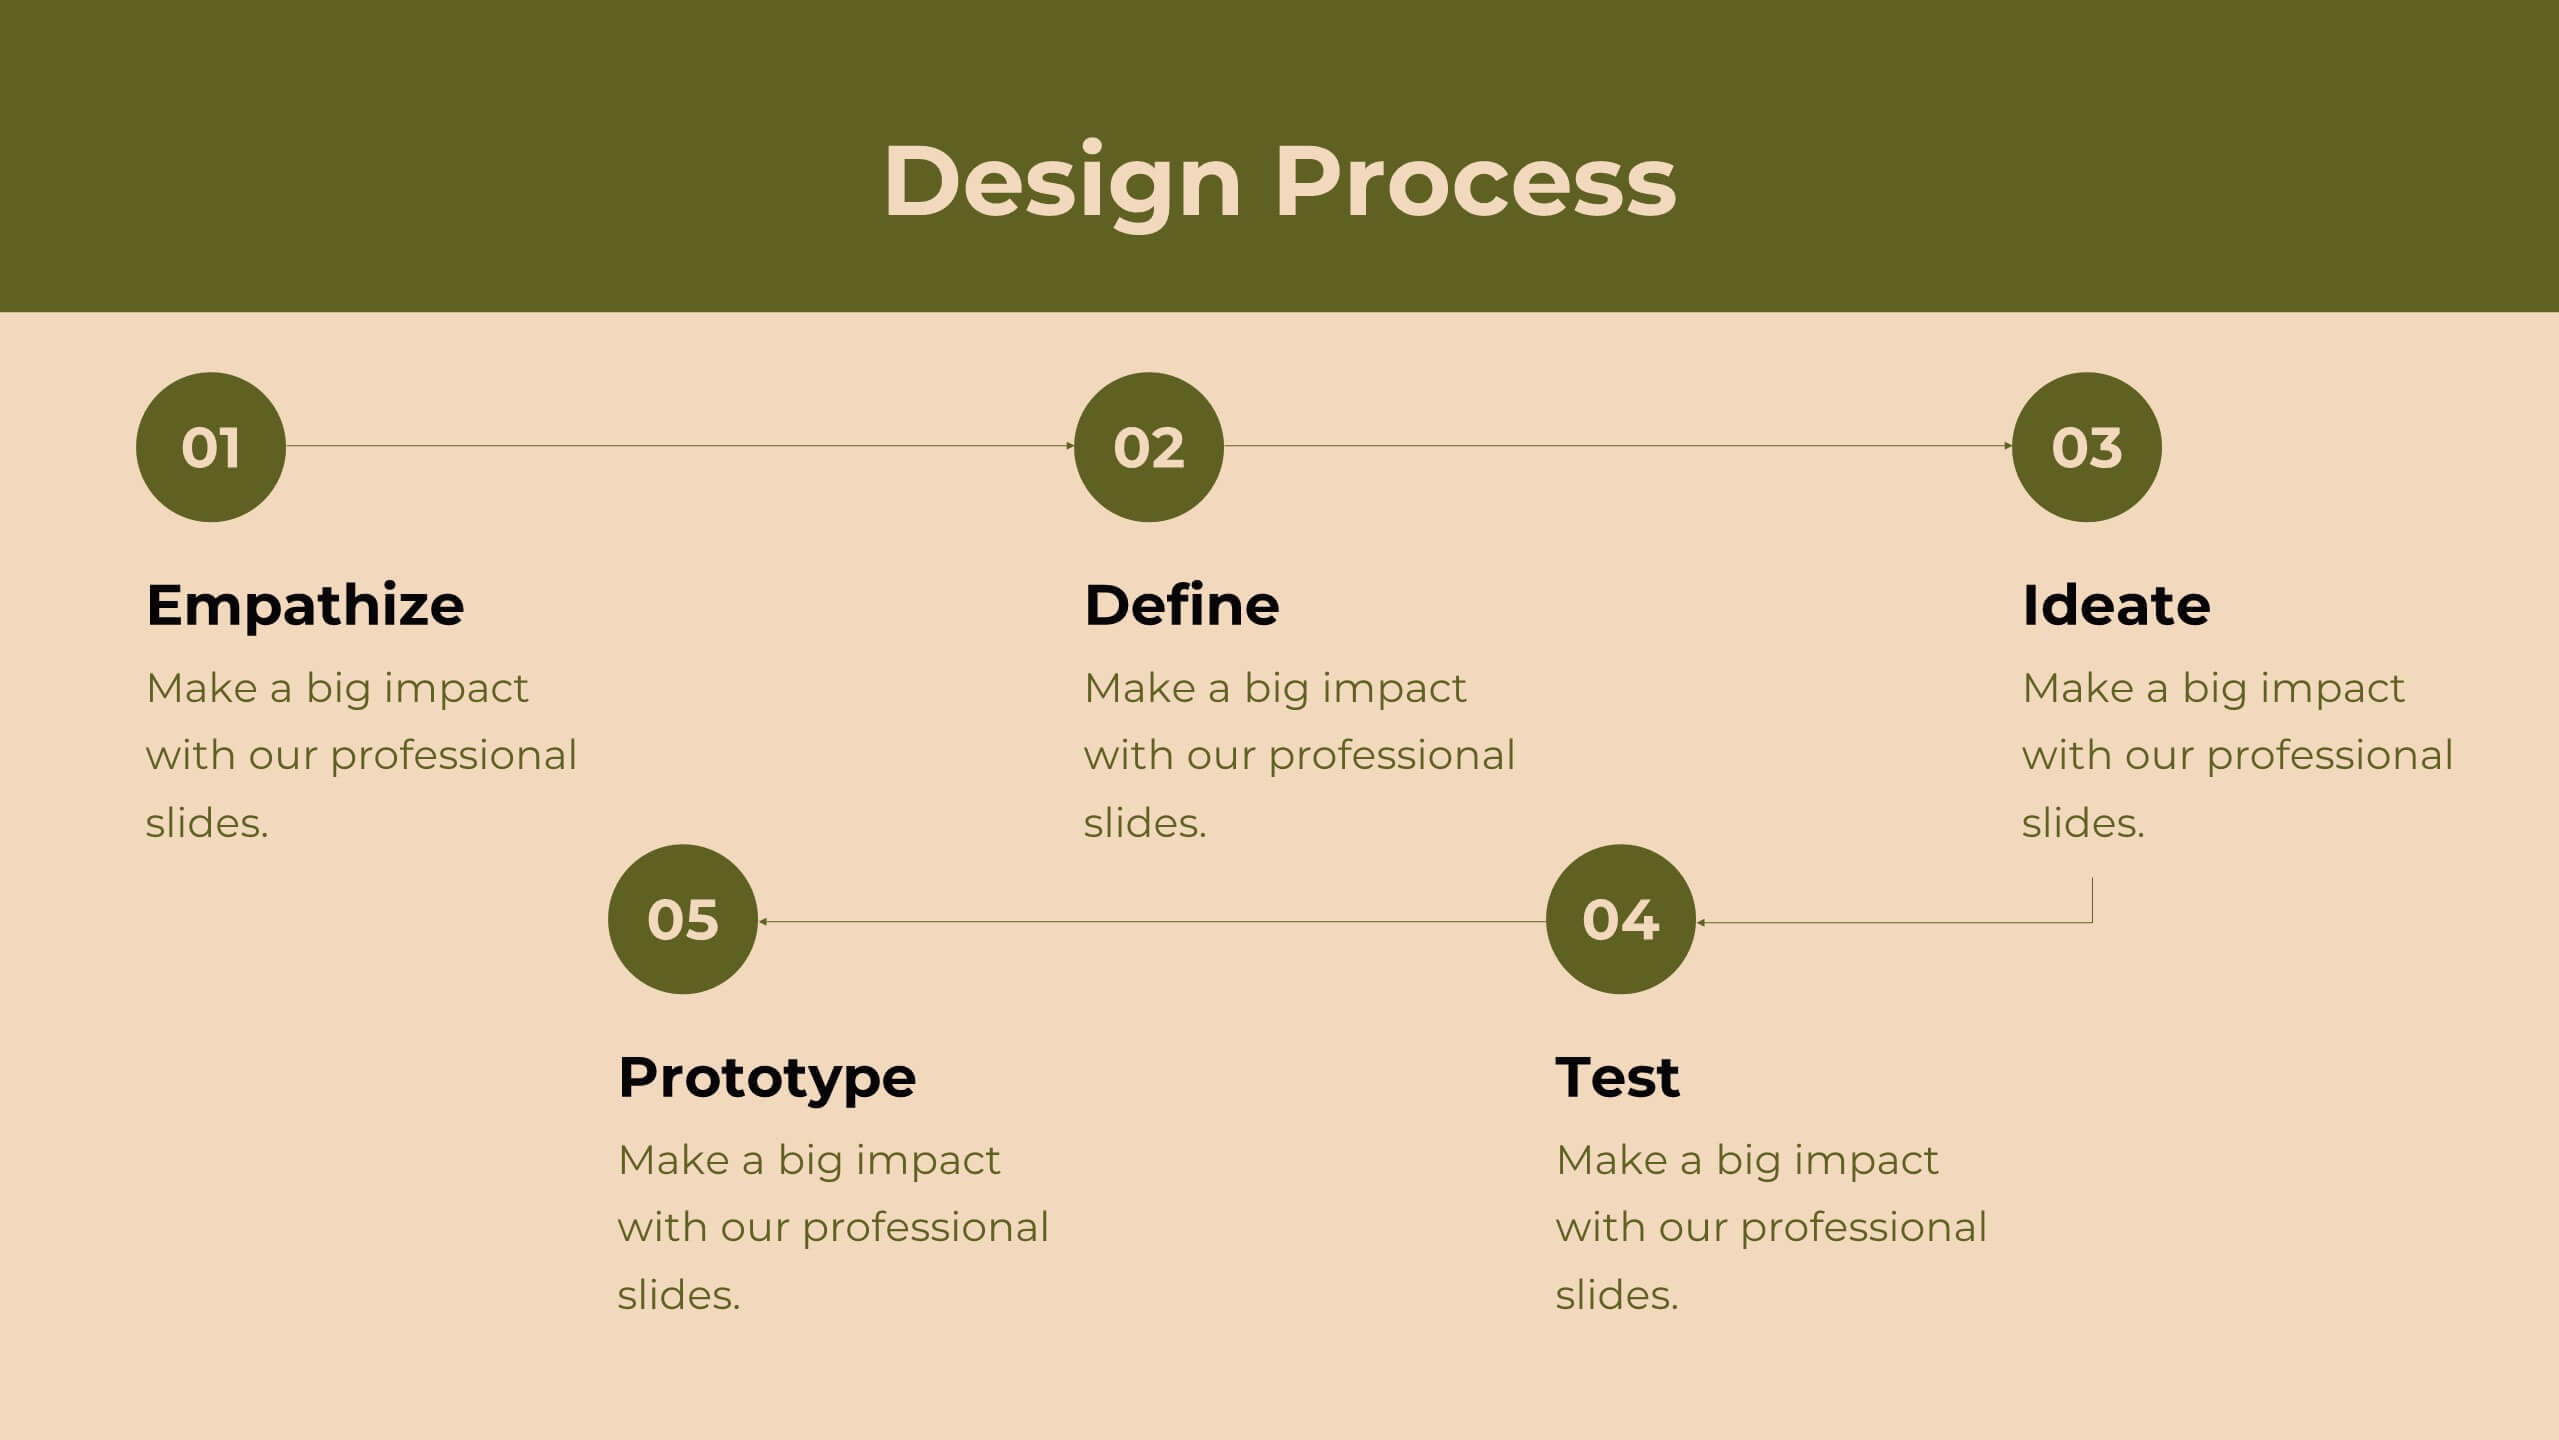
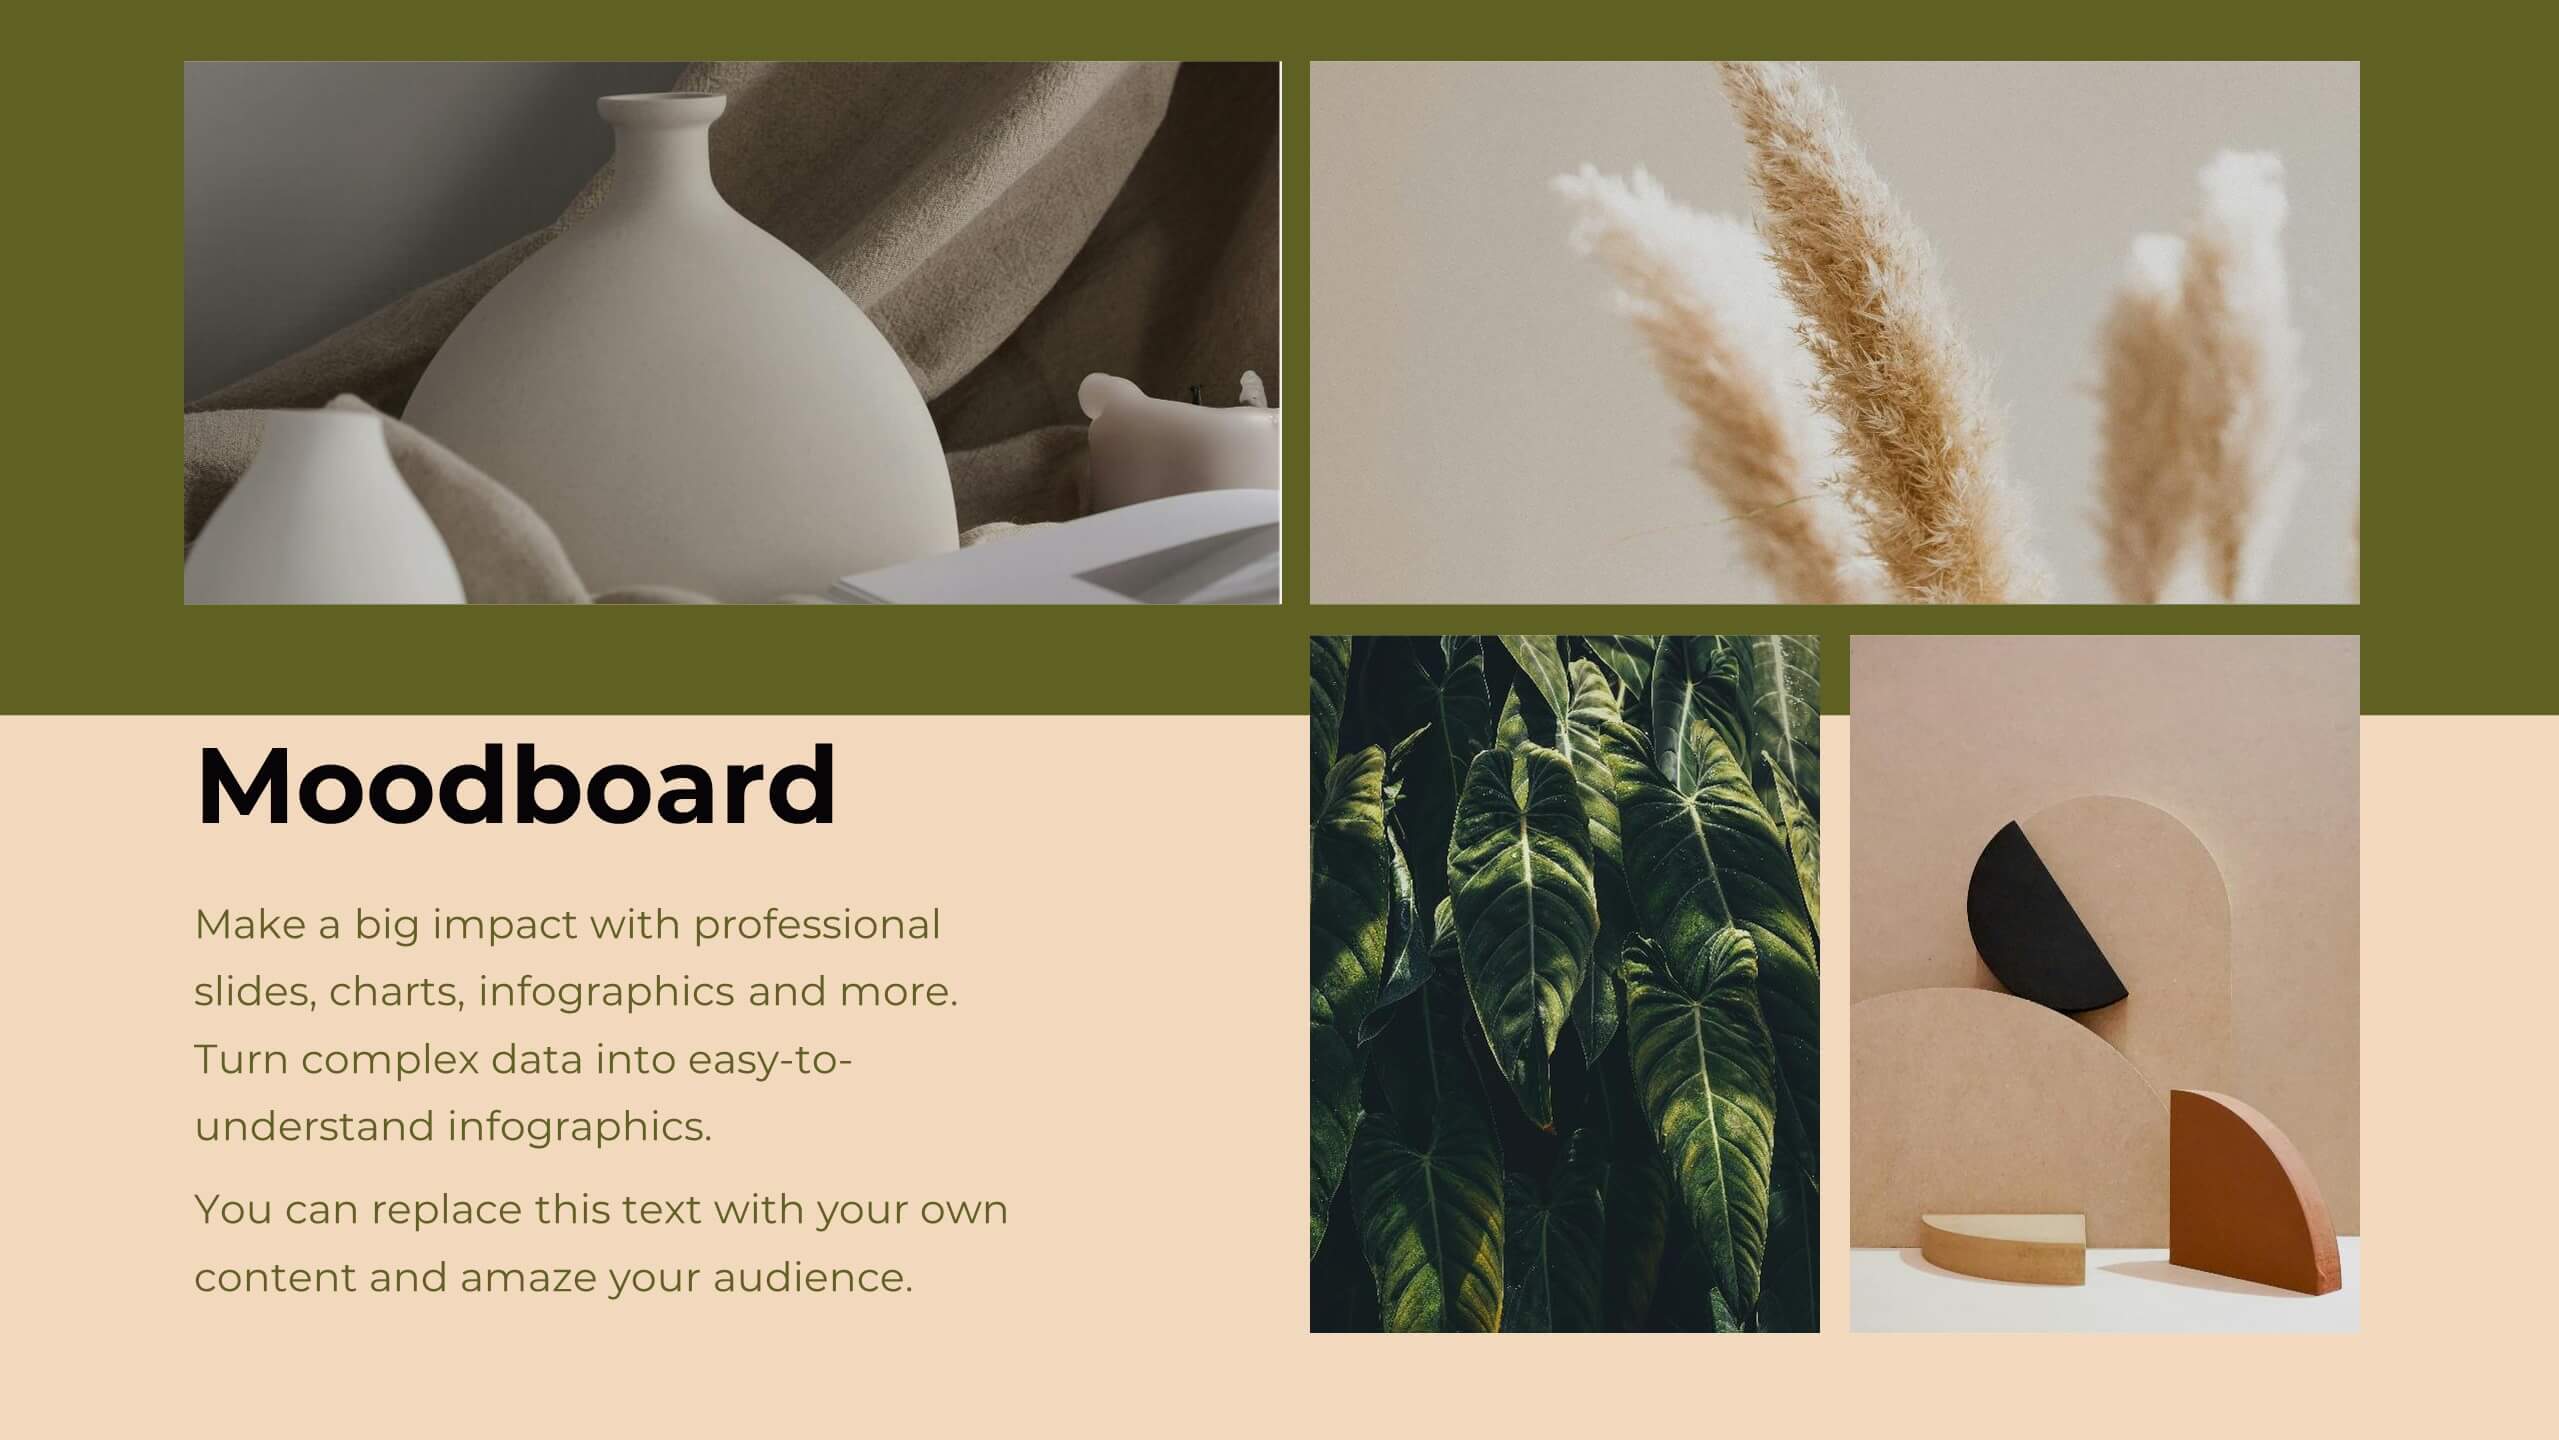
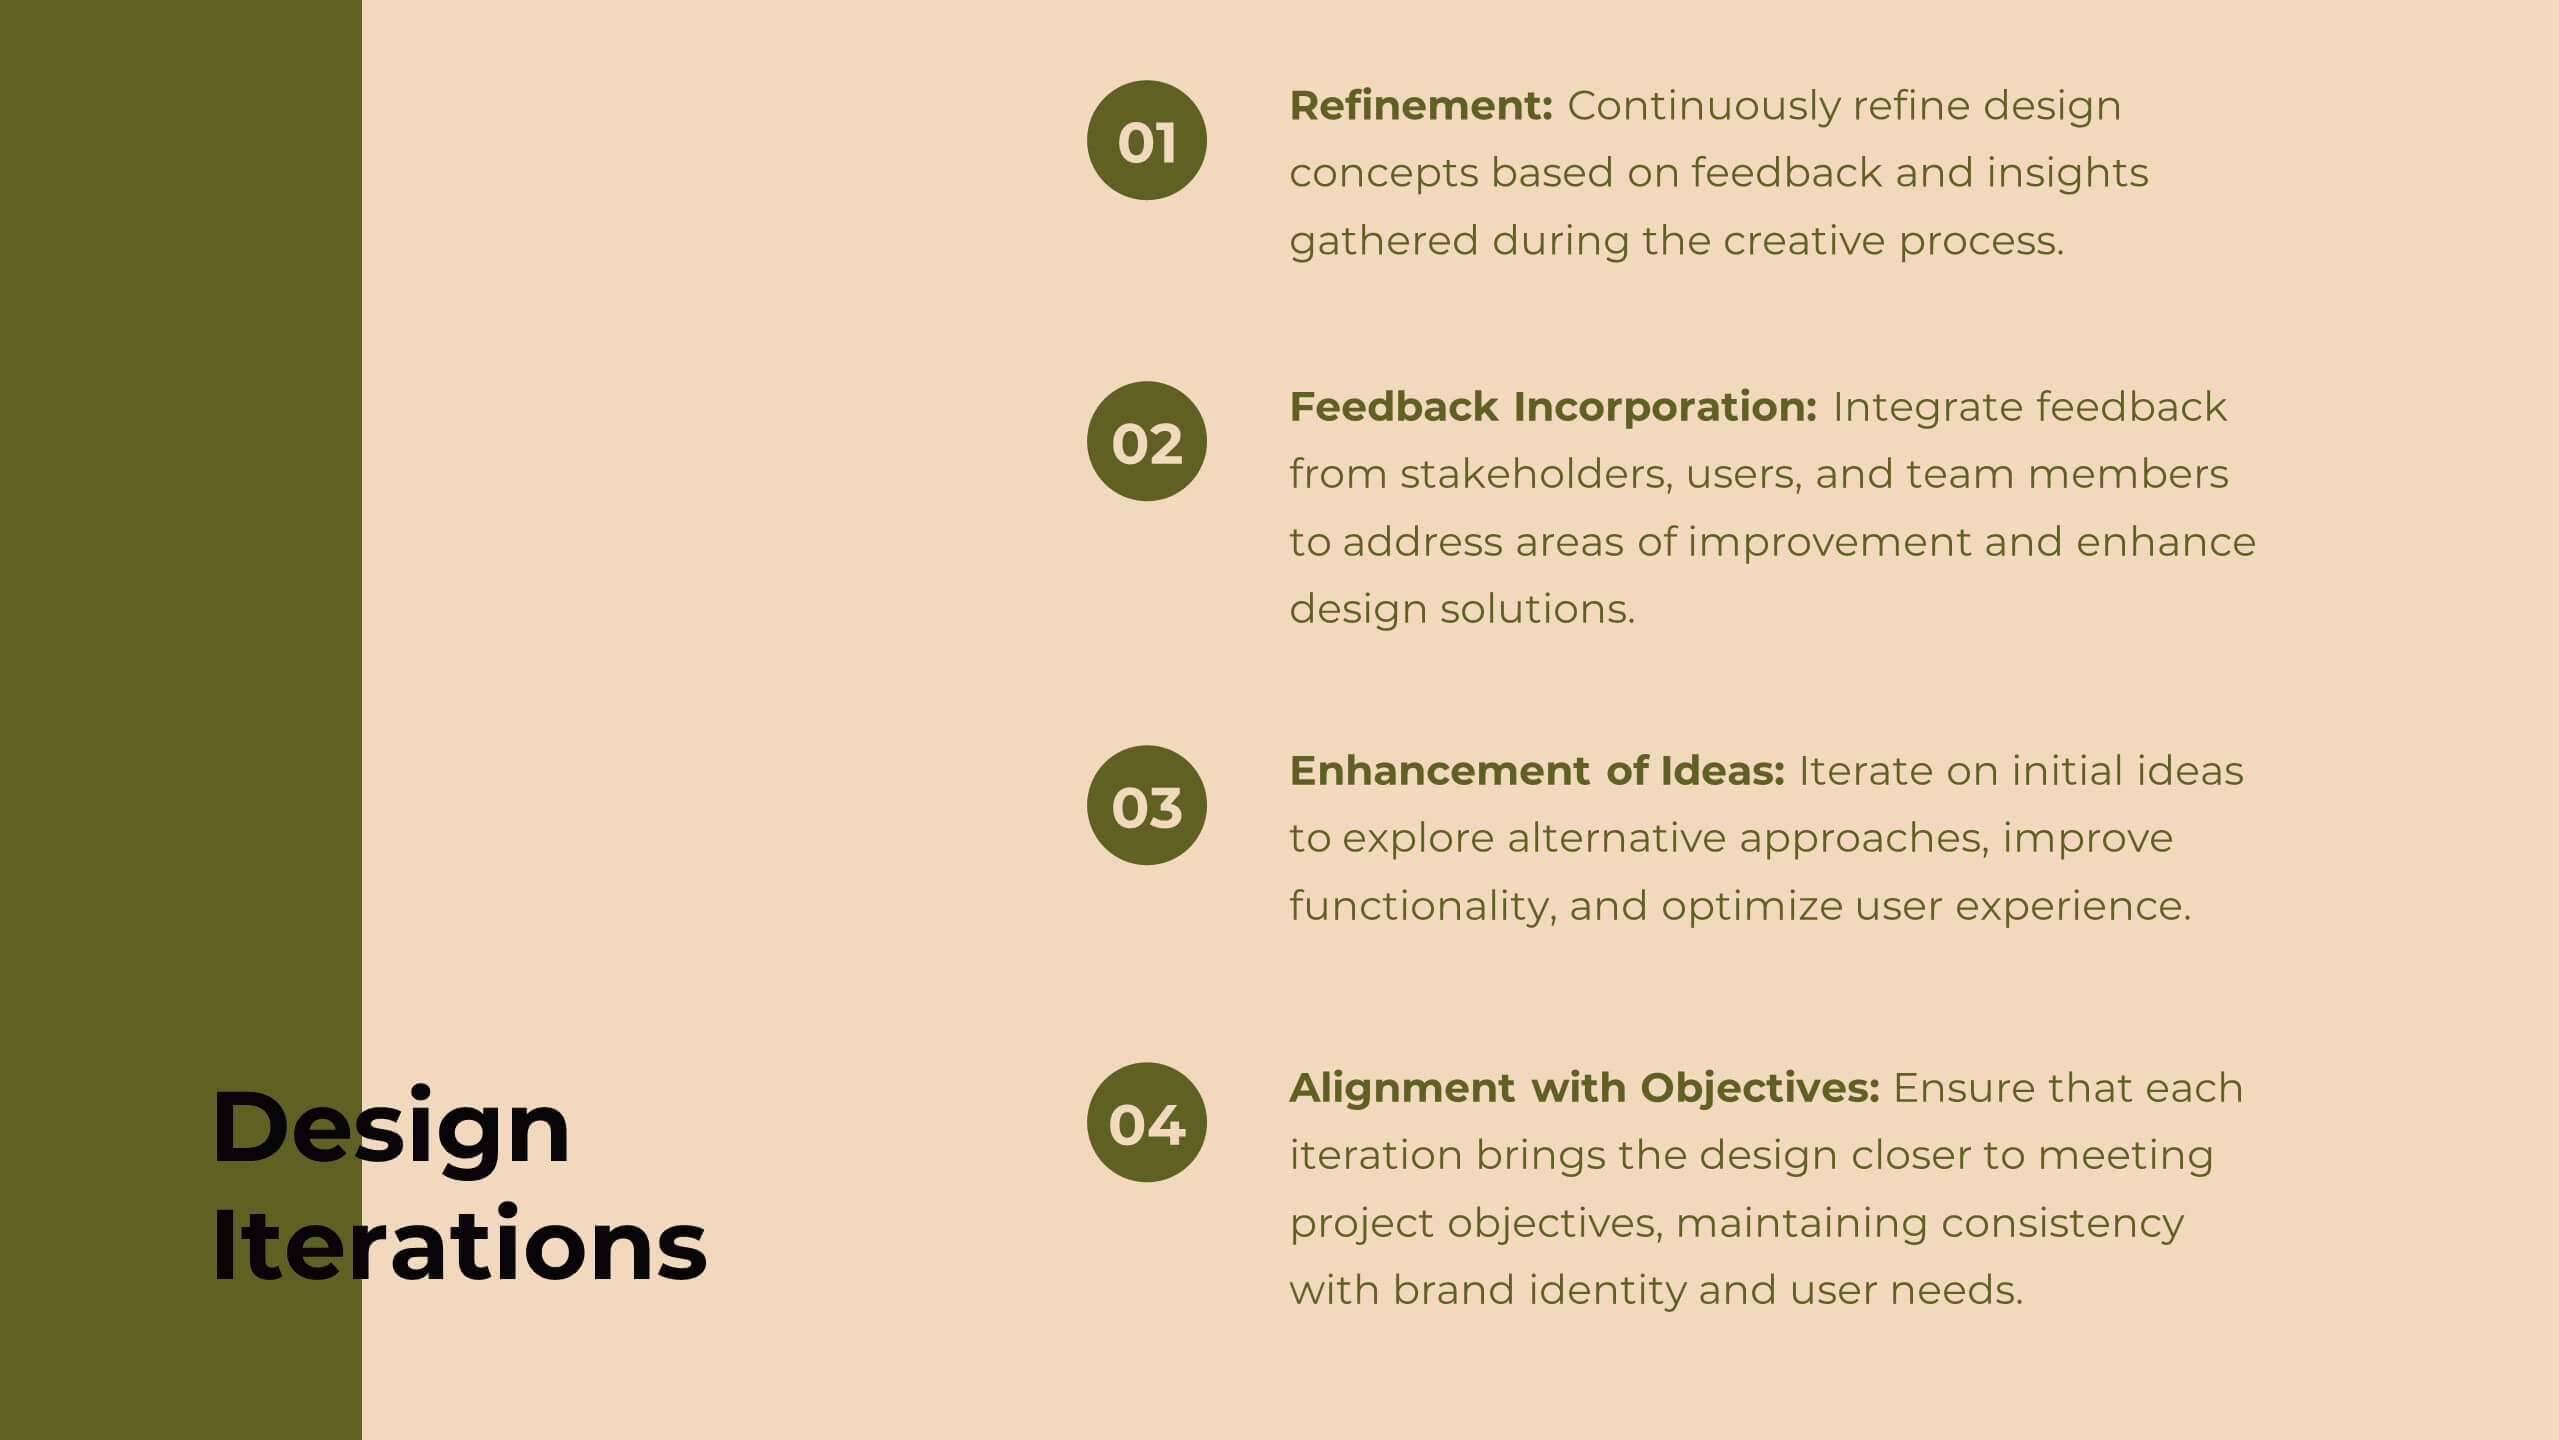
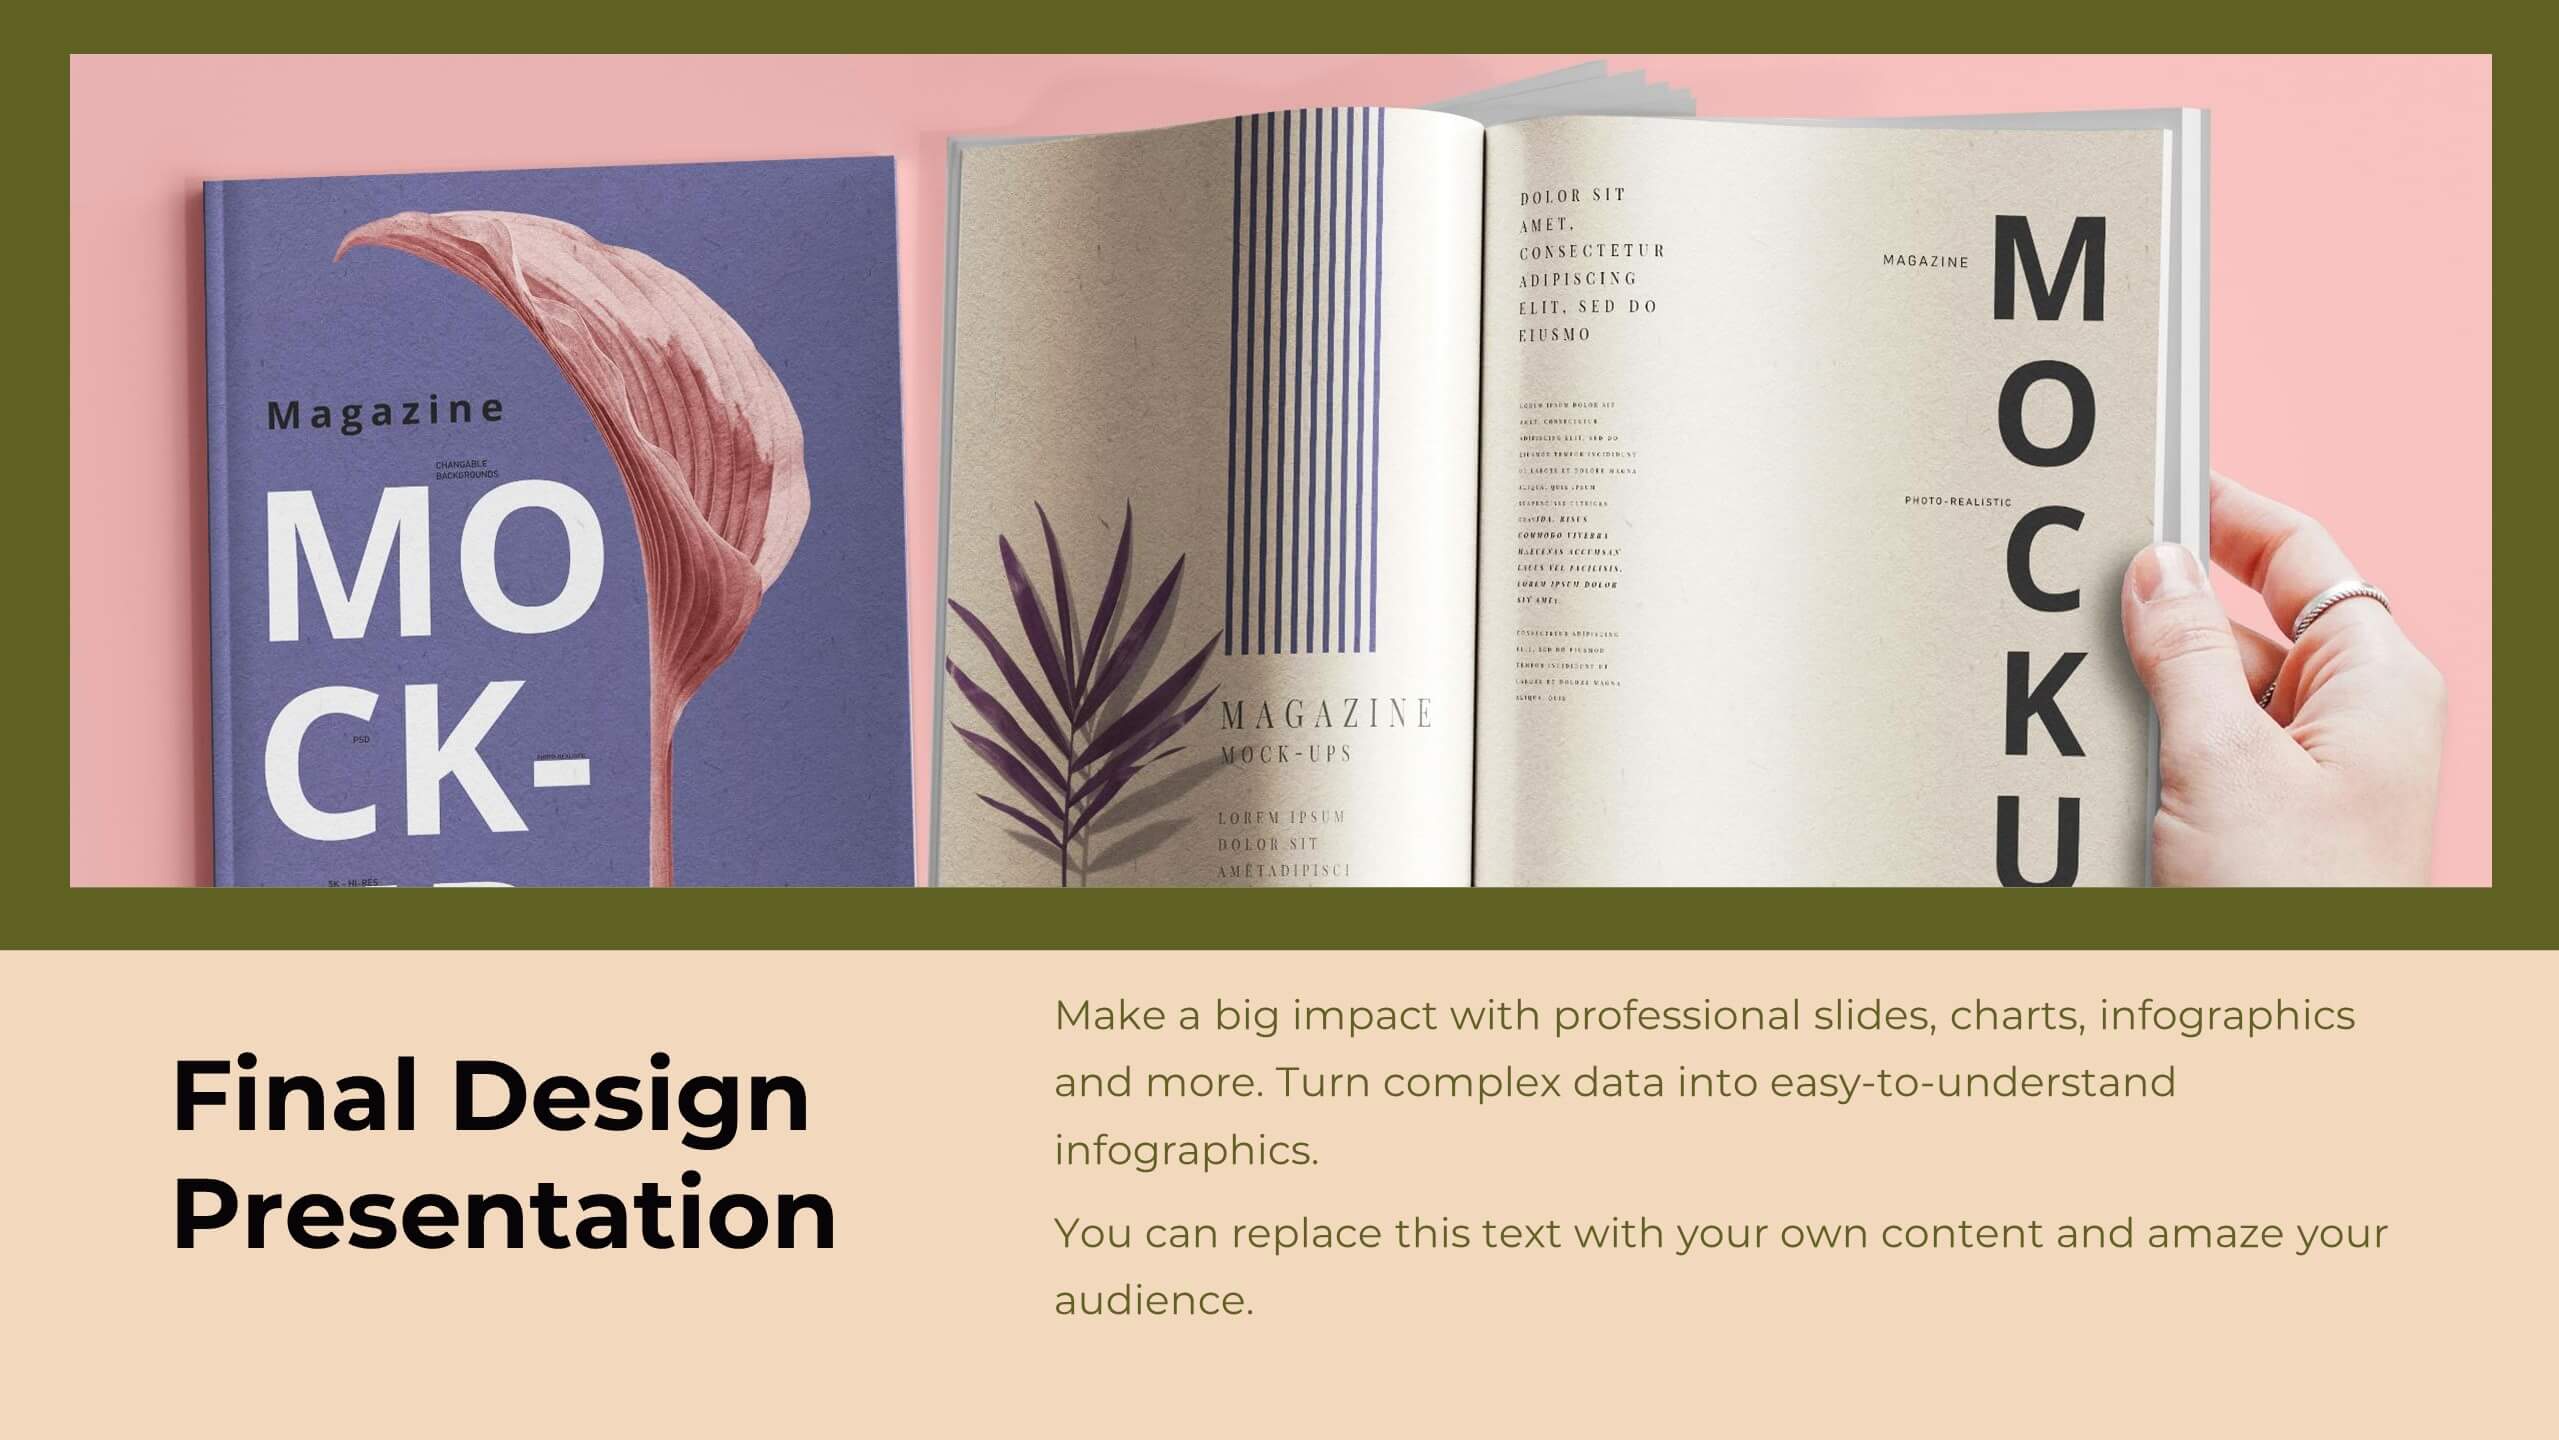
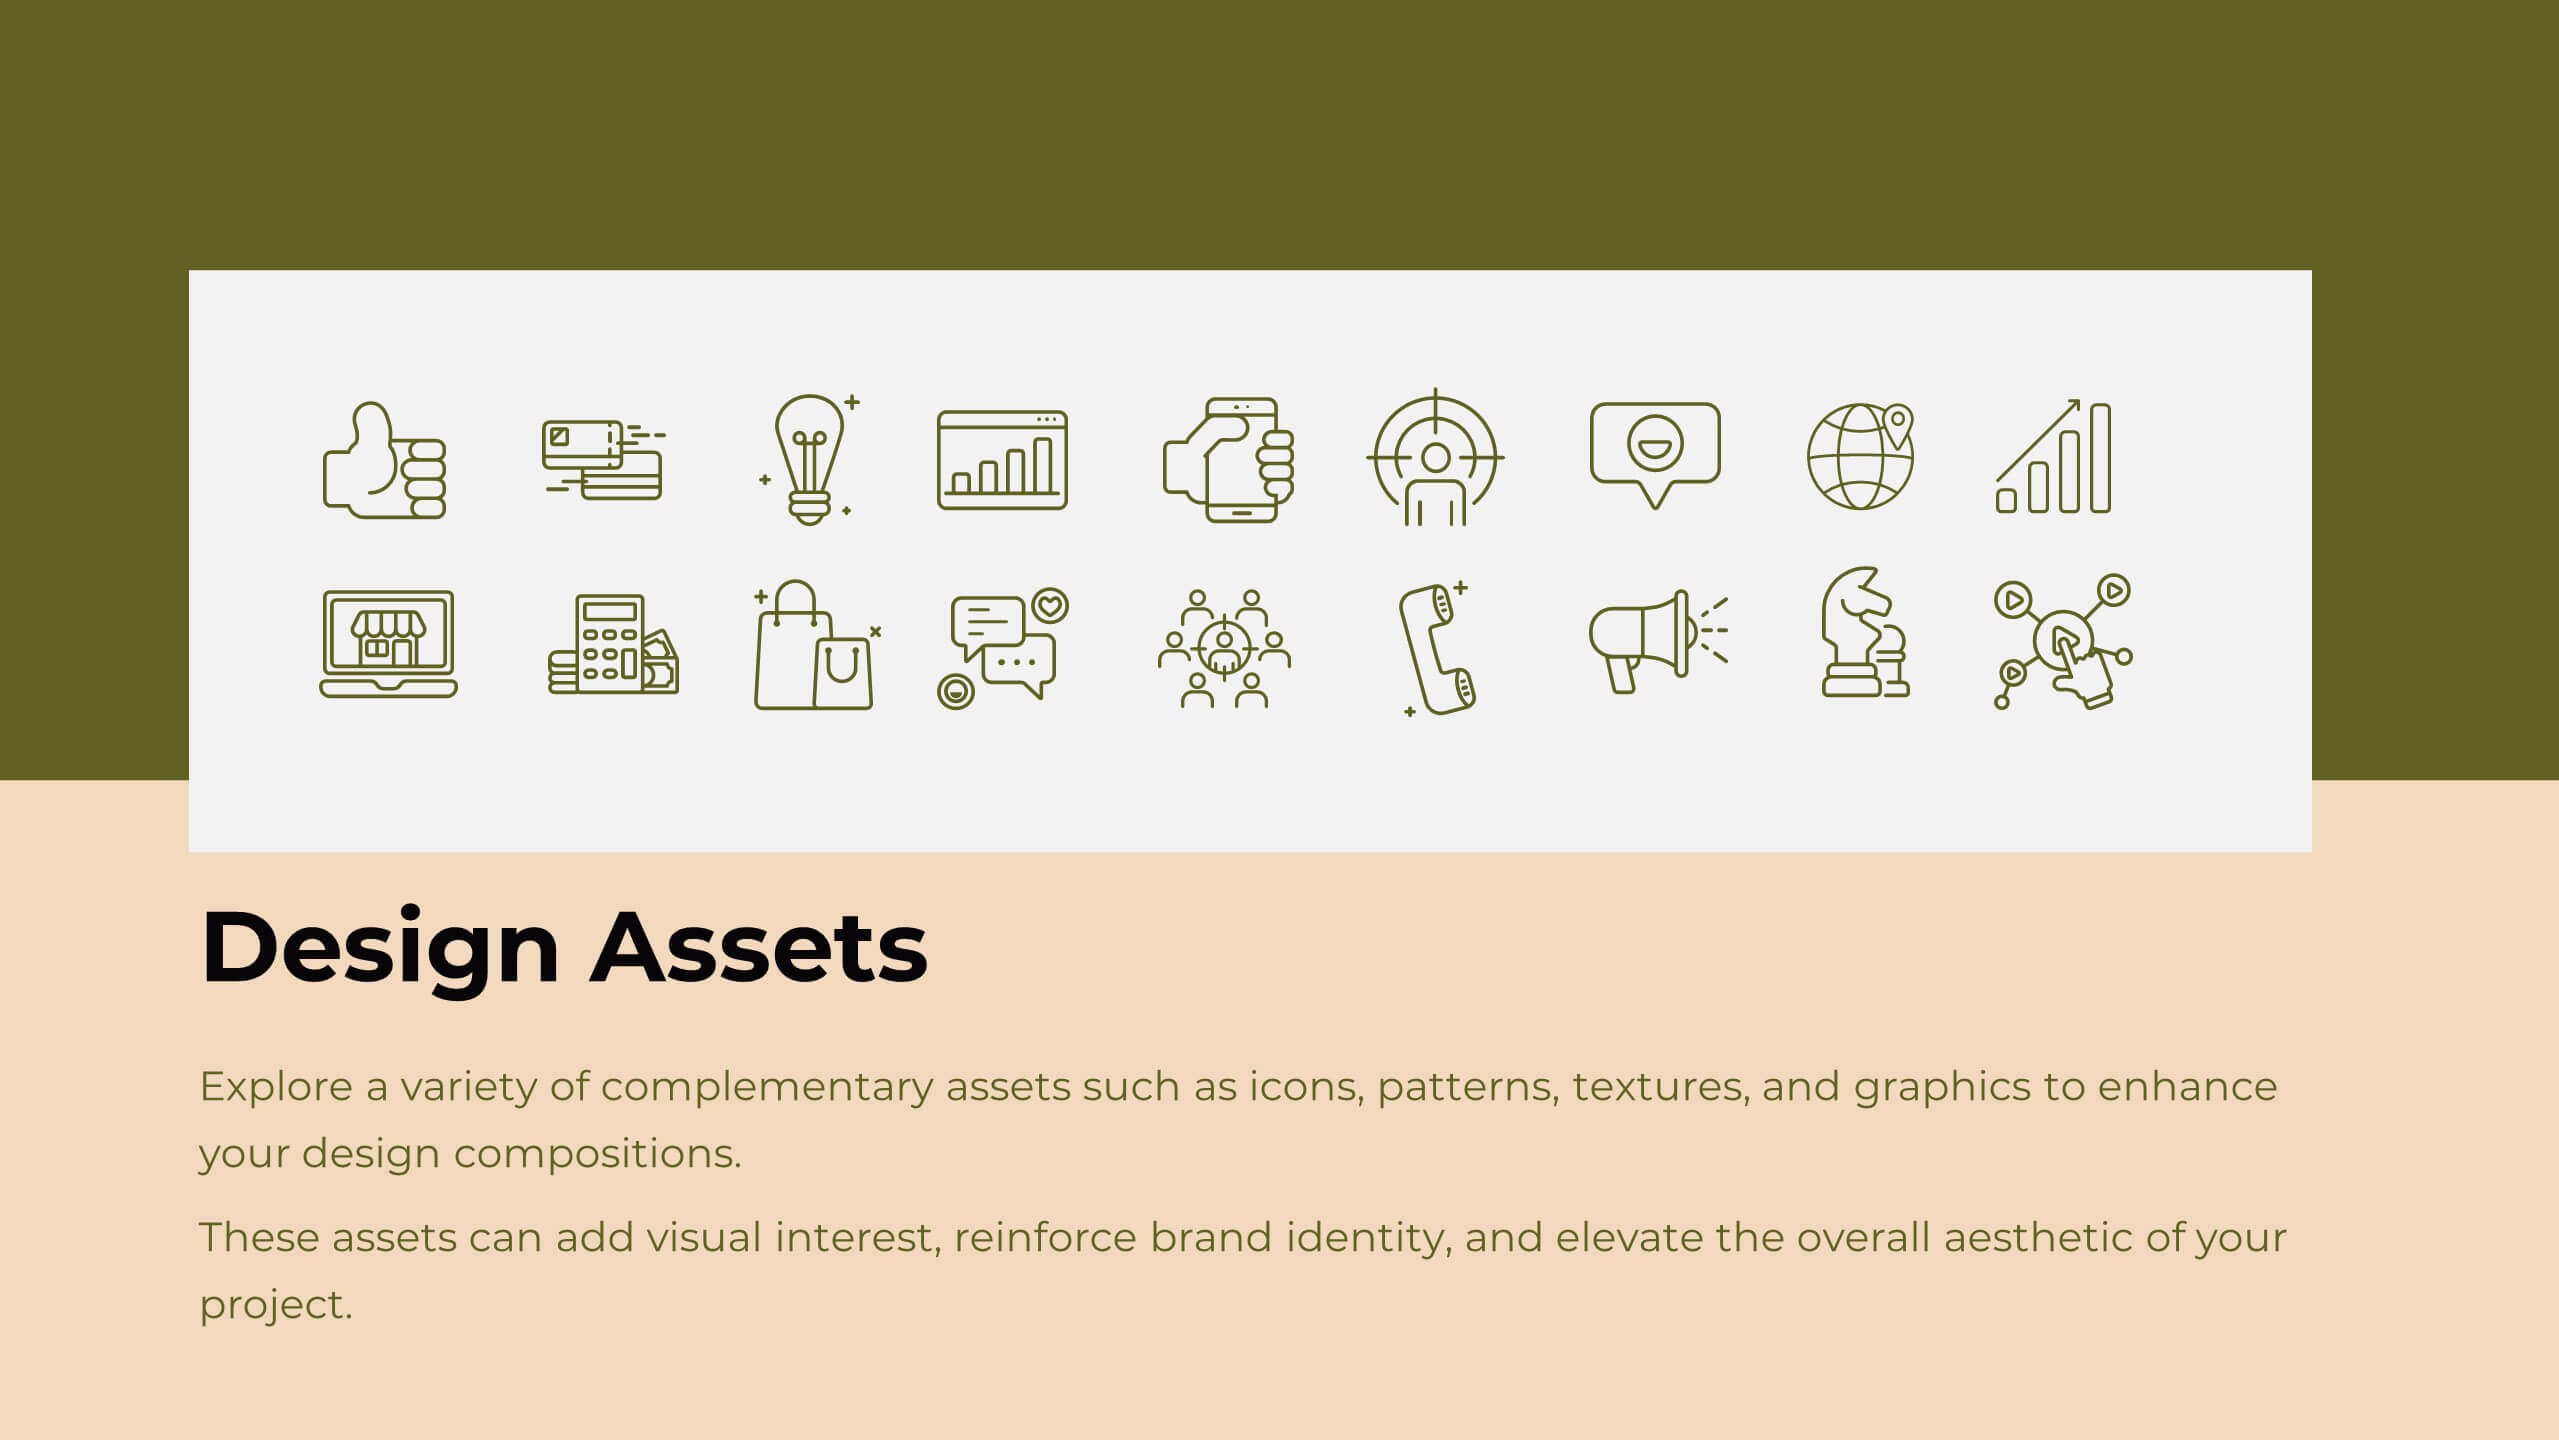
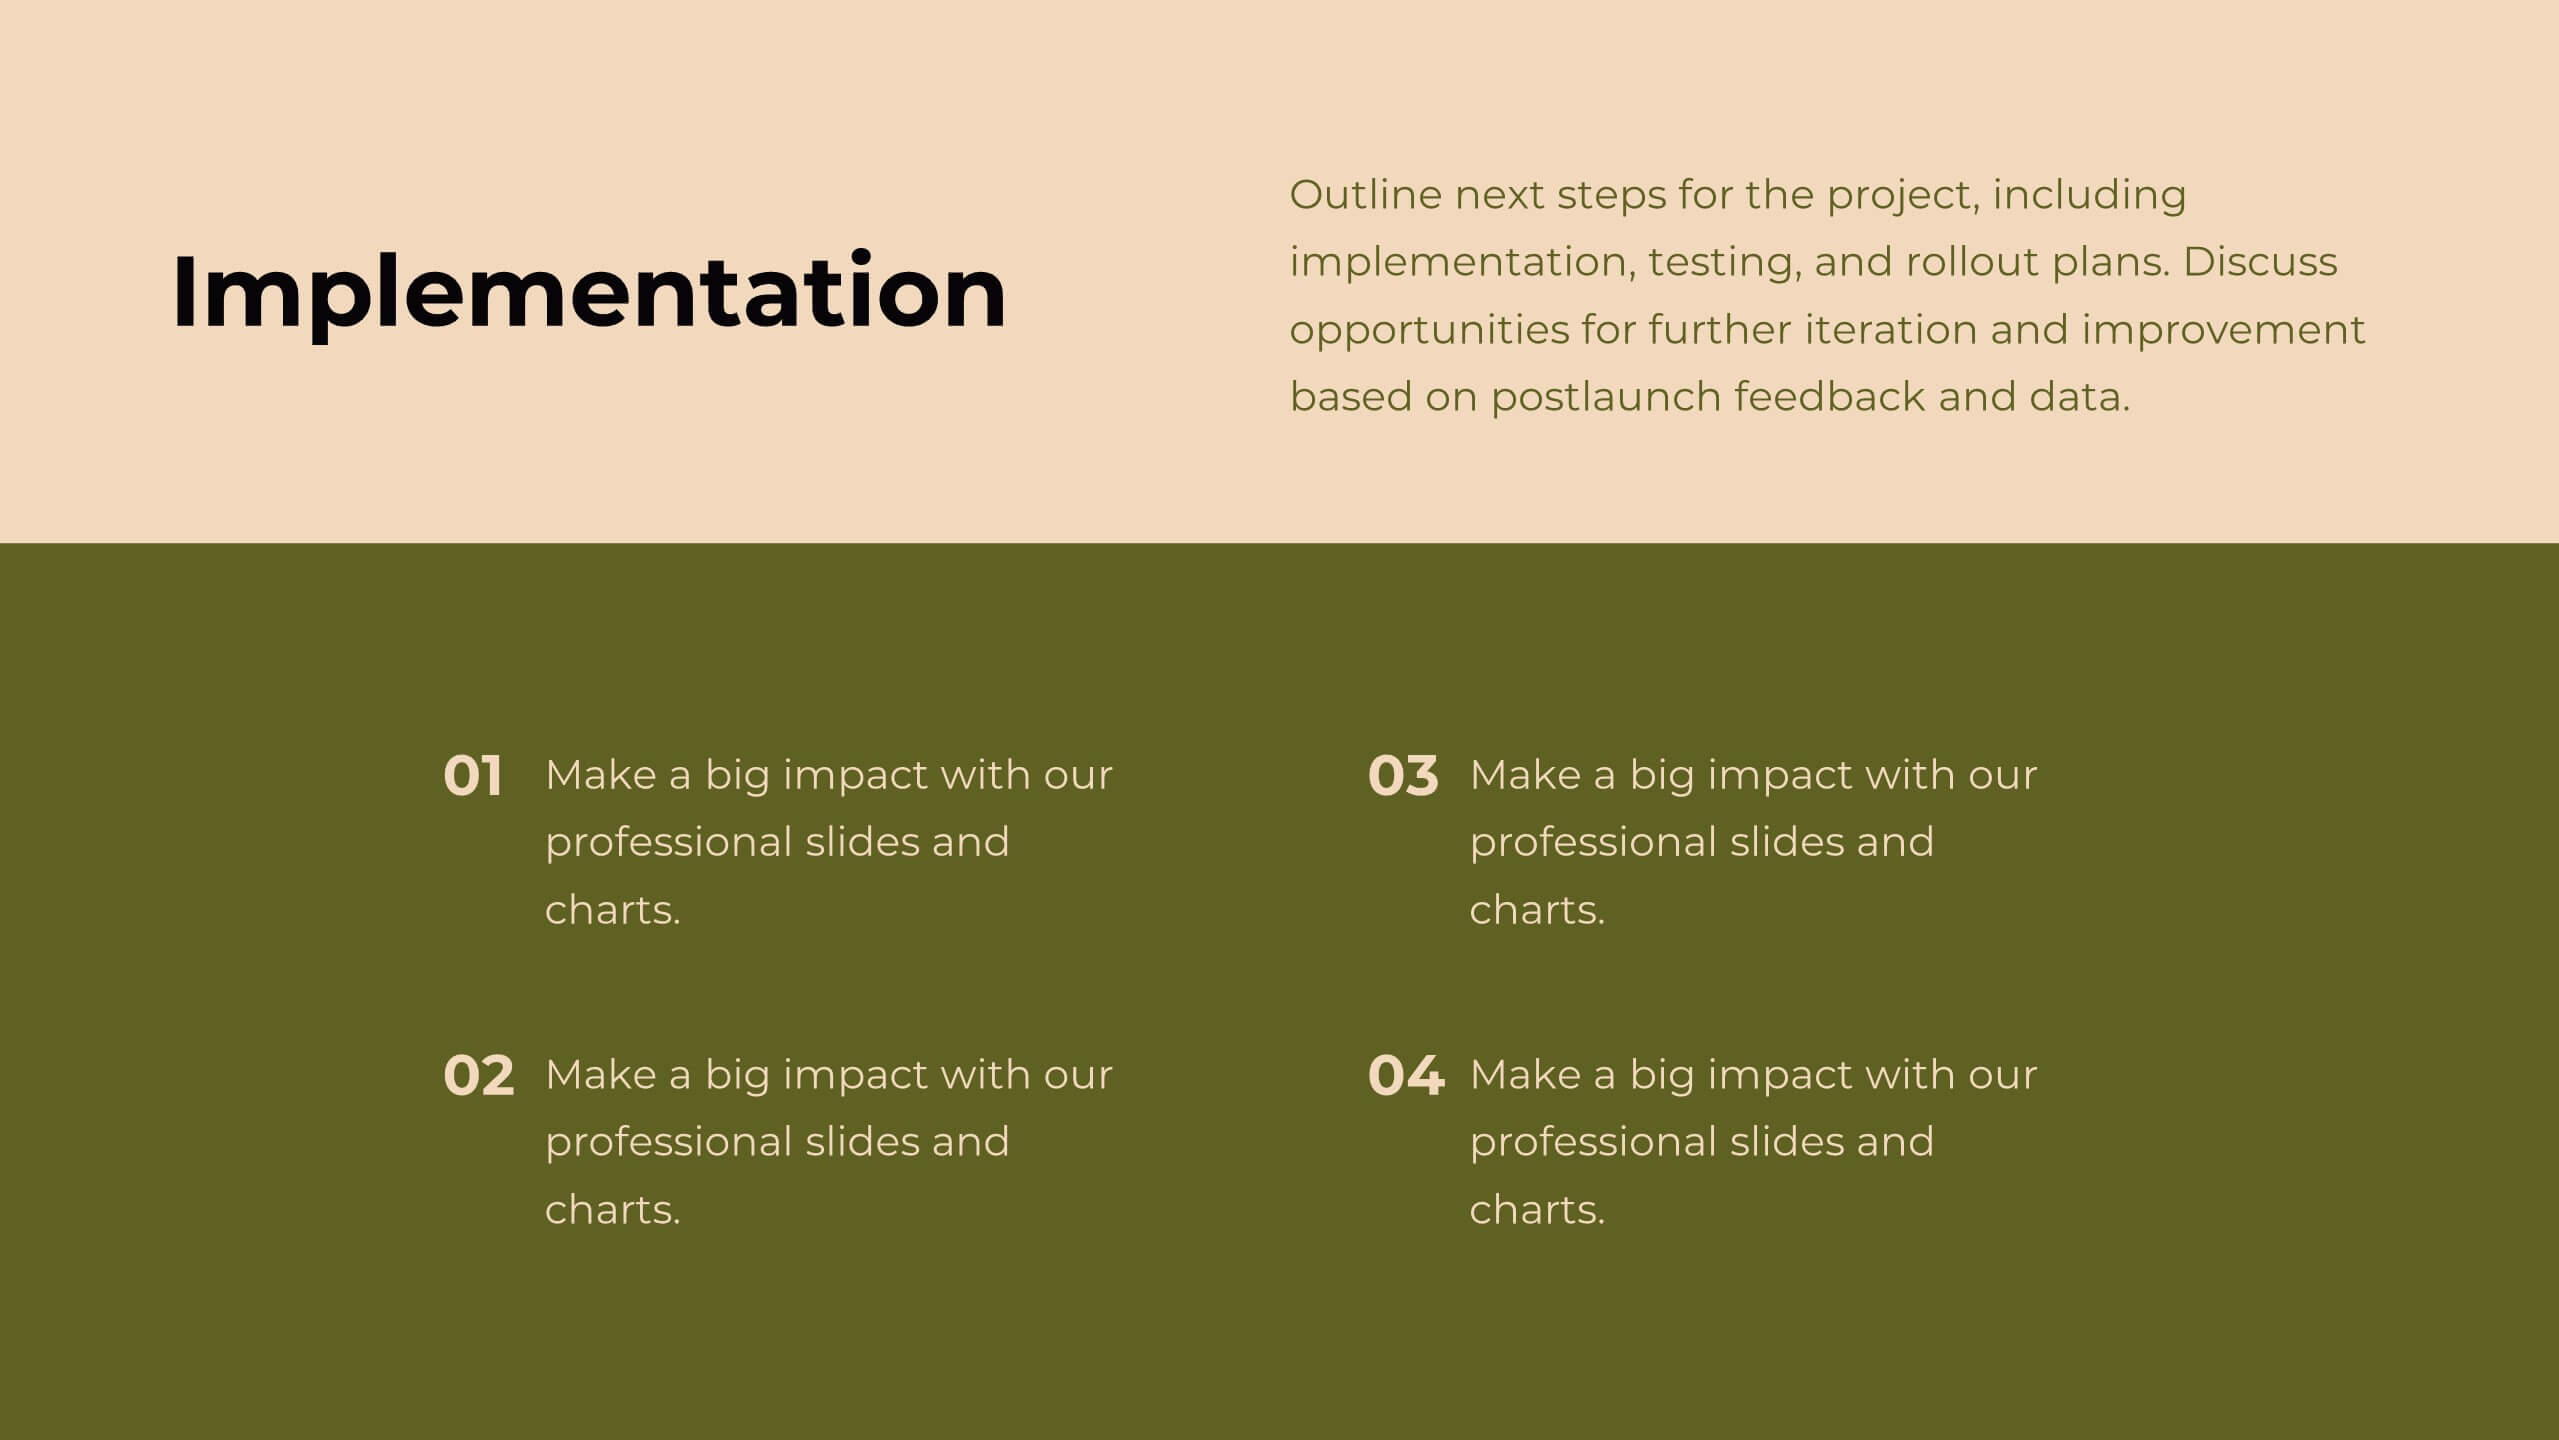
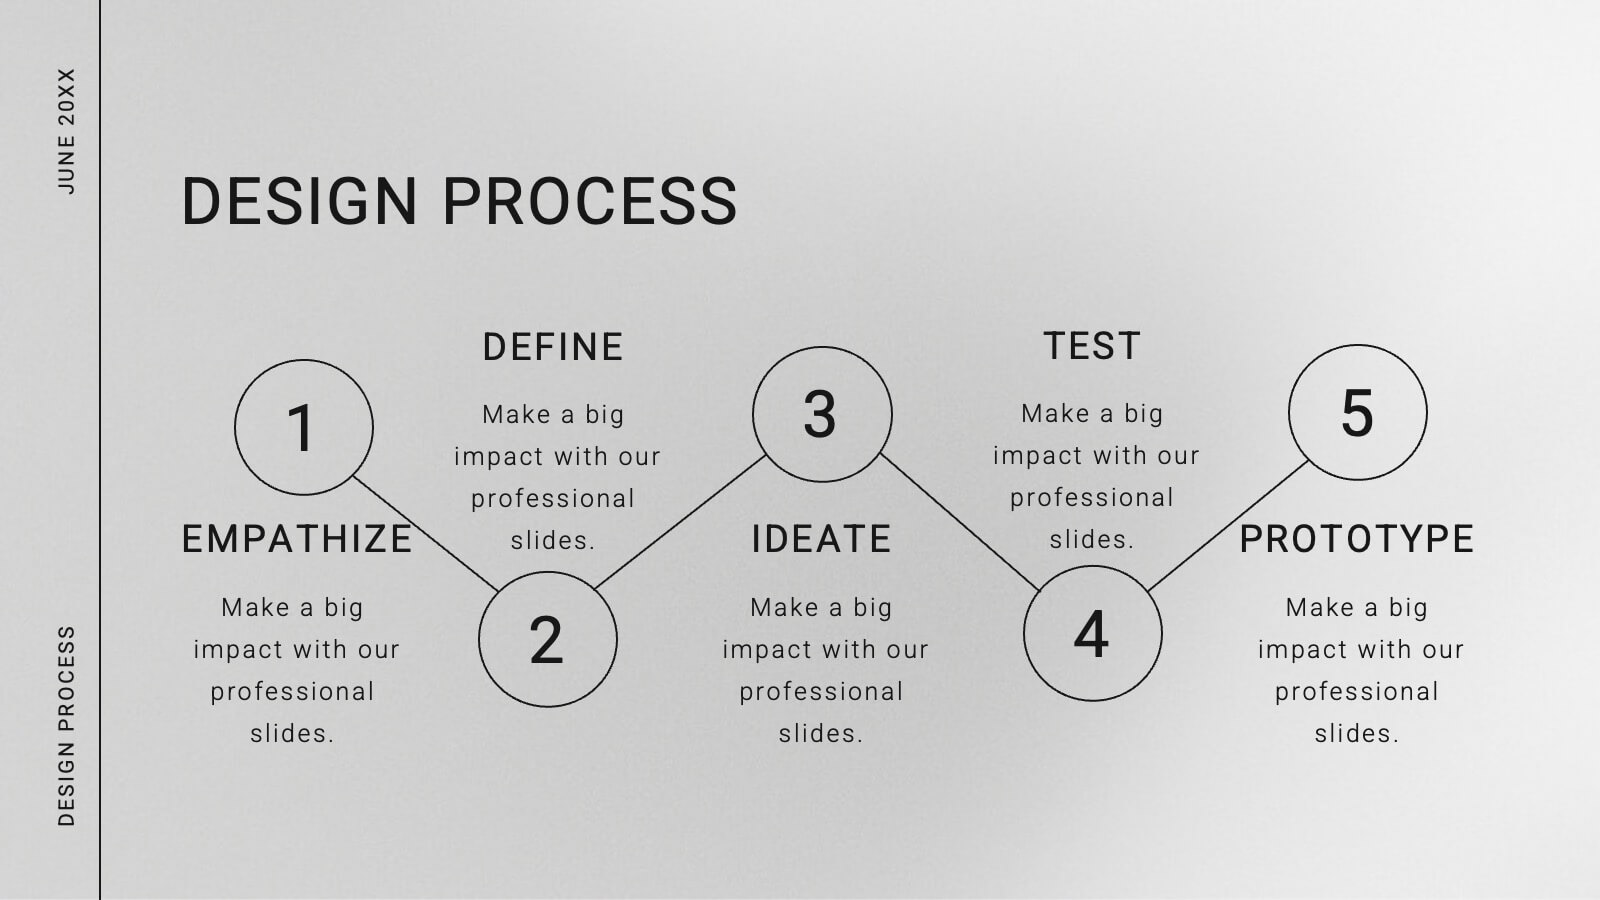
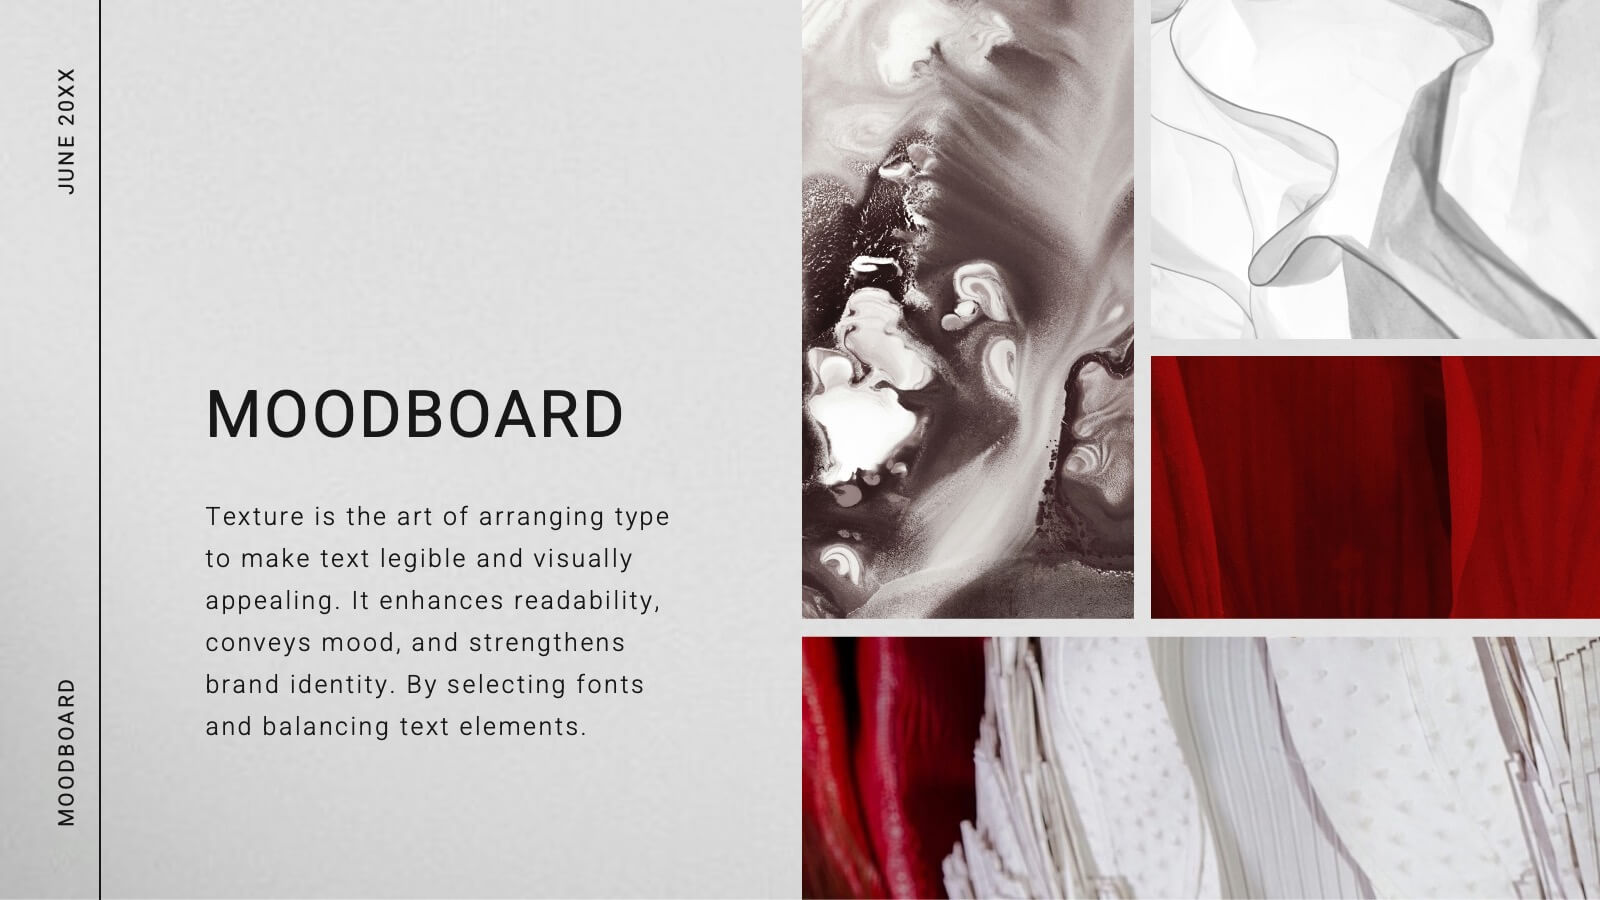
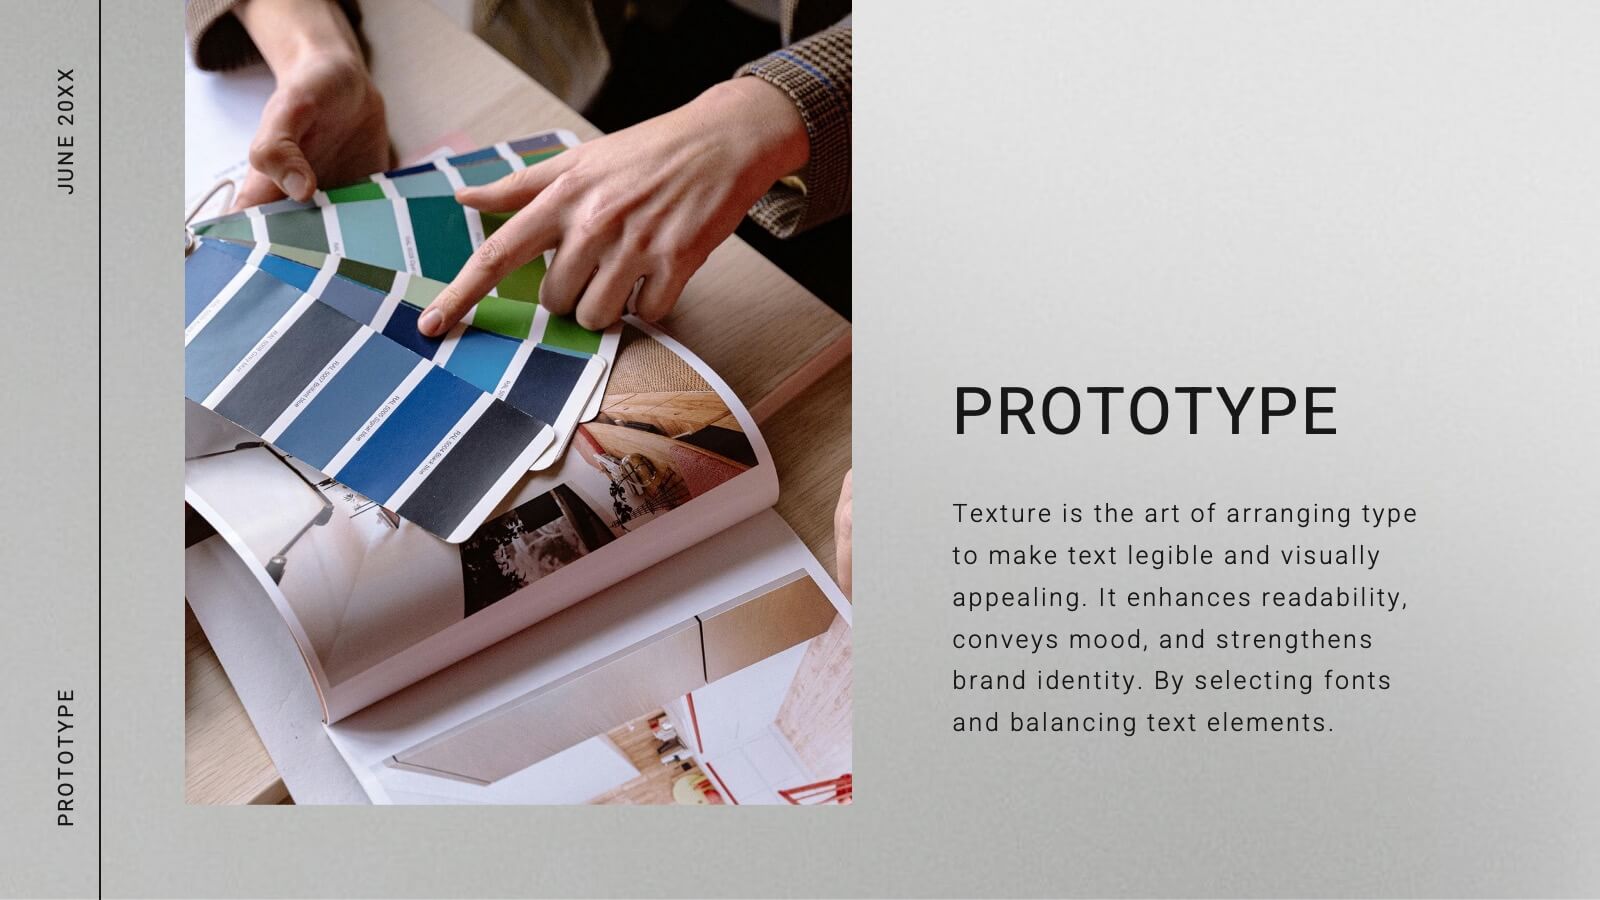
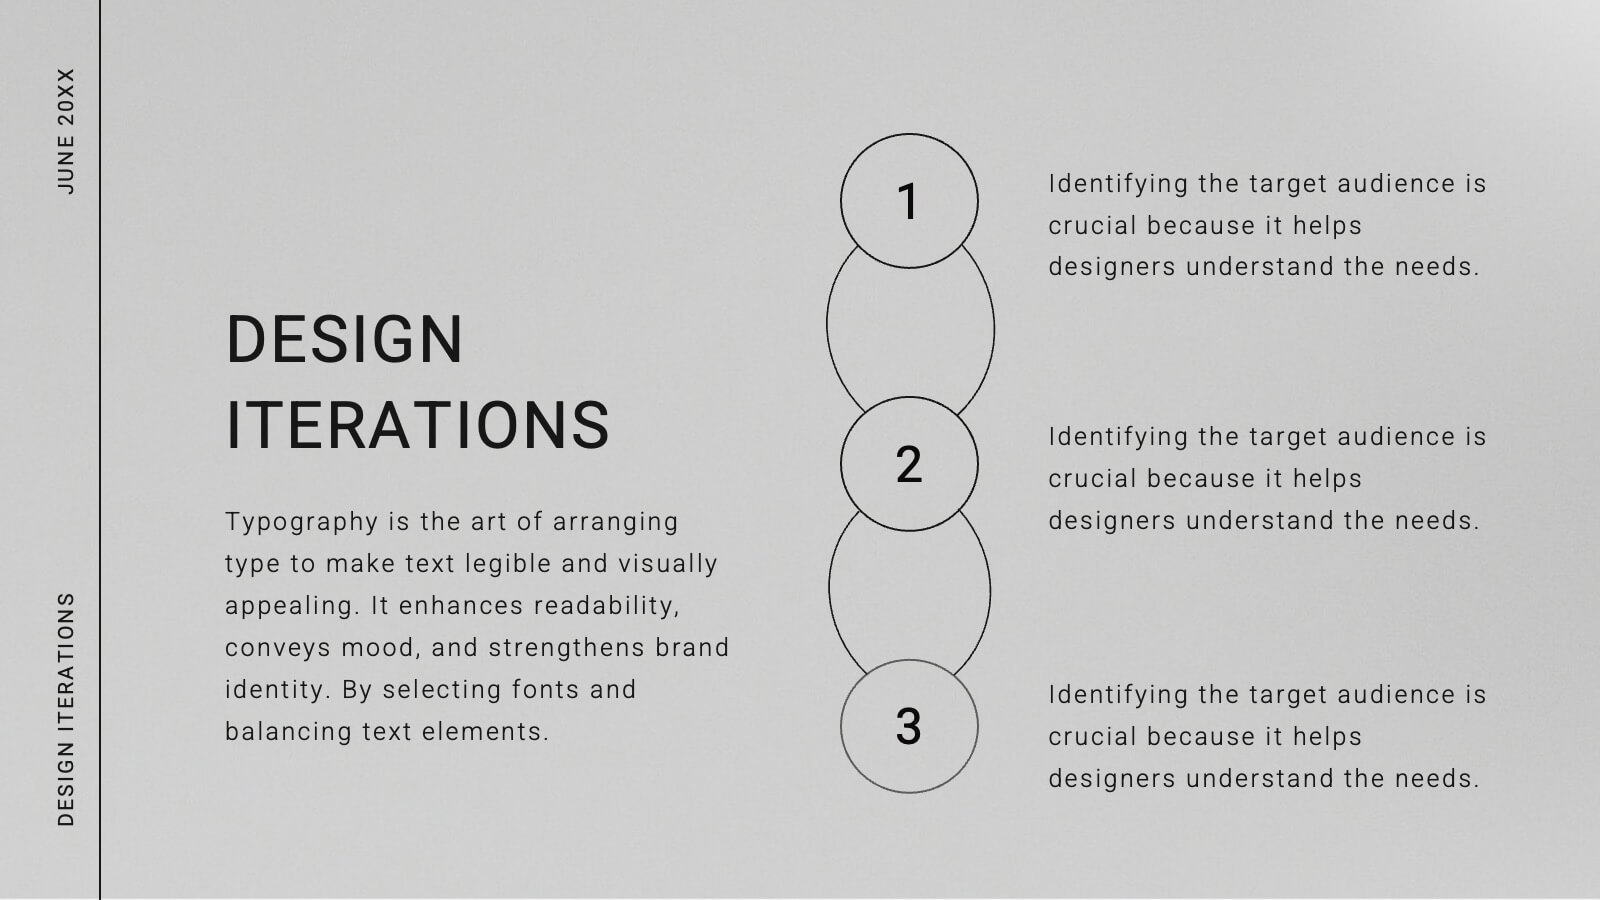
Comet Graphic Design Project Plan Presentation
Craft stunning design project presentations with this elegant template. Showcase objectives, processes, mood boards, and final designs effectively. Ideal for creative teams and clients. Fully compatible with PowerPoint, Keynote, and Google Slides.


5 diapositivas
Venn Diagram Comparison Slide Presentation
Bring clarity to your ideas with a layered visual that makes comparing multiple concepts feel effortless and engaging. This presentation helps you highlight differences, similarities, and key insights using clean shapes and simple labels. Fully customizable and compatible with PowerPoint, Keynote, and Google Slides.


5 diapositivas
IT Infrastructure and Architecture
Visualize your tech ecosystem with this layered pyramid infographic designed for showcasing IT infrastructure components. Ideal for CIOs, network architects, or IT consultants, this slide highlights five essential levels—from hardware to services. Fully editable in PowerPoint, Keynote, and Google Slides.


4 diapositivas
Break-Even Point Financial Analysis Presentation
Clearly define profitability with this break-even point financial analysis template. It visually maps costs, revenue, and profitability, helping businesses assess when they'll cover expenses and start making a profit. Perfect for financial forecasting and business planning. Fully customizable and compatible with PowerPoint, Keynote, and Google Slides for seamless editing and presentation.


5 diapositivas
Interlocking Puzzle Infographic Presentation
Visually connect ideas with the Interlocking Puzzle Infographic. This design is perfect for illustrating processes, relationships, and key concepts that fit together seamlessly. Whether you're presenting business strategies, project workflows, or educational content, this template enhances clarity and engagement. Fully customizable and compatible with PowerPoint, Keynote, and Google Slides.


4 diapositivas
Business Development Roadmap Presentation
Visualize your growth journey with this Business Development Roadmap Presentation. Featuring a winding road design with four milestones, it’s perfect for showcasing project phases, strategic goals, or quarterly plans. Each checkpoint is color-coded and icon-based for easy comprehension. Fully editable in PowerPoint, Keynote, and Google Slides.