


Características


¿Tienes alguna pregunta?
Recomendar


6 diapositivas
RAPID Framework for Business Strategy Presentation
Unveil a dynamic approach to strategic decision-making with the RAPID Framework for Business Strategy template. This structured layout covers the Recommend, Agree, Perform, Input, and Decide stages, offering a comprehensive toolkit for business planning and execution. This versatile template is essential for teams aiming to enhance strategic planning and is compatible with PowerPoint, Keynote, and Google Slides, making it accessible for a wide range of business professionals.


5 diapositivas
Investment and Money Growth Strategies Presentation
Illustrate investment strategies and financial growth with this visually engaging presentation slide. Featuring growing money plant icons on financial podiums, this template helps showcase financial plans, savings growth, and ROI projections effectively. Customizable with editable text, colors, and graphics, it’s perfect for financial advisors, business presentations, and investment reports. Fully compatible with PowerPoint, Keynote, and Google Slides for seamless integration.


7 diapositivas
Compliance Gap Analysis Infographic
Navigate the complexities of organizational compliance with our compliance gap analysis infographic. Using a vibrant palette of orange, white, and green, this infographic elucidates the differences between current compliance practices and desired standards. Specifically designed for business analysts, compliance officers, and risk managers, this template is an invaluable tool to identify, analyze, and bridge compliance-related gaps. With its fun yet informative style, communicating these insights becomes more engaging and understandable. This infographic is ready for integration with PowerPoint, Keynote, and Google Slides, ensuring smooth presentations across various platforms.


26 diapositivas
Tempo Brand Identity Presentation
Introduce and elevate your brand with this versatile presentation template designed to reflect your company's vision and values. Perfect for businesses looking to showcase their brand strategy, components, and touchpoints with clarity and professionalism. This presentation features thoughtfully designed slides covering brand identity components, visual guidelines, target audience insights, and future development plans. Use dedicated sections to outline your unique selling proposition, positioning, and strategy. With its clean layout and attention to detail, it's ideal for presenting a cohesive and impactful brand narrative. Compatible with PowerPoint, Google Slides, and Keynote, this template is fully customizable. Edit colors, text, and images to align with your brand aesthetics and messaging. Deliver your presentation with confidence, ensuring your audience is inspired by a polished and professional brand identity.


7 diapositivas
Business Plan Infographic Presentation Template
A business plan is a document that is prepared by entrepreneurs and analysts to support the decision of making a business venture. It typically helps individuals in raising capital and obtaining funds for their new ventures. A business plan often involves multiple steps that can be elaborate, sometimes difficult to explain during presentations in front of potential investors if not summarized properly. This is a comprehensive template that has all of the most important features of a well thought out business plan. This professional template that will present your plan in a sophisticated way.


21 diapositivas
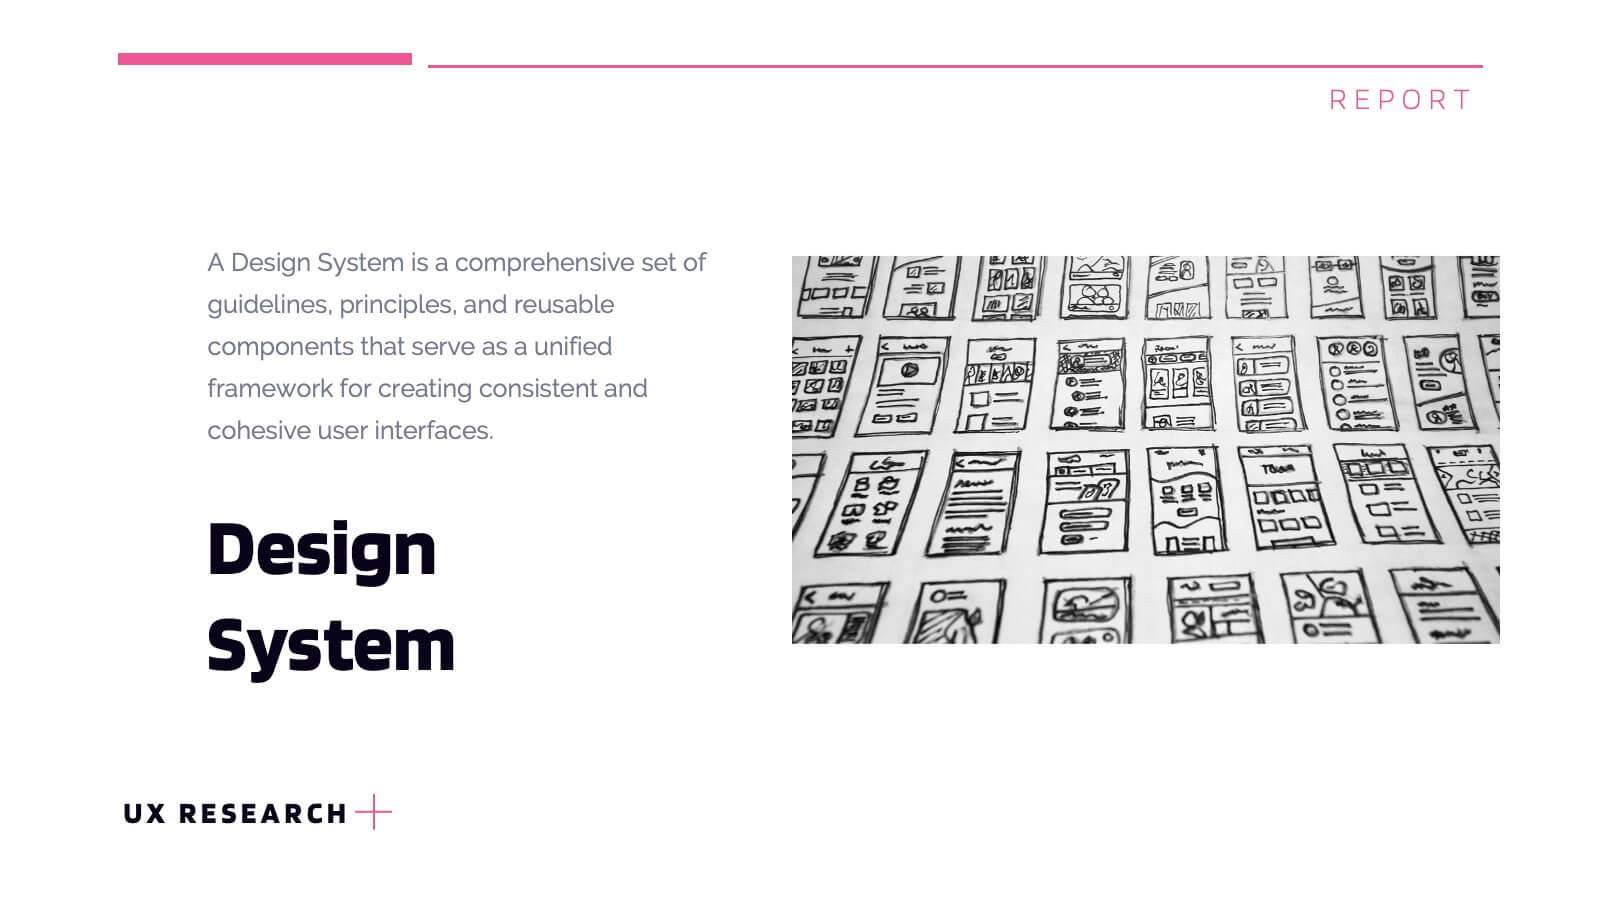
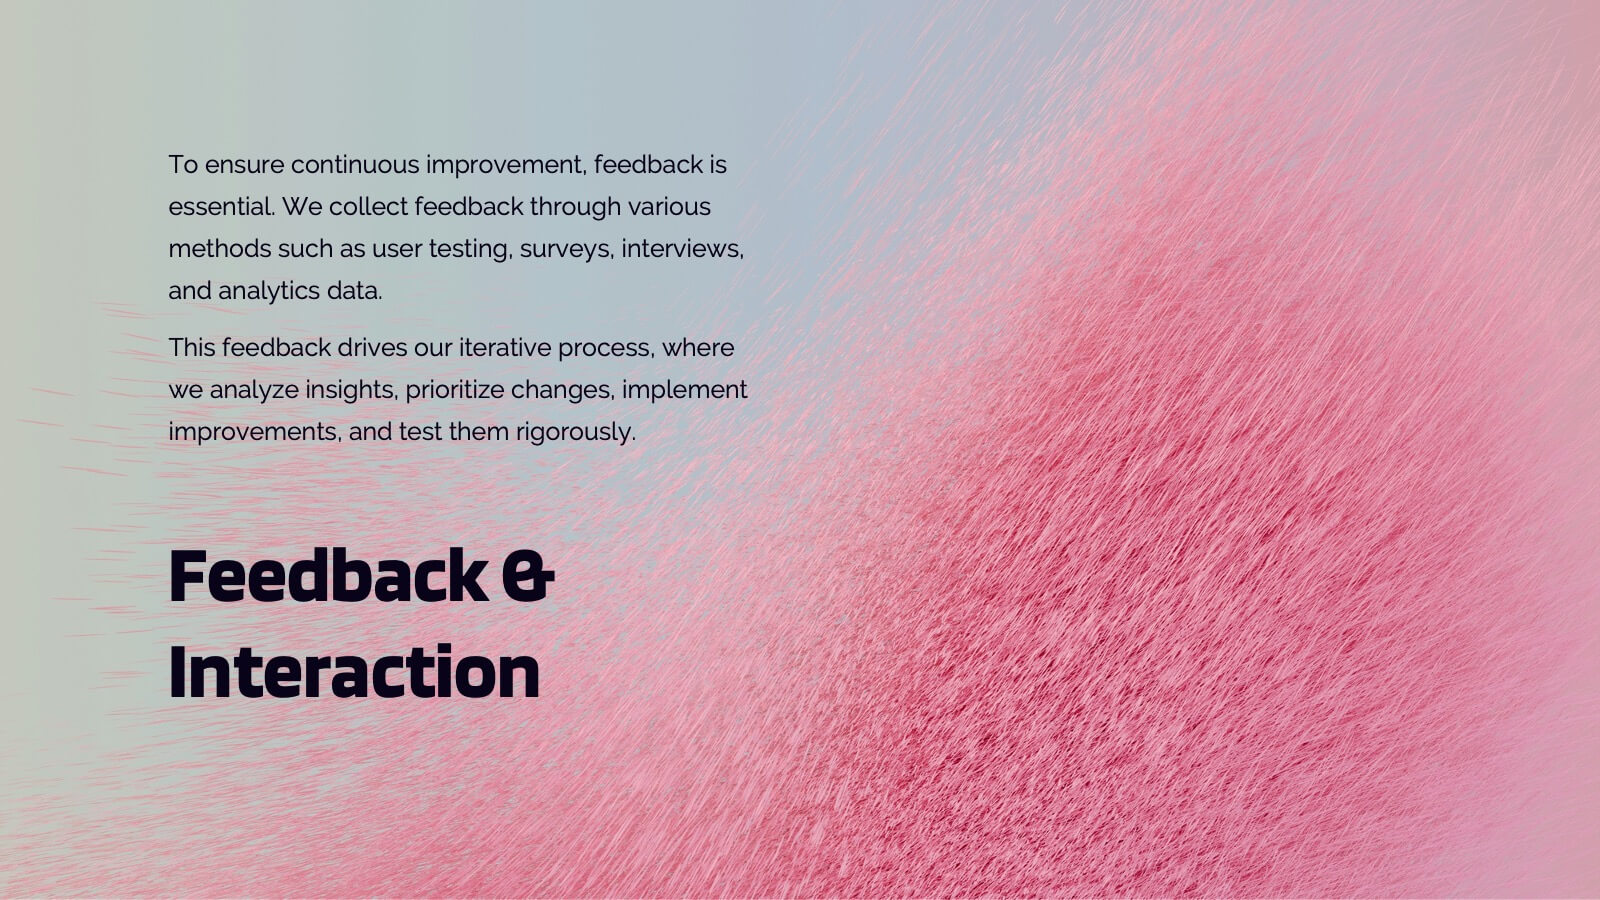
Lumascend UX Research Report Presentation
Present your UX research findings with clarity using this engaging and organized template! Covering key areas like user personas, wireframes, testing, and interaction design, it ensures all aspects of your design process are communicated effectively. Perfect for UX teams, stakeholders, or client presentations, this template works seamlessly with PowerPoint, Keynote, and Google Slides.


3 diapositivas
Stock Market Performance Overview Presentation
Showcase financial growth like a pro with this clean, data-driven layout designed to visualize performance, market activity, and business progress over time. Ideal for professionals presenting key financial trends, metrics, or strategies. Fully compatible with PowerPoint, Keynote, and Google Slides for easy customization and professional presentation results.


6 diapositivas
Strategic Solution Framework Presentation
Build your ideas step by step with this dynamic layout that turns strategies into a clear visual journey. Perfect for illustrating processes, growth plans, or solution pathways, it helps simplify complex frameworks into engaging visuals. Fully editable and compatible with PowerPoint, Keynote, and Google Slides for seamless customization.


7 diapositivas
Loves Travel Infographic Presentation
Travel is an opportunity to get out of our comfort zones and be inspired to try new things, it changes our perspective on the world. Use this template to give your audience an overview of a trip and prepare them for what they will be experiencing. This template features an infographic style design, with plenty of room to describe the locations and activities as well as instructions and tips. Build your own infographic with this template, and add it to your presentations. You can easily add your own content in PowerPoint, Keynote, or Google slides and turn it into a fun presentation in minutes.


4 diapositivas
Project Responsibility Chart
Streamline team coordination with this Project Responsibility Chart. Clearly define who is Responsible, Accountable, Consulted, and Informed across key tasks. Ideal for project managers and team leads ensuring role clarity. Fully editable in PowerPoint, Keynote, and Google Slides.


6 diapositivas
Biology Tree Diagram Infographic
Tree diagrams in biology are graphical representations that show the hierarchical relationships and evolutionary history of different organisms, species, or biological traits. This infographic template is designed to simplify complex biological information and show the interconnectedness between different biological topics or classifications. This infographic is a visual representation of various biological concepts and relationships in a hierarchical tree structure. This template color codes the different branches to distinguishing between the different categories and make the infographic easier to navigate.


7 diapositivas
Big Data Analytic Infographics
Big Data are the large and complex data sets that are difficult to process and analyze using traditional data processing methods. This template will allow you to visualize key data points and insights in an appealing and easy to digest way. Your information is presented in a clear manner with a variety of graphs, to convey the fundamentals of big data analytics. Customize this infographic with your own data in the bullet points and graphics. Quickly edit text and colors for your next presentation. All the slide in this template are fully editable in Powerpoint, Keynote, and Google Slides.


20 diapositivas
Legendra Artist Portfolio Presentation
Showcase your creative journey with this dynamic artist portfolio presentation template. Highlight your featured projects, creative process, collaborations, and pricing in a visually engaging format. Perfect for artists, designers, and creative professionals looking to impress potential clients. Fully editable in PowerPoint, Keynote, and Google Slides.


3 diapositivas
Financial Cost Management Strategies
Break down your financial action plan with the Financial Cost Management Strategies Presentation. Featuring a dynamic 3-step arc design, this template is ideal for illustrating cost-saving initiatives, expense control methods, or phased budget implementation strategies. Each curved step includes space for icons, step numbers, titles, and concise descriptions, making it easy to communicate each stage clearly. Fully editable in PowerPoint, Keynote, and Google Slides, it’s perfect for finance teams, consultants, or operations leaders.


4 diapositivas
Root Cause Analysis Fishbone Presentation
Pinpoint problems efficiently with this Root Cause Analysis Fishbone template. Designed to help you identify and visualize causes clearly, it’s perfect for process improvement and team brainstorming. Fully editable and easy to use in PowerPoint, Keynote, and Google Slides for maximum flexibility across your workflow.


10 diapositivas
Corporate Business Plan Strategy Presentation
Present your strategy with professionalism using this Corporate Business Plan slide. Designed with a handshake graphic and clean icon-labeled sections, this layout is ideal for showcasing four key pillars—such as partnerships, operations, goals, and performance. Each title is fully editable, helping you keep your message clear and concise. Compatible with PowerPoint, Keynote, and Google Slides.


21 diapositivas
Novaeon Corporate Strategy Proposal Presentation
A sleek and professional presentation template designed for strategy proposals. Includes slides for SWOT analysis, growth opportunities, strategic initiatives, and performance metrics. Fully customizable to fit any corporate need, ensuring impactful communication. Compatible with PowerPoint, Keynote, and Google Slides for seamless presentations.