


Características


¿Tienes alguna pregunta?
Recomendar


7 diapositivas
Geographic Global Data Presentation
Bring worldwide insights to life with a crisp, modern layout designed to make global trends easy to understand. This presentation highlights regional metrics, geographic comparisons, and key data points in a clean, visual format perfect for business or research reporting. Fully compatible with PowerPoint, Keynote, and Google Slides.


7 diapositivas
Processed Food Infographic
Indulge in the intricate world of processed foods with our meticulously crafted infographic. Garnished in a palate of clean white and bold red, this template offers a delectable insight into how our everyday foods transition from raw ingredients to the final product on supermarket shelves. Compatible with Powerpoint, Keynote, and Google Slides, our template offers detailed graphics, intuitive icons, and straightforward image placeholders that dive deep into the realm of processed foods. This is a must-have for nutritionists, dieticians, food bloggers, or any individual keen on educating others about the nuances of processed foods in our daily diet.


6 diapositivas
Demographic Information Infographic
Demographic information refers to data that describes the characteristics of a population or specific groups within a population. This infographic template is essential for understanding the composition and dynamics of a population, as well as for making informed decisions in various fields, such as market research, healthcare, and education. This infographic is designed to provide an overview of key demographic indicators and trends, offering insights into the characteristics of the target audience. This infographic includes key insights about the demographic data presented, providing context and interpretation for the audience.


21 diapositivas
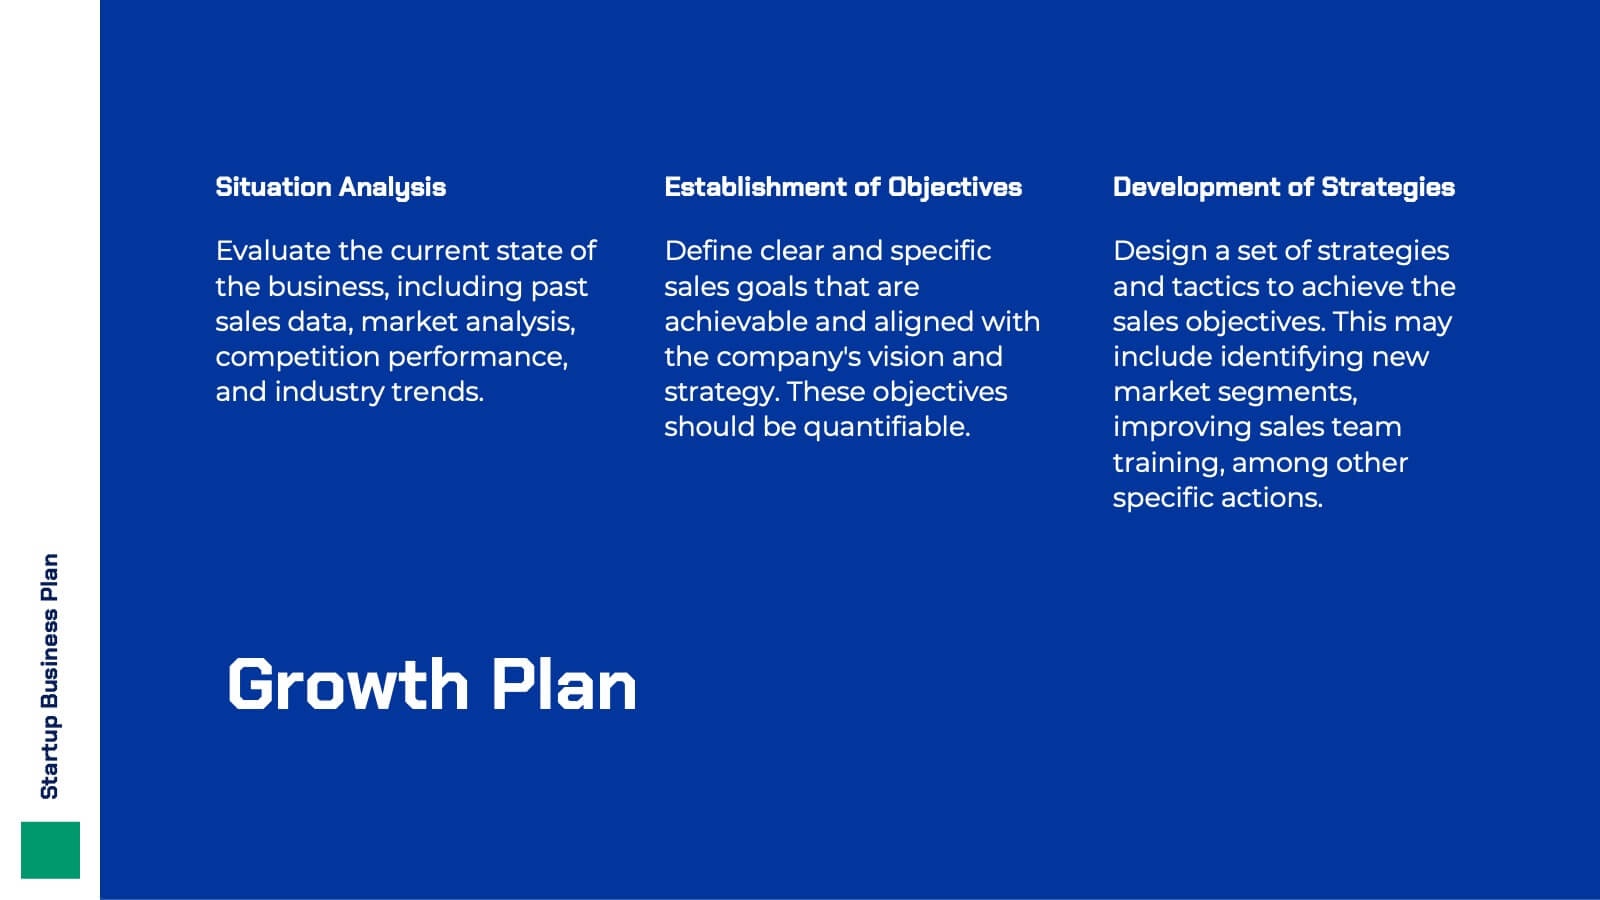
Hyperluma Startup Business Plan Presentation
Launch your vision with this startup business plan template, crafted to communicate your mission, market potential, and growth strategy with clarity and impact. Covering customer needs, unique value propositions, and financial projections, it’s ideal for entrepreneurs and founders. This template is compatible with PowerPoint, Keynote, and Google Slides, ready to fuel your startup’s journey.


7 diapositivas
SEO Strategy and Keyword Plan Presentation
Spark your marketing roadmap with a bold, idea-driven layout that makes every action step clear and memorable. This presentation helps you outline search goals, explore keyword opportunities, and map out strategic priorities in a simple, visual flow. Fully compatible with PowerPoint, Keynote, and Google Slides.


5 diapositivas
Financial Goals Infographics
Financial Goals are essential for creating a roadmap towards a secure financial future. This vertical infographic template is designed to illustrates goals, progress, and performance of financial investments. This is a perfect tool to help businesses, investors, and financial advisors communicate complex financial data in a simple and easy-to-understand way. It includes colorful illustrations and icons with text boxes that can show financial growth and progress. There are also sections for your investment strategies and financial metrics. You can fully customize this template to suit your specific needs.


5 diapositivas
Problem Framing and Opportunity Identification Presentation
Spot challenges and uncover growth potential with this Problem Framing and Opportunity Identification presentation. Ideal for strategy sessions, this layered pyramid layout helps you organize problems from surface-level to root causes while aligning them with strategic opportunities. Fully editable in Canva, PowerPoint, or Google Slides for seamless customization.


7 diapositivas
Sales Cycle Infographic
A sales cycle, refers to the series of stages or steps that a salesperson or a sales team follows to convert a prospective customer into a paying customer. This infographic template is a structured approach to lead a potential customer from the initial contact to making a purchase. Compatible with Powerpoint, Keynote, and Google Slides. This is an illustrative guide to the fundamental stages of the sales journey. Equip yourself with an understanding of how sales progress, from prospecting to closing the deal, enabling you to optimize your strategies and drive success in the dynamic world of sales.


5 diapositivas
Perspective of Economic Trends in Africa Map Presentation
Visualize key economic insights across Africa with this data-driven map layout. Use labeled progress bars and highlighted countries to present regional performance, sector growth, or market distribution. Fully editable in PowerPoint, Keynote, or Google Slides, this clean template is ideal for business reports, financial reviews, and investment-focused presentations.


7 diapositivas
Six Sigma Methodology Infographic Presentation Template
Our Six Sigma Methodology template is a great way to start any project. This can be used as a guideline to create the foundations of the Six Sigma model and allow you to think about how to approach your project in terms of how it will be analyzed, making it easier for people working on the same projects to analyze their own results and make sure they are all aligned with the core principles of Six Sigma. With our Six Sigma Methodology template, you can easily organize and manage your entire process. Using this template will save you time and allow you to get more work done in less time.


6 diapositivas
United States Coronavirus Map
A United States Coronavirus Map is a graphical representation that displays the spread of the coronavirus (COVID-19) across the United States. This infographic template may use different colors, shades, or symbols to indicate the severity of COVID-19 cases in different areas. Darker colors may represent higher case numbers, while lighter colors may represent lower case numbers. These maps are valuable tools to track the progression of the virus, identify hotspots, and make informed decisions related to public health. This can also help raise awareness about the importance of preventive measures and promote data-driven strategies to control the spread.


4 diapositivas
Cost Breakdown for Business Planning Presentation
Visually balance your budget strategy with the Cost Breakdown for Business Planning Presentation. Featuring a scale-style layout, this slide helps you compare two financial metrics or allocations with clarity and simplicity. Ideal for showcasing trade-offs, resource planning, or funding distribution. Fully editable in PowerPoint, Google Slides, Keynote, and Canva.


5 diapositivas
TAM SAM SOM Markets Analysis Presentation
Turn complex market insights into clear, visual storytelling with this dynamic layered presentation. Ideal for demonstrating market potential, target segments, and opportunity scope, it helps you communicate data with structure and impact. Fully compatible with PowerPoint, Keynote, and Google Slides for effortless editing and professional, presentation-ready results.


5 diapositivas
Eco-Friendly Practices Implementation Presentation
Brighten your message with a clean, circular design that maps out every green initiative step-by-step. This visual template illustrates key eco-conscious actions, helping you present sustainable practices with ease. Perfect for environmental reports, team strategies, or policy pitches. Fully compatible with PowerPoint, Keynote, and Google Slides for flexible editing.
6 diapositivas
Task Tracking and Milestone Gantt Overview Presentation
Stay on top of weekly progress with this Task Tracking and Milestone Gantt Overview presentation. Ideal for project managers and teams, it clearly maps tasks by week with visual progress bars and milestone icons. Easily customizable in Canva, PowerPoint, and Google Slides to align with your project timelines and goals.


3 diapositivas
Decision-Making Bowtie Framework
Clarify choices and consequences with the Decision-Making Bowtie Framework Presentation. This slide design uses the bowtie model to organize factors before and after a decision, helping audiences visualize causes, potential outcomes, and risk management strategies. Ideal for leadership, business strategy, or operations meetings. Customize each side with key points, contributing factors, and mitigation actions. Includes editable labels, flexible layout options, and is fully compatible with PowerPoint, Keynote, and Google Slides.


4 diapositivas
Key Stakeholder Identification Presentation
A great presentation starts with clarity, and this slide brings your message to life with bold, visual focus. Use it to break down key stakeholder groups, highlight their roles, and communicate insights with ease. Clean lines and intuitive icons keep everything clear and engaging. Fully compatible with PowerPoint, Keynote, and Google Slides.