


Características


¿Tienes alguna pregunta?
Recomendar


23 diapositivas
Echo Startup Pitch Deck Template Presentation
This sleek pitch deck template is perfect for showcasing your startup’s potential. Highlight your problem, solutions, revenue model, and unique value proposition in a professional format. It's fully customizable, easy to use, and compatible with PowerPoint, Keynote, and Google Slides, making it ideal for impressing investors.


24 diapositivas
Minerva UX Design Presentation
Elevate your UX design presentations with this comprehensive template, featuring sections for project overview, user research, wireframes, prototyping, and usability testing. Showcase design systems, branding guidelines, and accessibility considerations with ease. Perfect for demonstrating a user-centered approach. Compatible with PowerPoint, Keynote, and Google Slides for seamless customization.


5 diapositivas
Dealing With Cyberbullying Infgraphics
Cyberbullying refers to the act of using digital communication platforms such as social media, instant messaging, online forums, or email to harass, intimidate, or harm others. This infographic template is designed to raise awareness about cyberbullying and provide guidance on how to effectively deal with it. This template aims to educate individuals, parents, educators, and organizations about the impact of cyberbullying and empower them to prevent and address this issue. This template can be used by schools, community organizations, or online safety advocates to raise awareness about cyberbullying, and foster a safer online environment.

21 diapositivas
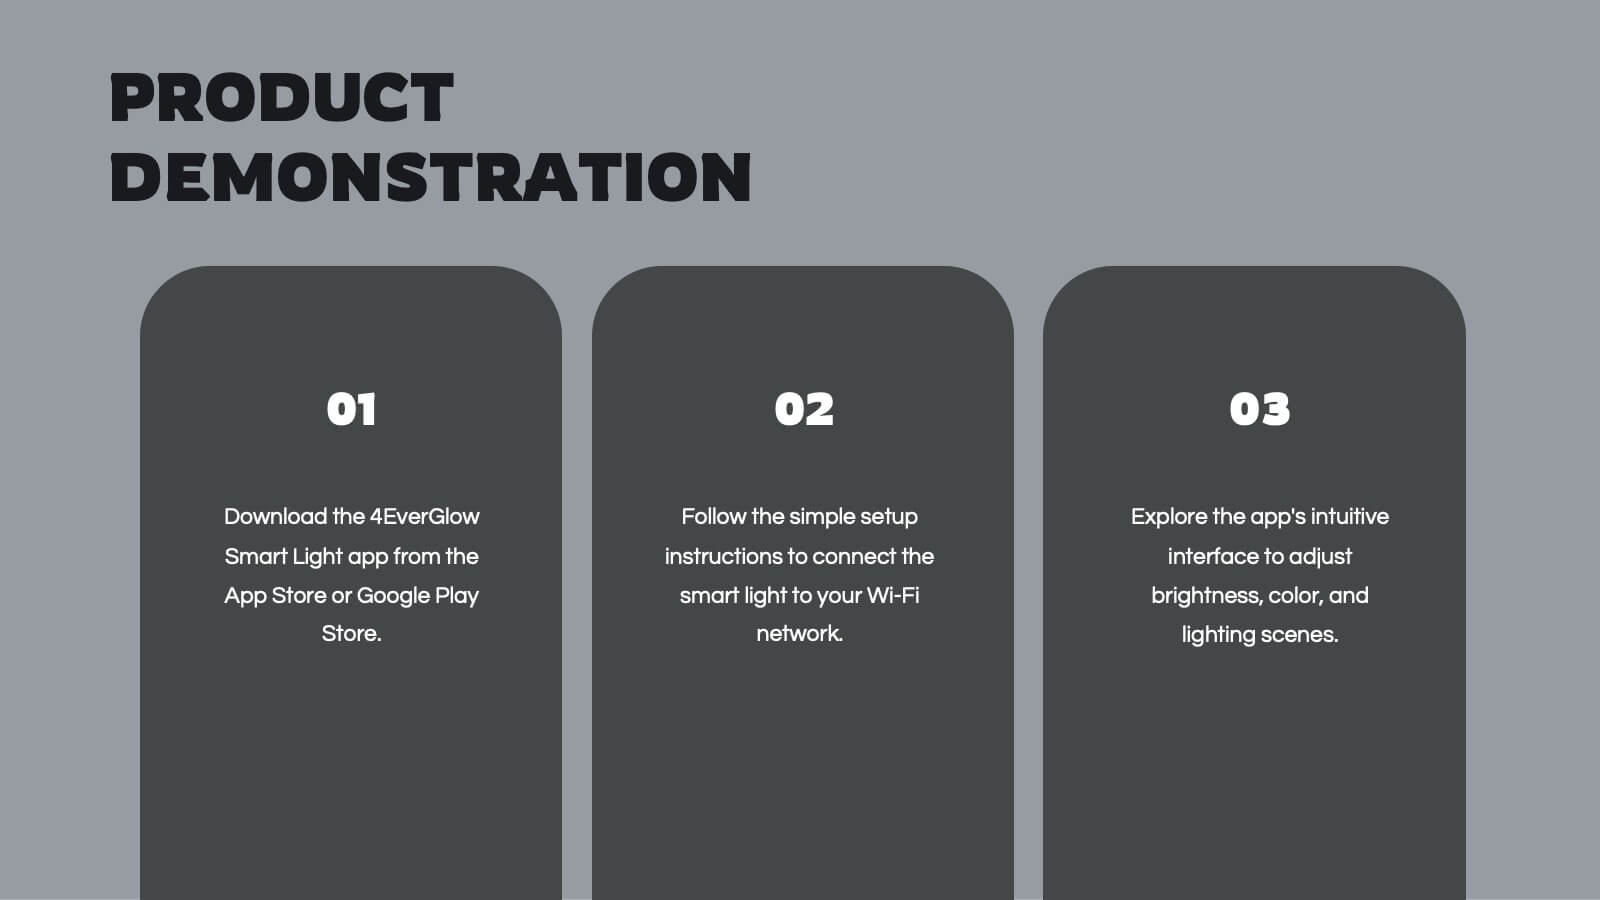
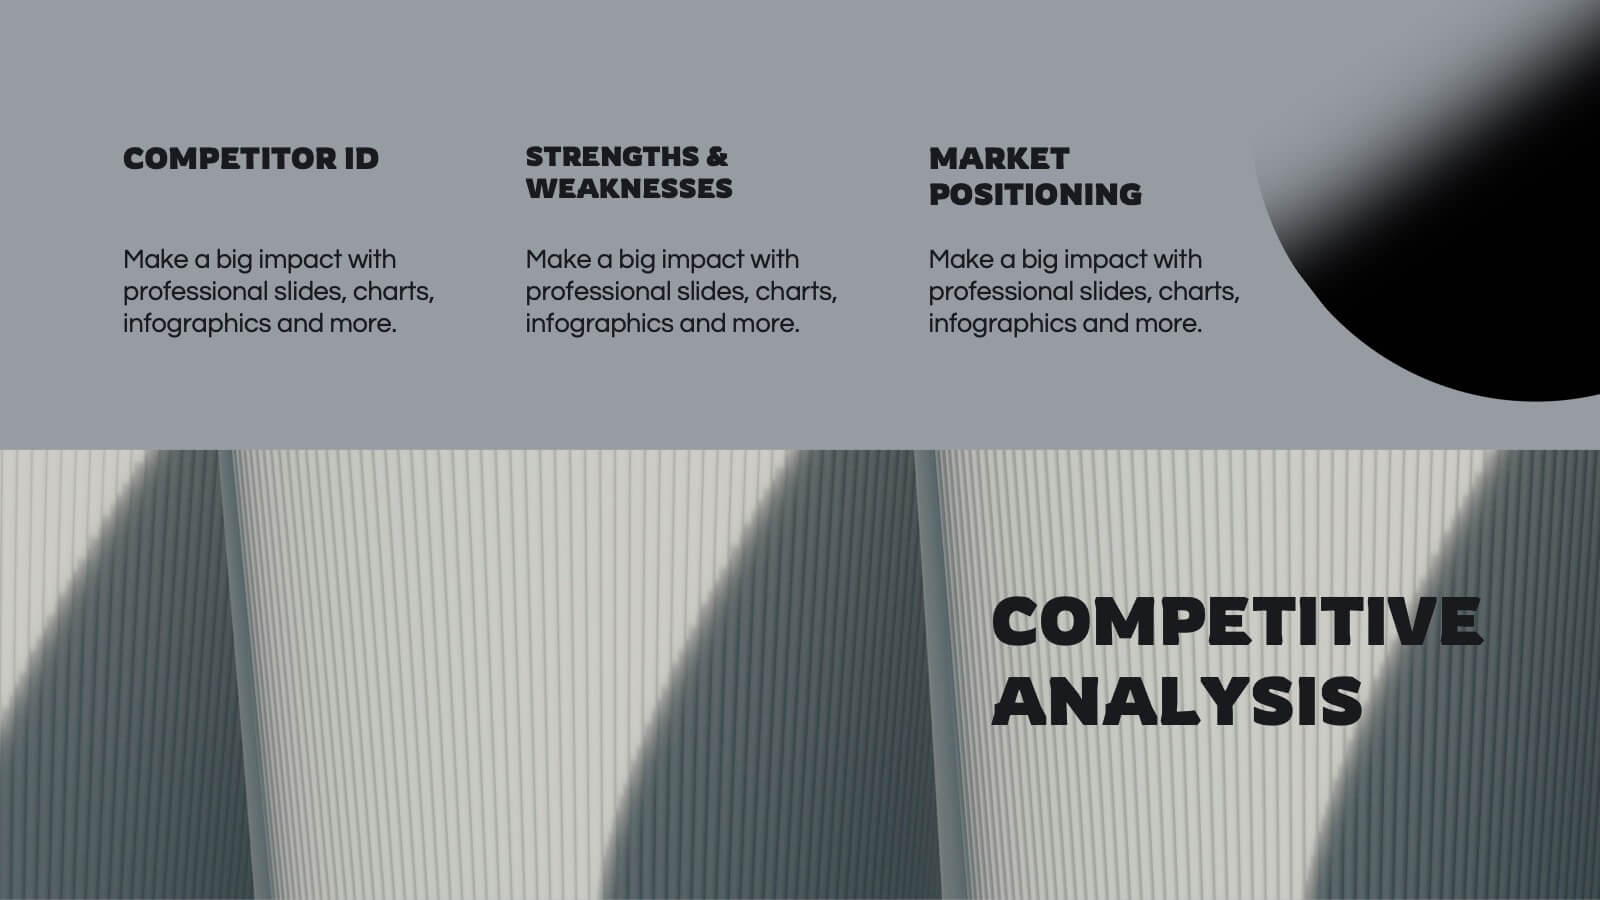
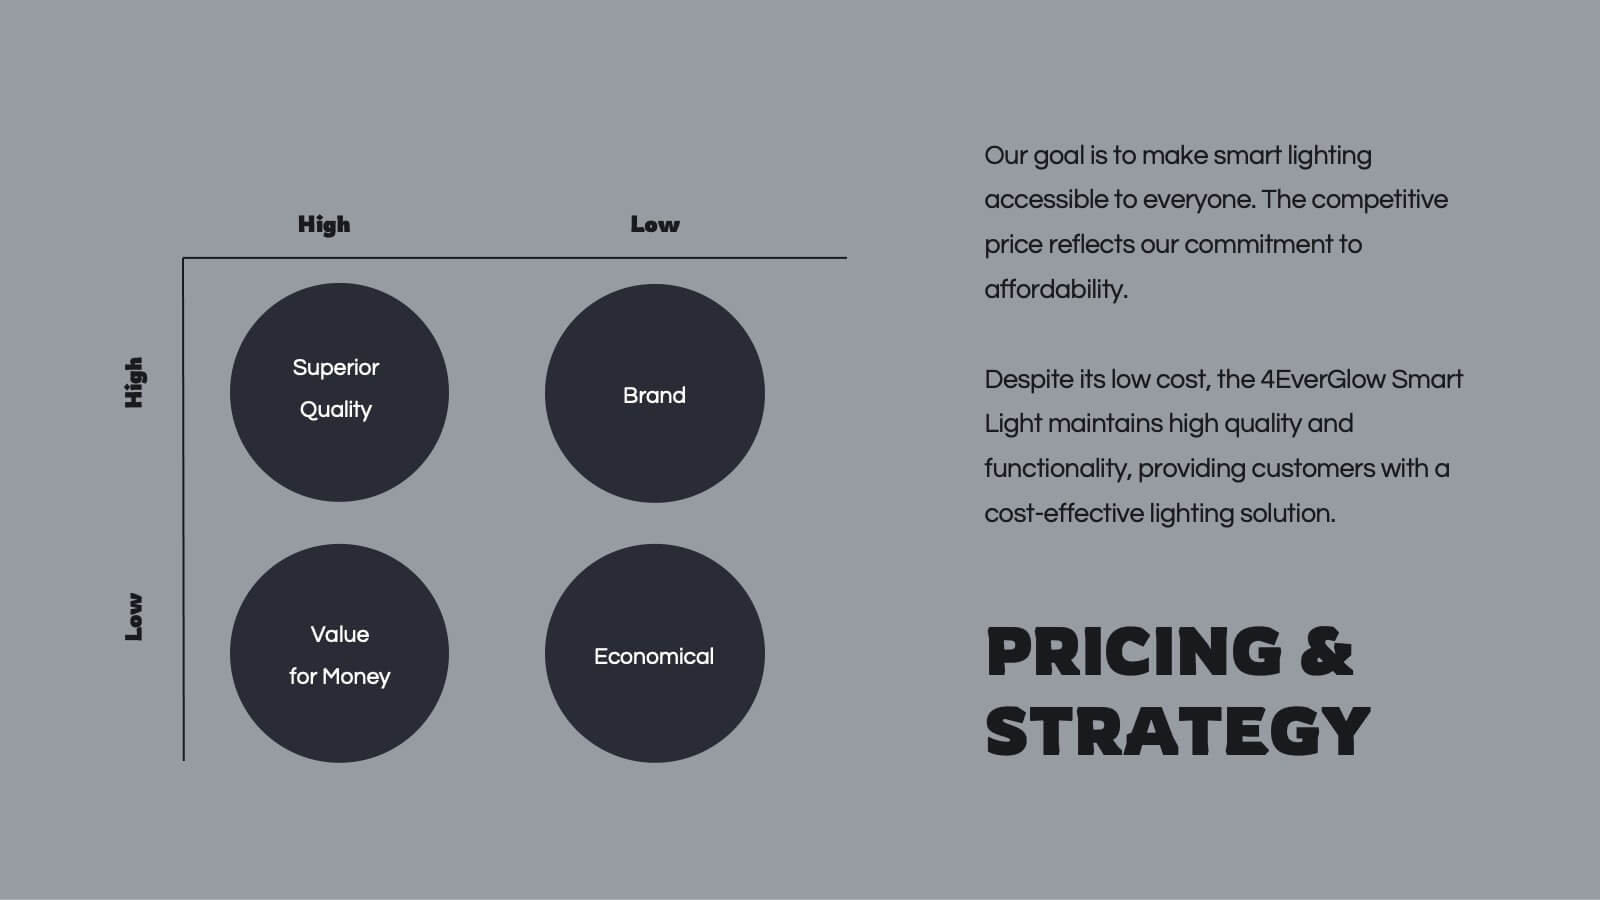
Spinel Product Strategy Report Presentation
Take your product strategy to the next level with this polished, spinel-inspired presentation! Designed to effectively communicate your product's goals, market analysis, and strategy roadmap, this template is both visually striking and easy to navigate. Its sharp design ensures a professional touch. Compatible with PowerPoint, Keynote, and Google Slides.


5 diapositivas
Project Goals and Objectives Presentation
Bring clarity and momentum to your planning with a slide that highlights goals and aligns them with clear, actionable objectives. This presentation helps teams define priorities, communicate expectations, and track progress with a clean, structured layout built for any project. Fully compatible with PowerPoint, Keynote, and Google Slides.


4 diapositivas
Lean Startup Business Model Presentation
Optimize your startup strategy with the Lean Startup Business Model Presentation. This fully customizable template simplifies key business components, including funding sources, revenue models, growth strategies, and value propositions. Designed for entrepreneurs, investors, and business analysts, this layout is available for PowerPoint, Keynote, and Google Slides, ensuring a professional, structured, and impactful presentation.


5 diapositivas
Property Investment Analysis
Visualize property performance, investment comparisons, or growth strategies using this colorful building-height layout. Ideal for real estate agents, financial consultants, and property developers seeking to present tiered data clearly. Fully customizable in PowerPoint, Keynote, and Google Slides.


8 diapositivas
Biological Structure and Function Presentation
Visualize biological processes with the Biological Structure and Function infographic. Featuring a hexagonal layout, this template allows you to categorize key concepts such as molecular functions, chemical reactions, and biological systems. Fully editable and available for PowerPoint, Keynote, and Google Slides.


12 diapositivas
Health and Safety Compliance Strategy Presentation
Ensure your organization meets regulatory standards with the Health and Safety Compliance Strategy presentation. This sleek, diamond-based layout breaks down key safety elements into five visually engaging segments, ideal for outlining compliance measures, emergency protocols, training requirements, risk assessments, and inspection plans. Each icon-based section includes editable titles and text boxes for quick customization. Designed to keep information clear and actionable, this template is perfect for corporate safety briefings, internal audits, or HR presentations. Fully compatible with PowerPoint, Keynote, and Google Slides.


21 diapositivas
Phoenix Design Portfolio Presentation
Elevate your design presentations with this stylish, contemporary template. Perfect for showcasing design portfolios, concept development, and project timelines, it features a modern layout with vibrant colors. Highlight key elements like color palettes, textures, and design processes to captivate your audience. Compatible with PowerPoint, Keynote, and Google Slides, it ensures seamless presentations on any platform.


7 diapositivas
Analyze Survey Results Infographic
Survey results refer to the outcomes and findings obtained from a survey conducted to gather information, opinions, feedback, or data from a specific group of individuals or a target audience. This visually appealing and insightful infographic template transforms survey findings into captivating visuals, enabling you to grasp trends, patterns, and valuable insights at a glance. Compatible with Powerpoint, Keynote, and Google Slides. This provides valuable insights and analysis based on the responses collected. Our infographic is a common research method used in various fields, including business, academia, social sciences, marketing, and more.


8 diapositivas
Corporate Office Scenes Illustrations Presentation
Bring workplace communication to life with this slide featuring an illustrated office meeting scene and a four-point list layout. Each segment is color-coded with accompanying icons, making it ideal for presenting corporate strategies, team roles, or process workflows. Designed for clarity and visual appeal, this slide is perfect for business reports, training decks, or client briefings. Easily customizable in PowerPoint, Keynote, and Google Slides.


3 diapositivas
Emerging Tech Innovations Deck Presentation
Present futuristic ideas with this Emerging Tech Innovations Deck. Perfect for tech leaders, startups, and educators, this slide set features modern visuals with robot illustrations and sleek layouts. Easily editable in PowerPoint, Keynote, or Google Slides. Ideal for showcasing cloud computing, automation, or AI-driven strategies in a compelling format.


7 diapositivas
Marketing Agency Infographic
A marketing agency is a specialized firm or company that offers a range of services to assist businesses in promoting their products, services, or brand effectively. Our marketing agency infographic is an exploration of marketing mastery, designed to captivate and educate. Fully customizable and compatible with Powerpoint, Keynote, and Google Slides. Showcase the collaborative force that propels your agency towards success, with the combined power of creativity, strategy, and dedication from this template. This infographic will encourage action, inviting your audience to chart a path towards infinite marketing horizons and beyond.


4 diapositivas
3-Level Tree Chart Presentation
Grow your ideas from concept to execution with this beautifully designed visual layout. Perfect for showcasing layered strategies, hierarchical processes, or business development stages, it balances clarity and creativity through a clean, tree-inspired design. Fully editable and compatible with PowerPoint, Keynote, and Google Slides for seamless professional use.


6 diapositivas
SEO Consulting Infographics
The "SEO Consulting" infographic template is designed for PowerPoint, Keynote, and Google Slides, making it a valuable resource for SEO consultants, digital marketing professionals, and business owners. This template is crafted to effectively communicate the essentials of SEO in a professional and engaging manner. Featuring key elements of SEO such as optimization strategies, keyword research, and website traffic analysis, the template is structured to simplify the complex aspects of SEO. This makes it an ideal tool for presentations aimed at educating clients or team members about the nuances of search engine optimization and its impact on digital marketing. The design of the template is modern and business-oriented, with a color scheme that includes shades of blue, green, and gray. This professional yet engaging aesthetic ensures that the presentation is not only informative but also visually appealing. Whether used in client meetings, training sessions, or marketing seminars, this template is sure to enhance the understanding and appeal of SEO consulting services.


11 diapositivas
Company Team Meeting Presentation
Bring your team together with our dynamic Company Team Meeting presentation template. Designed for clarity and engagement, this template sets the stage for productive discussions, from weekly roundups to strategic planning sessions. It begins with a vibrant cover slide that sets an upbeat tone for the meeting, followed by a clear agenda to keep your discussion on track. With slides tailored for talking points, updates, upcoming events, and deadlines, it helps you streamline the flow of information. The template includes sections for announcements and feedback, encouraging open dialogue. Ground rules are laid out to foster a respectful and collaborative environment, while the progress and challenges slides are perfect for a transparent review of the company's status and addressing any hurdles head-on with practical solutions. This template, adaptable to PowerPoint, Keynote, and Google Slides, not only captures attention with its colorful design but also reinforces team cohesion and focus on common goals. Use it to energize your team meetings and ensure everyone leaves aligned and motivated.