


Características


¿Tienes alguna pregunta?
Recomendar


5 diapositivas
Risk Analysis Bowtie Diagram Presentation
Visualize threats, controls, and consequences effectively with the Risk Analysis Bowtie Diagram Presentation. This dynamic template illustrates cause-and-effect relationships using a bowtie structure, making it ideal for safety audits, project risk planning, or corporate strategy. Fully customizable in PowerPoint, Keynote, and Google Slides for any industry.


7 diapositivas
Asia Map Overview Infographic
Dive into the vast and varied landscape of Asia with our collection of infographic slides designed to provide an insightful overview of the continent. These templates are ideal for educators, business professionals, and researchers looking to present data on Asia’s geography, demographics, economic status, and more. Each slide is meticulously crafted to display information clearly and attractively, using maps, charts, and icons to represent statistical data and trends across Asia. The different shades and colors used in the maps distinguish between countries, regions, or data points, making it easy for audiences to grasp complex information at a glance. These templates are fully customizable, enabling you to highlight specific areas or data according to your presentation needs. Whether discussing population growth, economic development, or environmental concerns, these slides are an excellent resource for conveying detailed information in a visually engaging format.


6 diapositivas
30 60 90 Day Plan for Executives Infographics
Develop a strategic plan for executives with our customizable 30, 60, and 90 Day Plan for Executives infographic template. This template is fully compatible with popular presentation software like PowerPoint, Keynote, and Google Slides, allowing you to easily customize it to outline the key objectives and priorities for executives over these timeframes. The 30, 60, and 90 Day Plan for Executives infographic template offers a visually engaging platform to structure and communicate short-term goals, milestones, and initiatives for executive leaders. Whether you're an executive, manager, or HR professional, this template provides a user-friendly canvas to create informative presentations and strategic plans. Optimize executive performance and alignment with this SEO-optimized 30, 60, and 90 Day Plan for Executives infographic template, thoughtfully designed for clarity and ease of use. Customize it to showcase specific objectives, key projects, performance metrics, and alignment with broader organizational goals, ensuring that executives have a clear roadmap for success. Start crafting your personalized infographic today to help executives drive strategic impact in their roles.


14 diapositivas
Employee Happiness and Workplace Ratings Presentation
Measure and present employee satisfaction with clarity using this Employee Happiness and Workplace Ratings slide. Featuring a colorful semi-circular gauge and supporting percentage breakdowns, this layout is ideal for HR reports, internal surveys, or company culture reviews. Easily highlight key categories like benefits, leadership, or engagement levels. Fully editable in PowerPoint, Keynote, and Google Slides.


7 diapositivas
Digital Marketing Infographic
Digital marketing refers to the use of digital channels, such as the internet, social media, search engines, email, and mobile devices, to promote products, services, and brands. This infographic showcases key concepts and strategies in the field of digital marketing. It is designed to help businesses and marketers effectively communicate and educate their audience about the various aspects of digital marketing. This template can be used to cover a wide range of digital marketing topics, including social media marketing, search engine optimization, content marketing, email marketing, paid advertising, analytics, and more.


7 diapositivas
Sustainability Business Management Infographic Presentation
Sustainability Management presents information related to sustainable business practices and management strategies. The goal of this template is to help you create a balance between environmental factors to ensure long-term success for a business or organization. This infographic can cover a variety of topics, including sustainable supply chain management, energy, resource efficiency, and waste reduction. This template has different layouts including diagrams and graphs. It also includes icons, symbols, and color-coding to make the information more accessible and easier to understand.


21 diapositivas
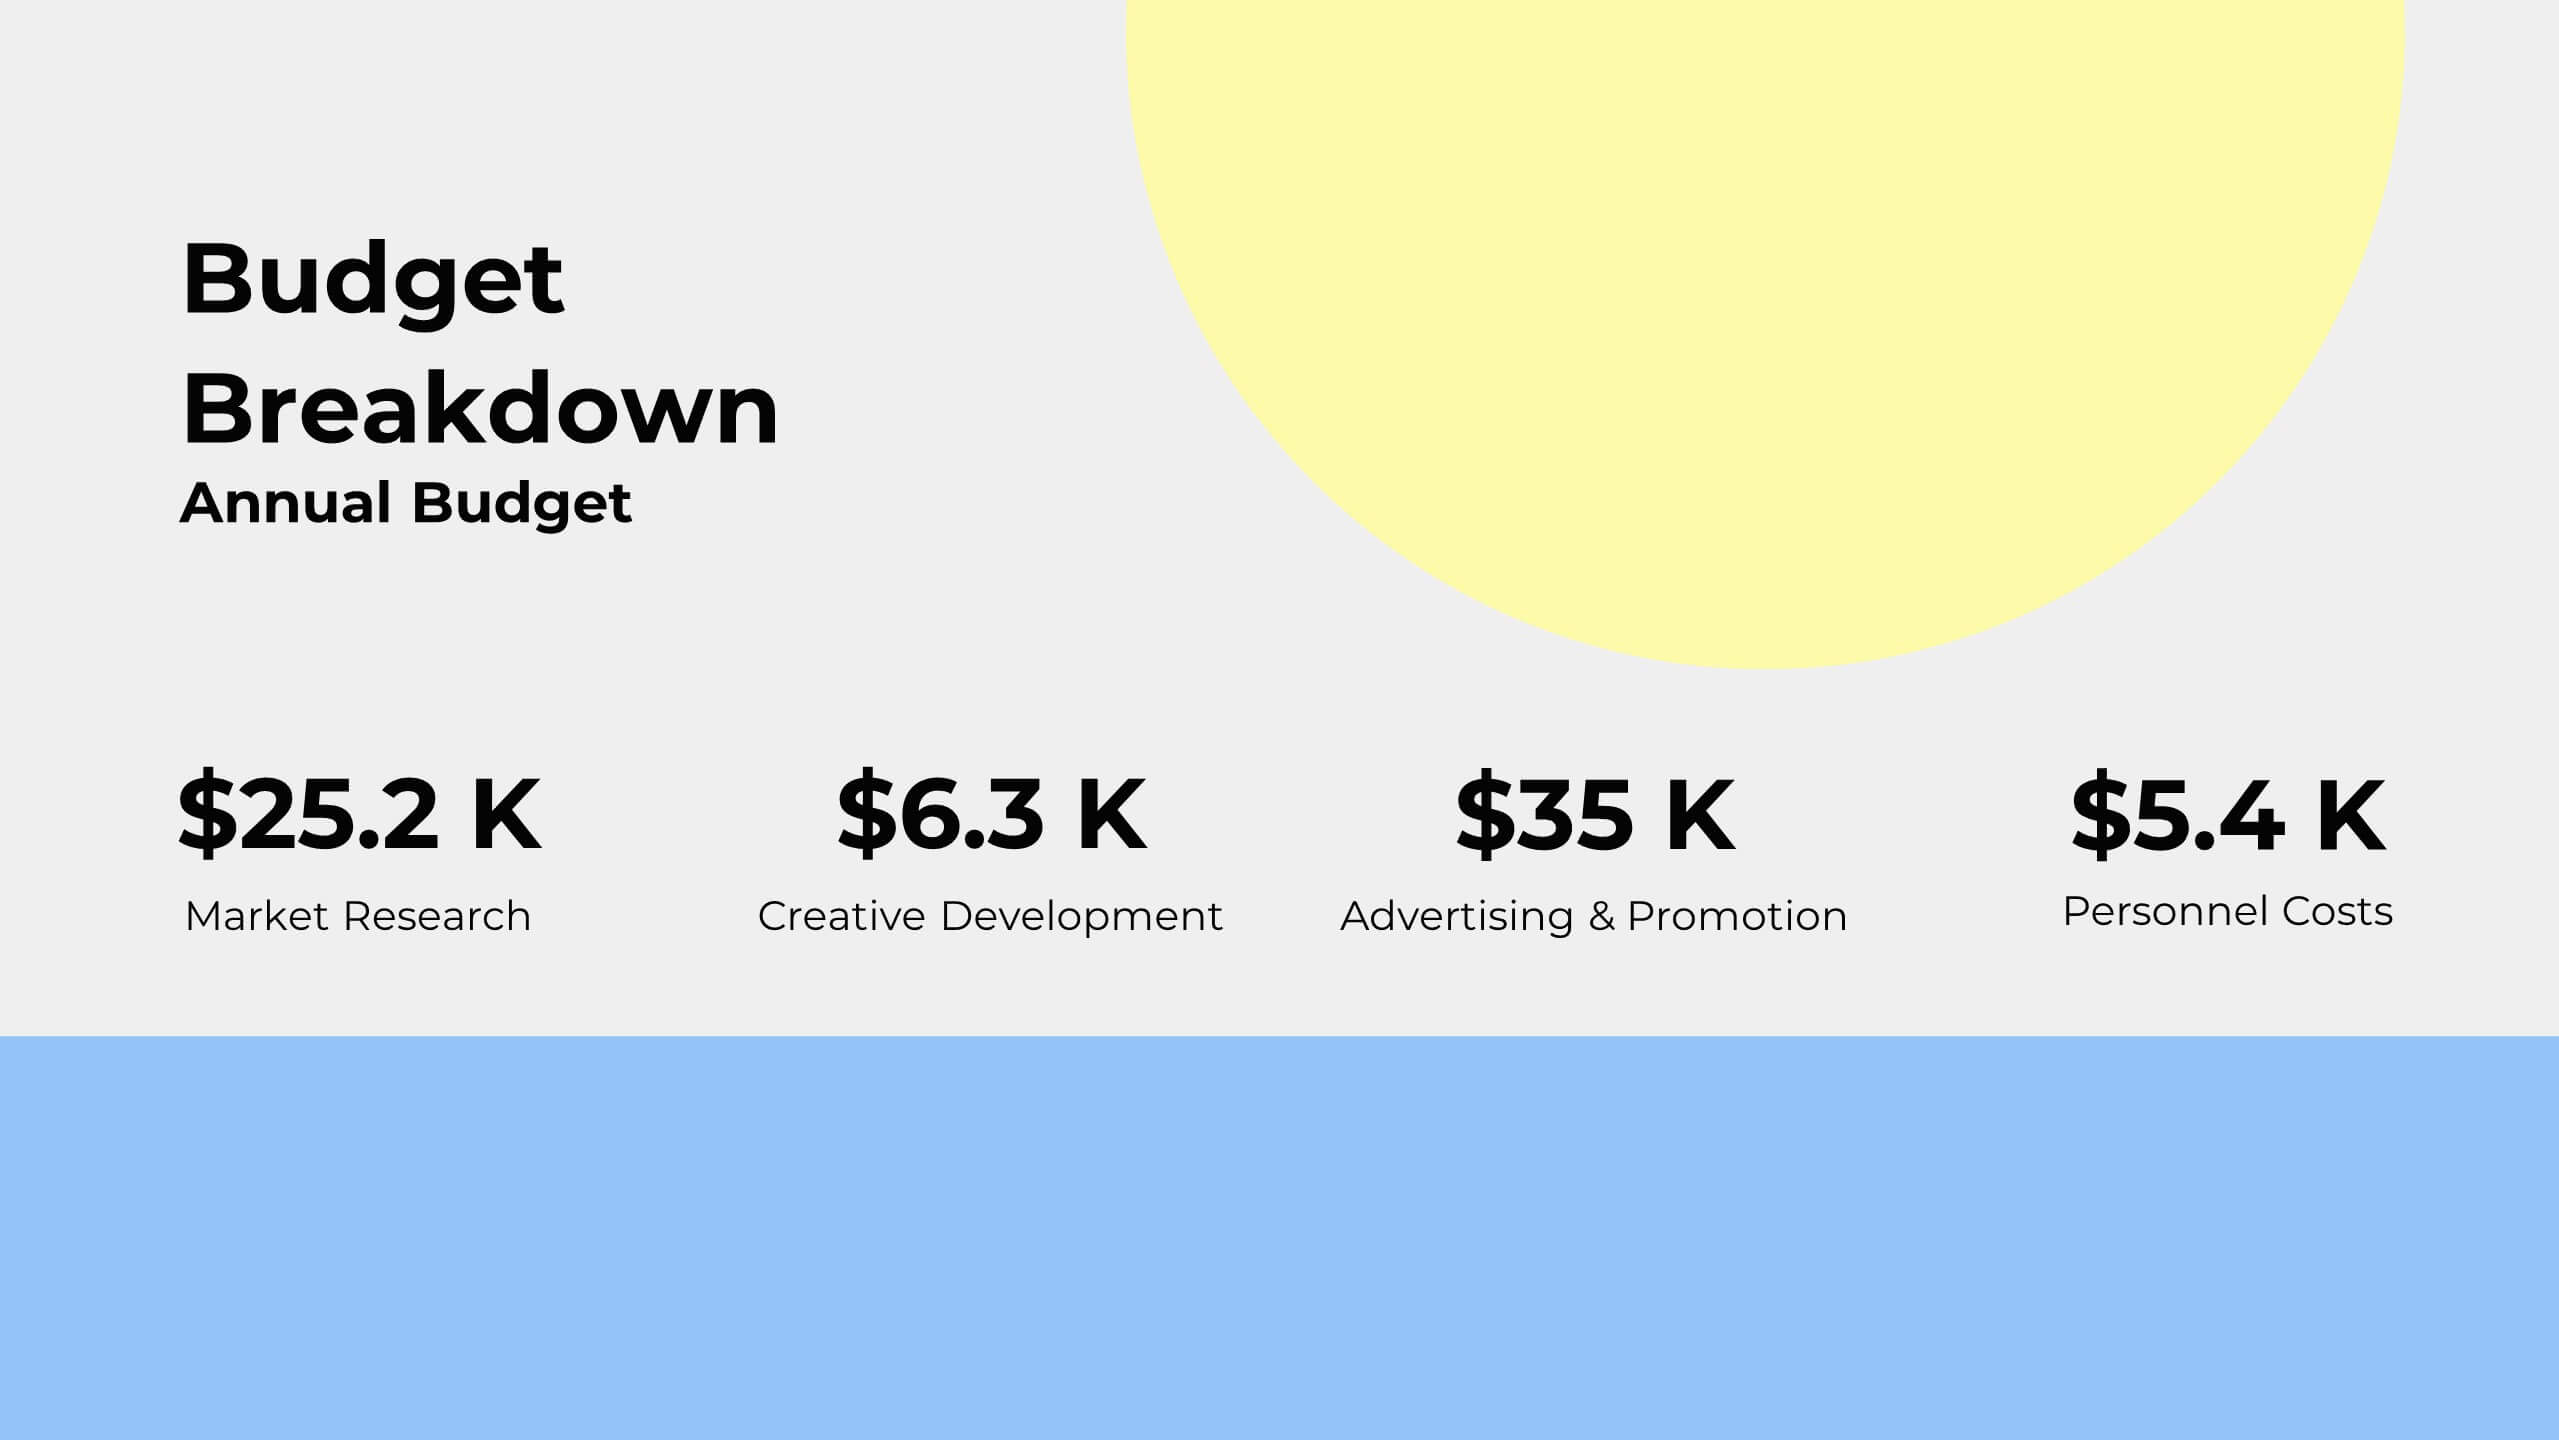
Somnara Full-Service Agency Project Plan Presentation
Present your agency’s expertise with a comprehensive project plan template designed to impress clients and stakeholders. This sleek and professional layout allows you to outline your mission and vision, highlight team strengths, and showcase core services with clarity. Use the client testimonials and case studies sections to establish credibility and trust. Visualize your strategic approach with dedicated slides for market analysis, creative process, and execution strategy. The template also includes detailed sections for partnership opportunities, social responsibility initiatives, and a future outlook, ensuring a holistic view of your agency’s capabilities and forward-thinking approach. Fully editable and compatible with PowerPoint, Google Slides, and Keynote, this template is perfect for full-service agencies seeking to elevate their presentations. Customize each slide to reflect your unique value and deliver impactful, results-oriented proposals.


6 diapositivas
Economic Trends in Africa Map Presentation
The Economic Trends in Africa Map template visually presents economic data across Africa. It displays regional economic shifts and trends, using an interactive map and related graphs. Ideal for analysts and investors, it offers clear insights for strategic decisions. Compatible with PowerPoint, Keynote, and Google Slides.


7 diapositivas
Cryptocurrency Infographic Presentation Template
Cryptocurrency is a form of digital or virtual currency that uses cryptography (the conversion of data into an unreadable format) to secure transactions between two parties. Cryptocurrencies use decentralized control as opposed to centralized electronic money and central banking systems. This template is the perfect presentation for informing on the world of cryptocurrency. The decentralized control of each cryptocurrency works through a blockchain. It is an alternative currency brought on by the emergence of Internet. This template comes with appealing illustrations made for you to customize.


22 diapositivas
Glidebeam Content Marketing Pitch Deck Presentation
Capture your audience’s attention and showcase your marketing strategy with confidence using this polished and thoughtfully designed marketing pitch deck. It covers key elements like company history, target audience, competitive landscape, financial highlights, and growth strategies. Ideal for pitches or meetings, it’s compatible with PowerPoint, Keynote, and Google Slides.


20 diapositivas
Solstice Research Proposal Presentation
This sleek research proposal template is crafted to impress! Highlighting sections like research methodology, literature review, key findings, and recommendations, it’s designed for in-depth presentations with a modern touch. Perfect for academic, business, or technical reports, this template is fully compatible with PowerPoint, Keynote, and Google Slides. Ideal for delivering insights with style!


20 diapositivas
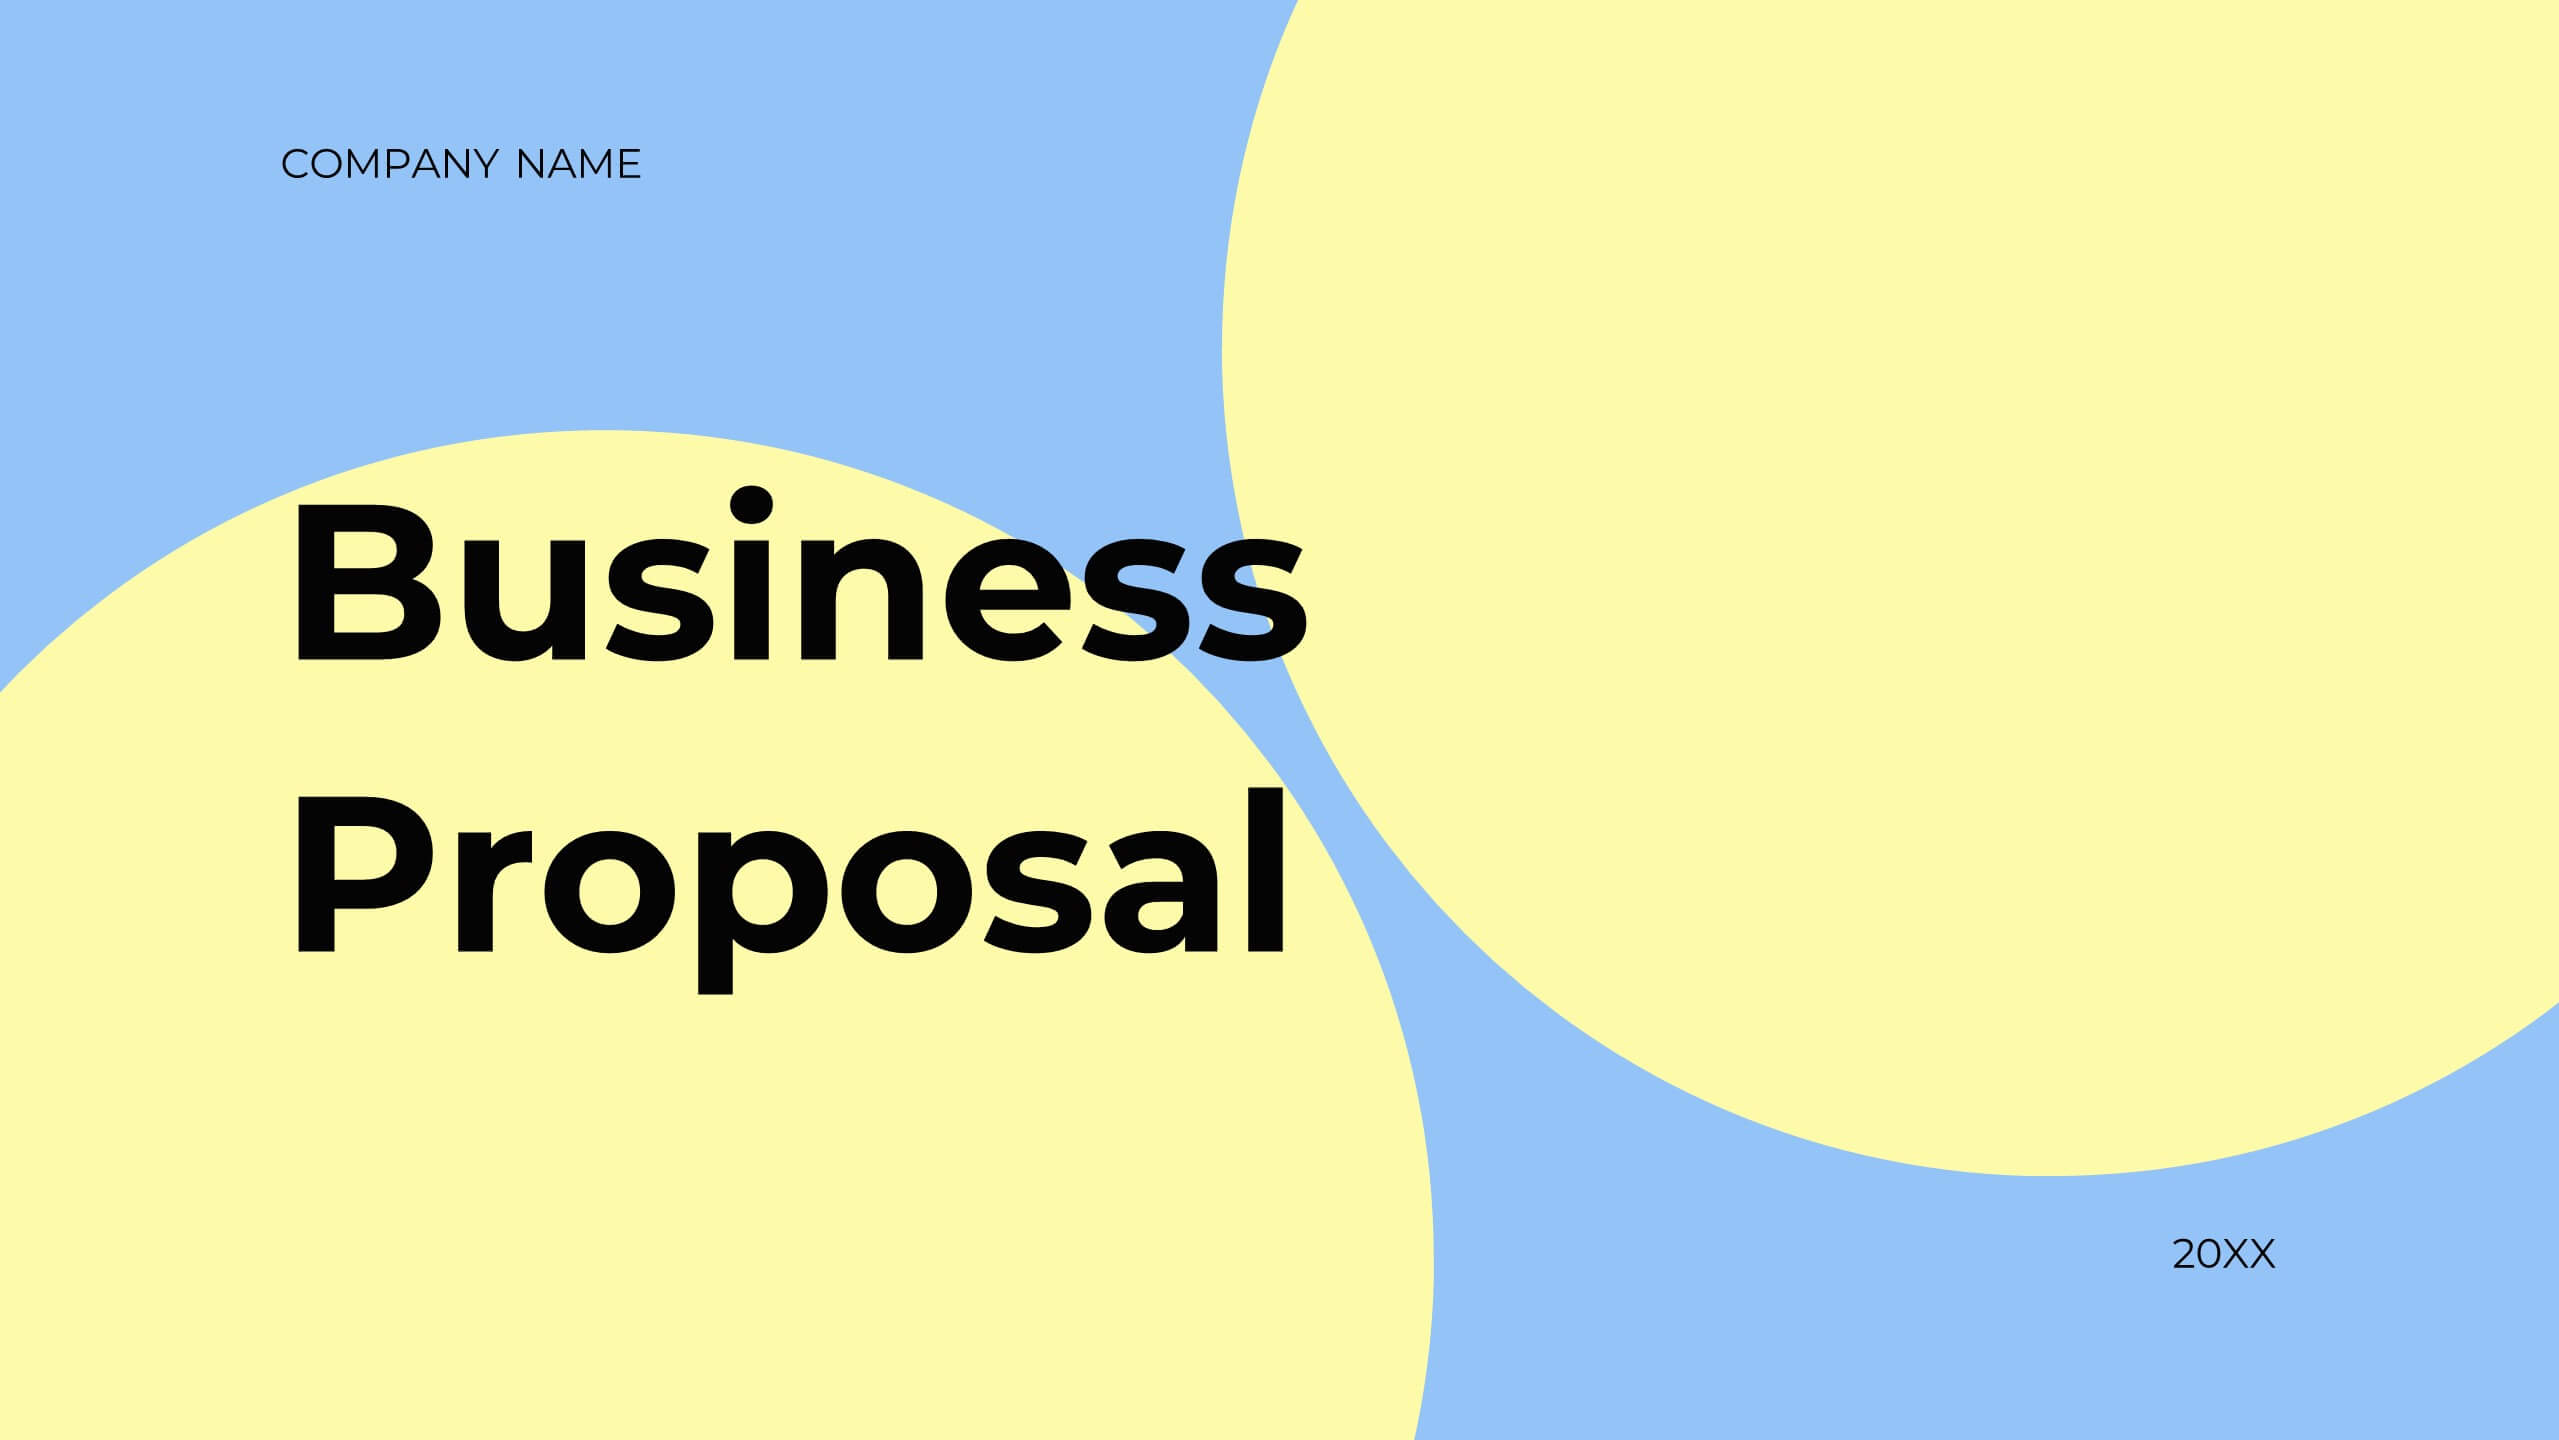
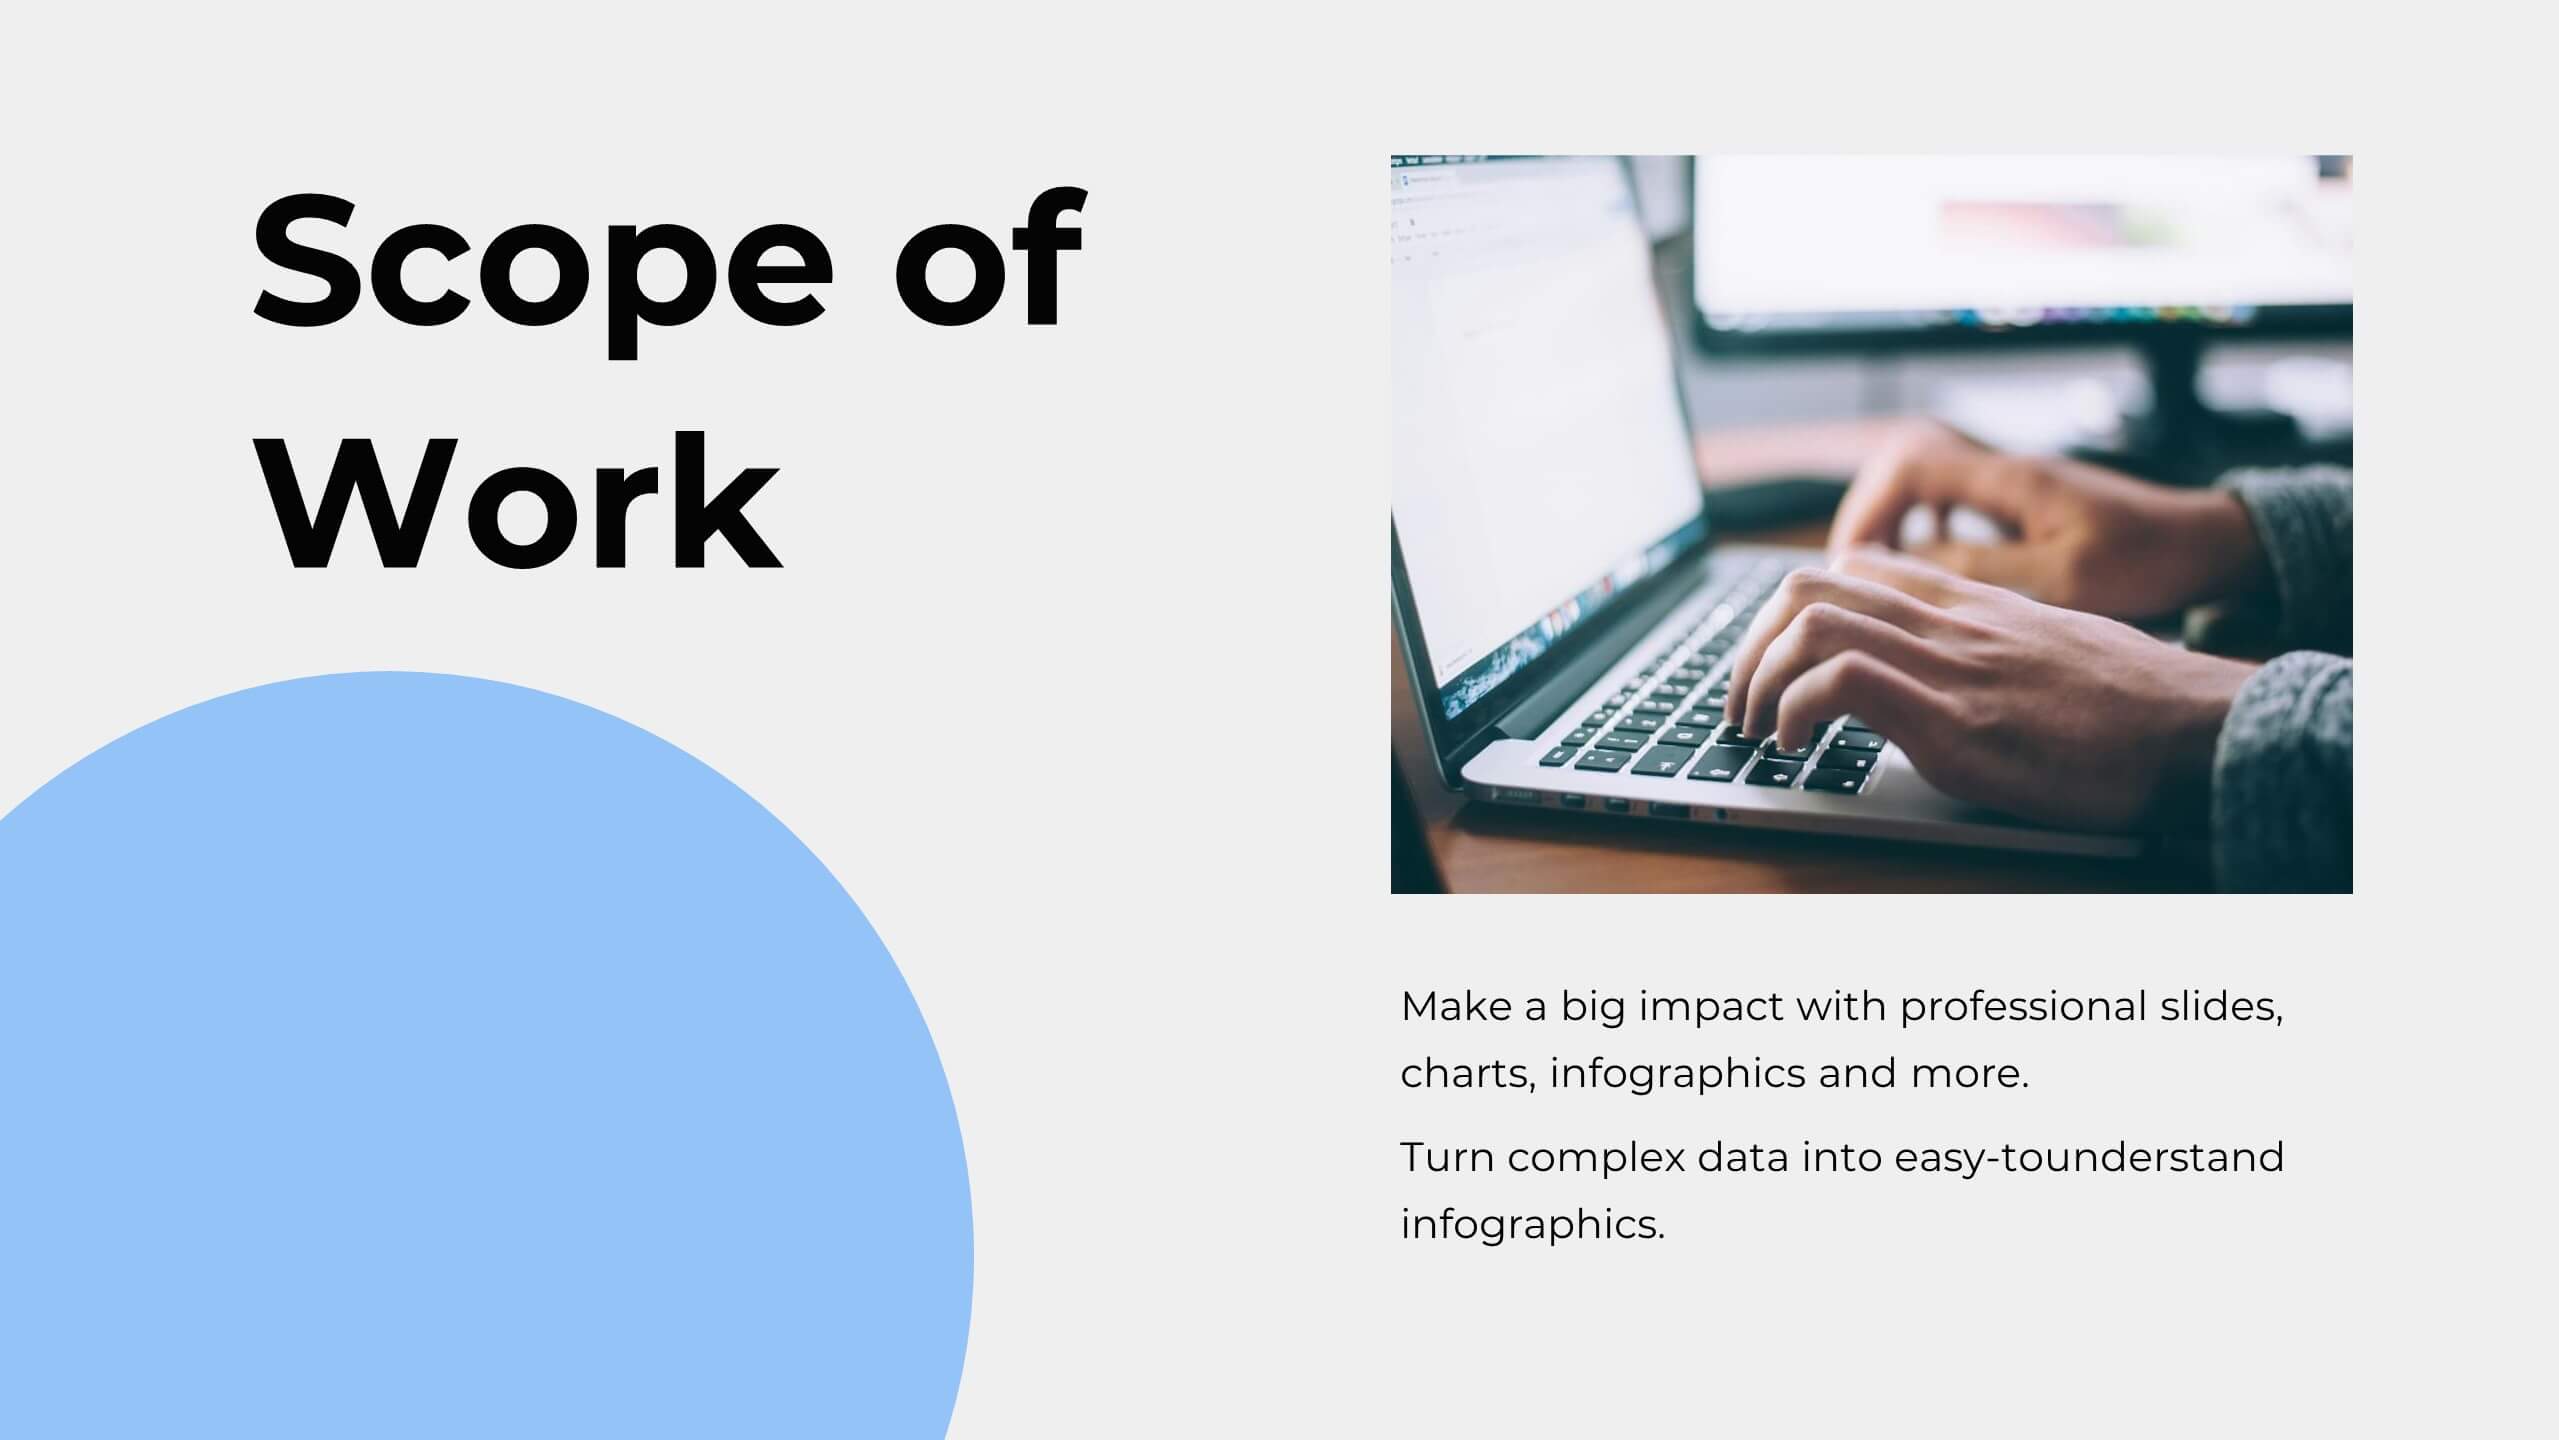
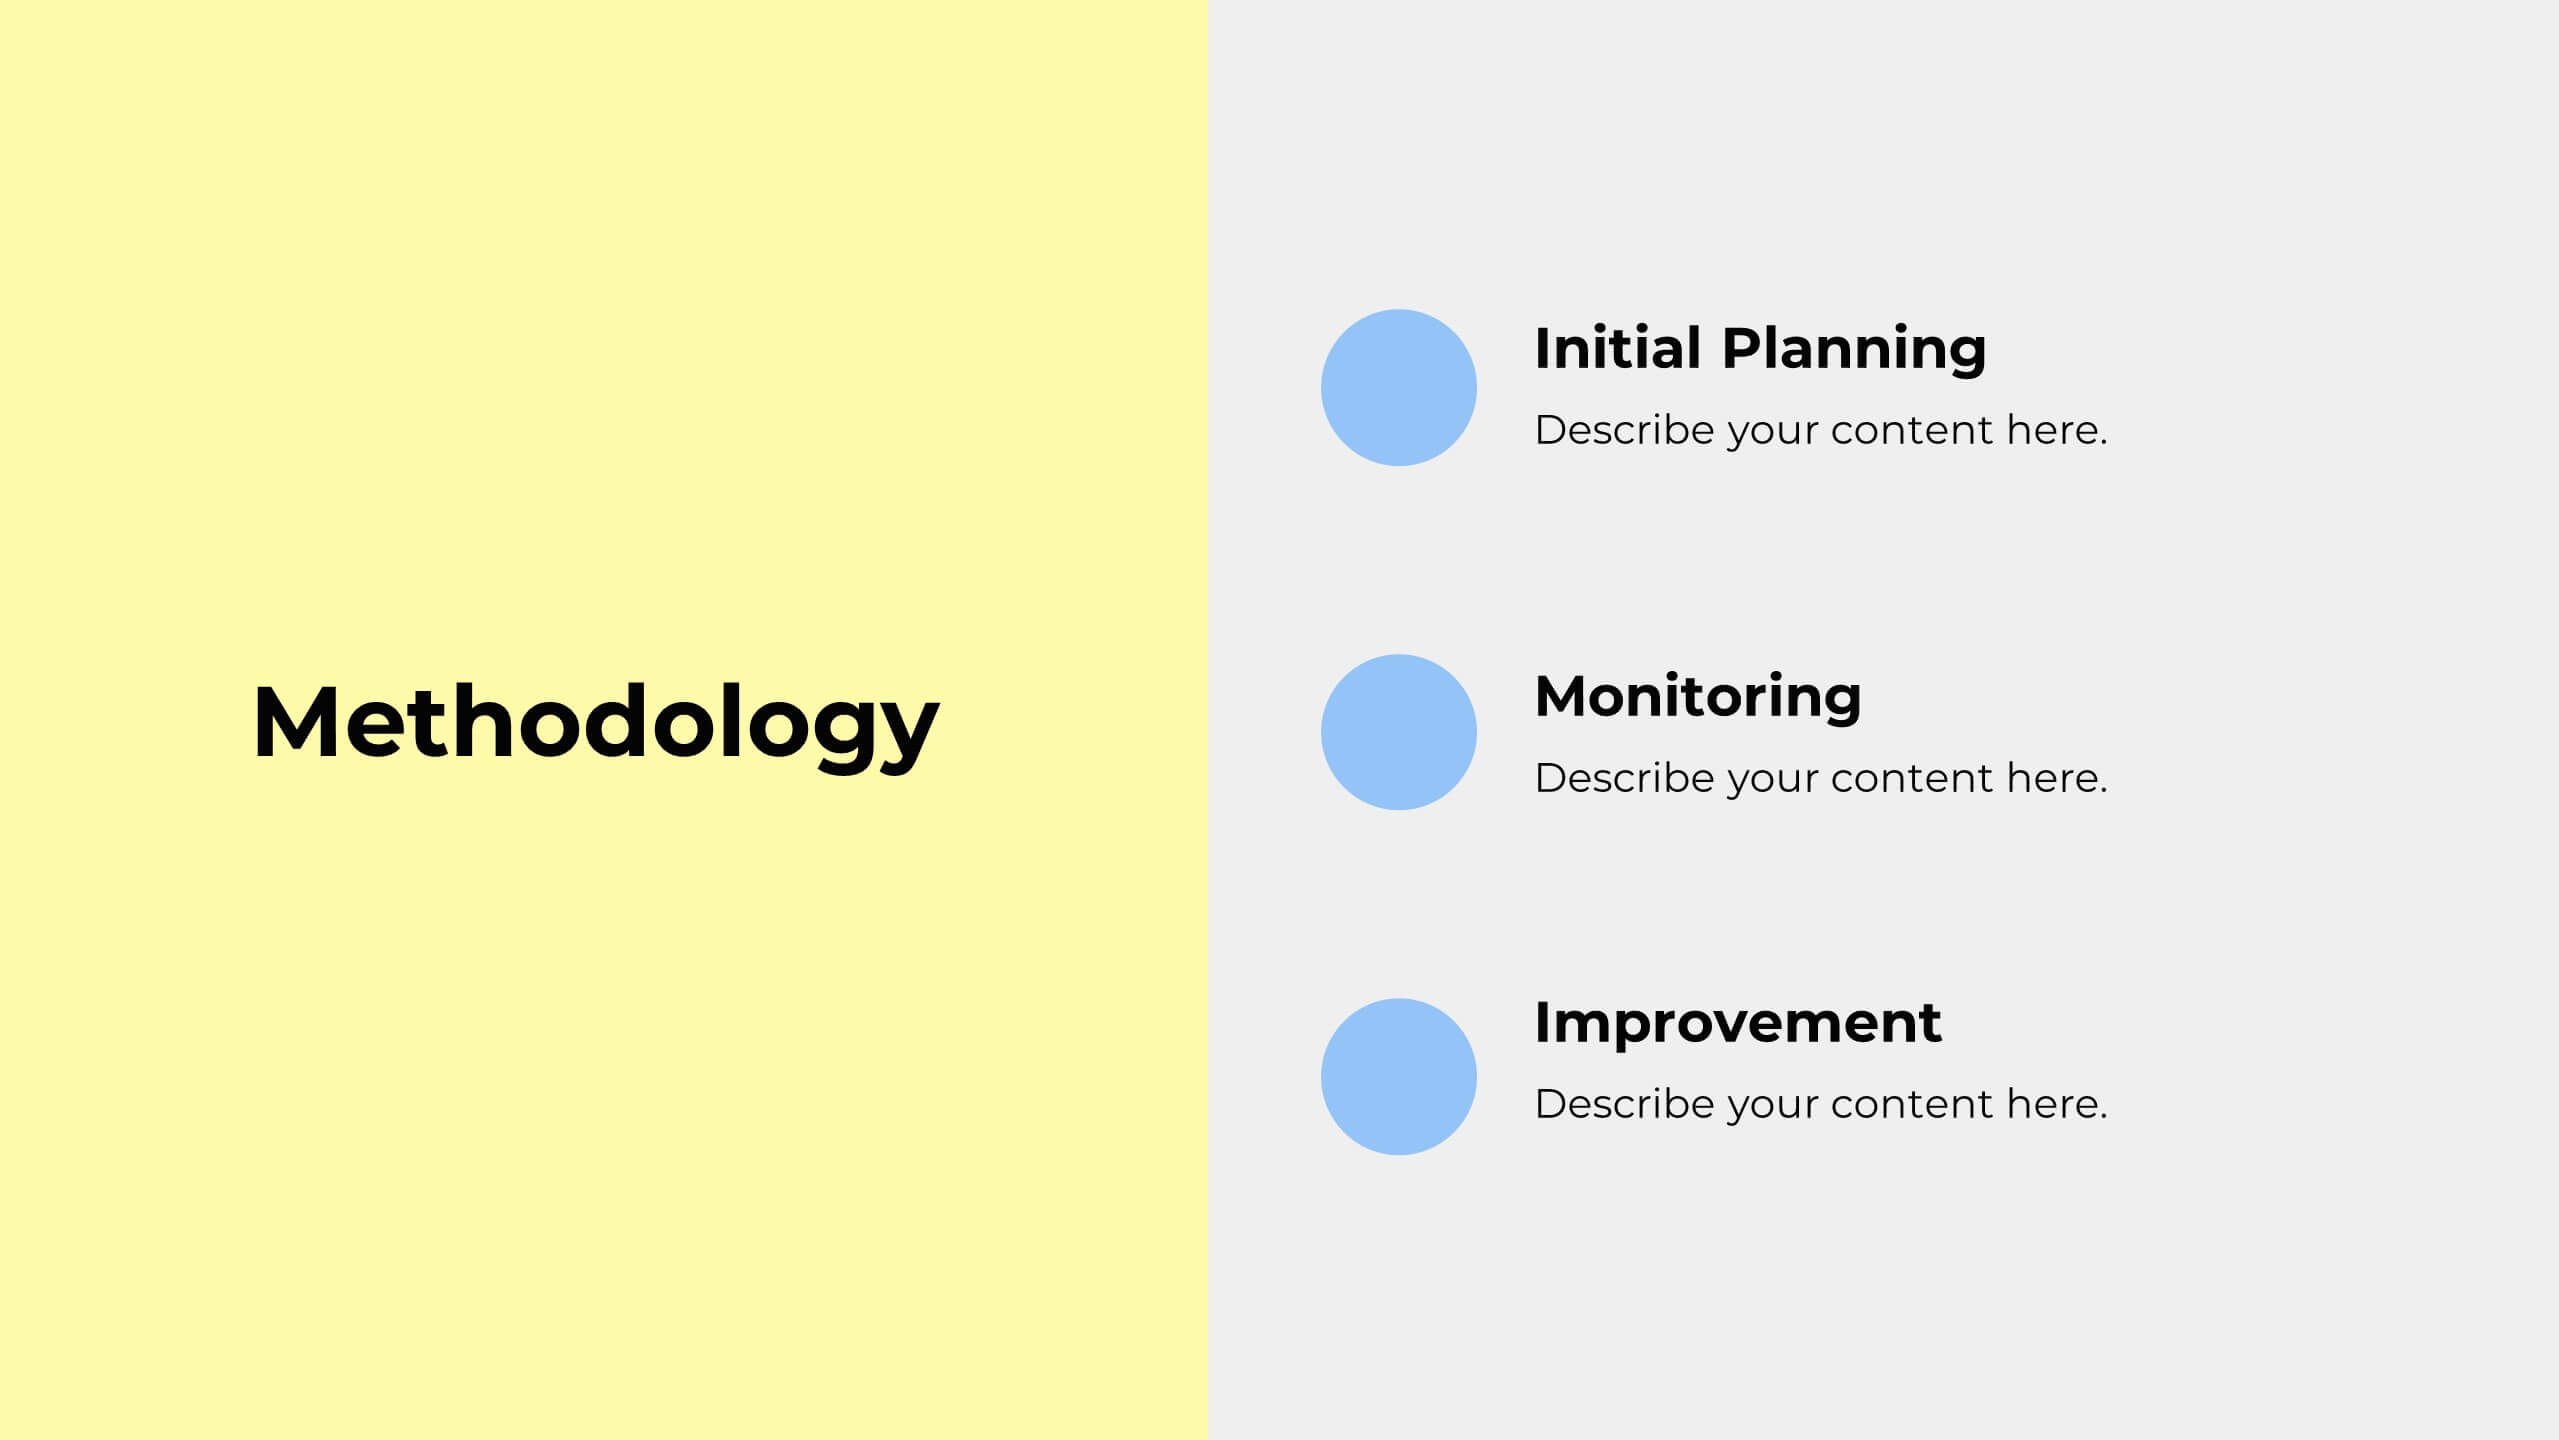
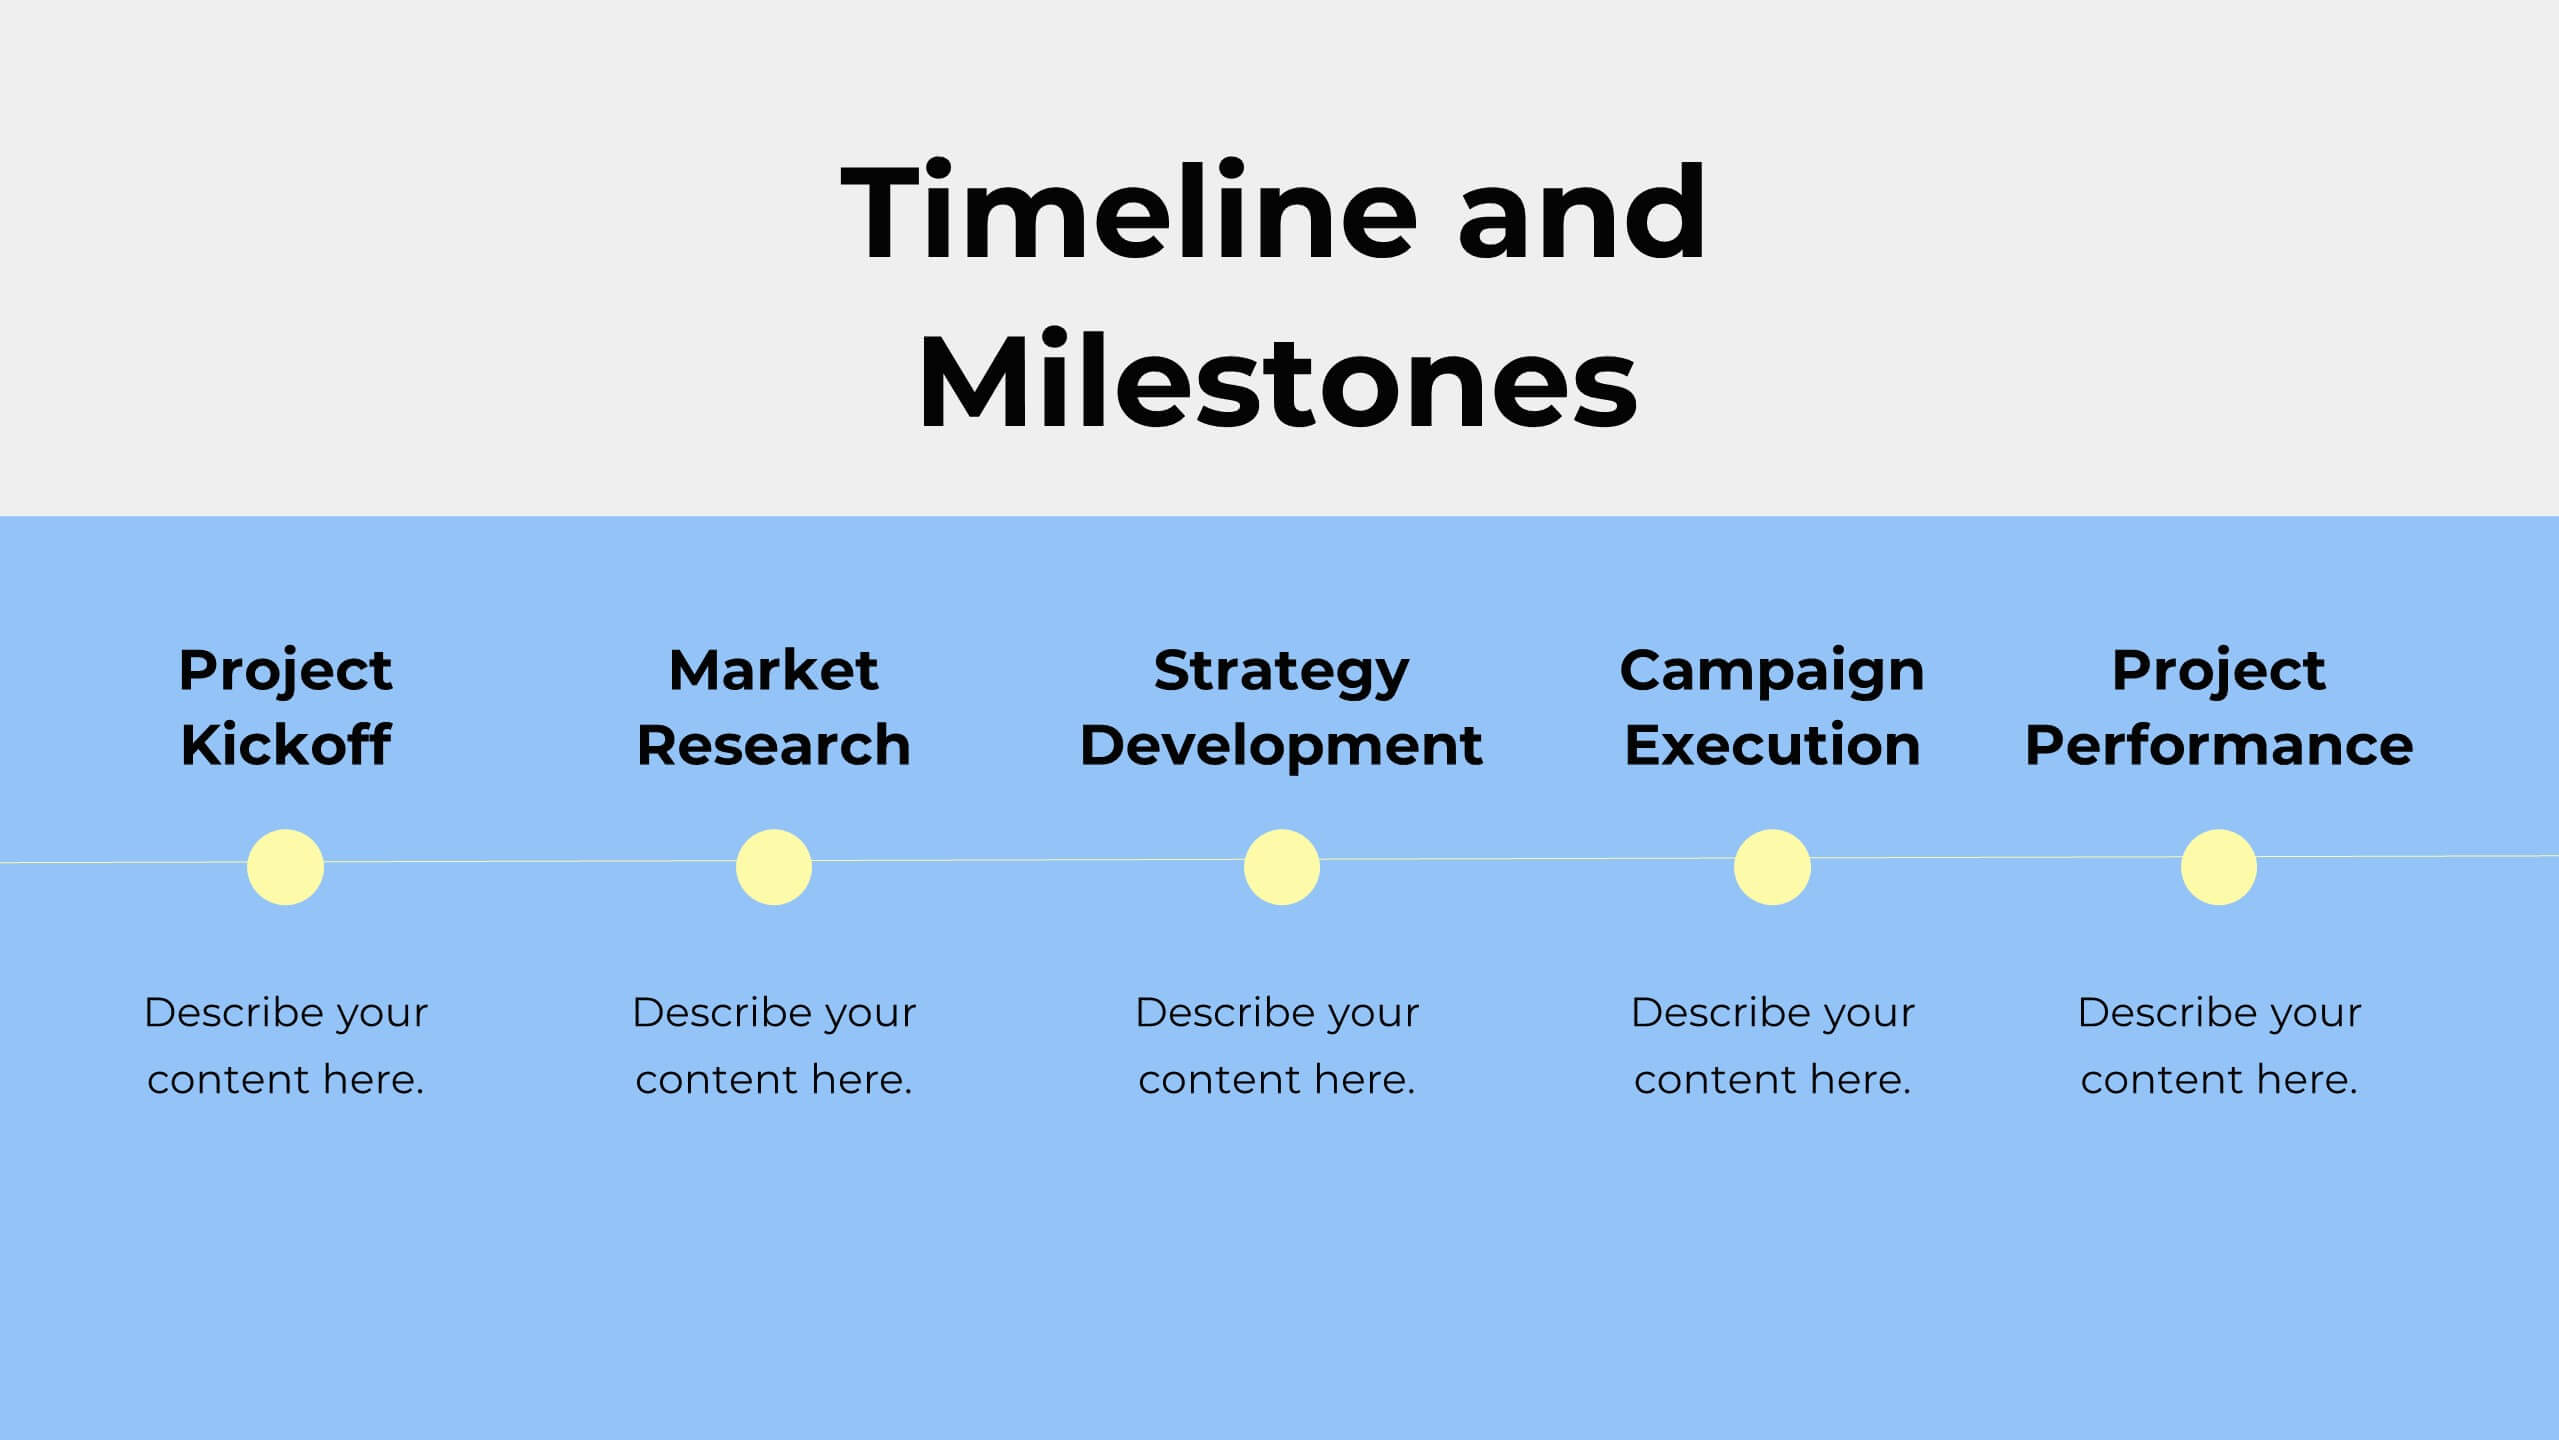
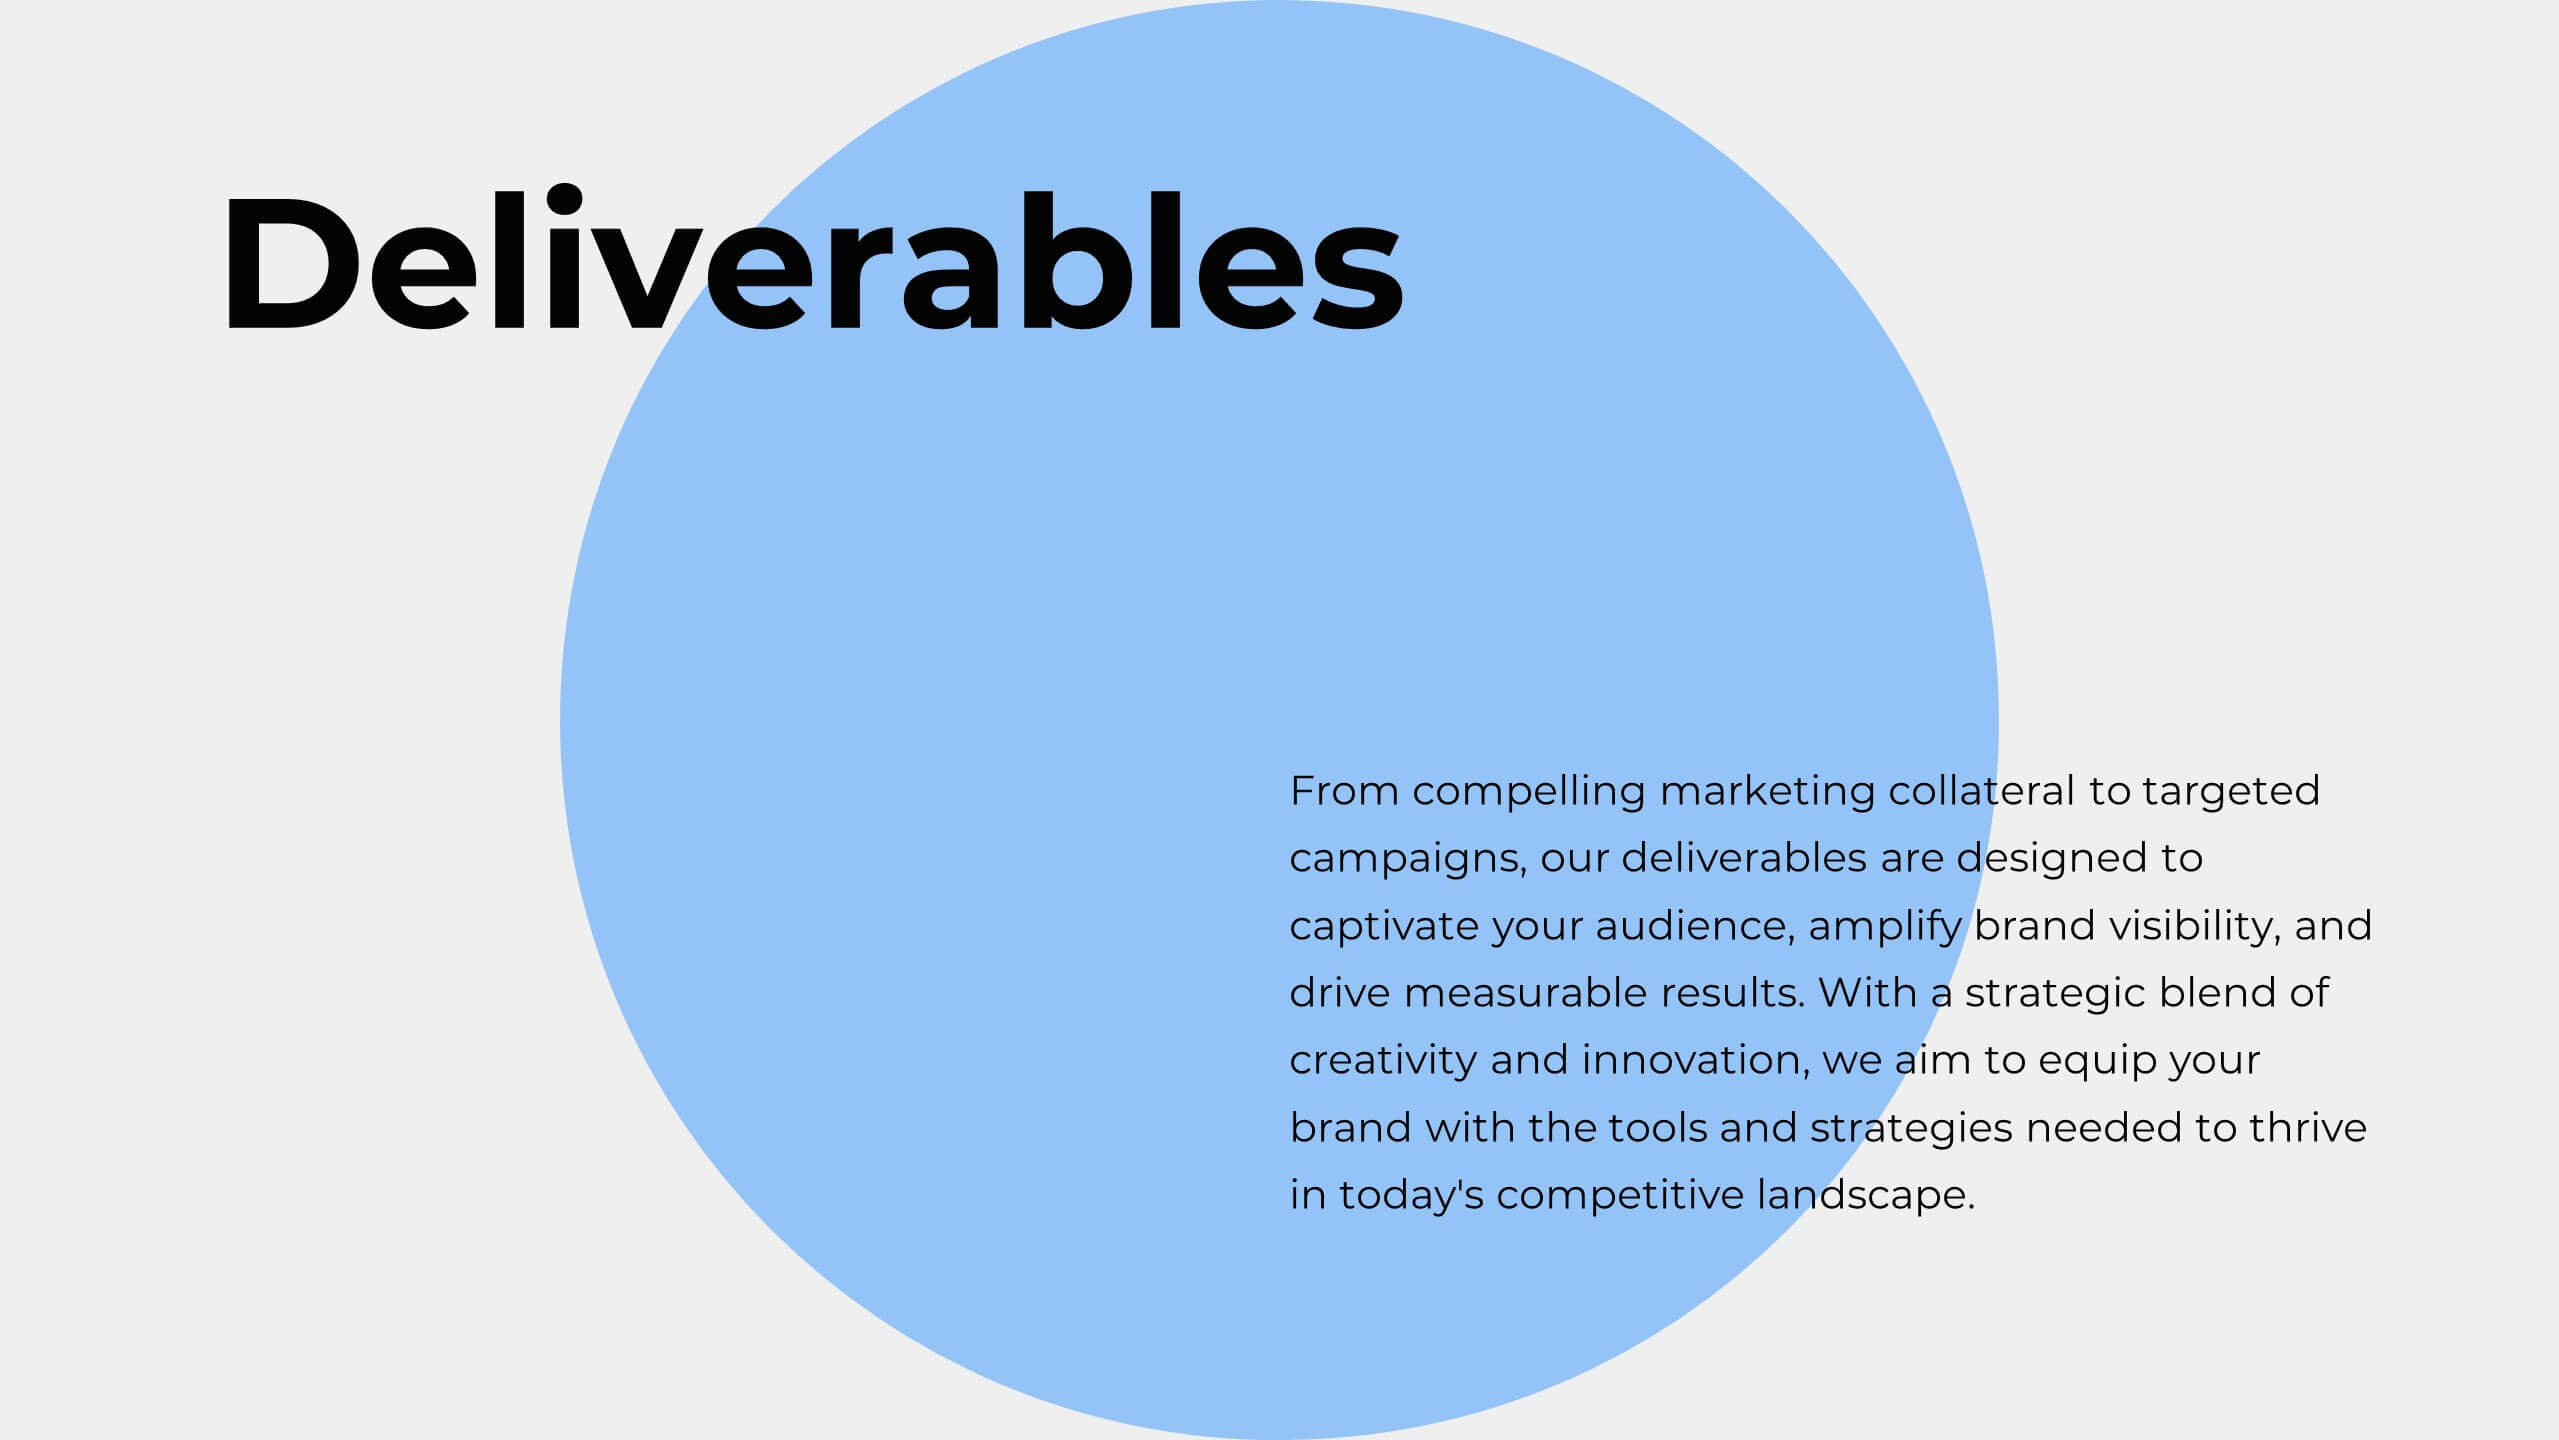
Inspire Business Proposal Presentation
Excite your audience with a compelling business proposal! This template includes sections for objectives, scope of work, timeline, budget, and more. Present your business plan clearly and effectively. Compatible with PowerPoint, Keynote, and Google Slides, it’s designed to impress stakeholders and secure approval for your project. Transform ideas into reality today!


6 diapositivas
Executive Leadership Training Presentation
Enhance professional development with this executive leadership training template, designed with a step-by-step staircase layout symbolizing career progression. Perfect for leadership programs, corporate training, and skill-building workshops, it visually organizes six key topics for clarity. Fully editable in Canva, PowerPoint, or Google Slides, making customization effortless for any organization’s needs.


19 diapositivas
Kinetic Sales Forecast Presentation
Forecast your sales with style using this vibrant template! Perfect for detailing company overview, sales process, team, and strategy. Includes sections for case studies, pricing, and future opportunities. Ideal for sales teams to impress stakeholders. Compatible with PowerPoint, Keynote, and Google Slides.


7 diapositivas
Finance in Business Infographic Presentation
Finance is an essential component of any economy, and it plays a crucial role in enabling businesses, individuals, and governments to manage their resources effectively. Use this template to help others understand the basics of finance in a simple manner. Finance is very broad, this template contains everything you need to keep track of your spending and earning. This has been designed to help you deliver informative Infographics that convey the main points of your topic. It is compatible with PowerPoint, Keynote and Google Slides, so you can easily change the text, add images, and change colors.


7 diapositivas
Market Focus and Demographic Insights Presentation
Present your audience data with clarity using this Market Focus and Demographic Insights presentation. Designed with a central persona and six key data points, this slide helps visualize customer characteristics, behavioral trends, and strategic targets. Great for marketing, branding, or investor decks. Fully editable in Canva, PowerPoint, and Google Slides.


5 diapositivas
RAPID Decision-Making Model Presentation
The RAPID Decision-Making Model template simplifies complex decision processes, laying out steps from recommending to deciding in an easily digestible format. It's ideal for team leaders and managers who want to streamline decision-making. The template is designed for seamless use across PowerPoint, Keynote, and Google Slides, ensuring broad compatibility and user-friendly presentations.