


Características


¿Tienes alguna pregunta?
Recomendar


4 diapositivas
Human-Centered Design Thinking Strategy Presentation
Put people at the heart of your process with this Human-Centered Design Thinking Strategy Presentation. Ideal for visualizing empathy-driven innovation, this template allows you to clearly present two key perspectives or user segments using stylized silhouette graphics and percentage breakdowns. Great for product development pitches, UX design reviews, or customer journey storytelling. Compatible with PowerPoint, Keynote, and Google Slides.


5 diapositivas
Decision-Making Options
Visualize your strategic paths with this step-by-step decision-making infographic. Designed to showcase up to five sequential options or phases, this template uses bold icons and numbering to guide viewers through the process. Ideal for business strategies, project planning, or process evaluations. Fully editable in PowerPoint, Keynote, and Google Slides.


22 diapositivas
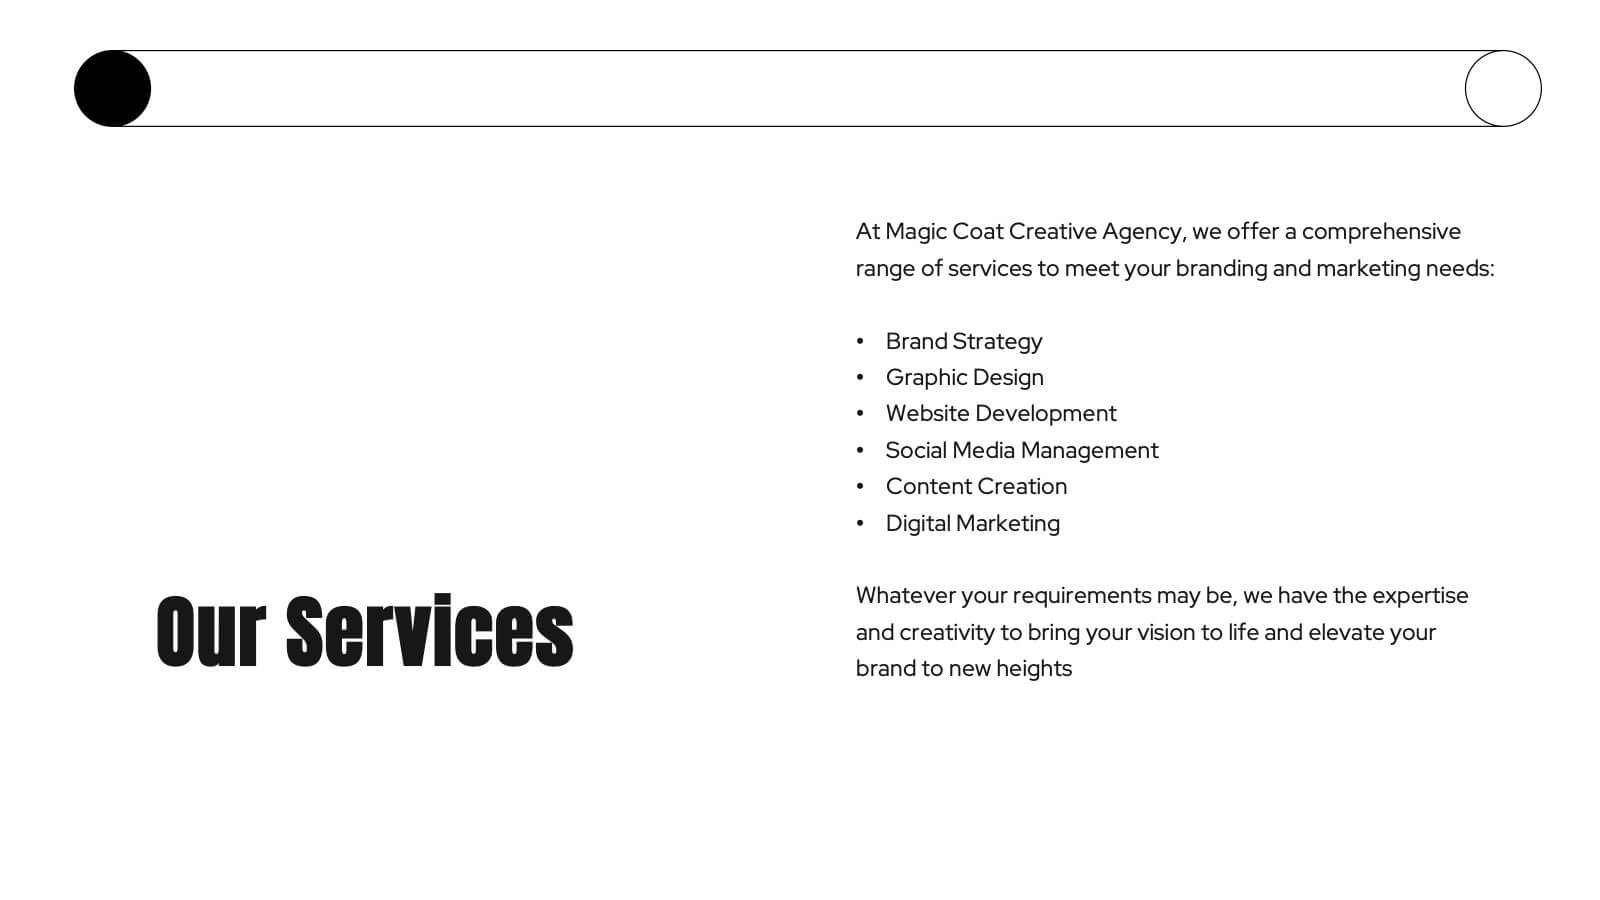
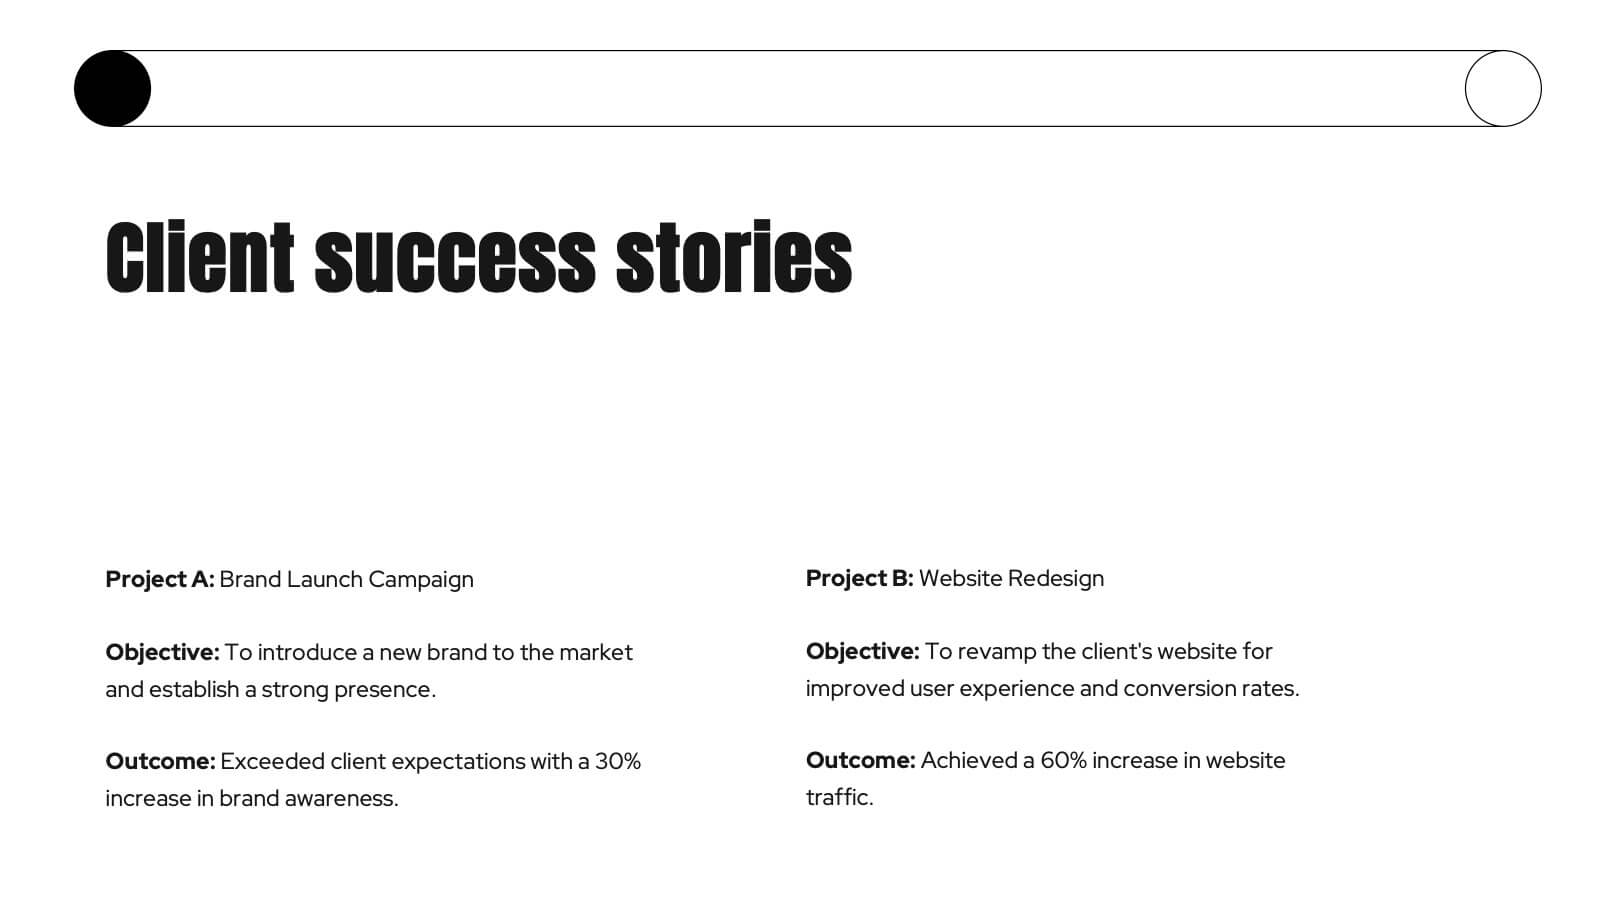
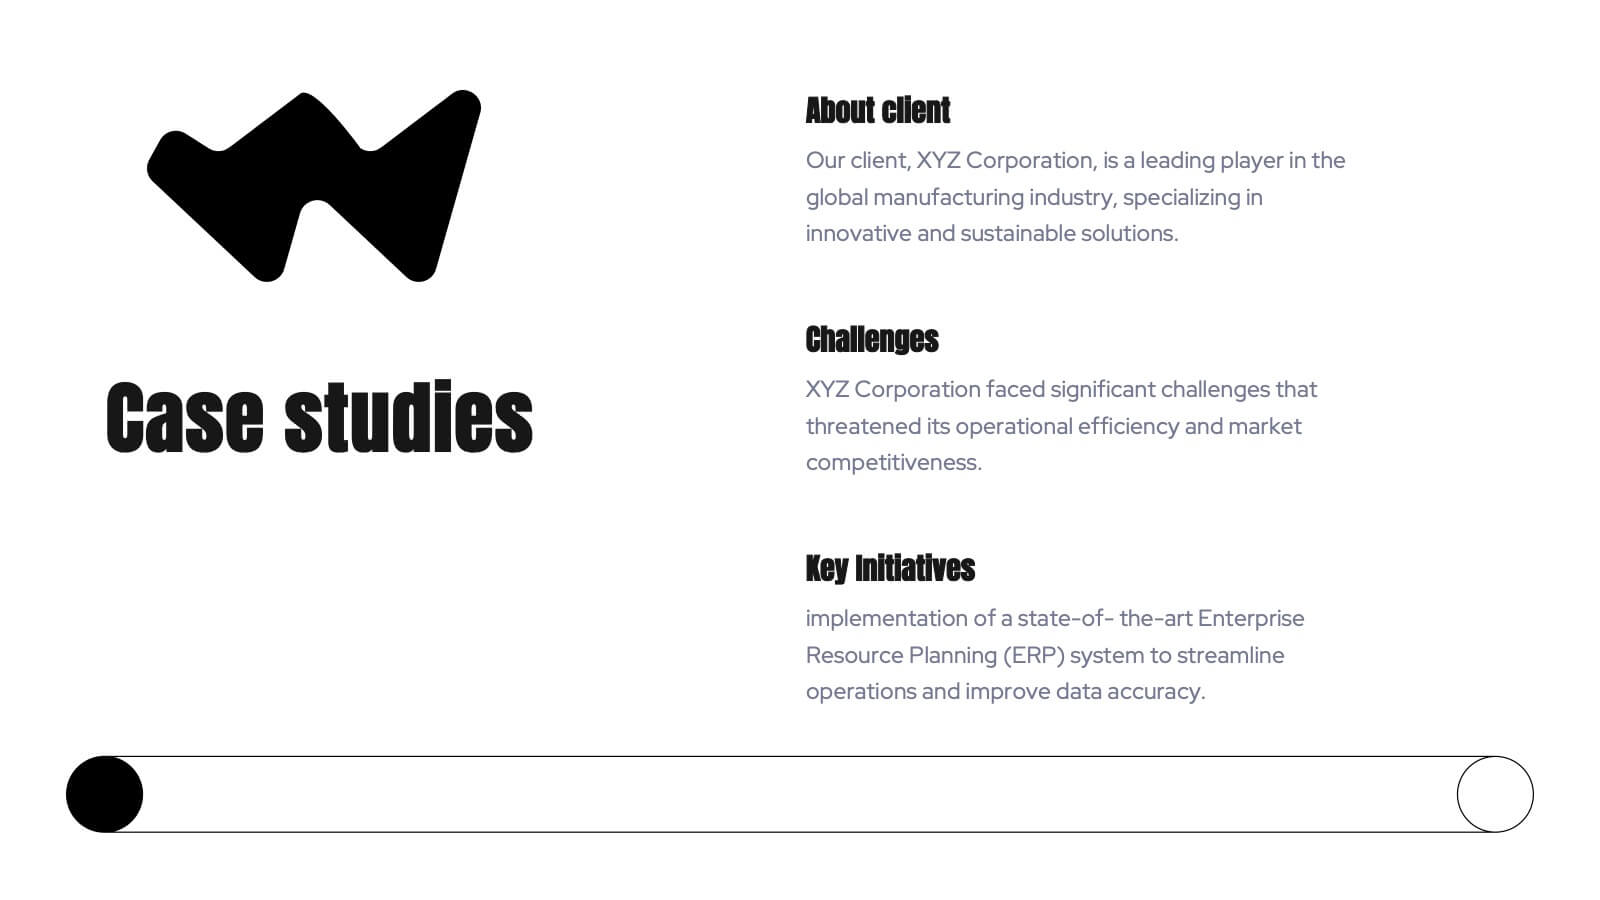
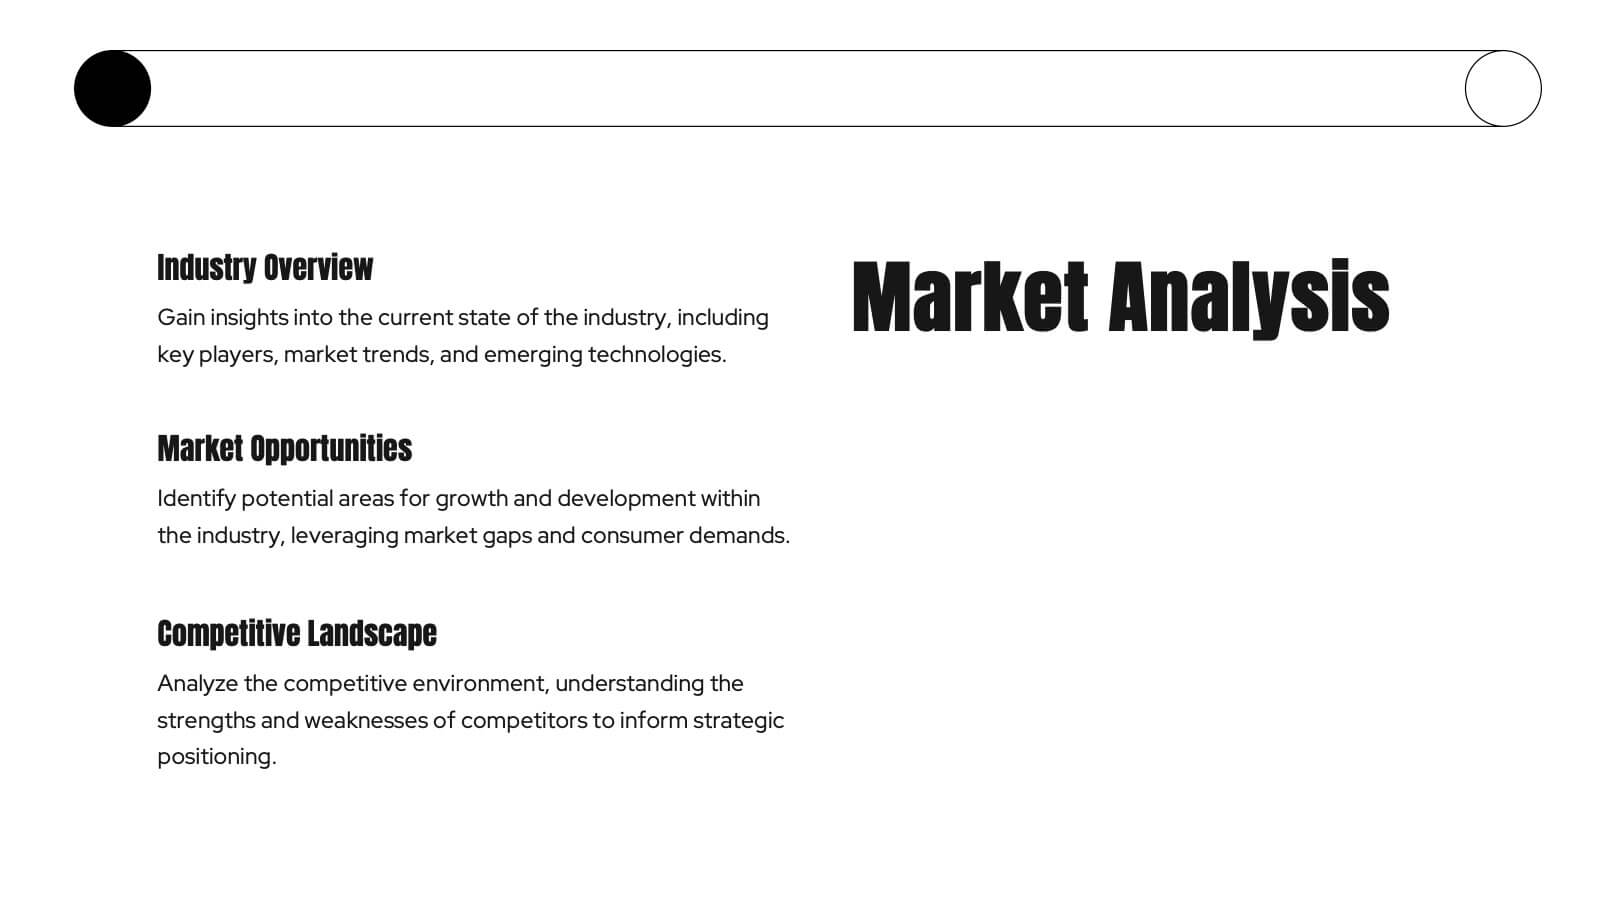
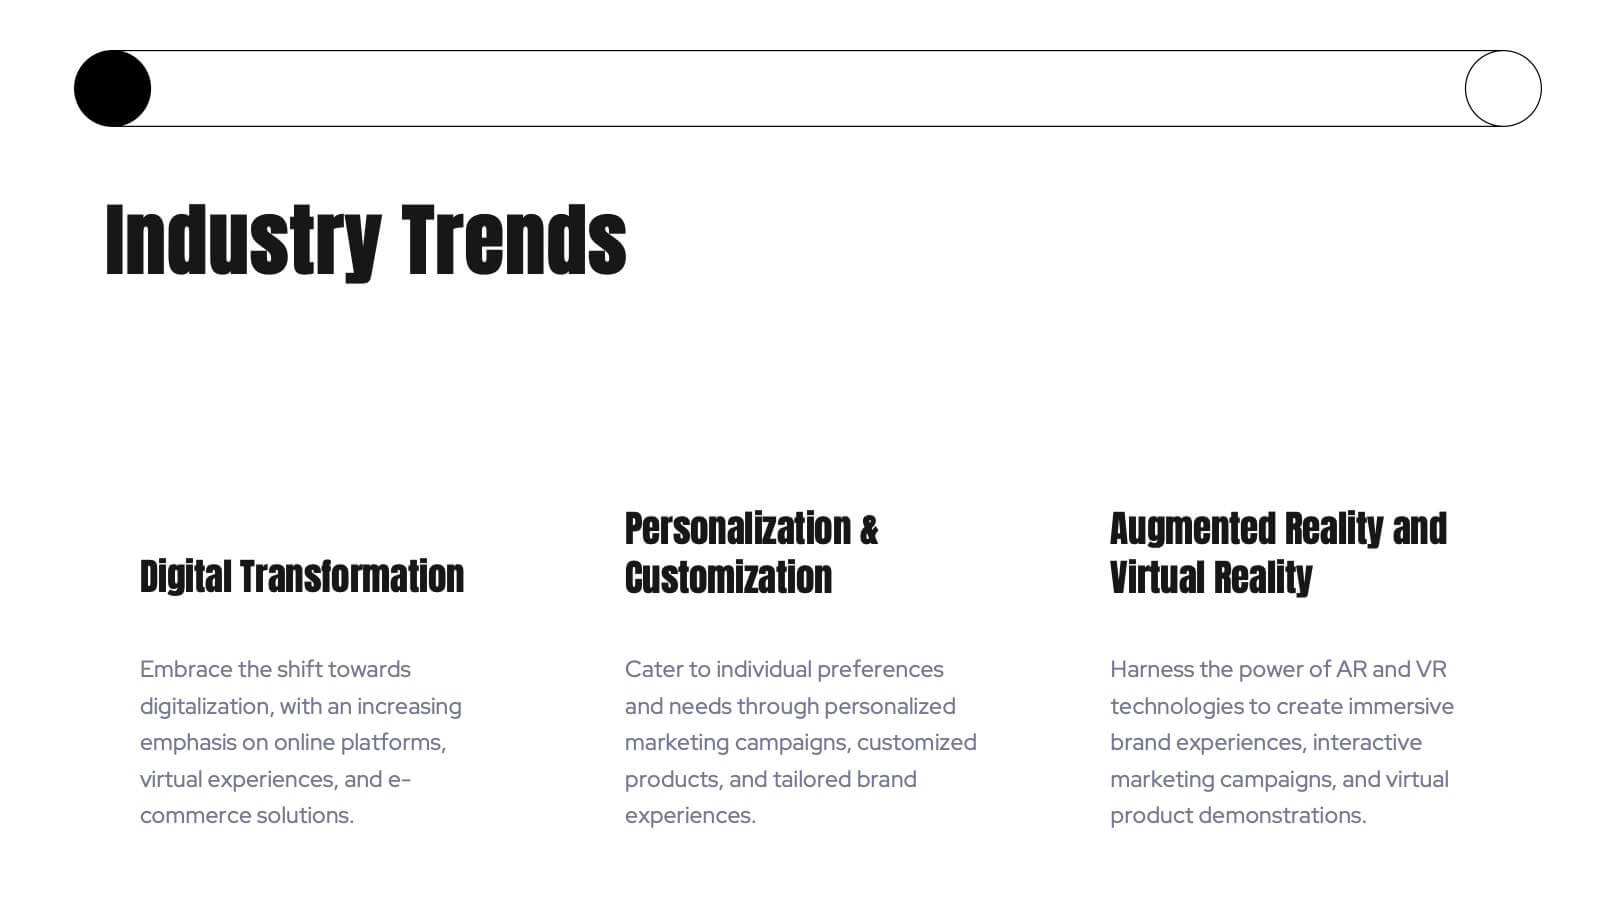
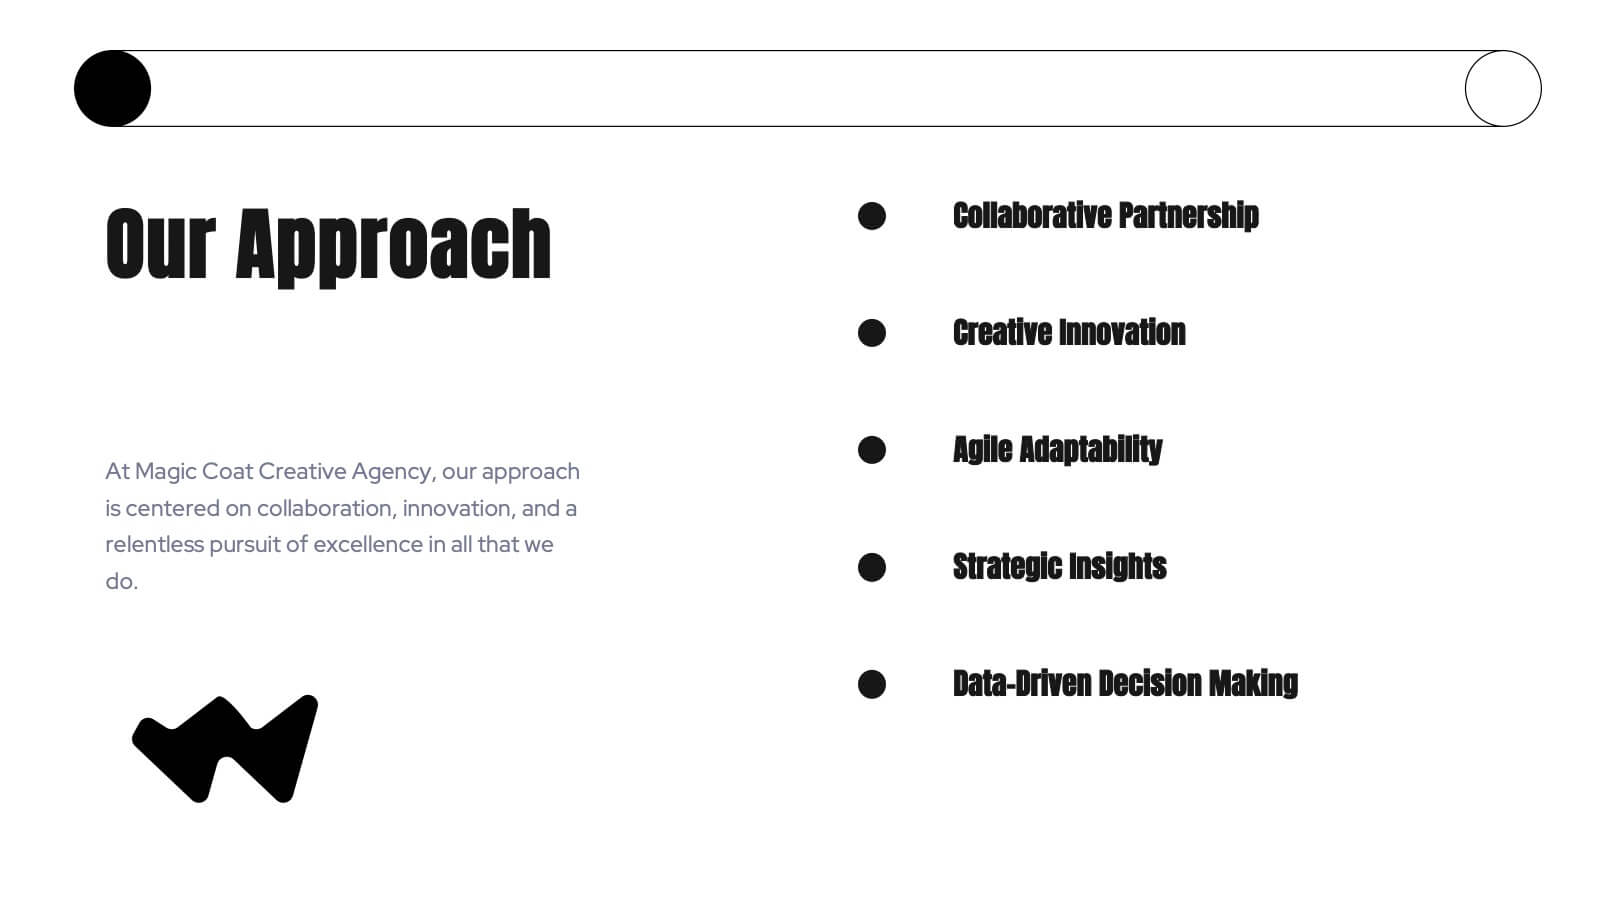
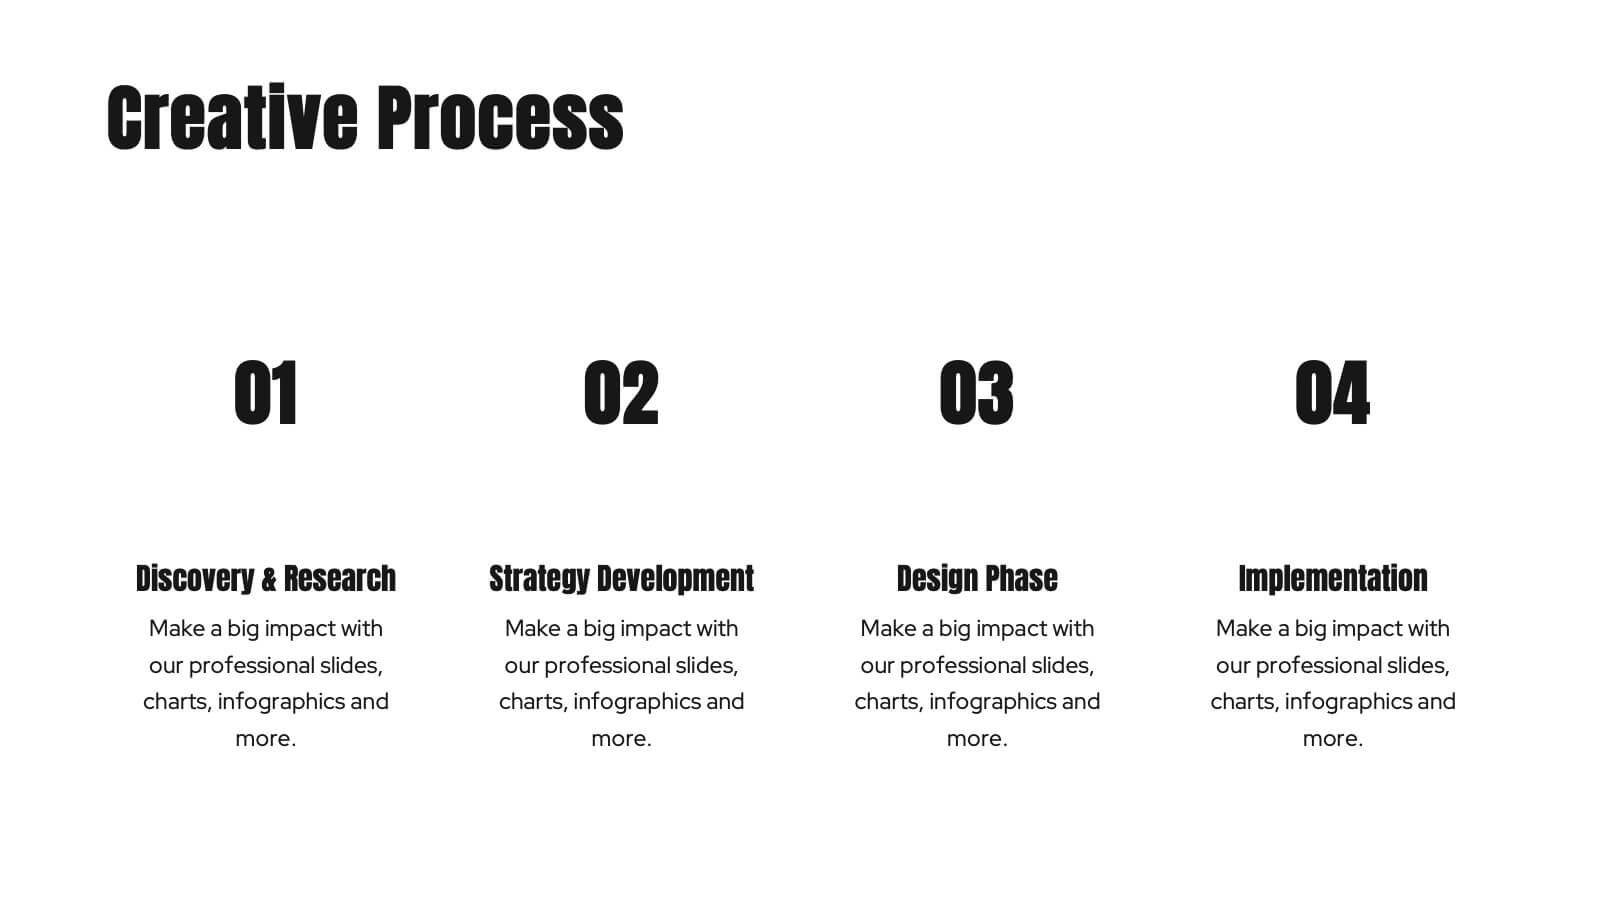
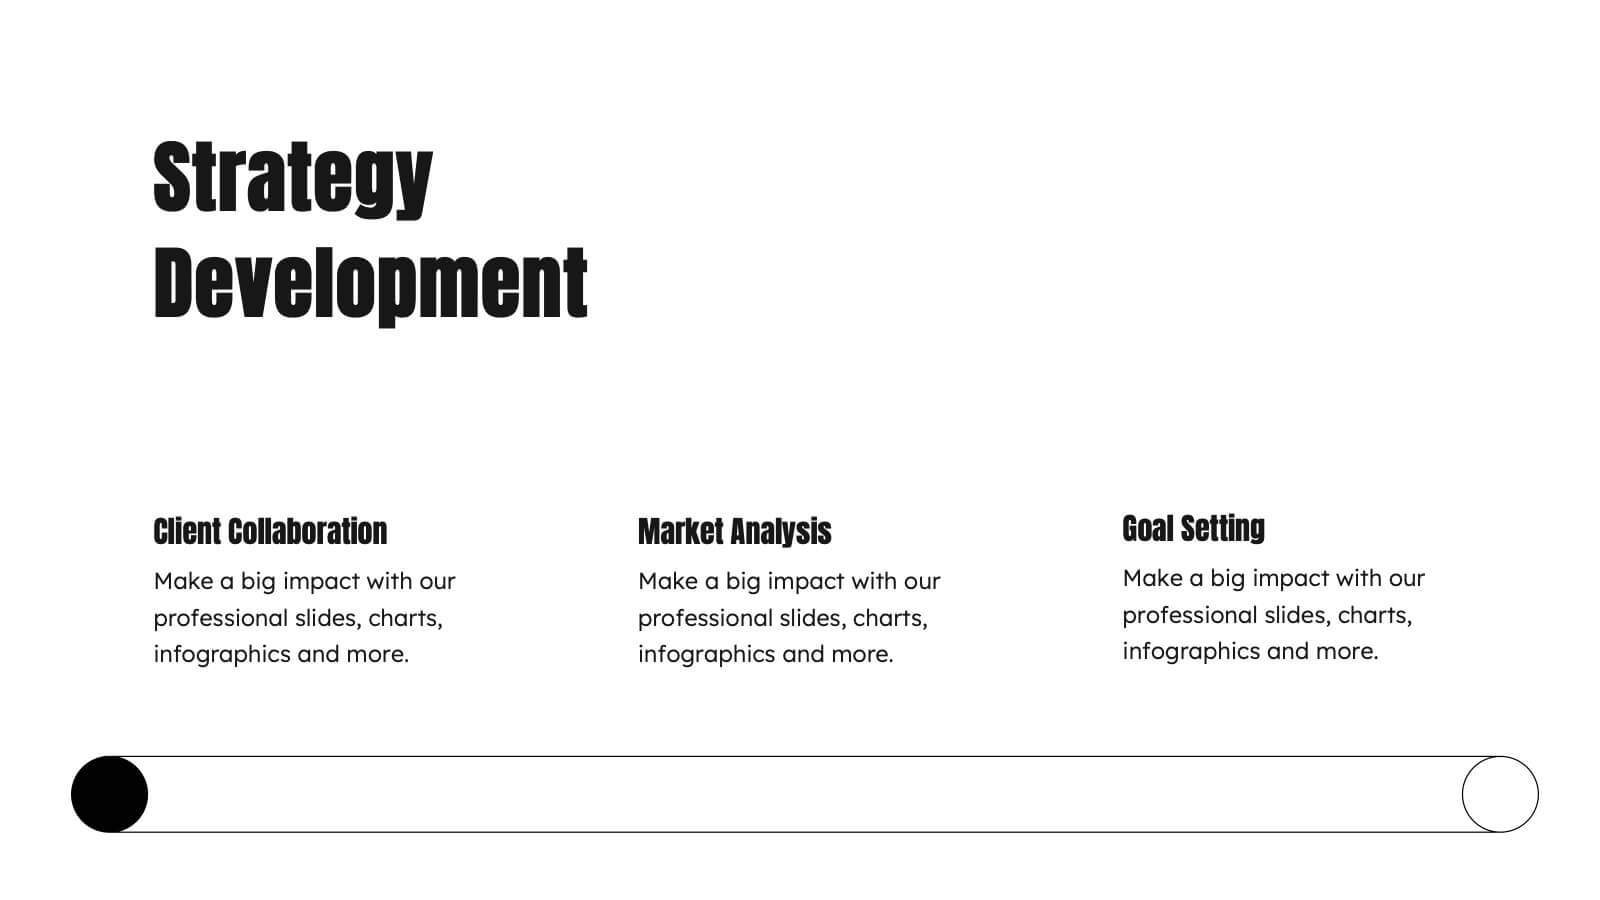
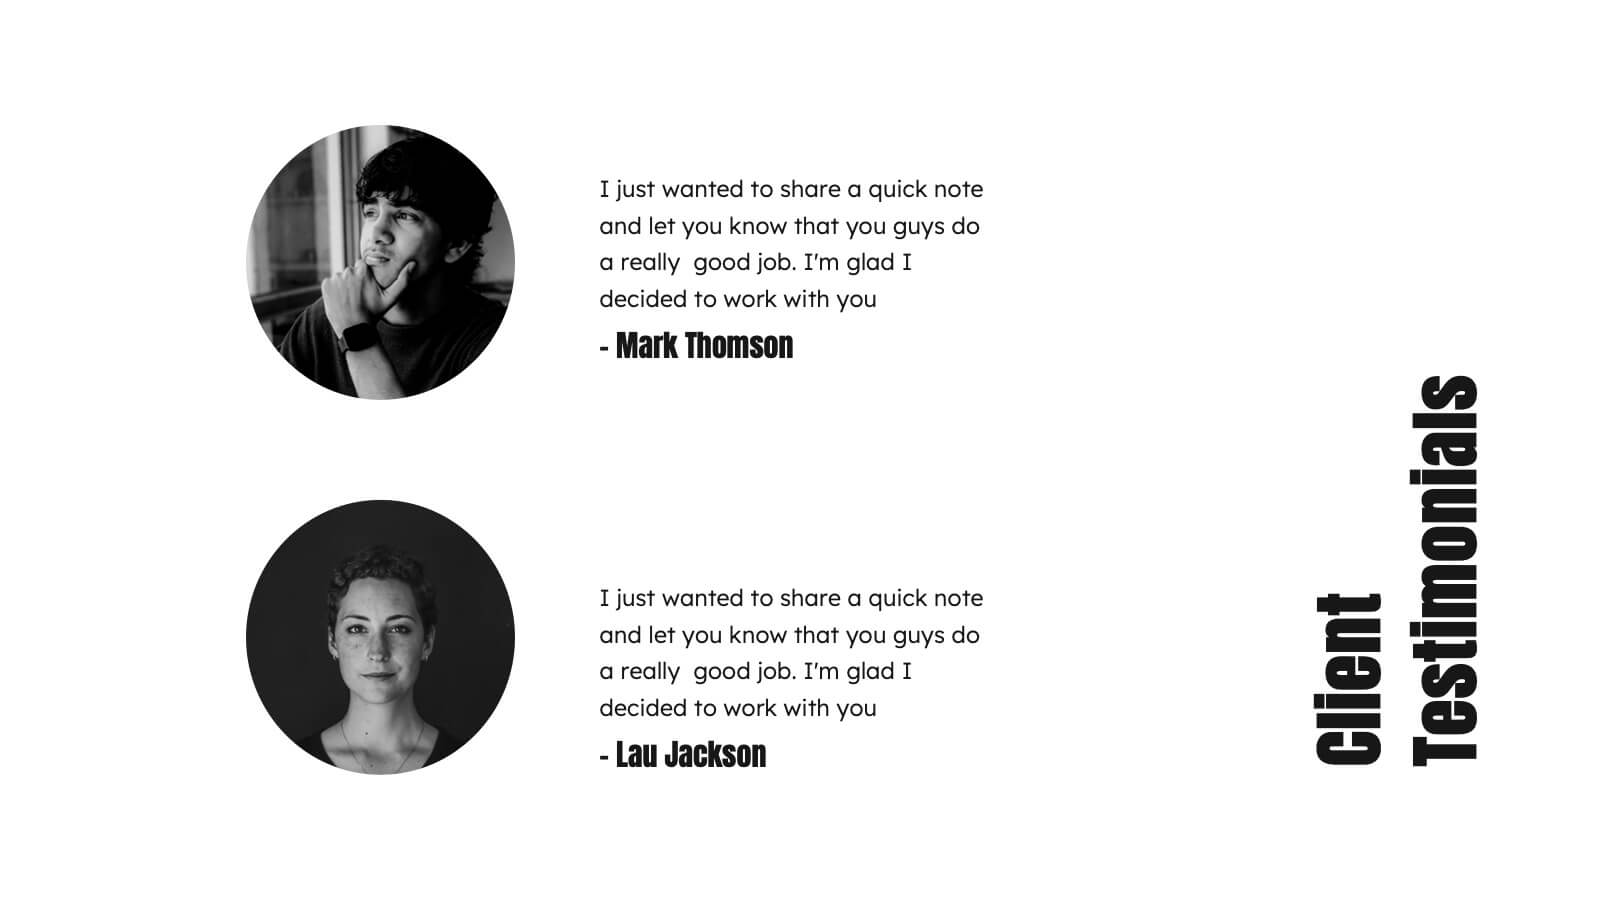
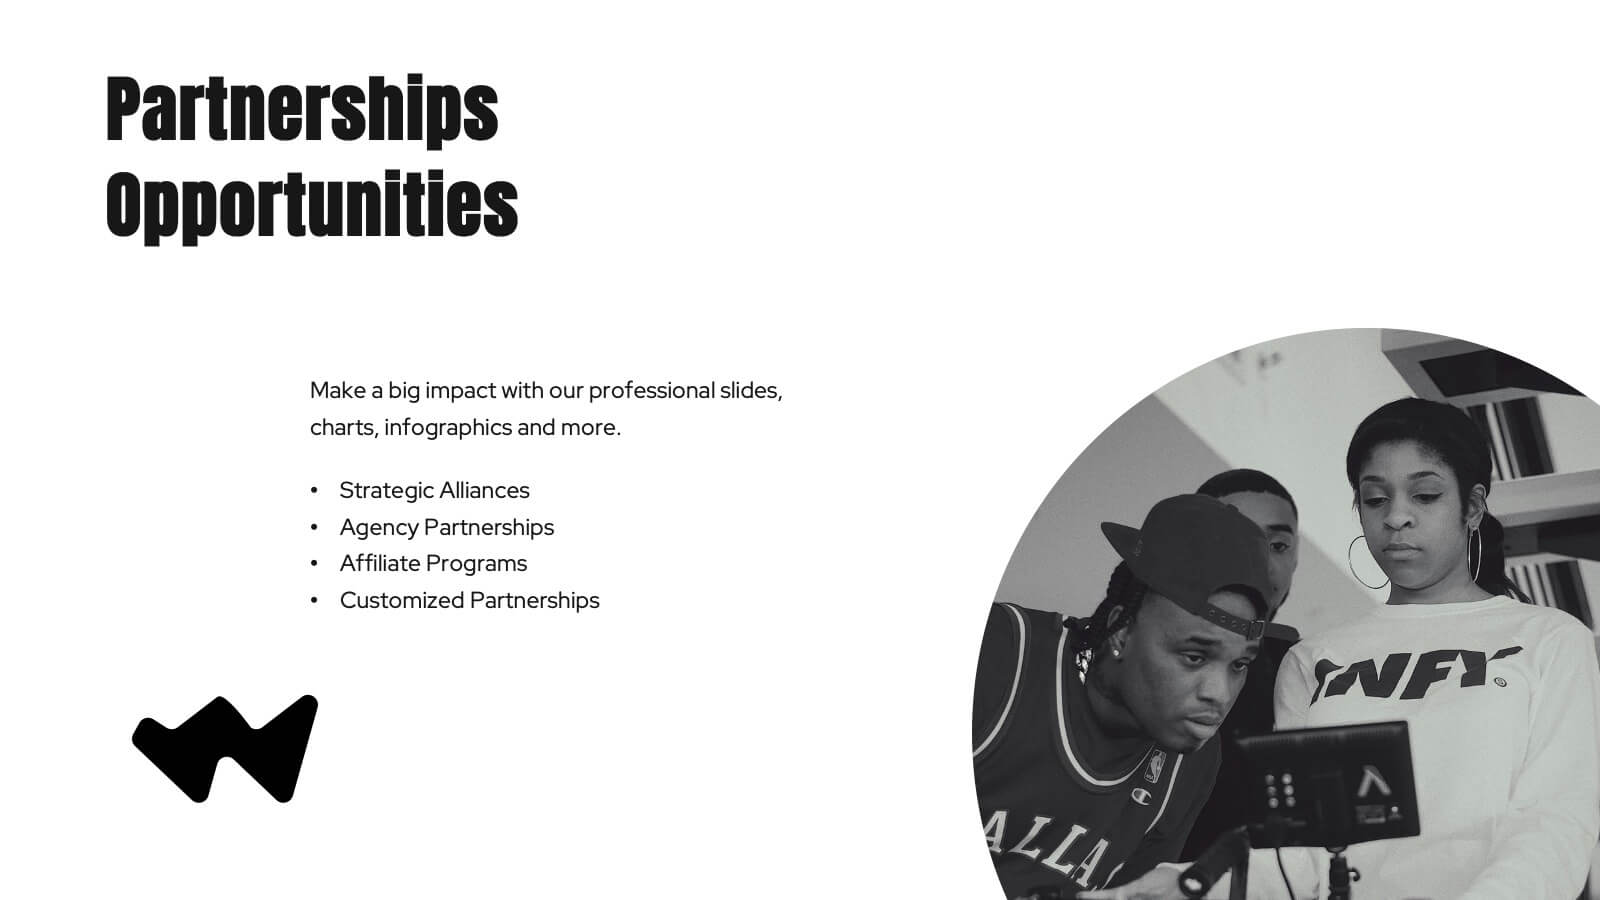
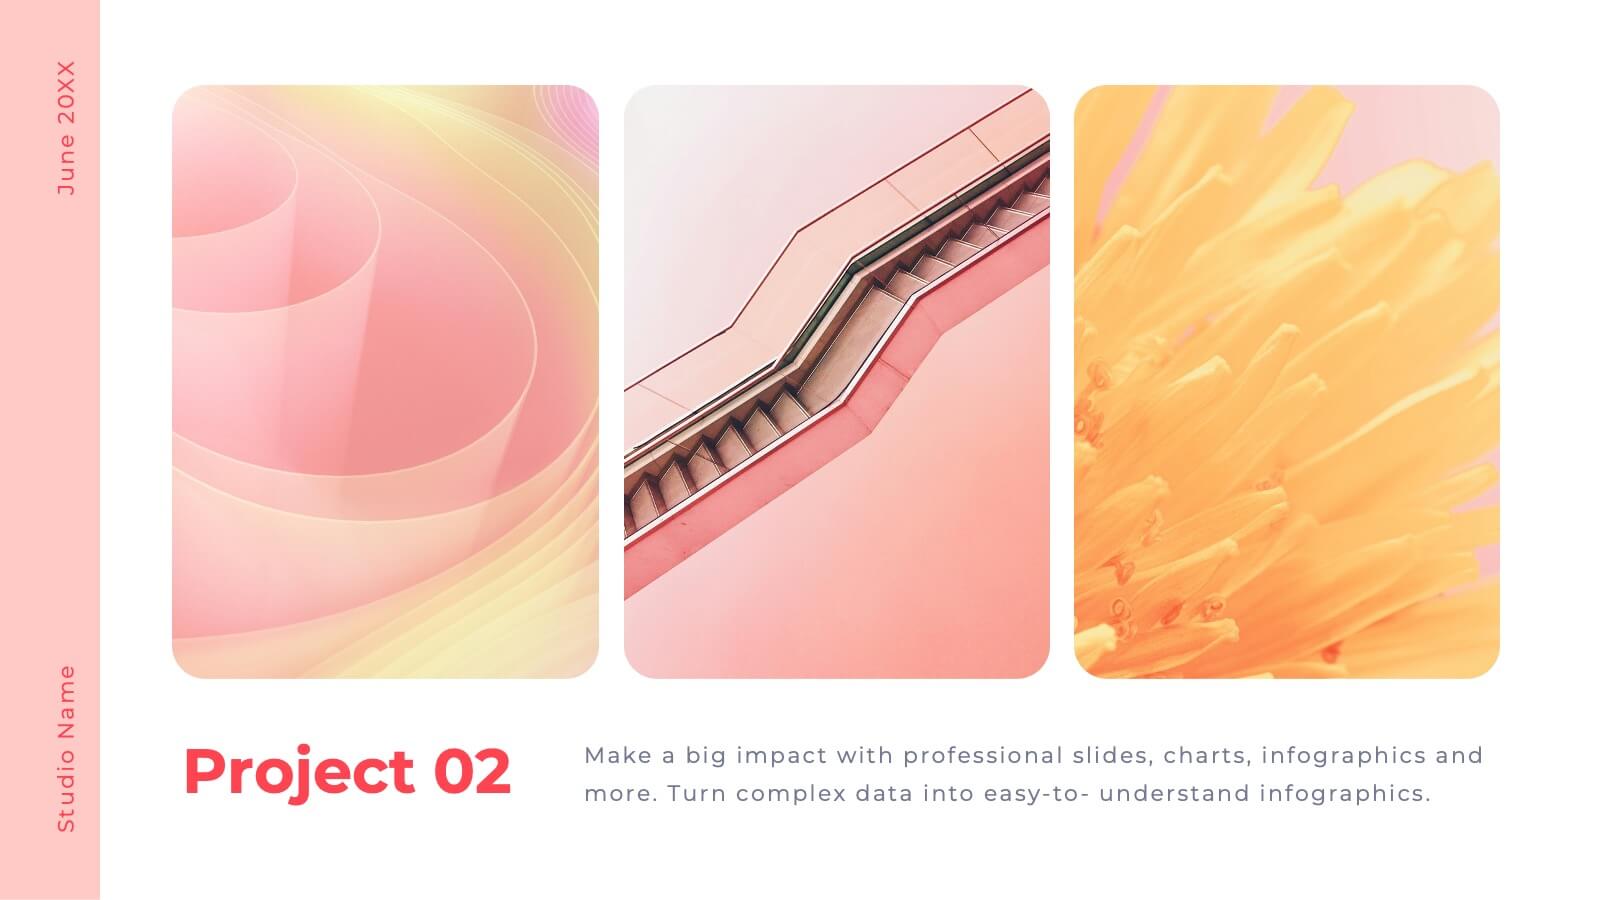
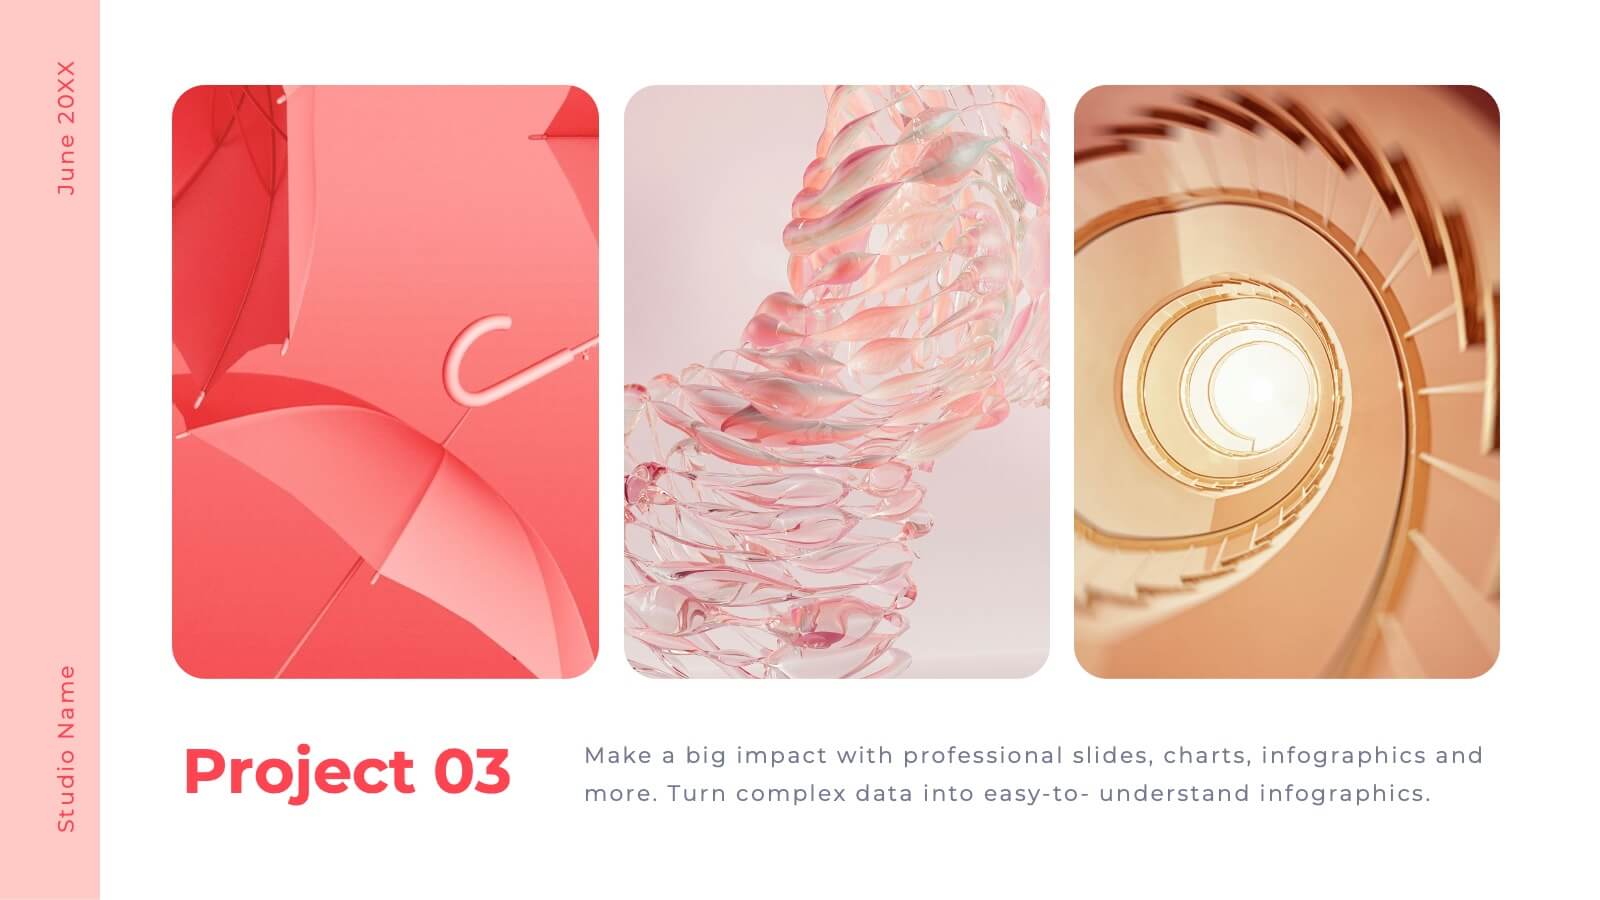
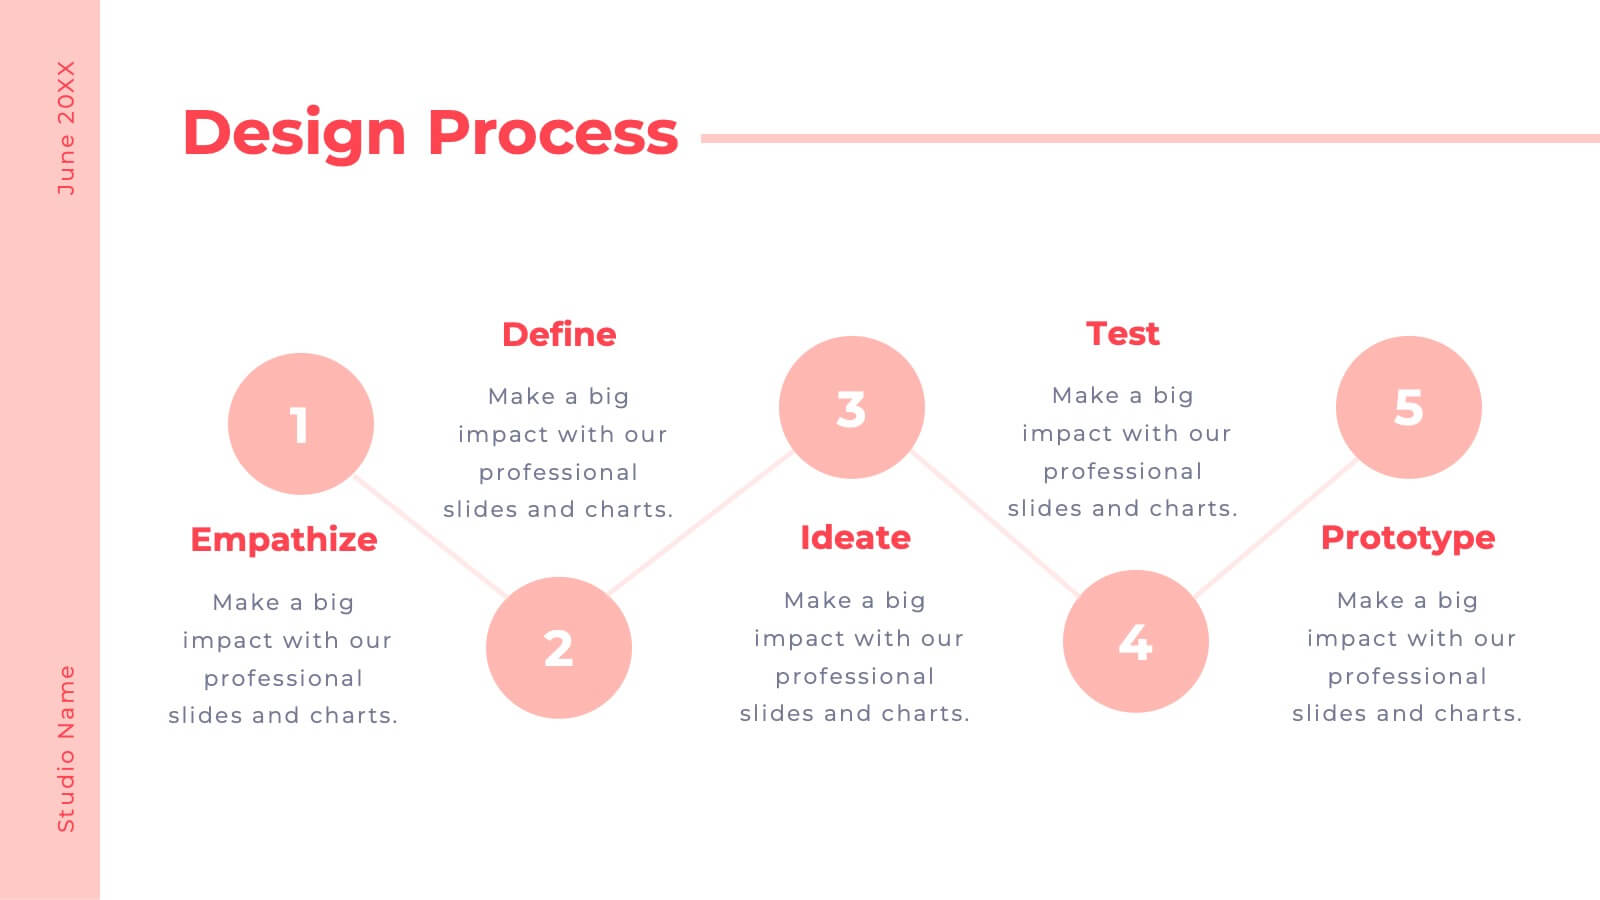
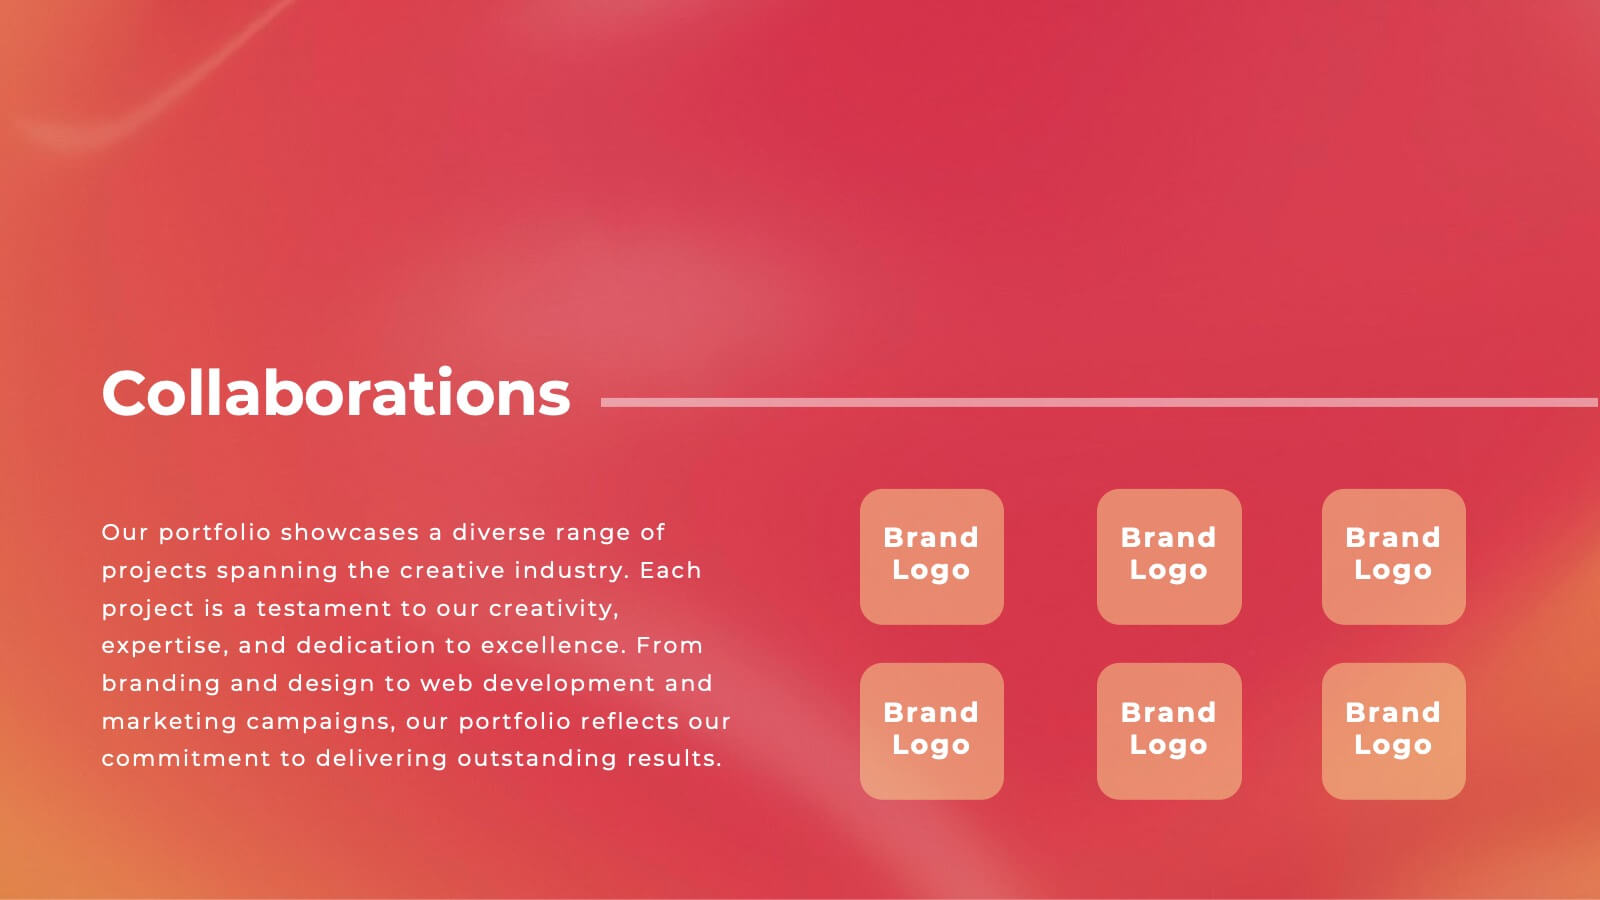
Kraken Agency Portfolio Presentation
This agency portfolio template showcases your agency's work and expertise with a sleek, modern design. It features slides for client success stories, case studies, services, market analysis, and creative process. Perfect for demonstrating your team’s skills and approach. Compatible with PowerPoint, Keynote, and Google Slides for easy customization and presentation.


7 diapositivas
Empathy Map Infographic Presentation Template
An Empathy Map is a collaborative tool organizations can use to gain a deeper insight into their customers. Similar to a user persona, an empathy map can represent a group of users, such as a customer segment. An empathy map helps to map what a design team knows about the potential audience. Use this template to gain a deeper understanding of your target audience. This template comes with many empathy maps you can use to discover how to empathize with your customers. The empathy maps available in this template are designed to give you an avenue into the mind of your target audience.


6 diapositivas
Create Challenge Infographic
Challenges are obstacles, difficulties, or problems that individuals, organizations, or societies face while trying to achieve their goals or navigate through various situations. This infographic template involves visually presenting a specific challenge, its context, and possible solutions in an informative way. Summarize the key takeaways from the infographic, emphasizing the importance of addressing the challenge and implementing the suggested solutions. An effective challenge infographic can be used for educational purposes, presentations, or as a reference guide to help individuals and teams overcome challenges in a structured and informed manner.


7 diapositivas
Aviation Terms Infographic
Take flight with our aviation terms infographic, designed with a serene palette of white, blue, and hints of orange that echo the hues of the sky. This meticulously crafted infographic decodes the intricate jargon of the aviation world, making it a breeze for enthusiasts, trainees, and even seasoned aviators to grasp. Ideal for flight schools, airline training programs, and aviation seminars, this infographic simplifies complex terminologies with ease. With full compatibility across PowerPoint, Keynote, and Google Slides, sharing your knowledge of the skies has never been more accessible or visually appealing.


7 diapositivas
Target Market Segmentation Infographic Presentation
A Target Market refers to a specific group of customers or consumers that a company or organization aims to sell its products or services too. This template has a design that can compliment your company's or organization's branding elements to make it a professional looking presentation. This template is perfect for the audience with in-depth knowledge of marketing; the template allows you to include important facts and statistics that will make it easily understandable by all types of audiences. The template comes with different chart slides, nice color combinations and graphs!


7 diapositivas
Prime Numbers Infographic Presentation
A numbers infographic is a visual representation of information using graphical elements such as charts, graphs, and diagrams. A well-crafted template is a powerful tool for conveying insights into your data. Numbers have the ability to transform your data into useful insights that can help you make an informed decision. This numbers infographics is made with different type of charts and diagrams, which will help you establish a relation between numbers and words. This fully editable template is designed to present numbers, data and statistics in a creative way unique to your brand.


7 diapositivas
Digital Marketing Infographics Presentation Template
Digital marketing is essential for your business and brand awareness. From website design to social media advertising, learn about all the ways digital marketing can help grow your company with this template. Digital marketing can be a powerful and effective way to promote your business.


12 diapositivas
Visual Data Representation Bubble Map Presentation
Present complex data effectively with the Visual Data Representation Bubble Map presentation. This template organizes information into clear, interconnected segments, making it ideal for analytics, business insights, and strategic planning. Compatible with PowerPoint, Keynote, and Google Slides.


5 diapositivas
Business Planning and Execution Presentation
Align your business objectives and execution plan with this modern, arrow-themed presentation slide. Featuring four sequential sections with bold icons and customizable titles, this layout is perfect for showcasing milestones, KPIs, or phases of a strategic process. Designed for clarity and impact, it's compatible with PowerPoint, Keynote, and Google Slides.


8 diapositivas
Classroom Activities and Lesson Plans Presentation
Plan and organize your curriculum with the Classroom Activities and Lesson Plans Diagram. This structured template is perfect for teachers, educators, and school administrators to visually map out lesson plans, activities, and schedules. Designed to enhance clarity and efficiency, it provides a structured framework for seamless educational planning. Fully customizable and compatible with PowerPoint, Keynote, and Google Slides.


4 diapositivas
Surface vs Depth Model Iceberg Presentation
Uncover the unseen with this Surface vs Depth Model Iceberg presentation. Designed to highlight the contrast between visible factors (15%) and underlying elements (85%), this layout is ideal for business analysis, user behavior, or strategic planning. Fully editable in Canva, PowerPoint, and Google Slides for seamless customization.


5 diapositivas
Empathy to Ideation Process Framework Presentation
Visualize the journey from understanding user needs to generating innovative ideas with the Empathy to Ideation Process Framework Presentation. This slide features a side-profile silhouette and five clear, horizontal stages, each representing a key step in design thinking. Ideal for innovation workshops, UX strategy sessions, or educational use. Fully editable in Canva, PowerPoint, Google Slides, and Keynote.


20 diapositivas
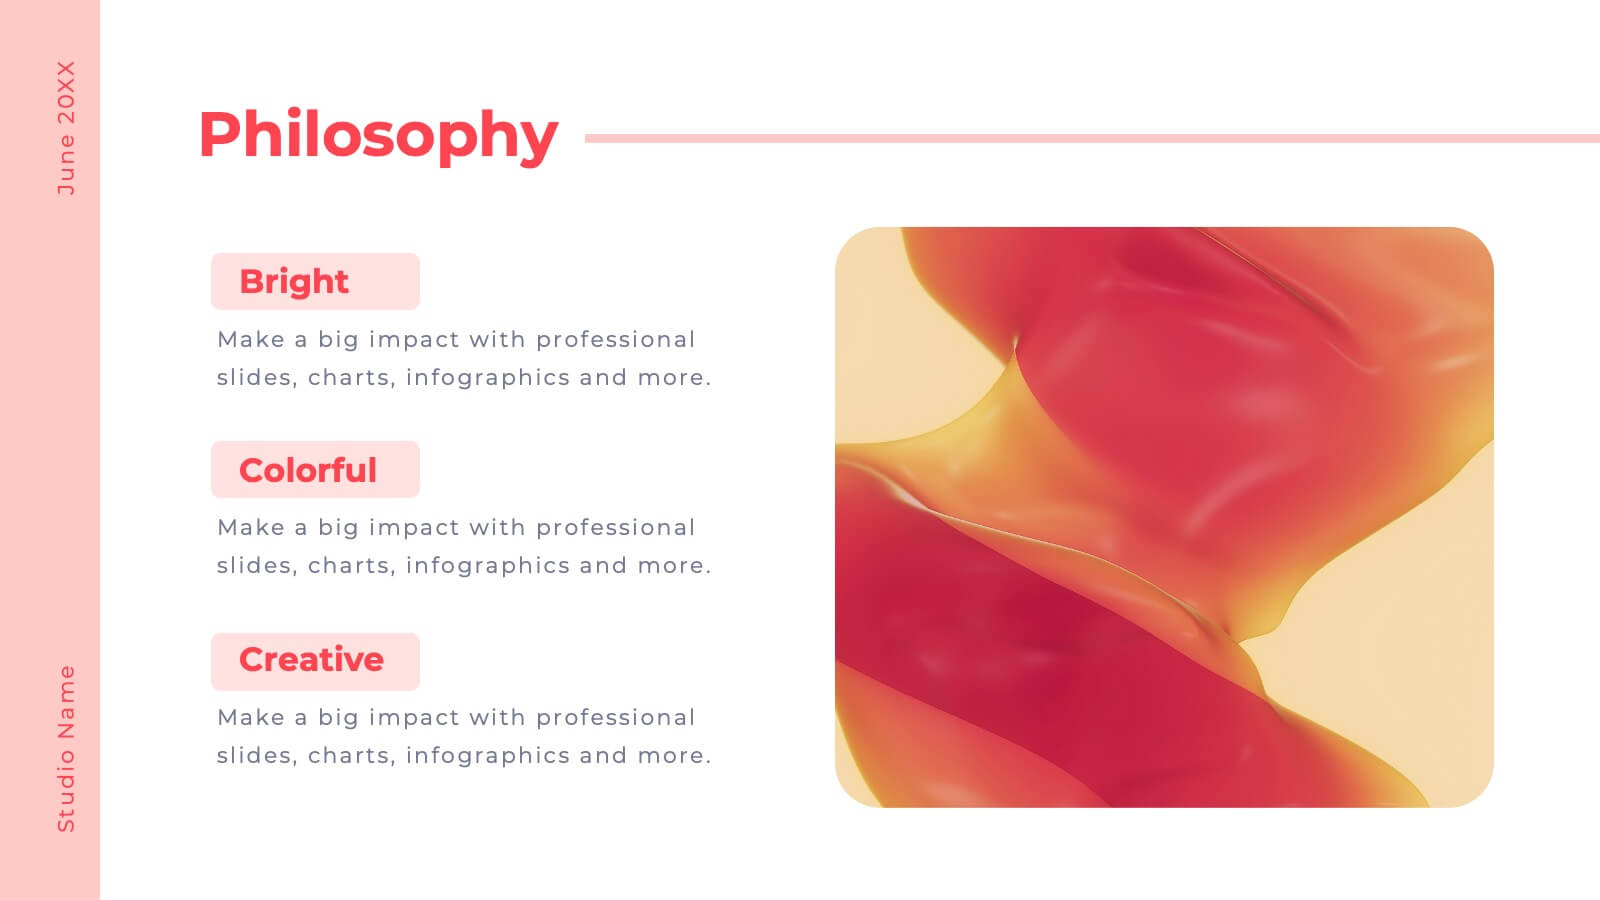
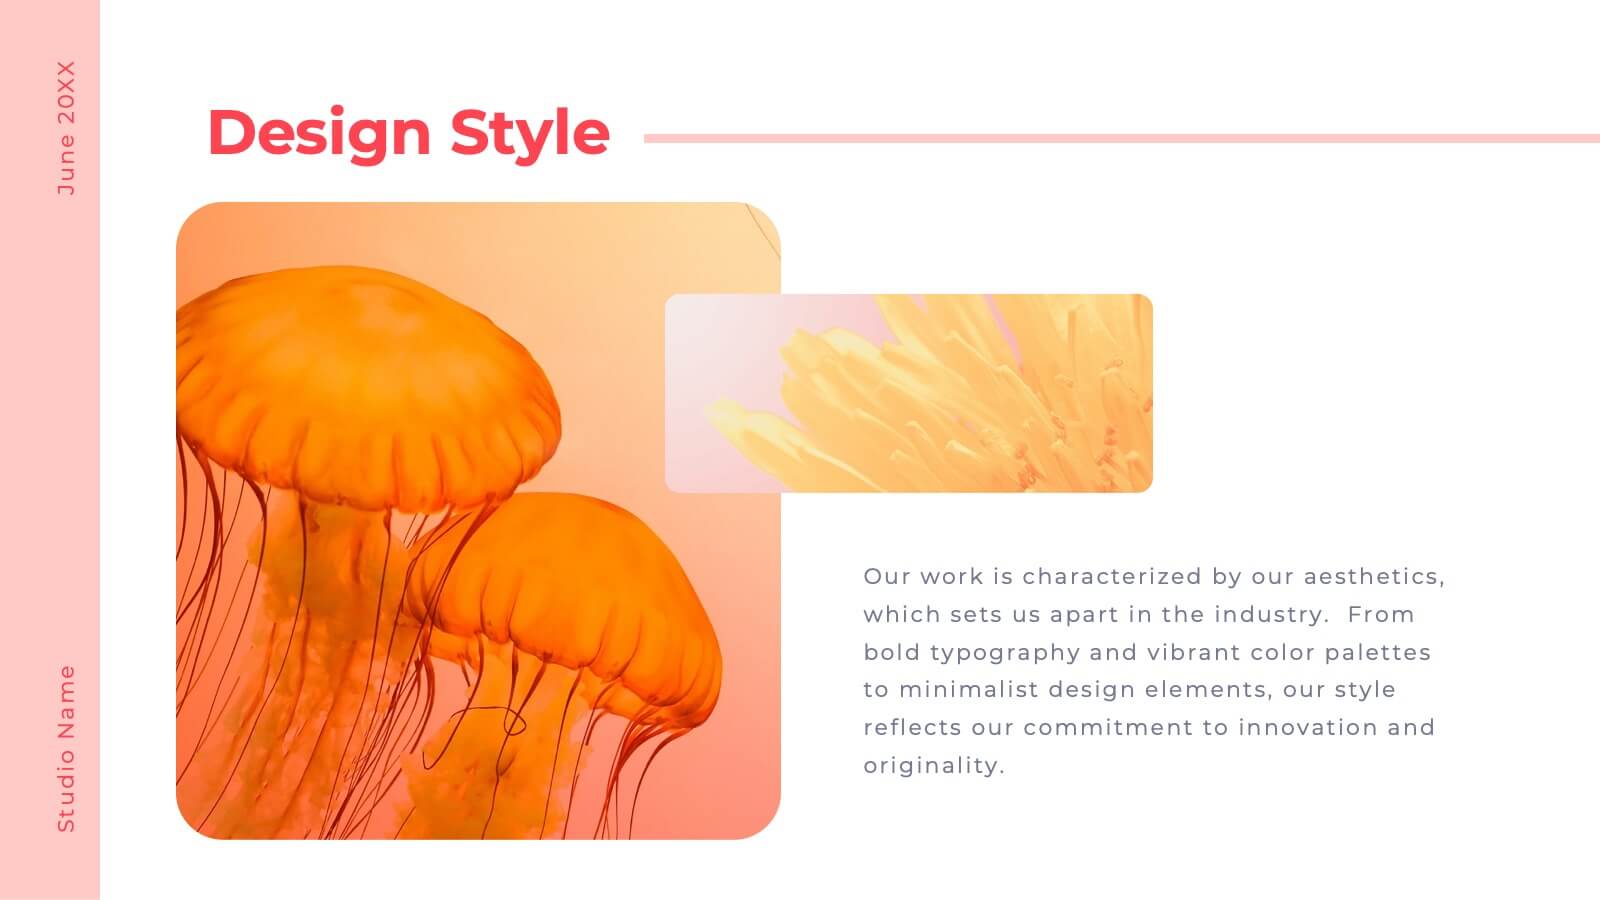
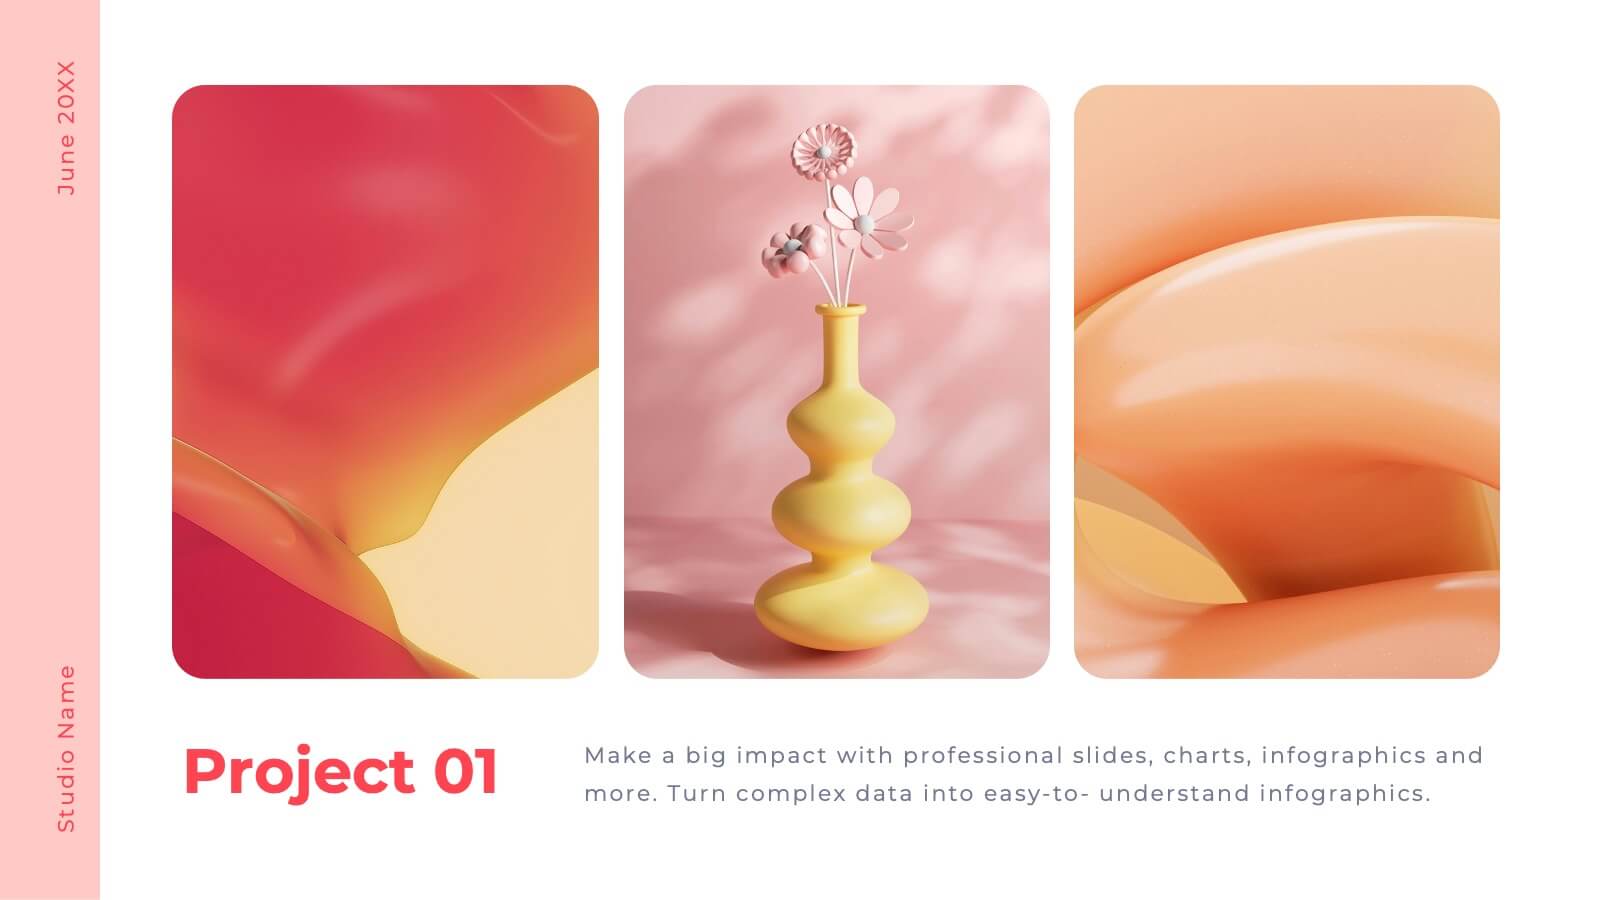
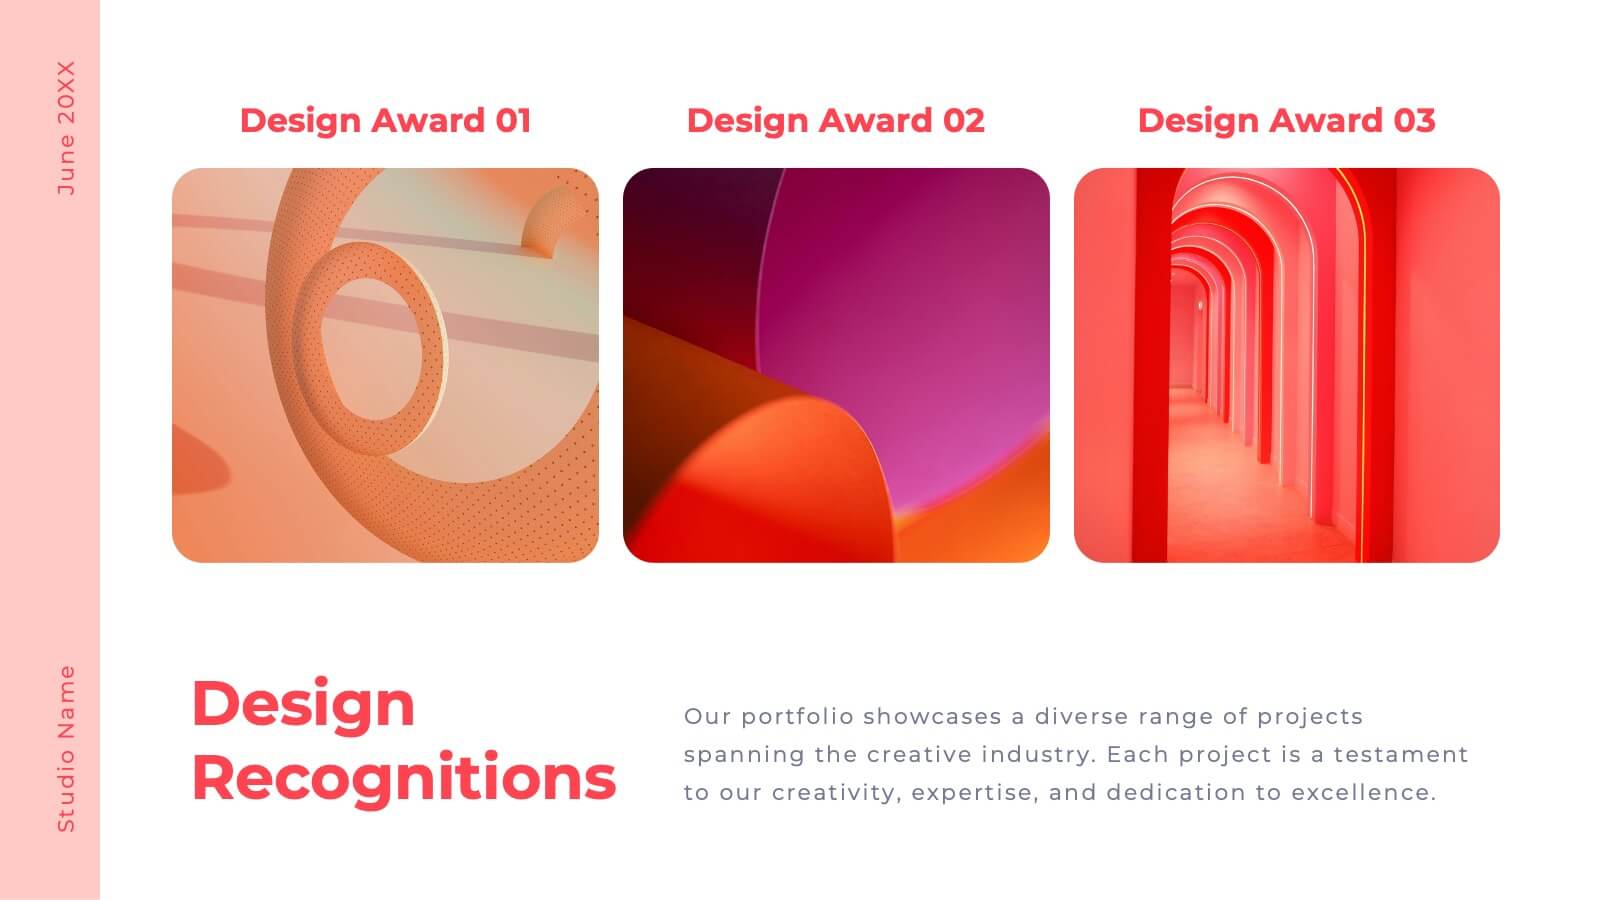
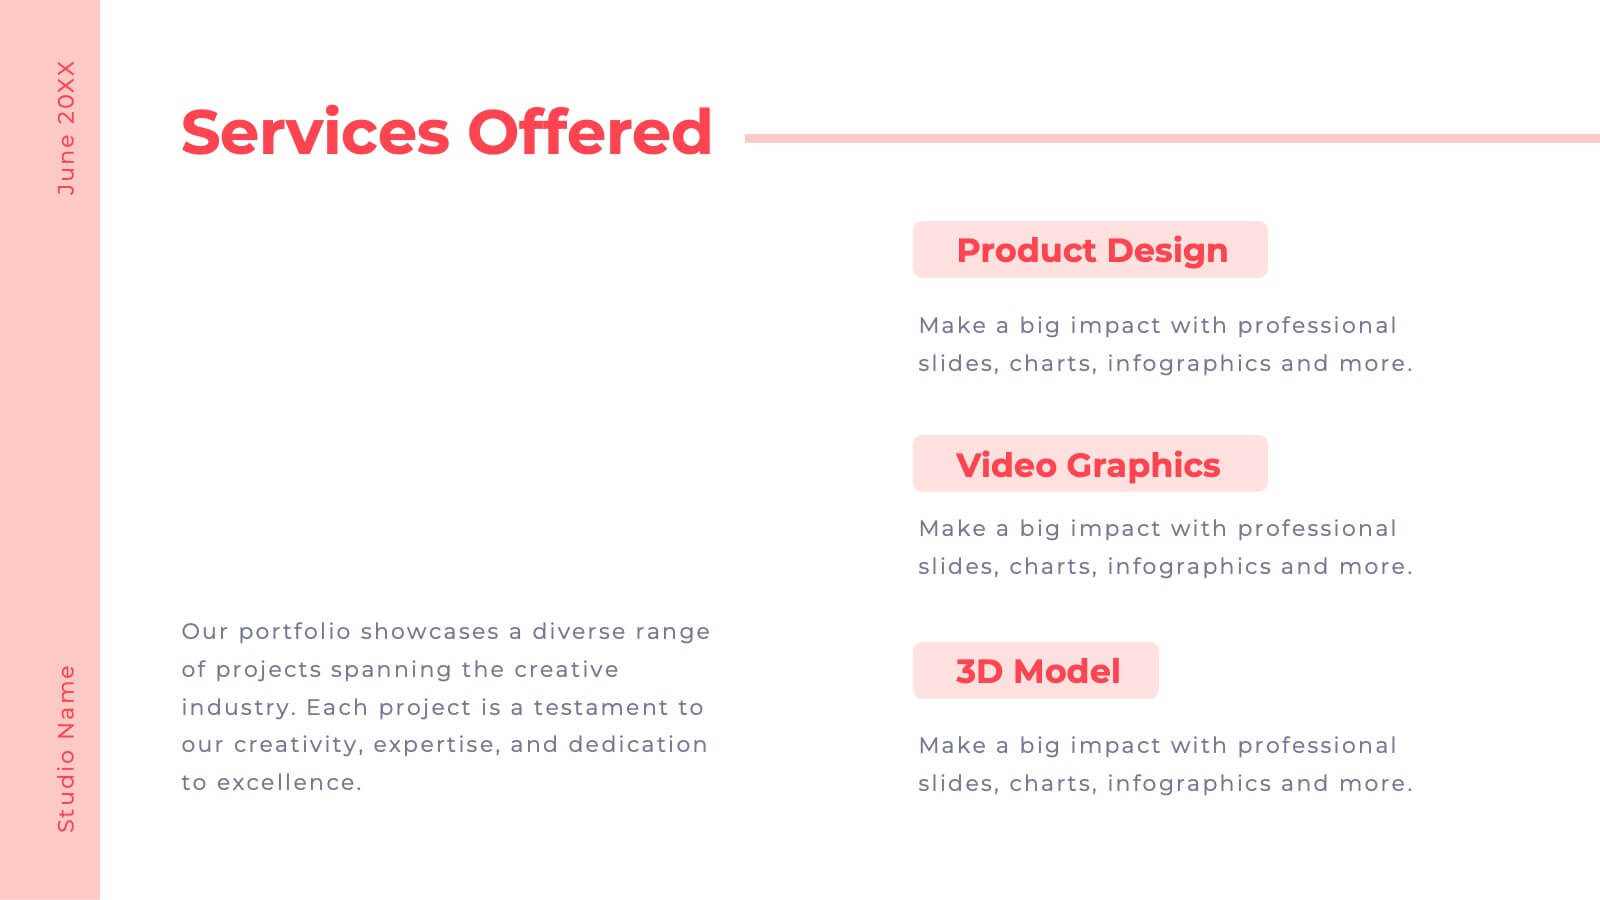
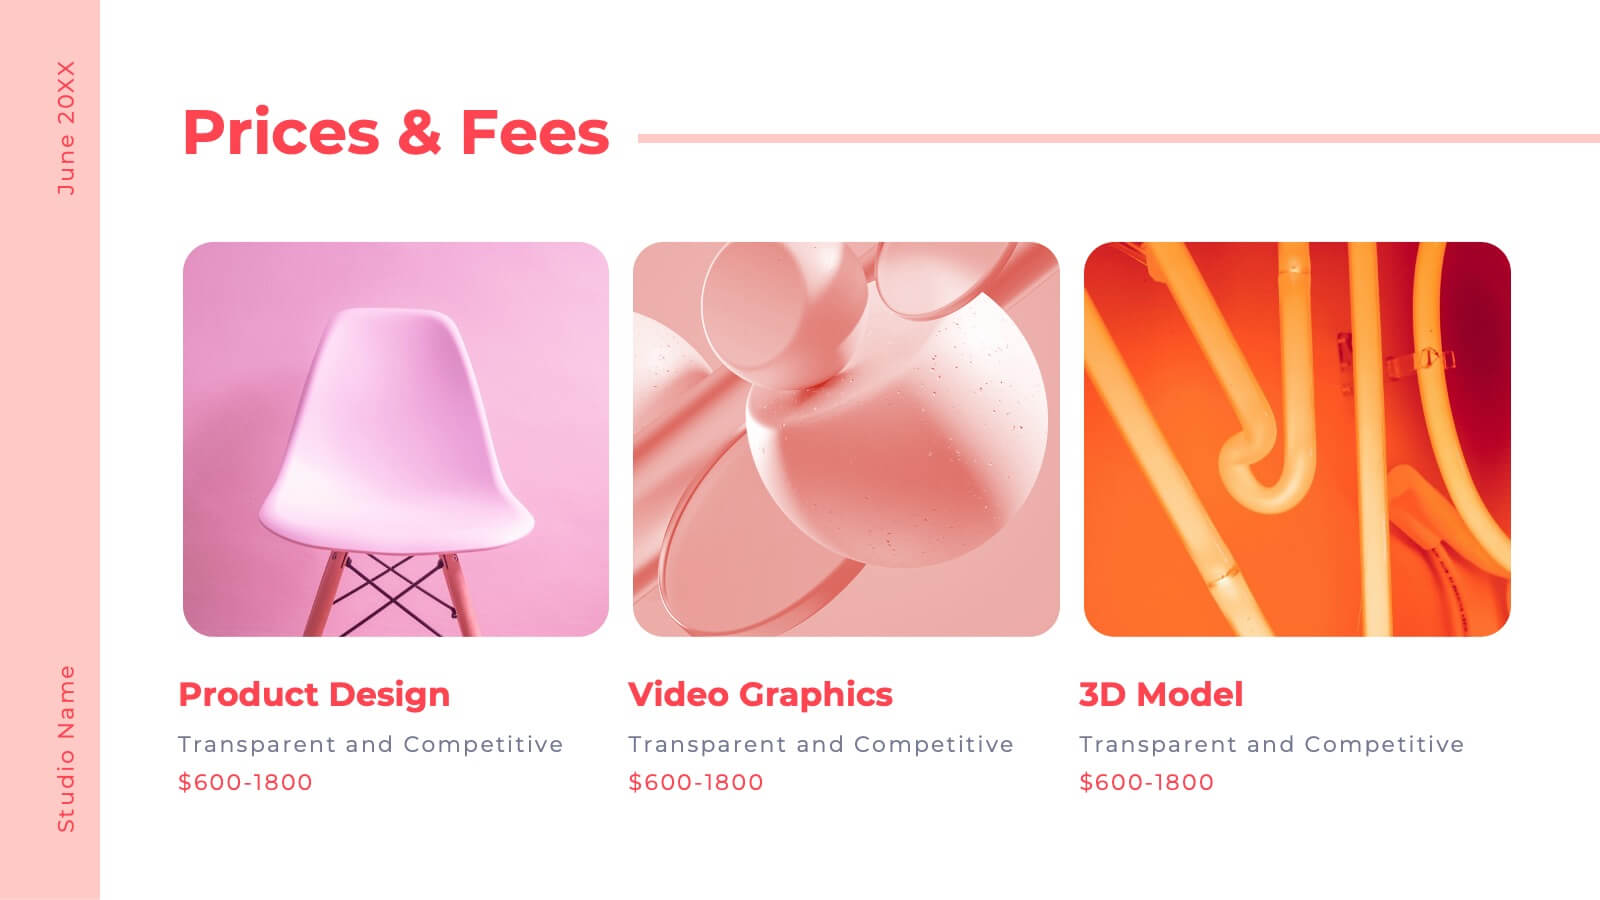
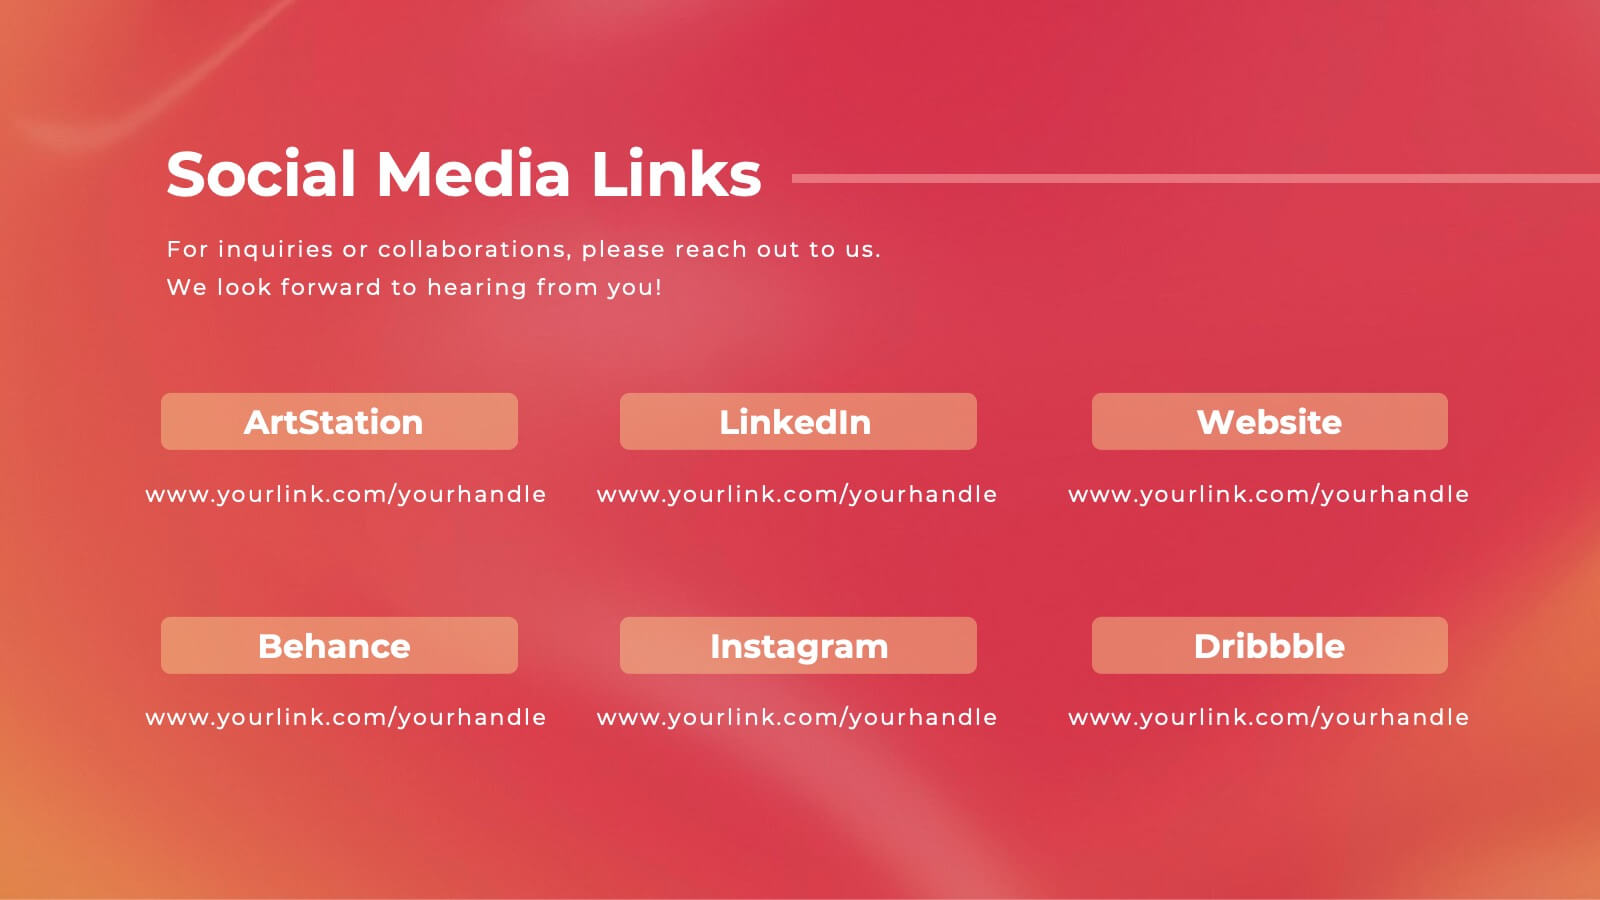
Valor Creative Portfolio Presentation
Step into creativity with this stunning portfolio template! Showcase your projects, design philosophy, and client testimonials with style and flair. Ideal for designers, artists, and creatives wanting to impress. Compatible with PowerPoint, Keynote, and Google Slides, this template elevates every portfolio to new heights. Perfect for making a lasting impact.


4 diapositivas
Business Planning Framework Presentation
Turn big ideas into actionable strategies with this modern and structured presentation layout. Perfect for mapping goals, aligning priorities, and showcasing step-by-step planning processes, it helps you communicate strategy with clarity and confidence. Fully editable and compatible with PowerPoint, Keynote, and Google Slides for easy customization and professional results.


7 diapositivas
Business Plan Process Infographic
Unveil the roadmap to entrepreneurial success with our business plan process infographic. This simple and streamlined infographic encapsulates the quintessential steps to draft a robust business plan, guiding entrepreneurs and business professionals on their journey to creating a successful enterprise. This infographic is an indispensable tool for budding entrepreneurs, business consultants, educators, and anyone looking to gain insights into the formulation of a business plan. Designed for seamless integration with PowerPoint, Keynote, or Google Slides, this template promises a presentation that is both engaging and educative.