


Características


¿Tienes alguna pregunta?
Recomendar


4 diapositivas
Business Partnership Development Presentation
Showcase key elements of collaboration with the Business Partnership Development Presentation. This quadrant-style layout is perfect for outlining strategies, stakeholders, or phases of a partnership. Ideal for business proposals, joint ventures, and strategic planning decks. Fully editable in PowerPoint, Keynote, and Google Slides.


4 diapositivas
Event Planning and Calendar Timeline Presentation
Plan smarter, not harder! This sleek timeline infographic is perfect for keeping your event plans organized and on track. Whether you're managing a multi-day conference or a team schedule, this visual template makes deadlines and tasks crystal clear. Fully compatible with PowerPoint, Keynote, and Google Slides for seamless editing and presentation.


7 diapositivas
Sports Illustrated Infographic Presentation
Sports are an important aspect of our lives that provide numerous physical, mental, social, and personal benefits. This sports infographic is designed to help you create an awesome visual content using all sorts of colorful images, charts and graphs that best describe your sports related project. This template is perfect if you need to share statistics and facts about sports. It contains 7 slides with colorful backgrounds, sport visualizations and an area for you to input your important data. This template is compatible with Powerpoint, keynote and google slides, perfect for your next project!


34 diapositivas
Incubator Pitch Deck
An Incubator Pitch Deck is used by startups or entrepreneurs to pitch their business idea to an incubator or accelerator program, which are organizations that provide support, resources, and mentorship to early-stage startups to help them grow and succeed. This incubator pitch deck template is specifically tailored to the needs and requirements of the incubator or accelerator program. This template is designed with a professional and striking blue color palette, that adds a sense of sophistication and professionalism to your presentation. It also features a range of customizable slides that are specifically tailored for pitch presentations.


2 diapositivas
Professional Closing Thank You
End your presentation with clarity and professionalism using this bold yet minimalist "Thank You" slide. Designed with modern aesthetics and contact detail placeholders, it’s ideal for business reports, marketing decks, and corporate pitches. Fully customizable in PowerPoint, Keynote, and Google Slides.


5 diapositivas
SWOT Analysis Framework Presentation
The "SWOT Analysis Framework Presentation" template is strategically designed to help businesses and teams visually map out their Strengths, Weaknesses, Opportunities, and Threats. Each quadrant of the SWOT analysis is distinctly colored to facilitate quick recognition and understanding, enabling teams to efficiently analyze their internal and external environments. This template is versatile, suitable for a variety of industries and settings, from corporate strategic planning sessions to educational business courses. It aids in clearly identifying key factors that could influence future business decisions and strategies, making it an essential tool for any organization aiming to enhance its strategic planning process.


4 diapositivas
Workplace Collaboration and Team Scenes Presentation
Bring your teamwork story to life with this vibrant, arrow-based layout that guides the viewer through four clear steps. Perfect for visualizing collaboration strategies, team roles, or task flow, this template balances clean design with helpful icons. Easily customize it in PowerPoint, Keynote, or Google Slides for a polished presentation.


7 diapositivas
Development Team Infographic
The showcased slides are meticulously designed for development teams, aiming to present key project details, timelines, and development processes effectively. The templates utilize a mixture of sleek designs and intuitive layouts that help visualize the complexities of software development and project management. The selection includes various infographic styles that cater to different informational needs such as workflow diagrams, progress timelines, and team structures.These templates are essential for development teams to communicate their strategies, milestones, and team roles clearly. They allow for the integration of technical data in a user-friendly manner, which can be crucial during stakeholder presentations or team meetings. With options ranging from minimalistic to data-rich layouts, these slides support detailed reporting and strategic planning, ensuring that every member of the team and stakeholders are on the same page regarding the project’s progression and objectives. The use of modern graphics and customizable elements also ensures that these presentations can be adapted to match the branding and aesthetic of different companies.


20 diapositivas
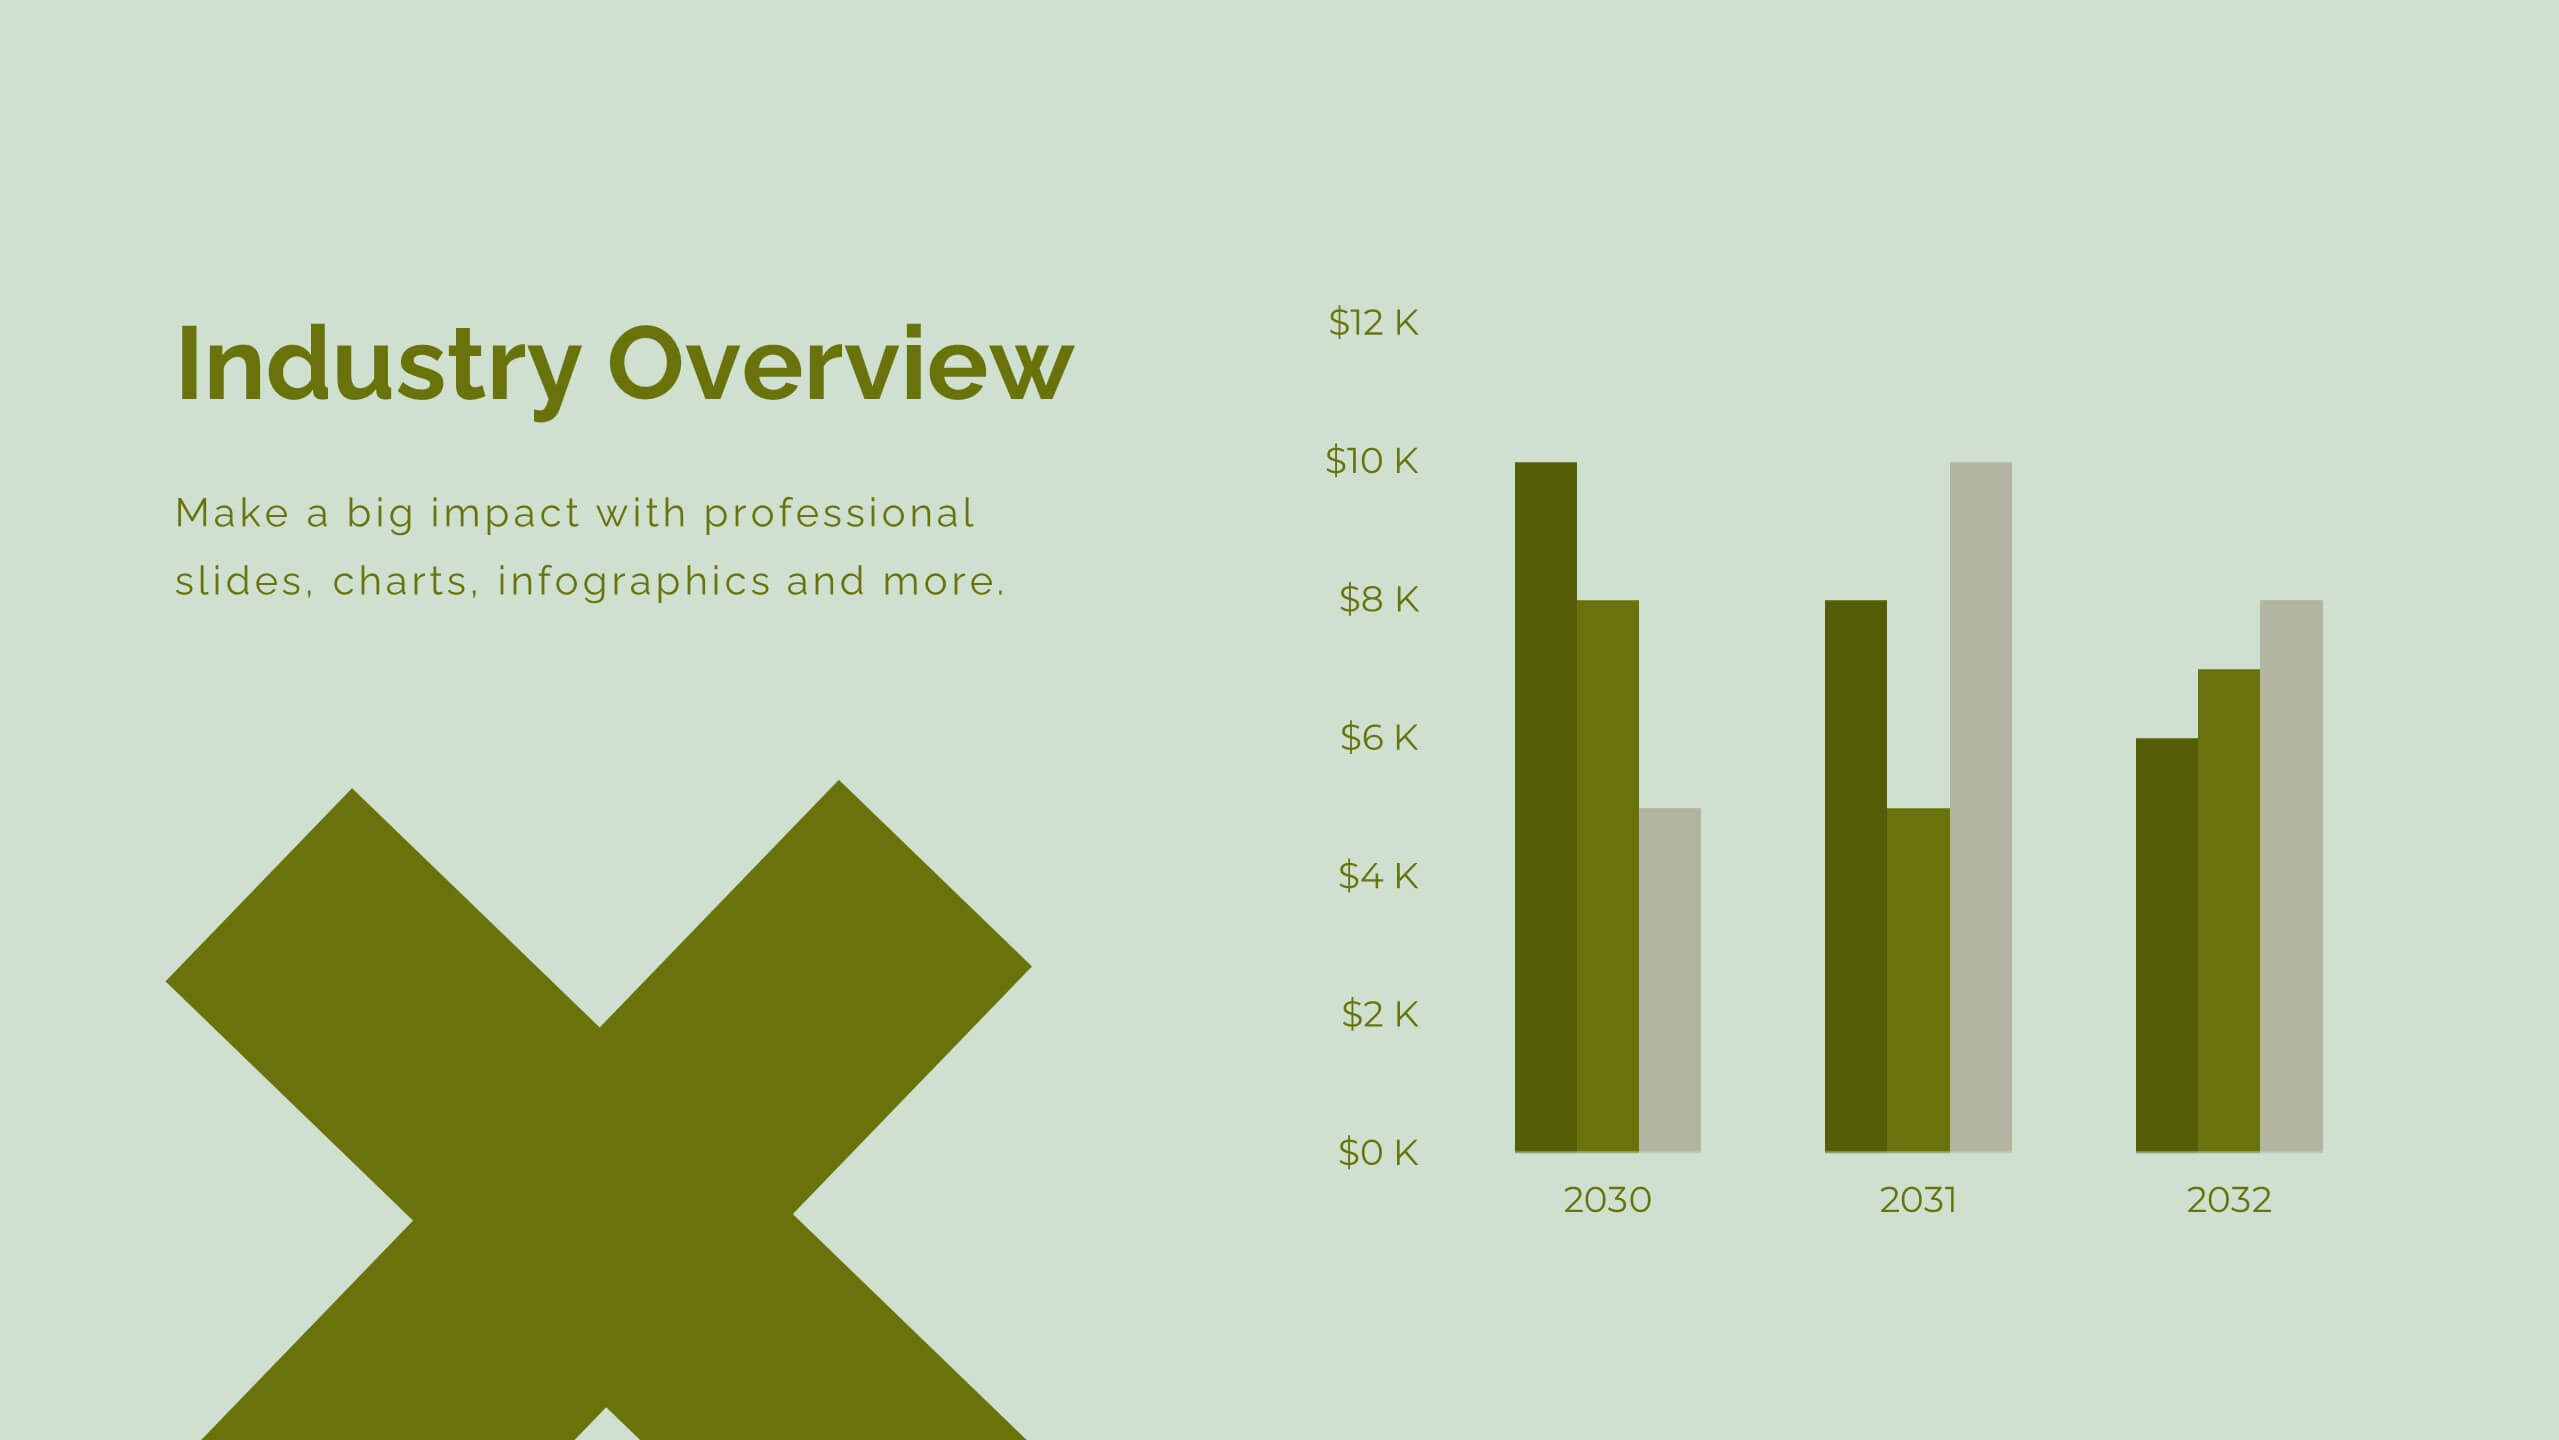
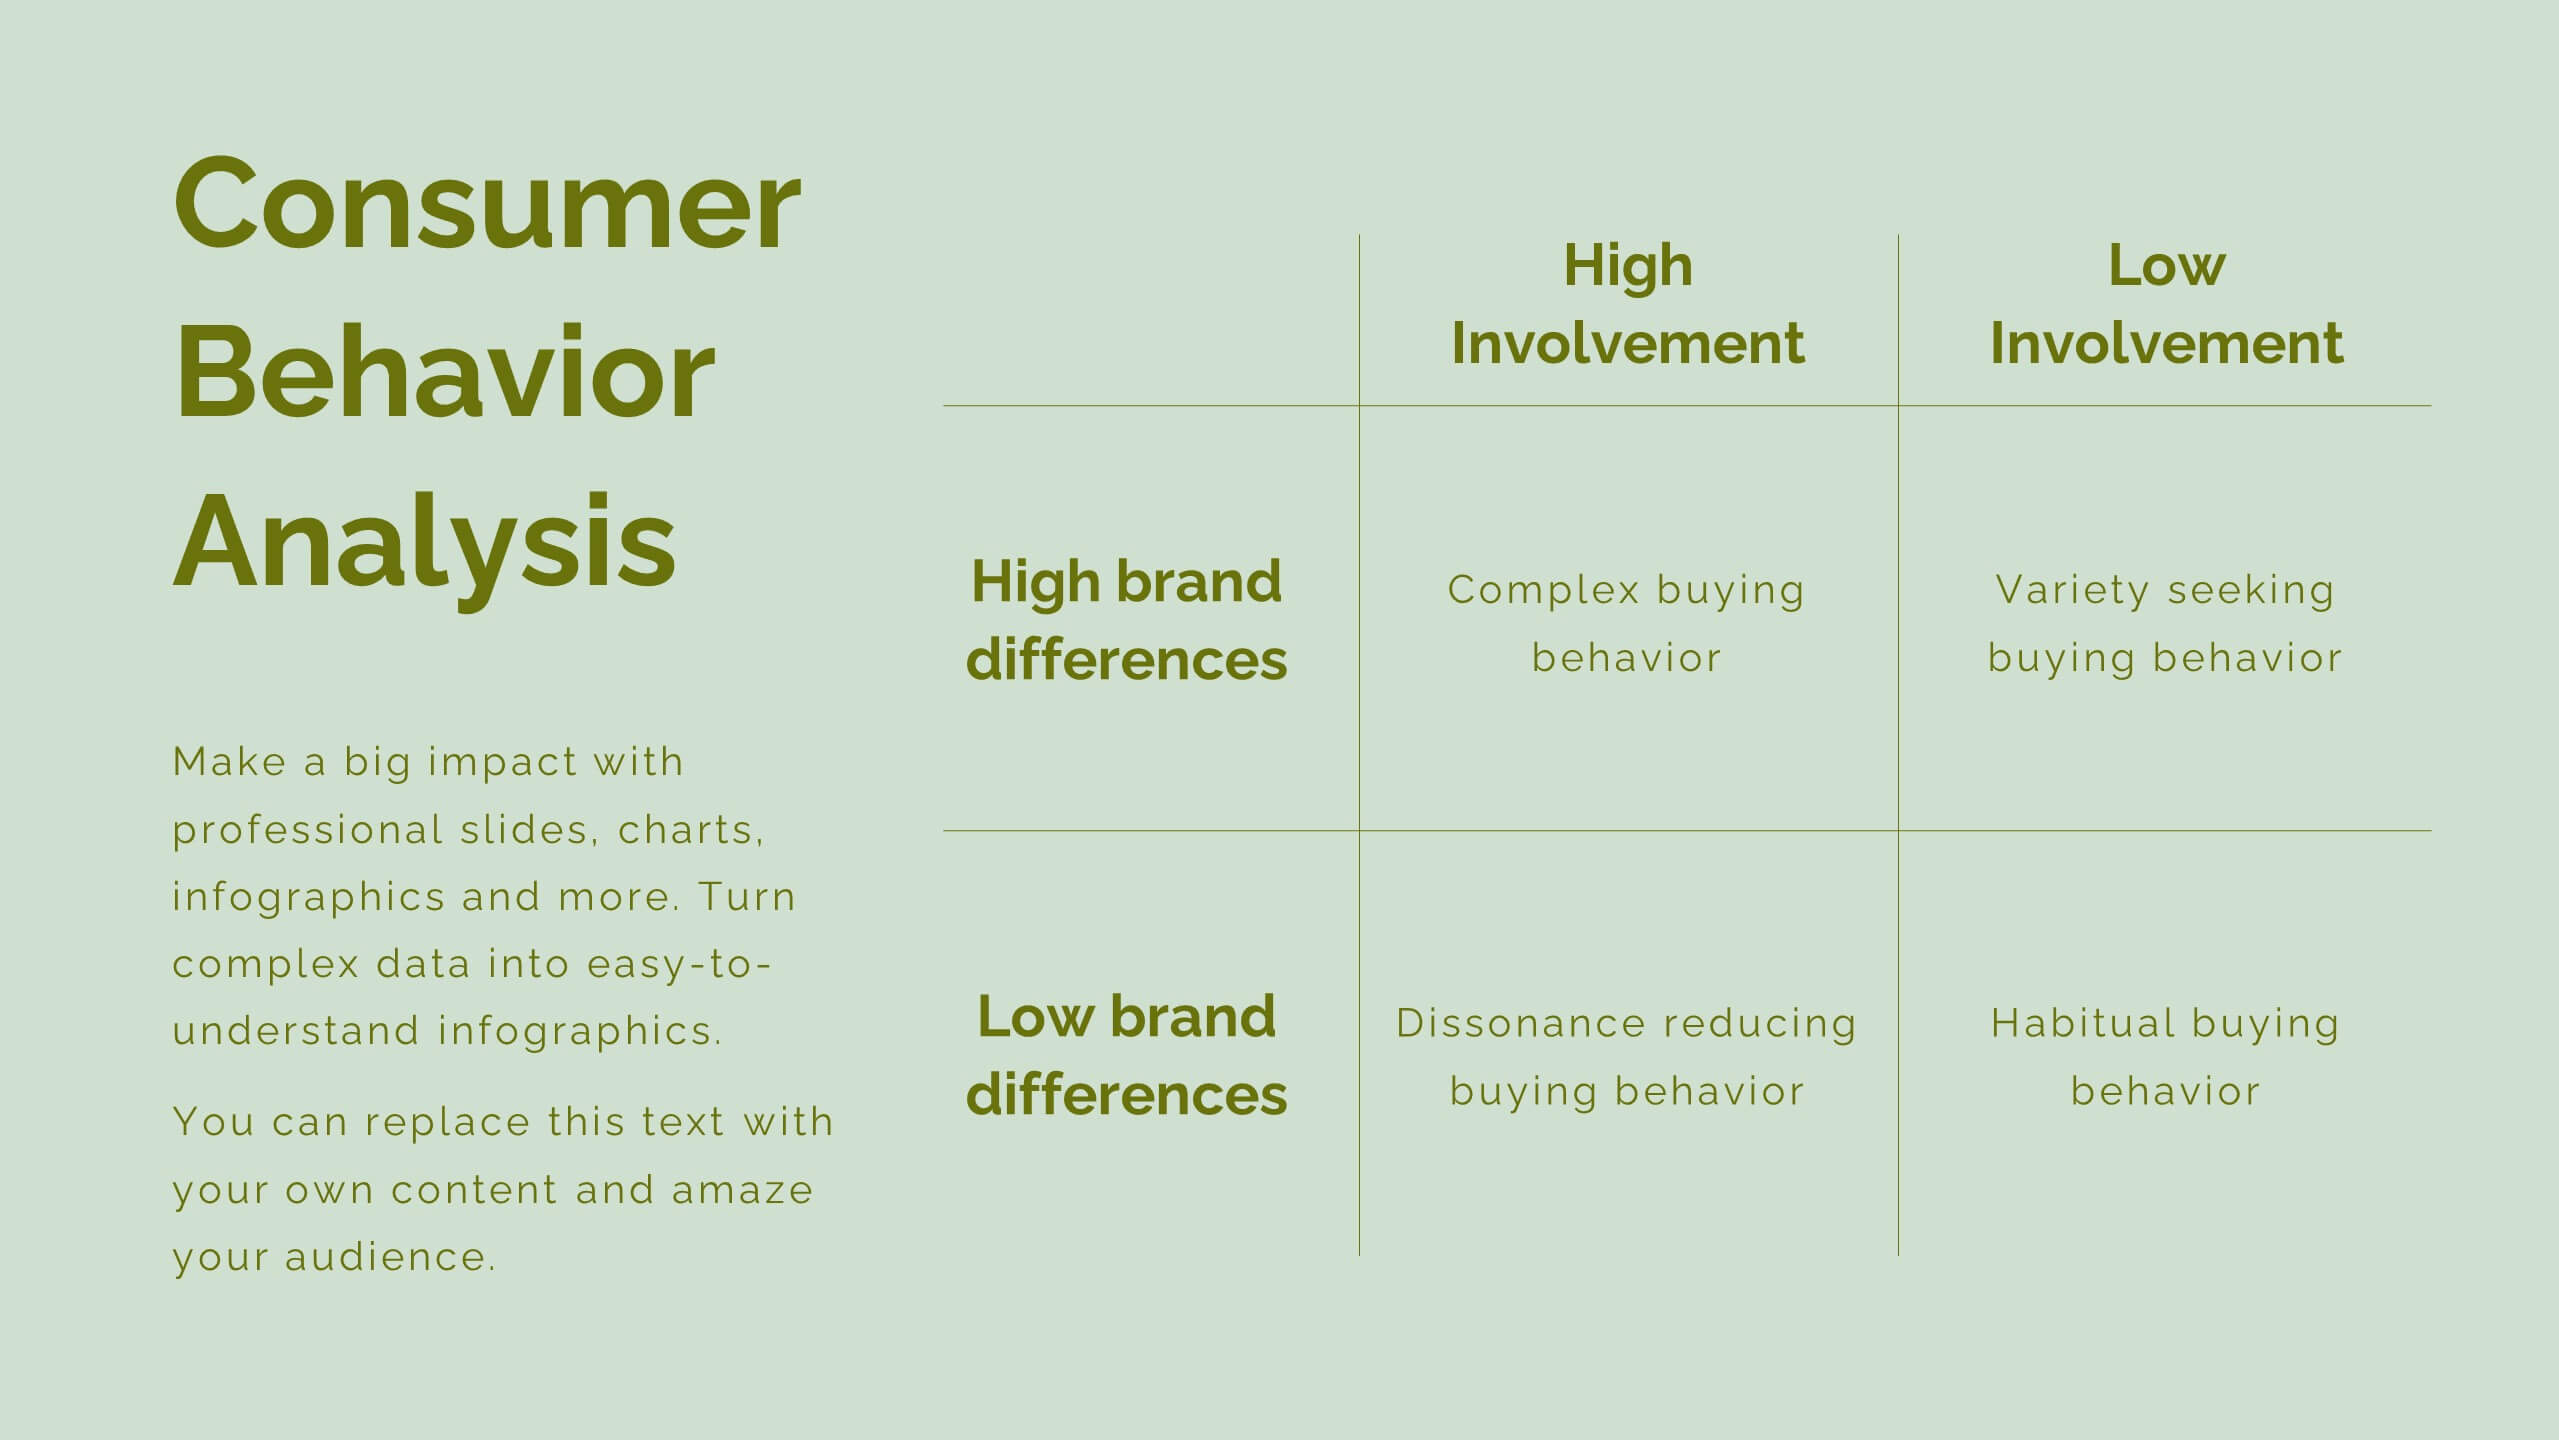
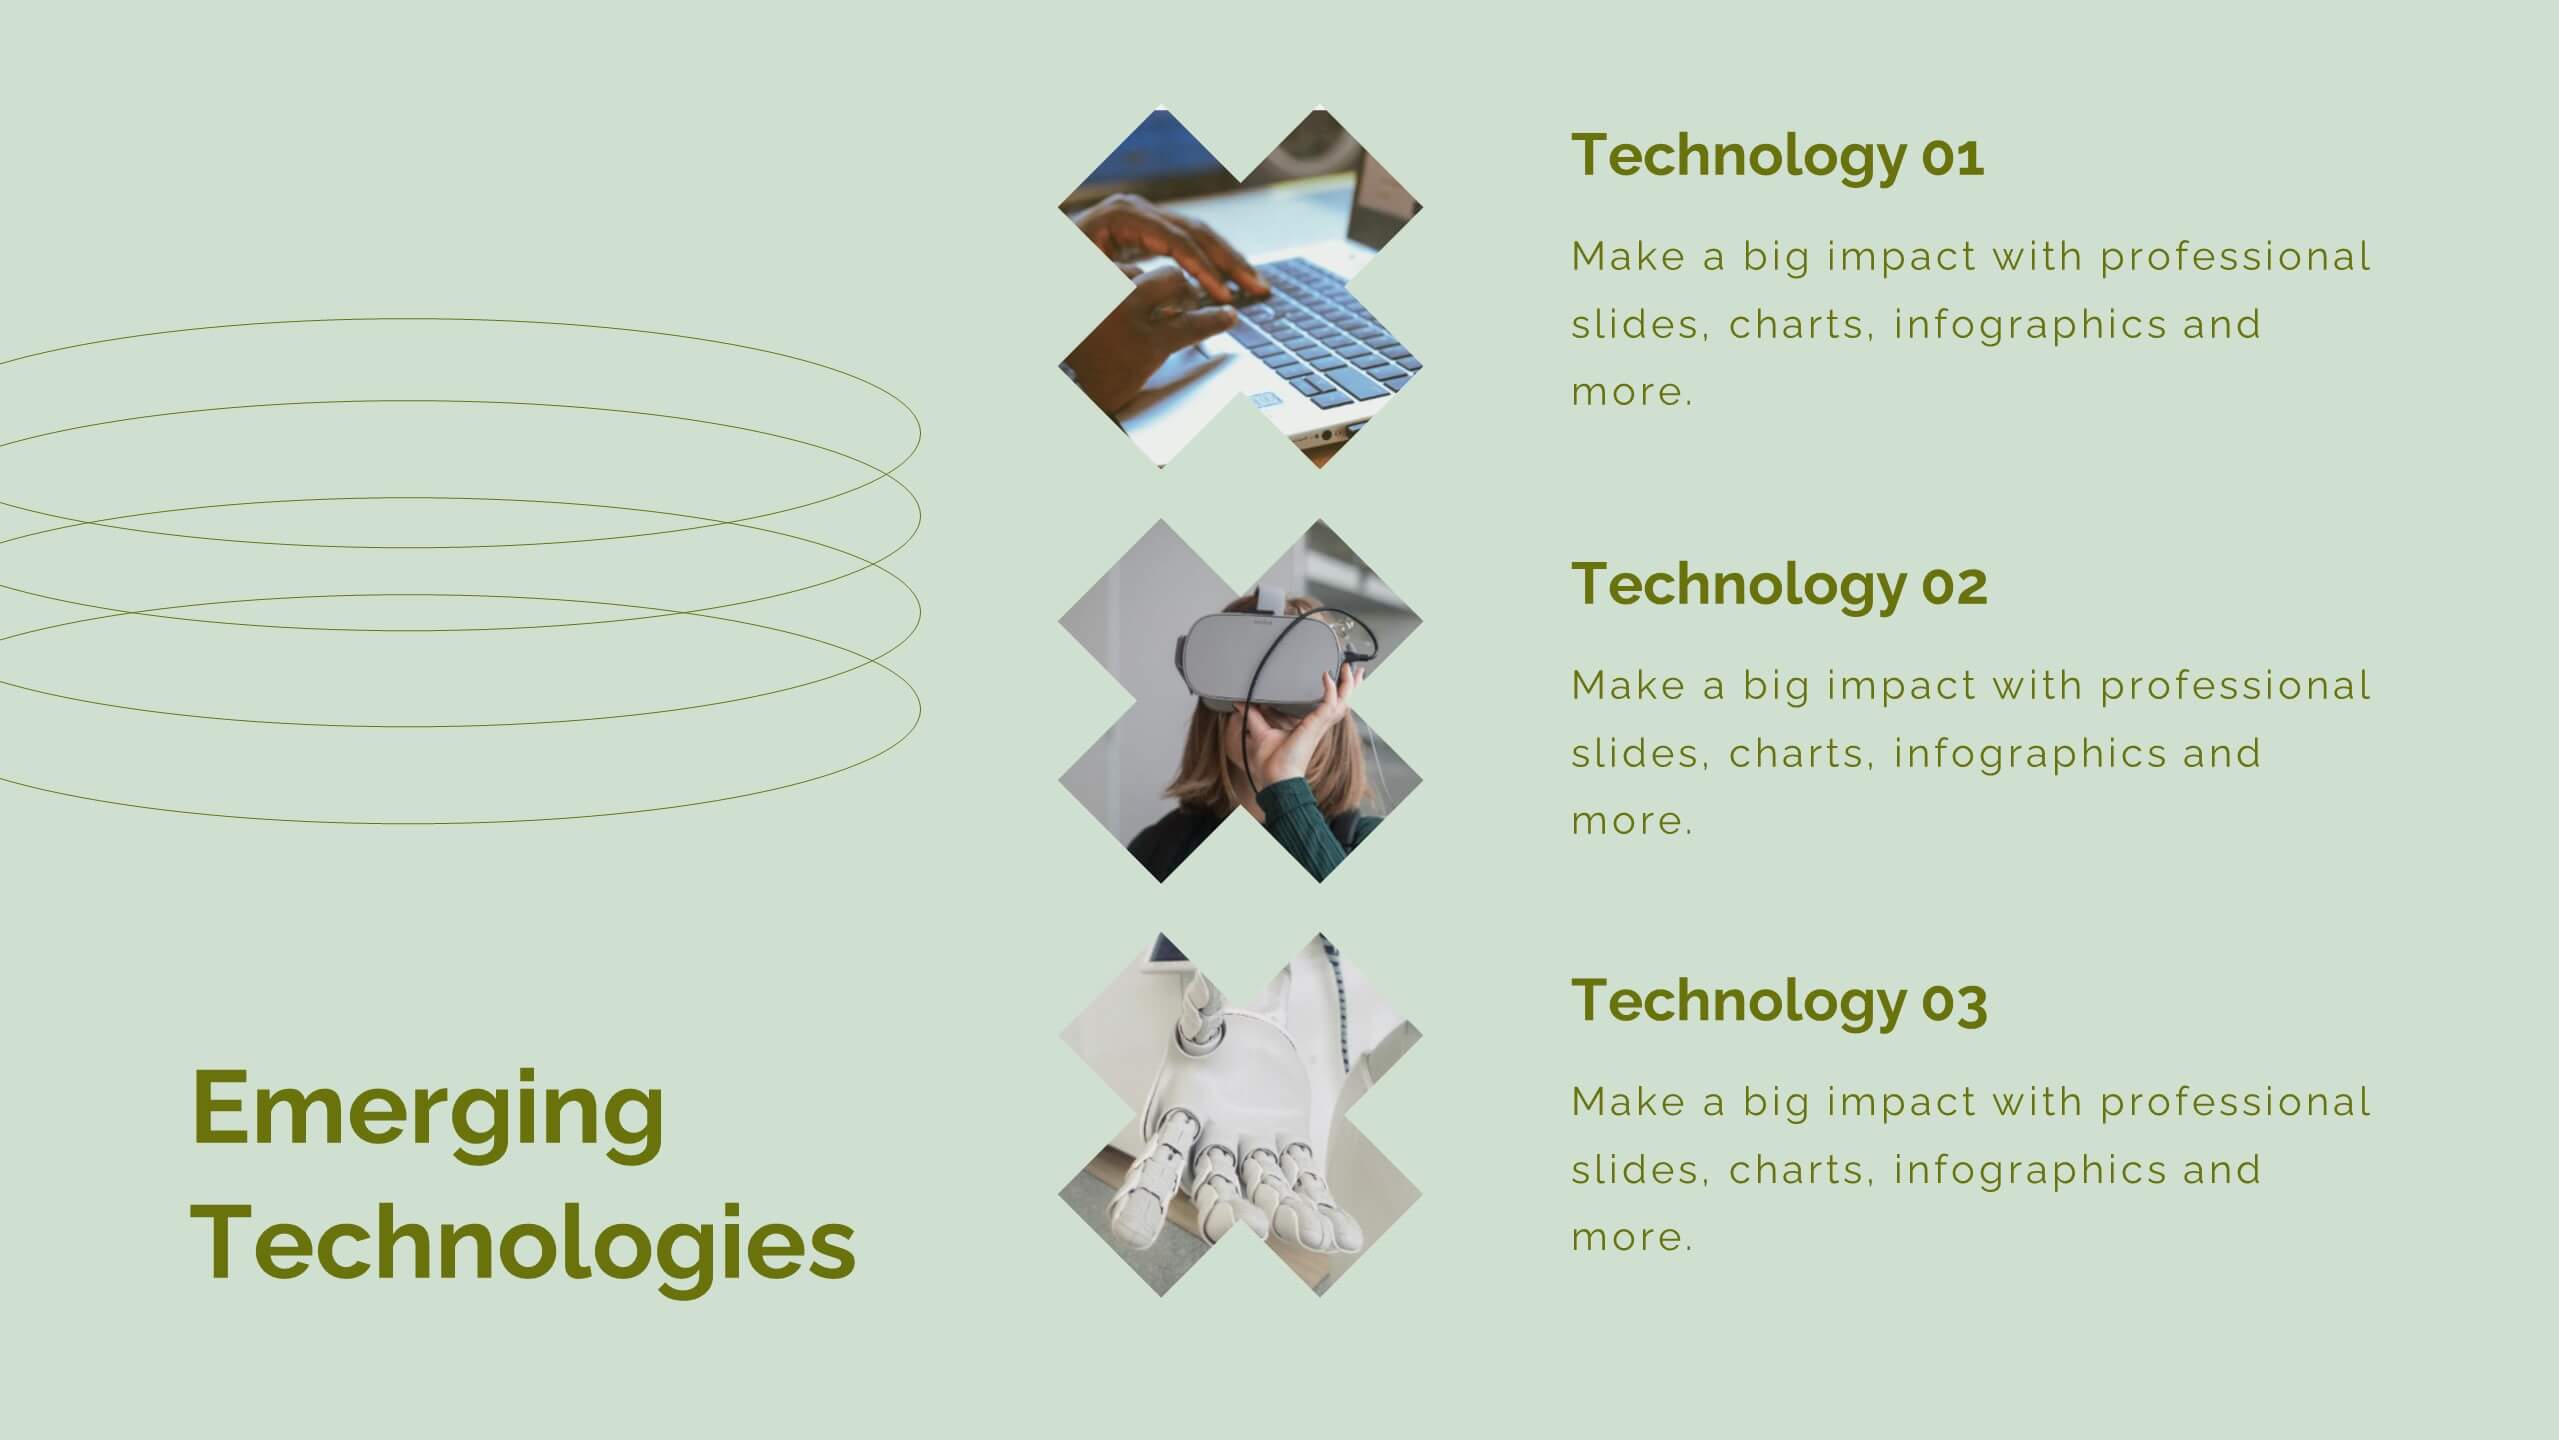
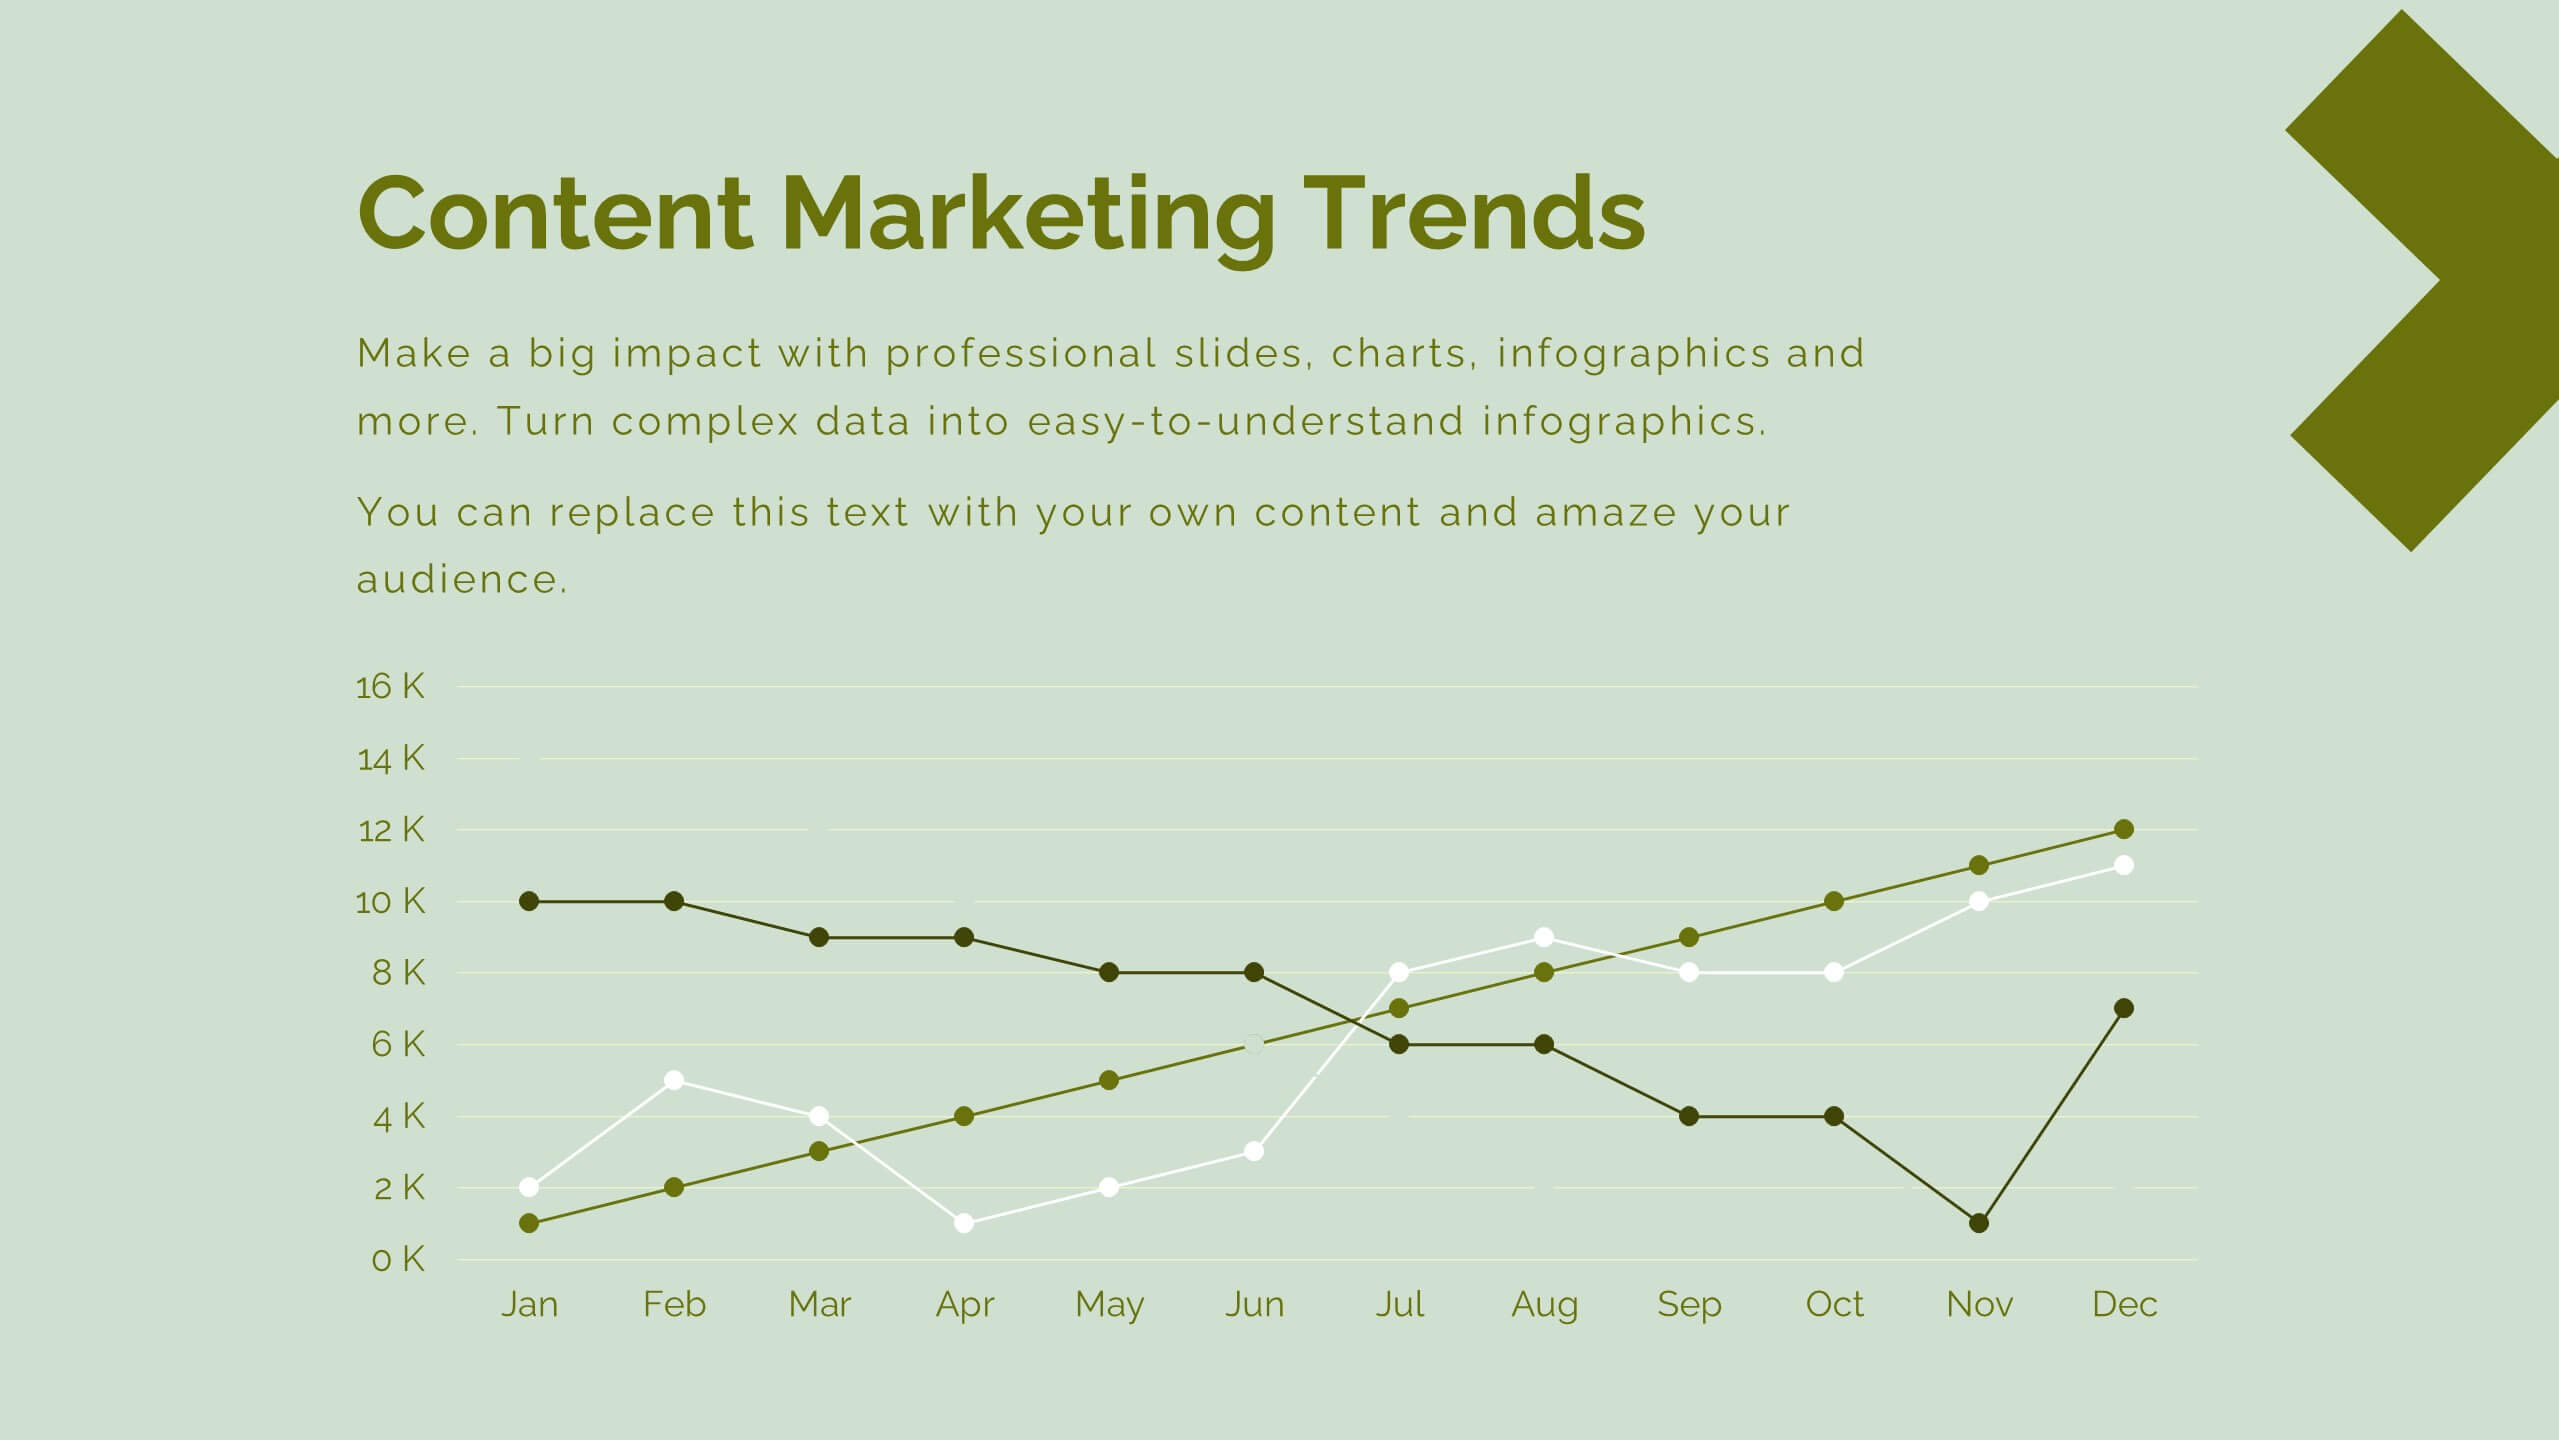
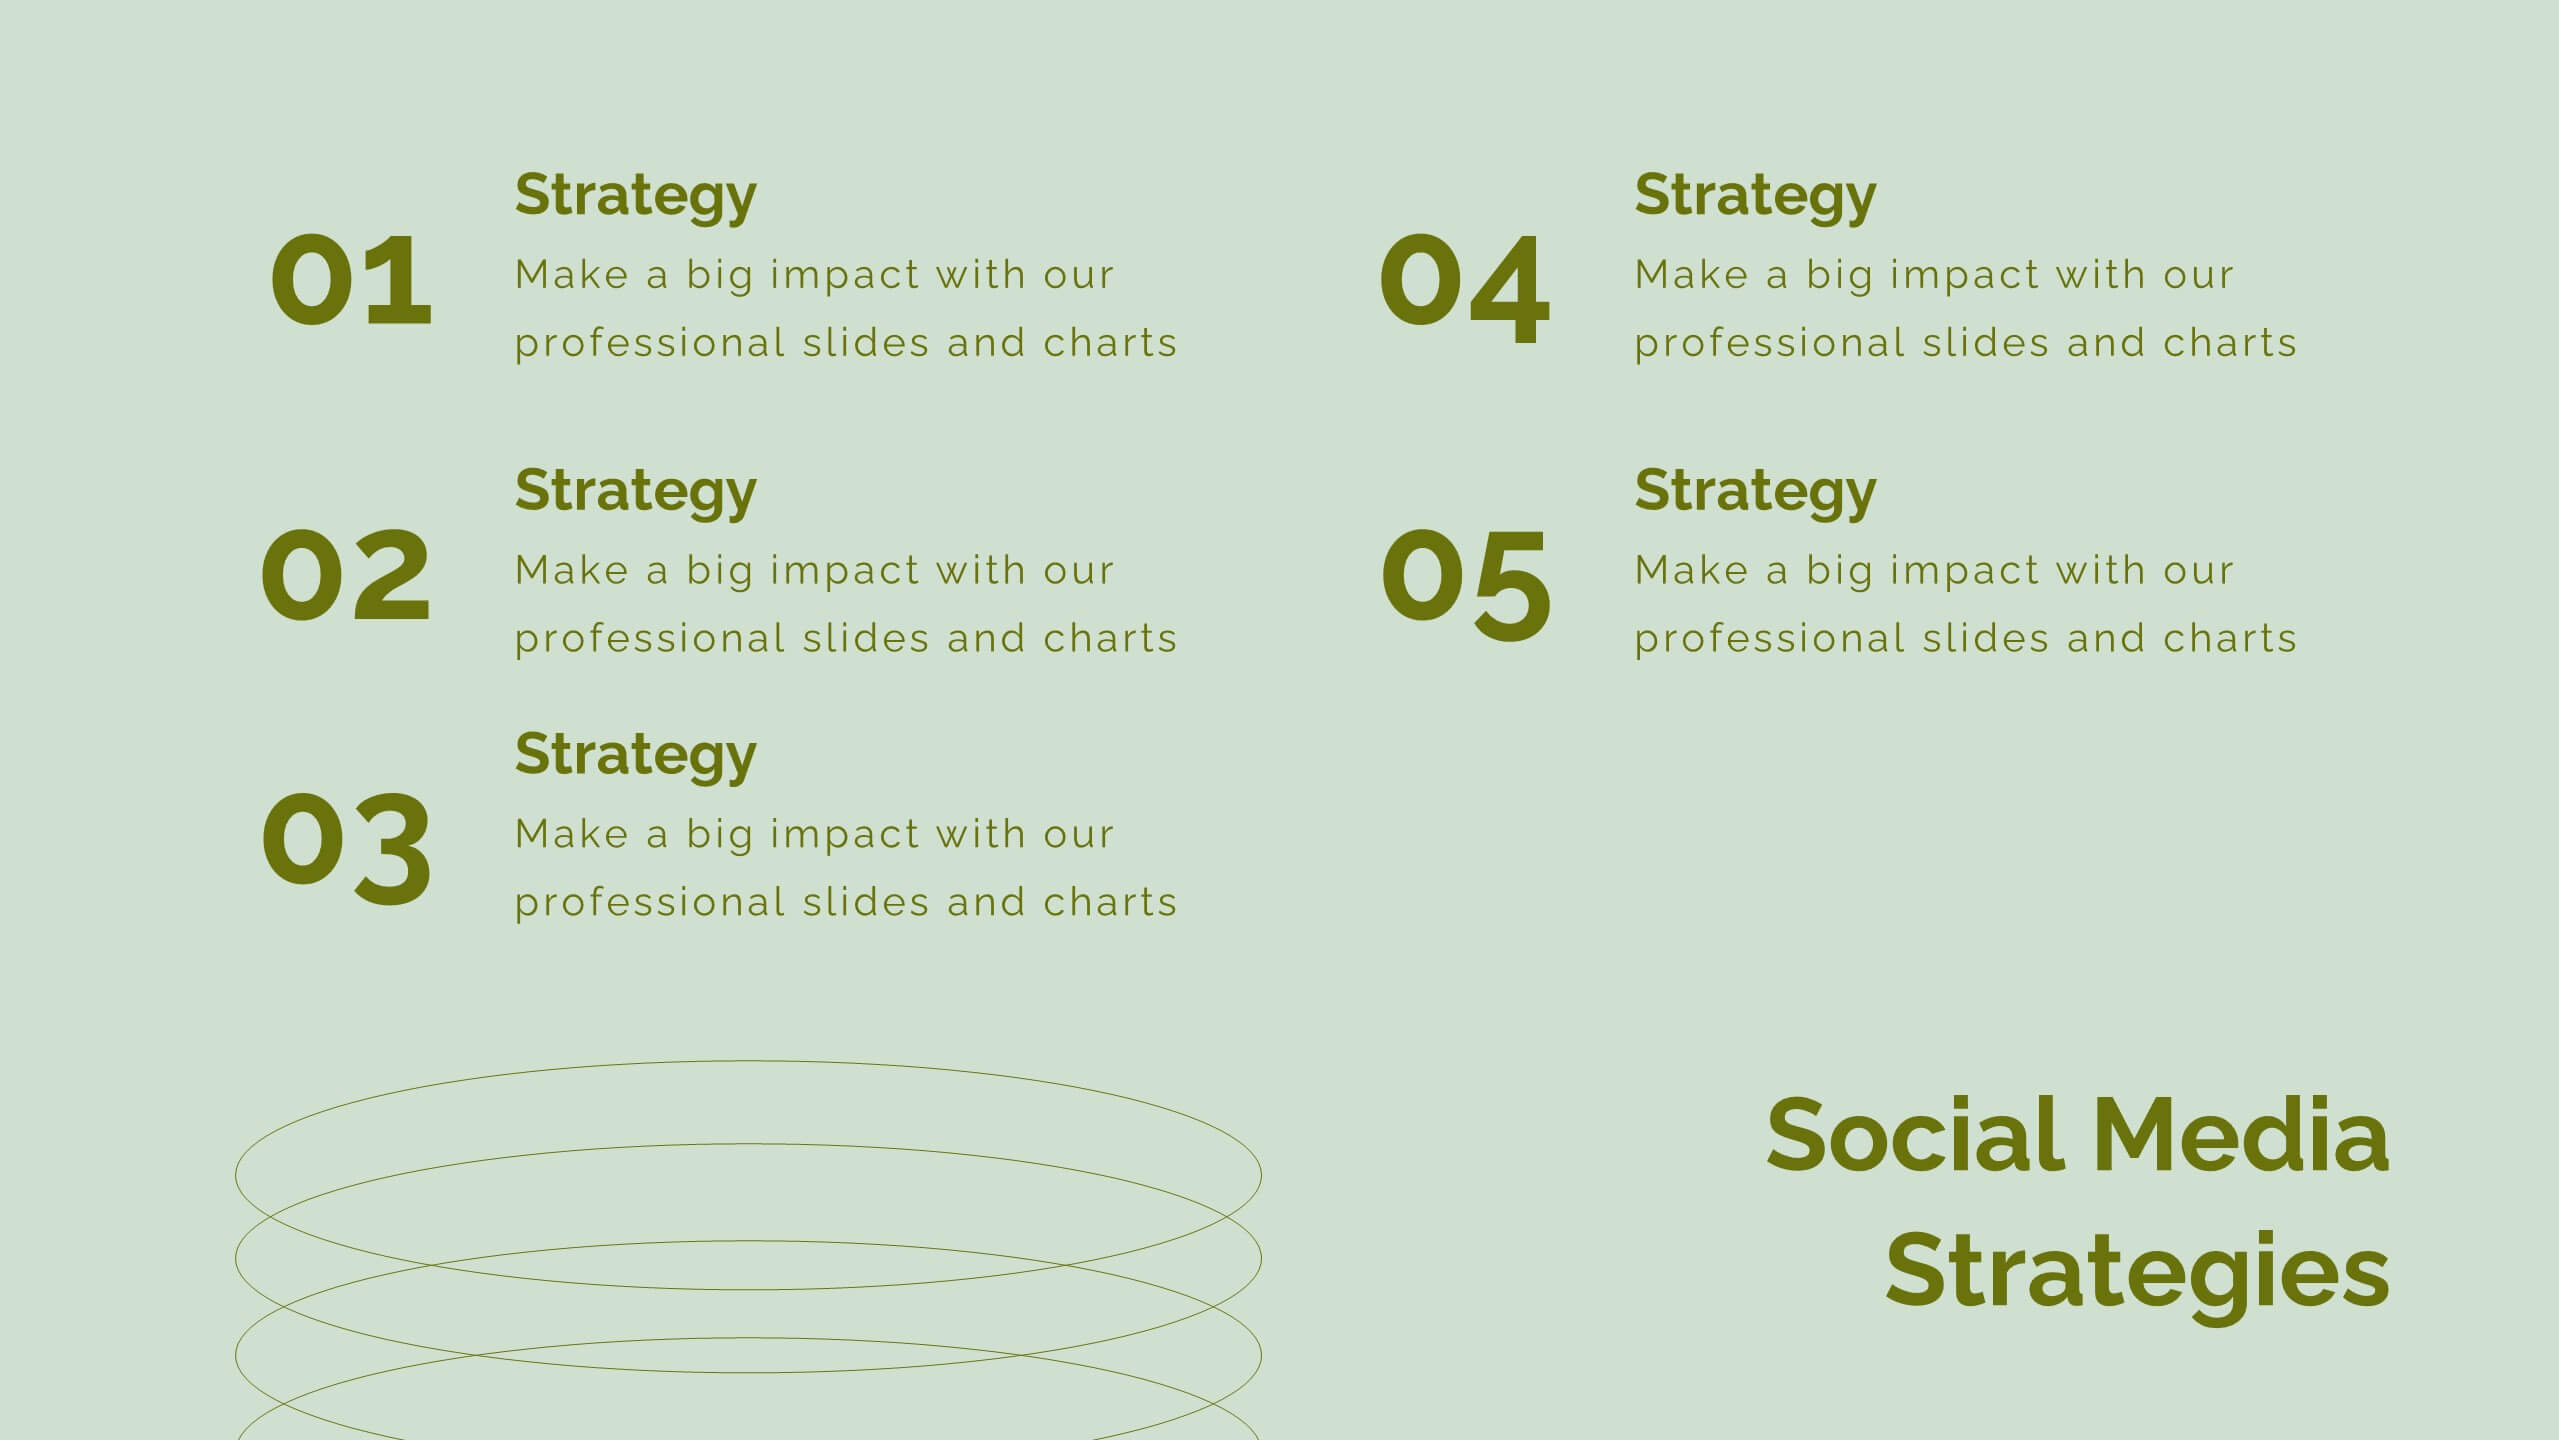
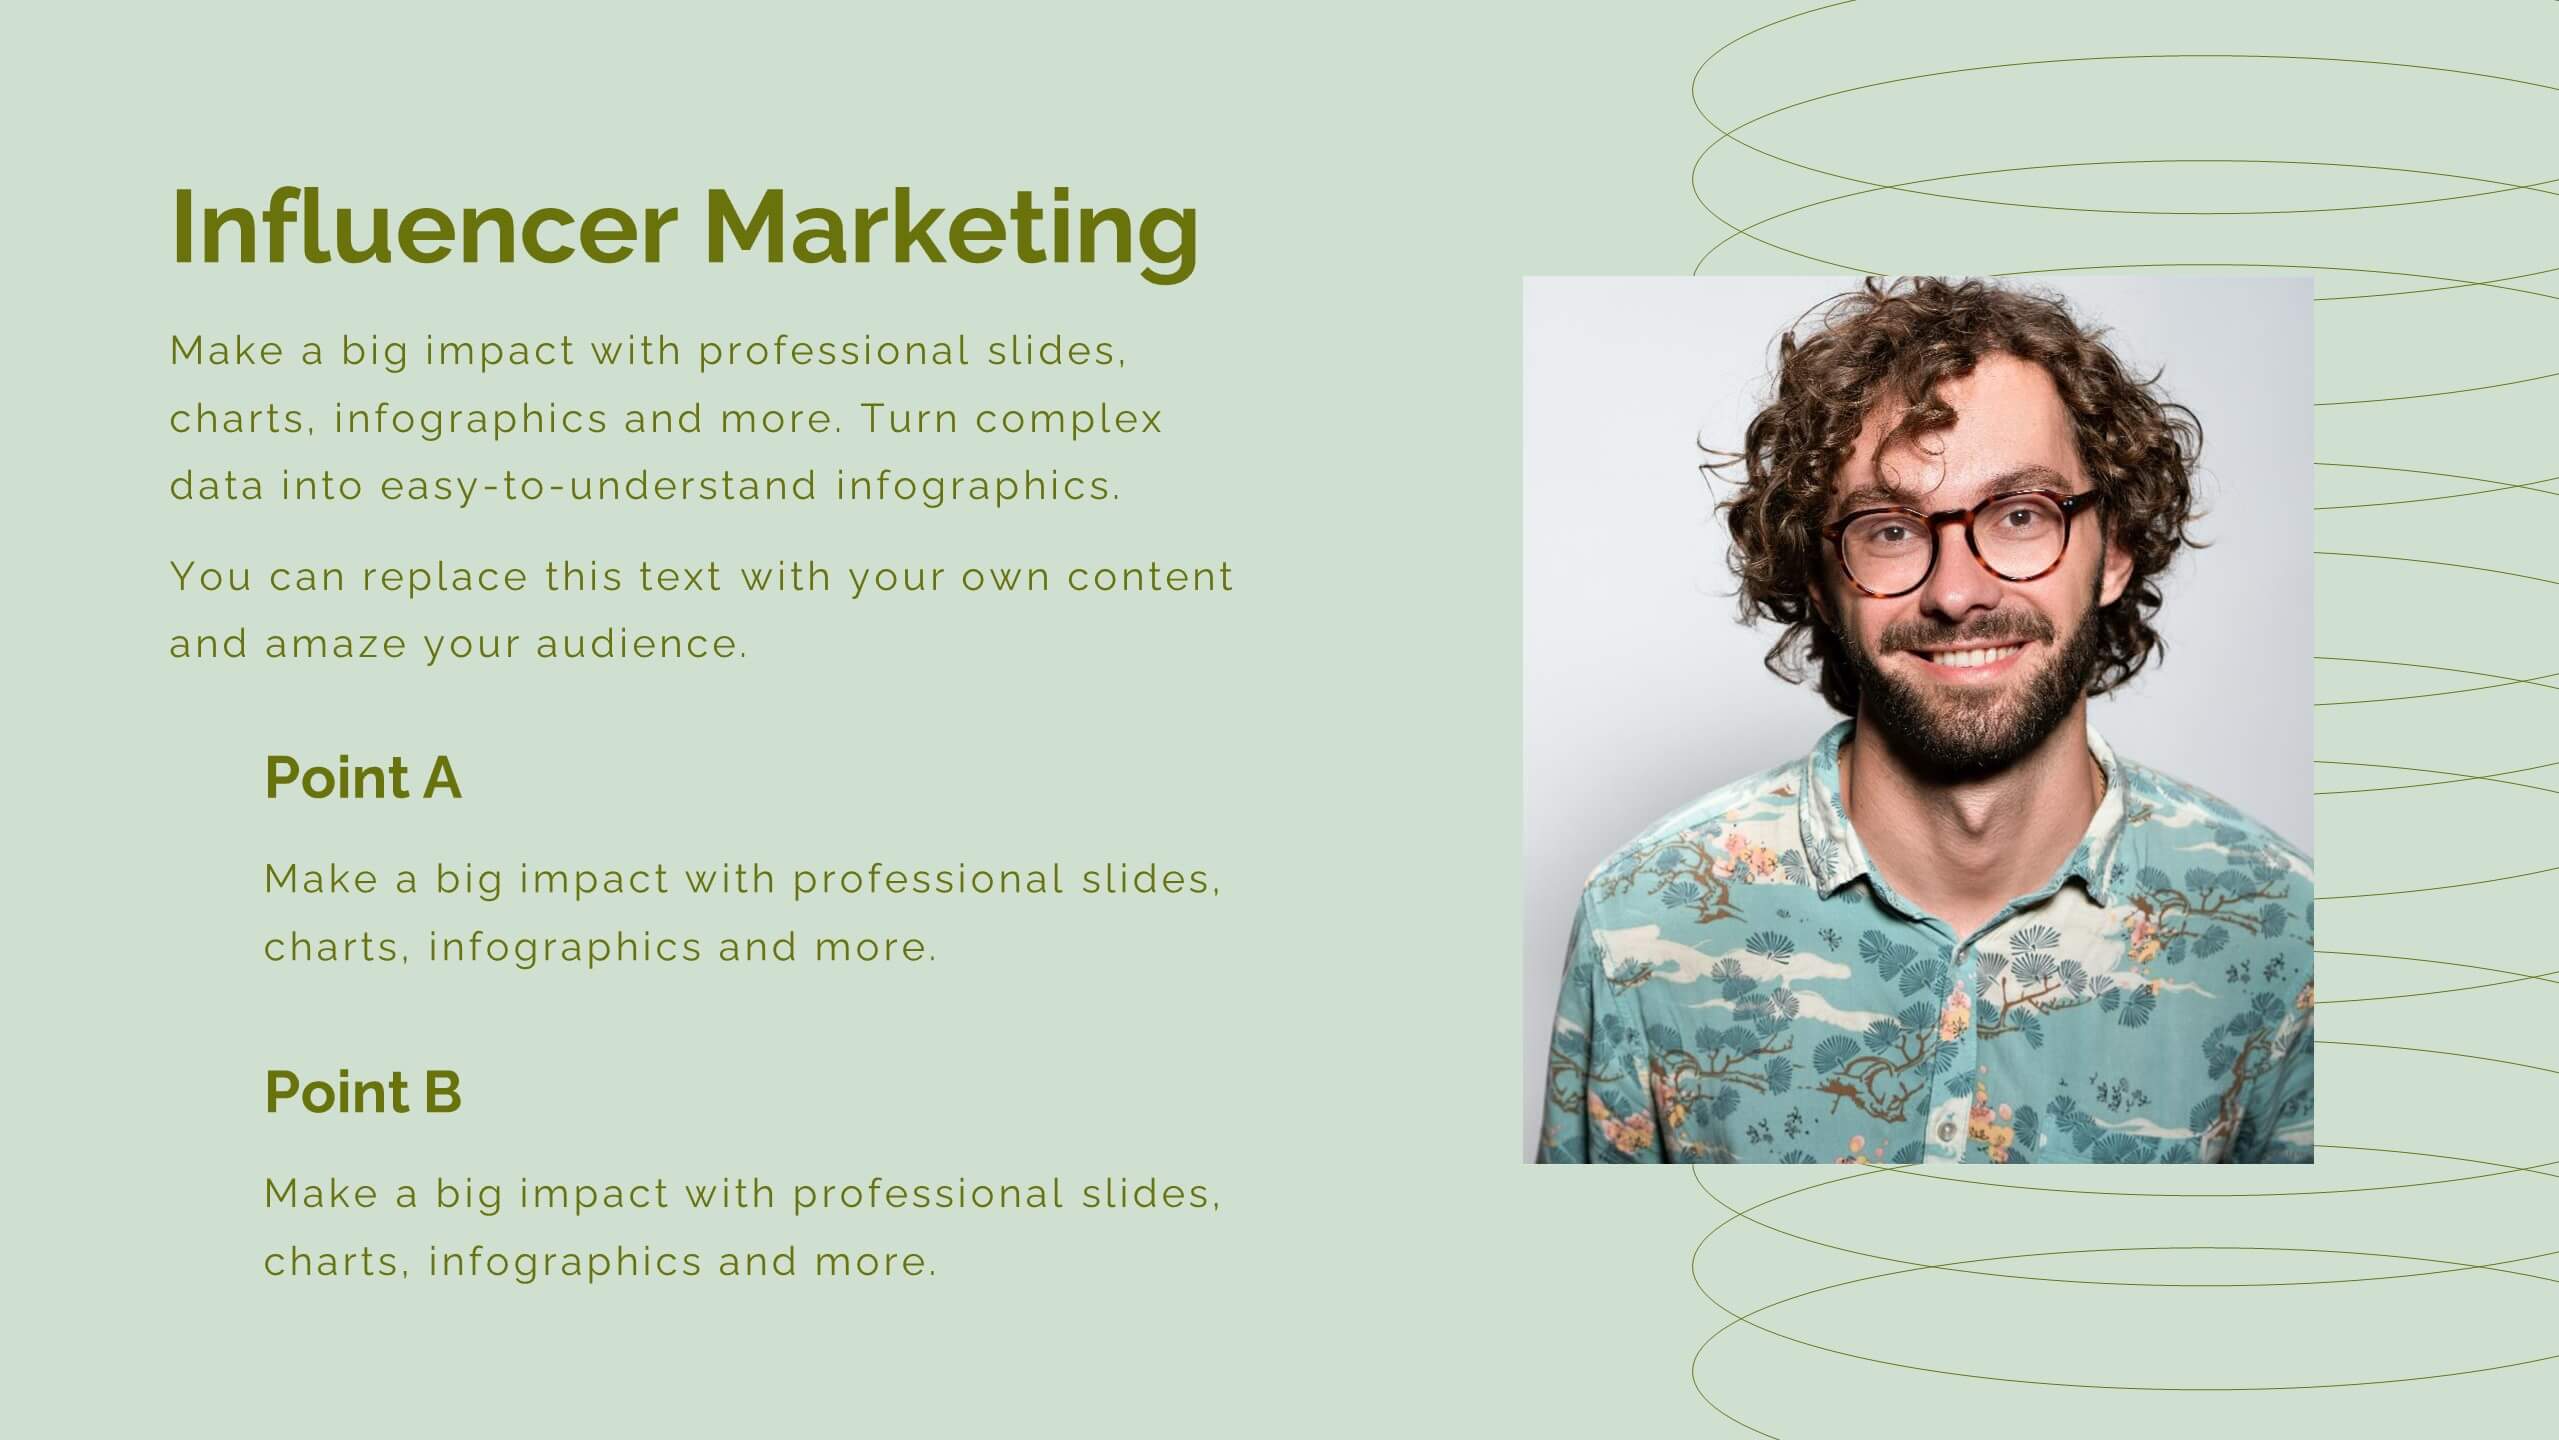
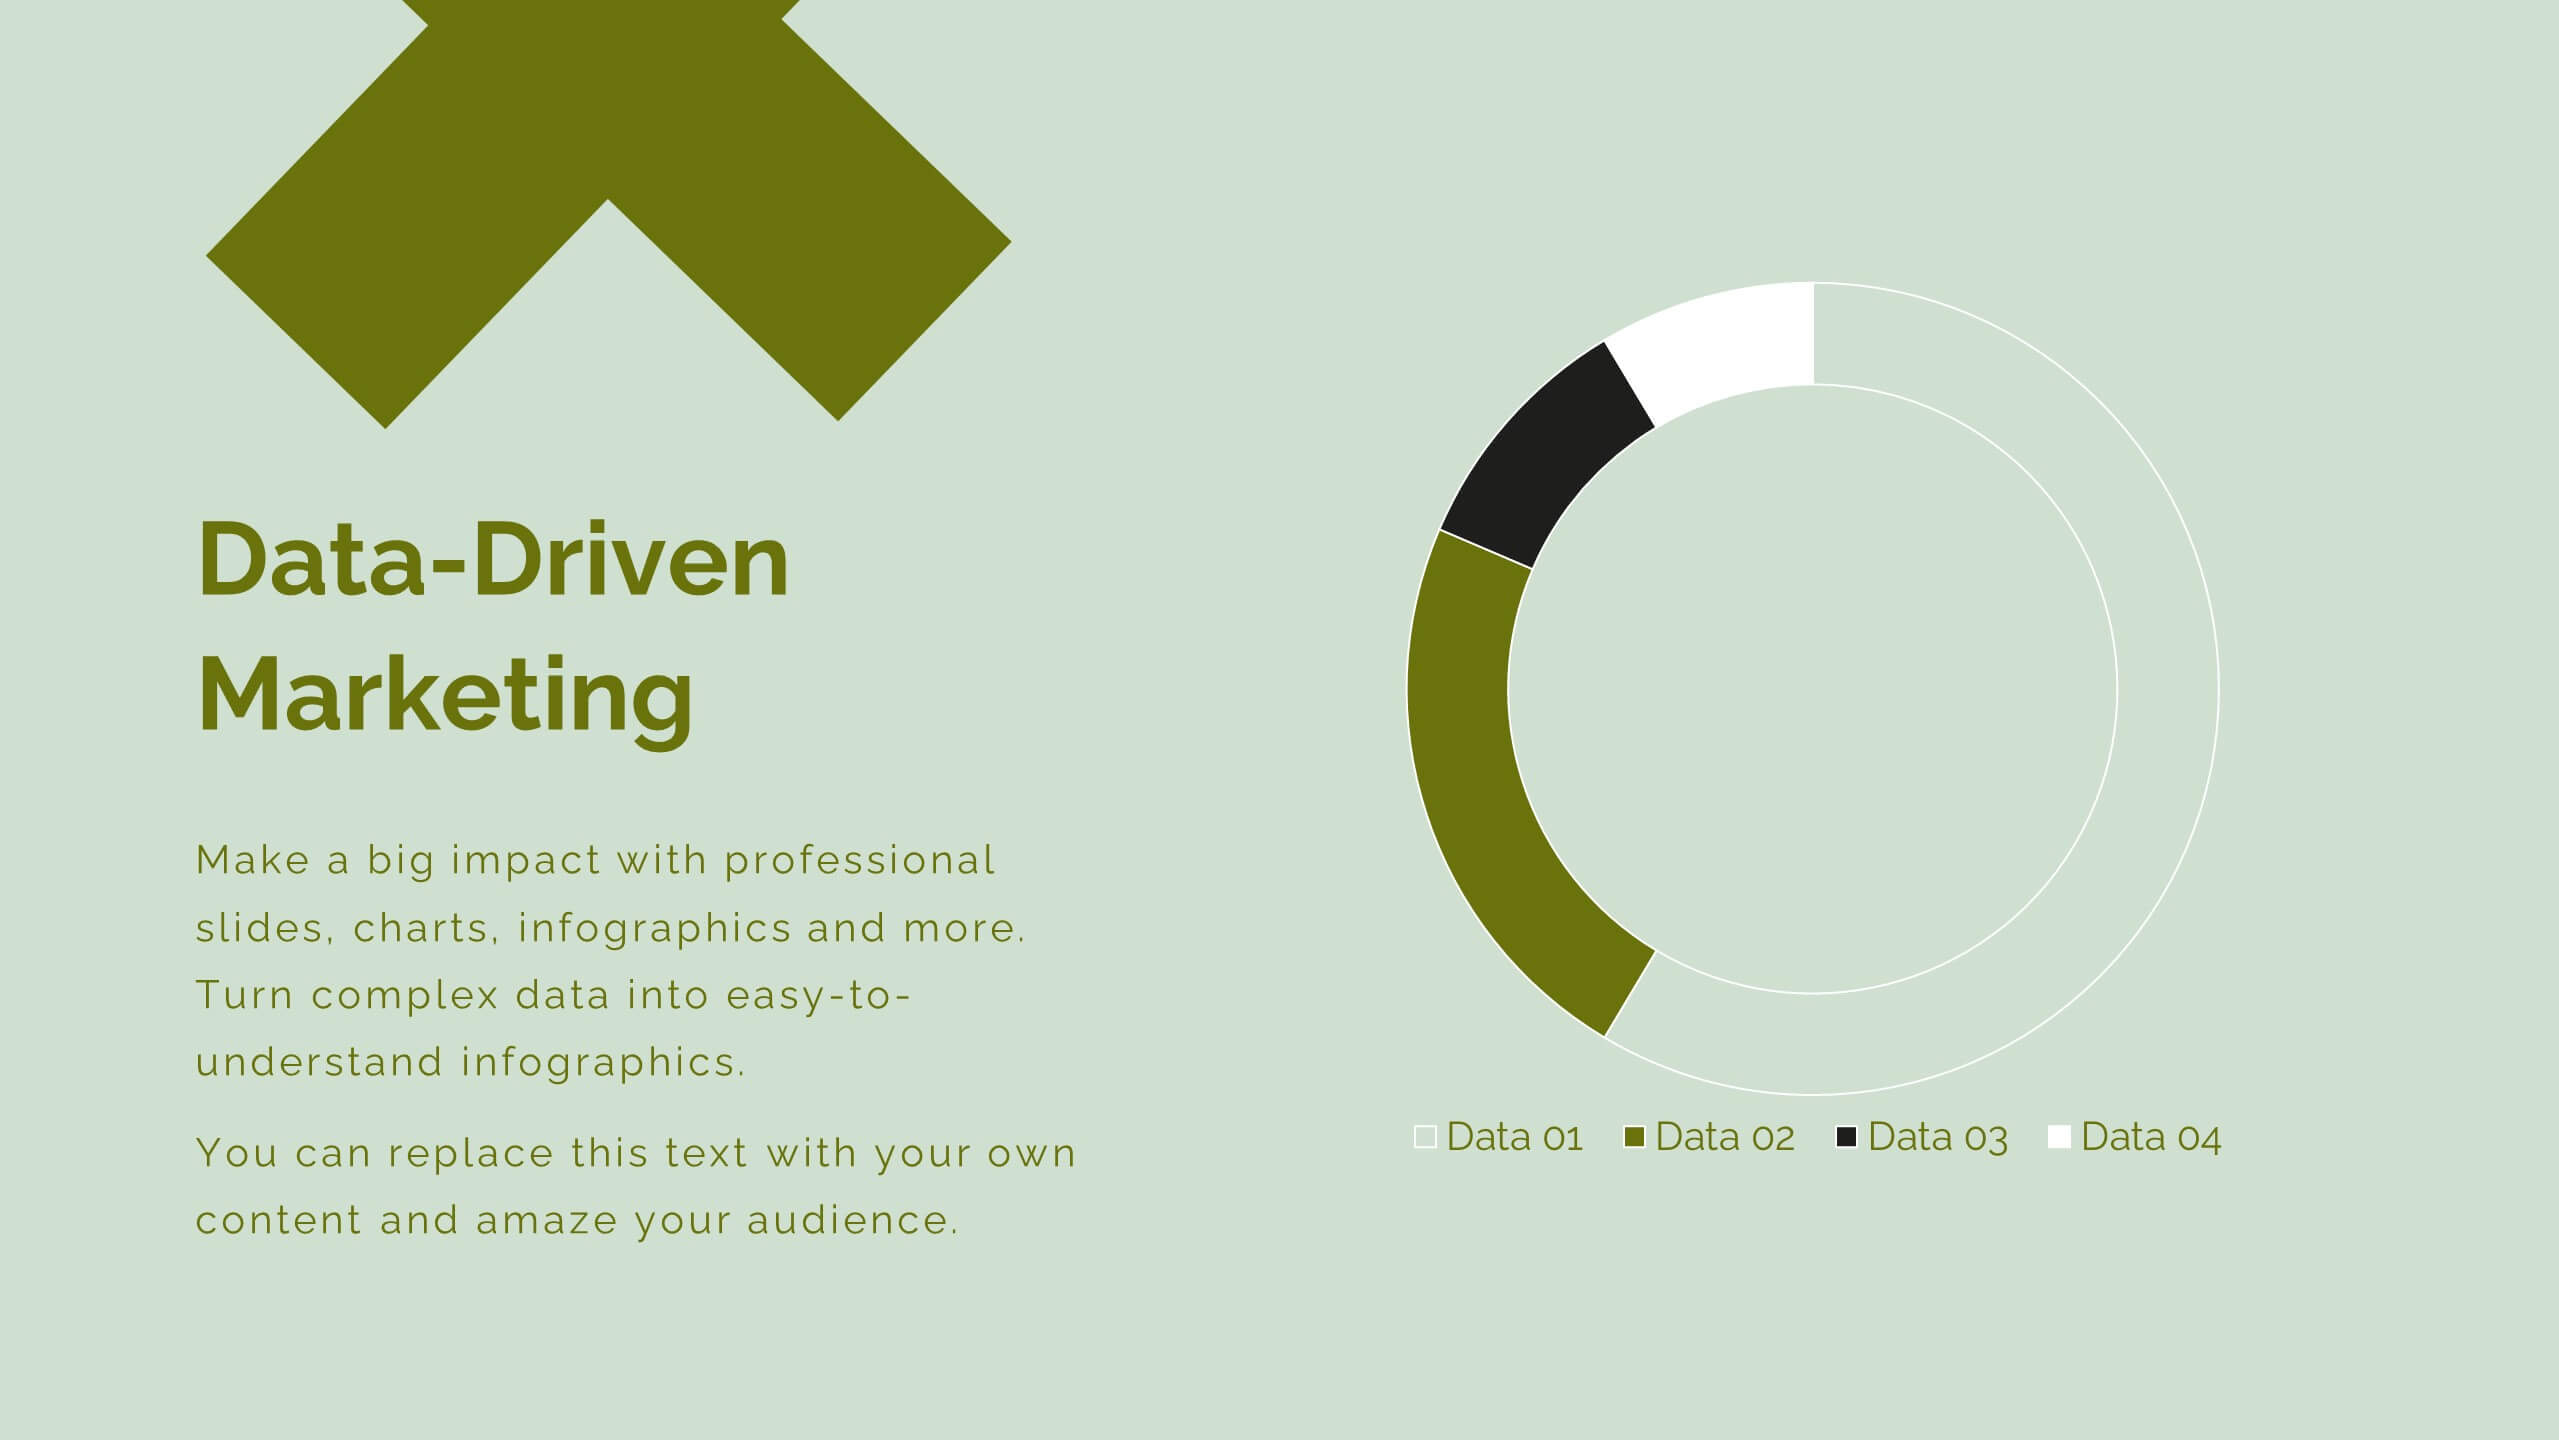
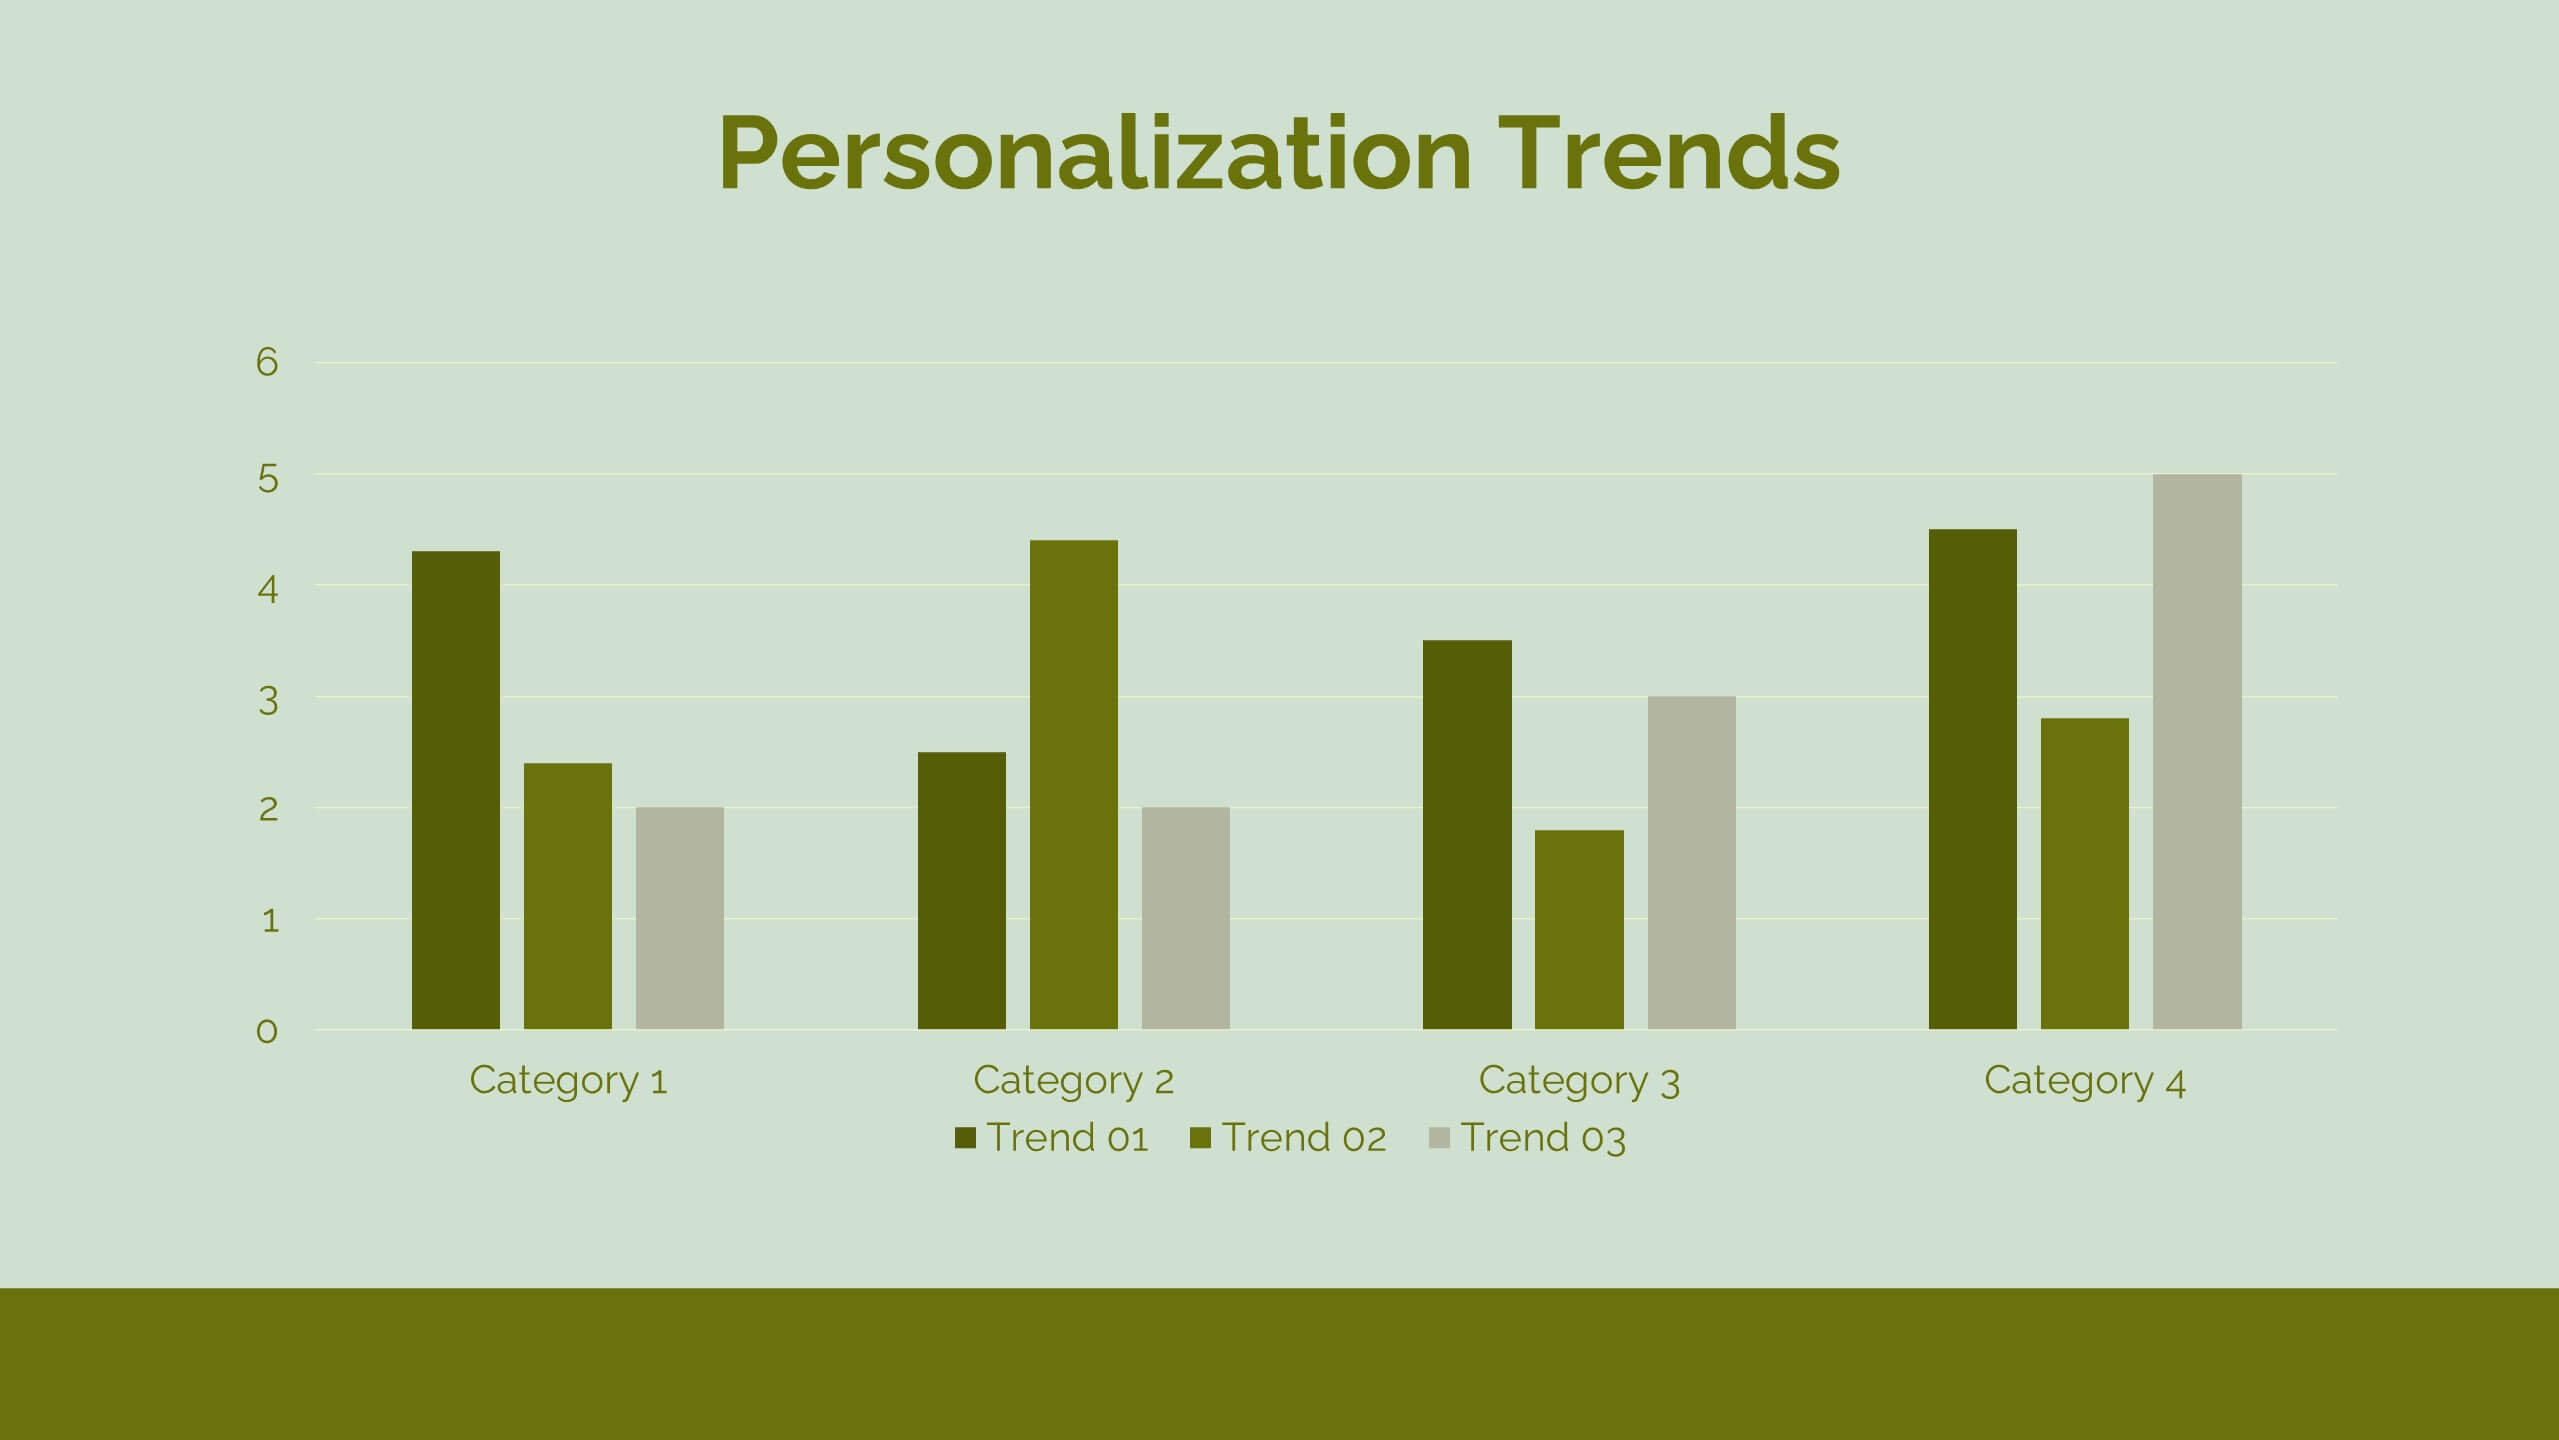
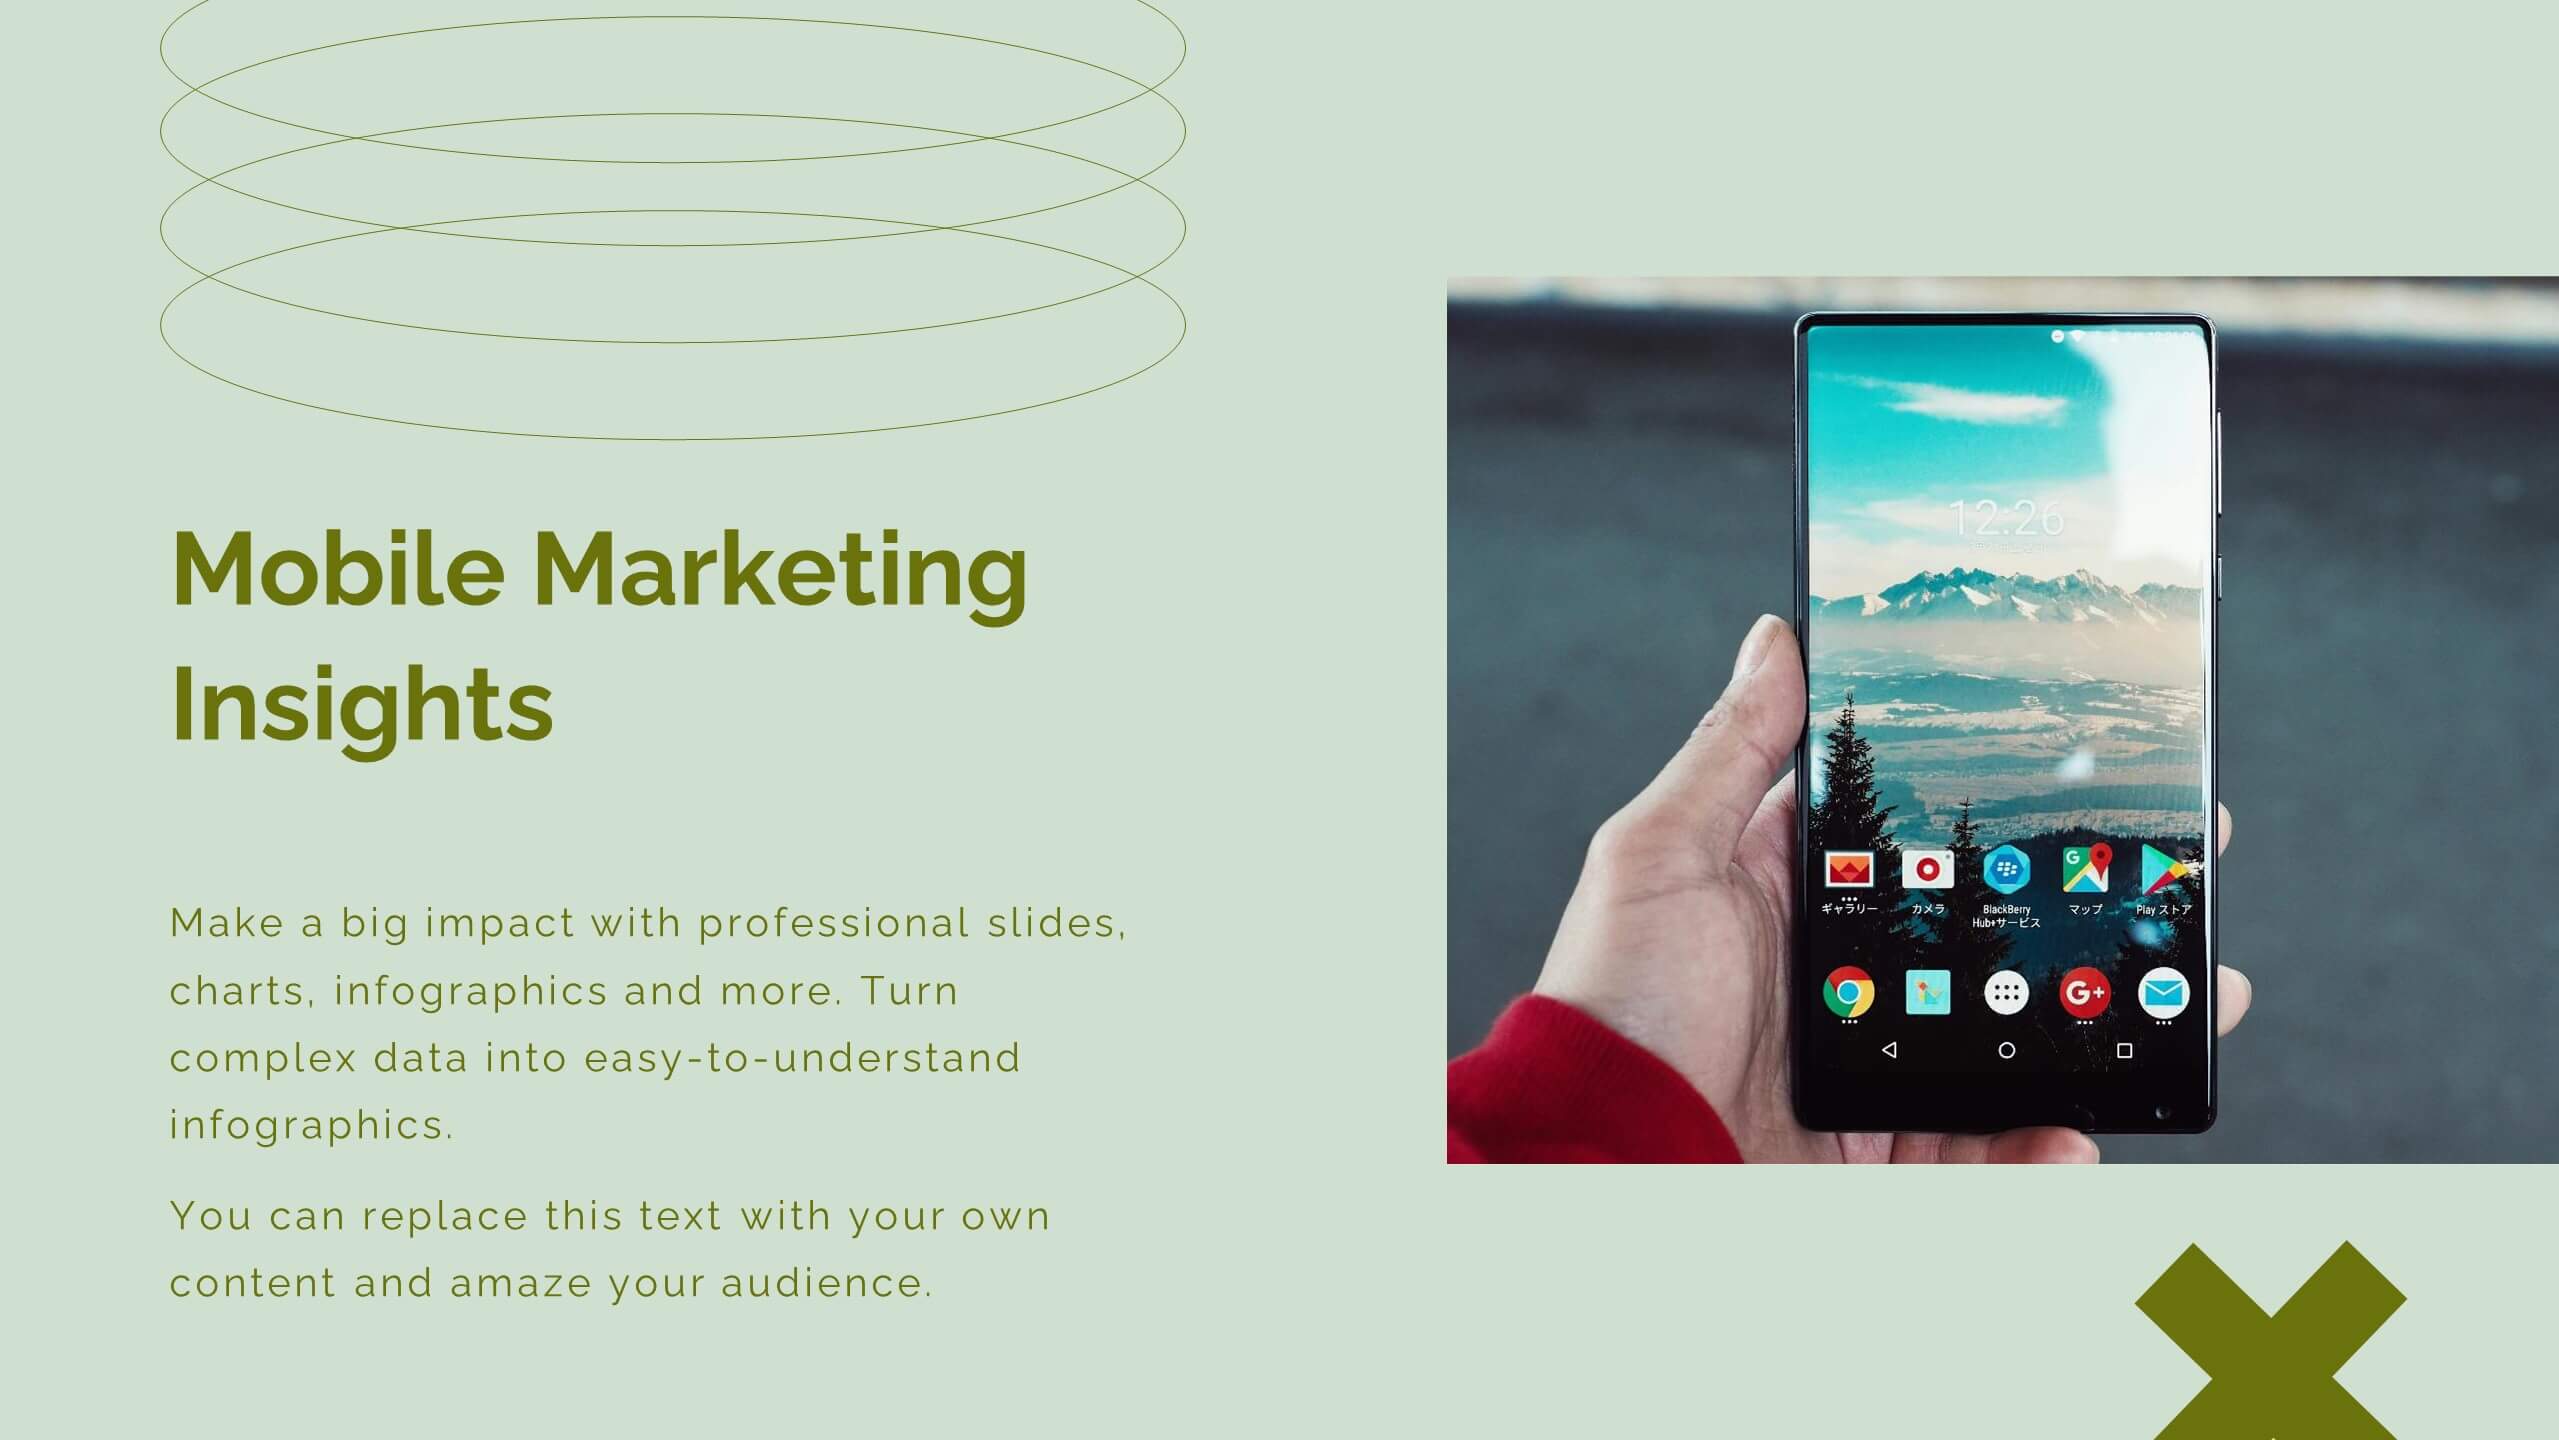
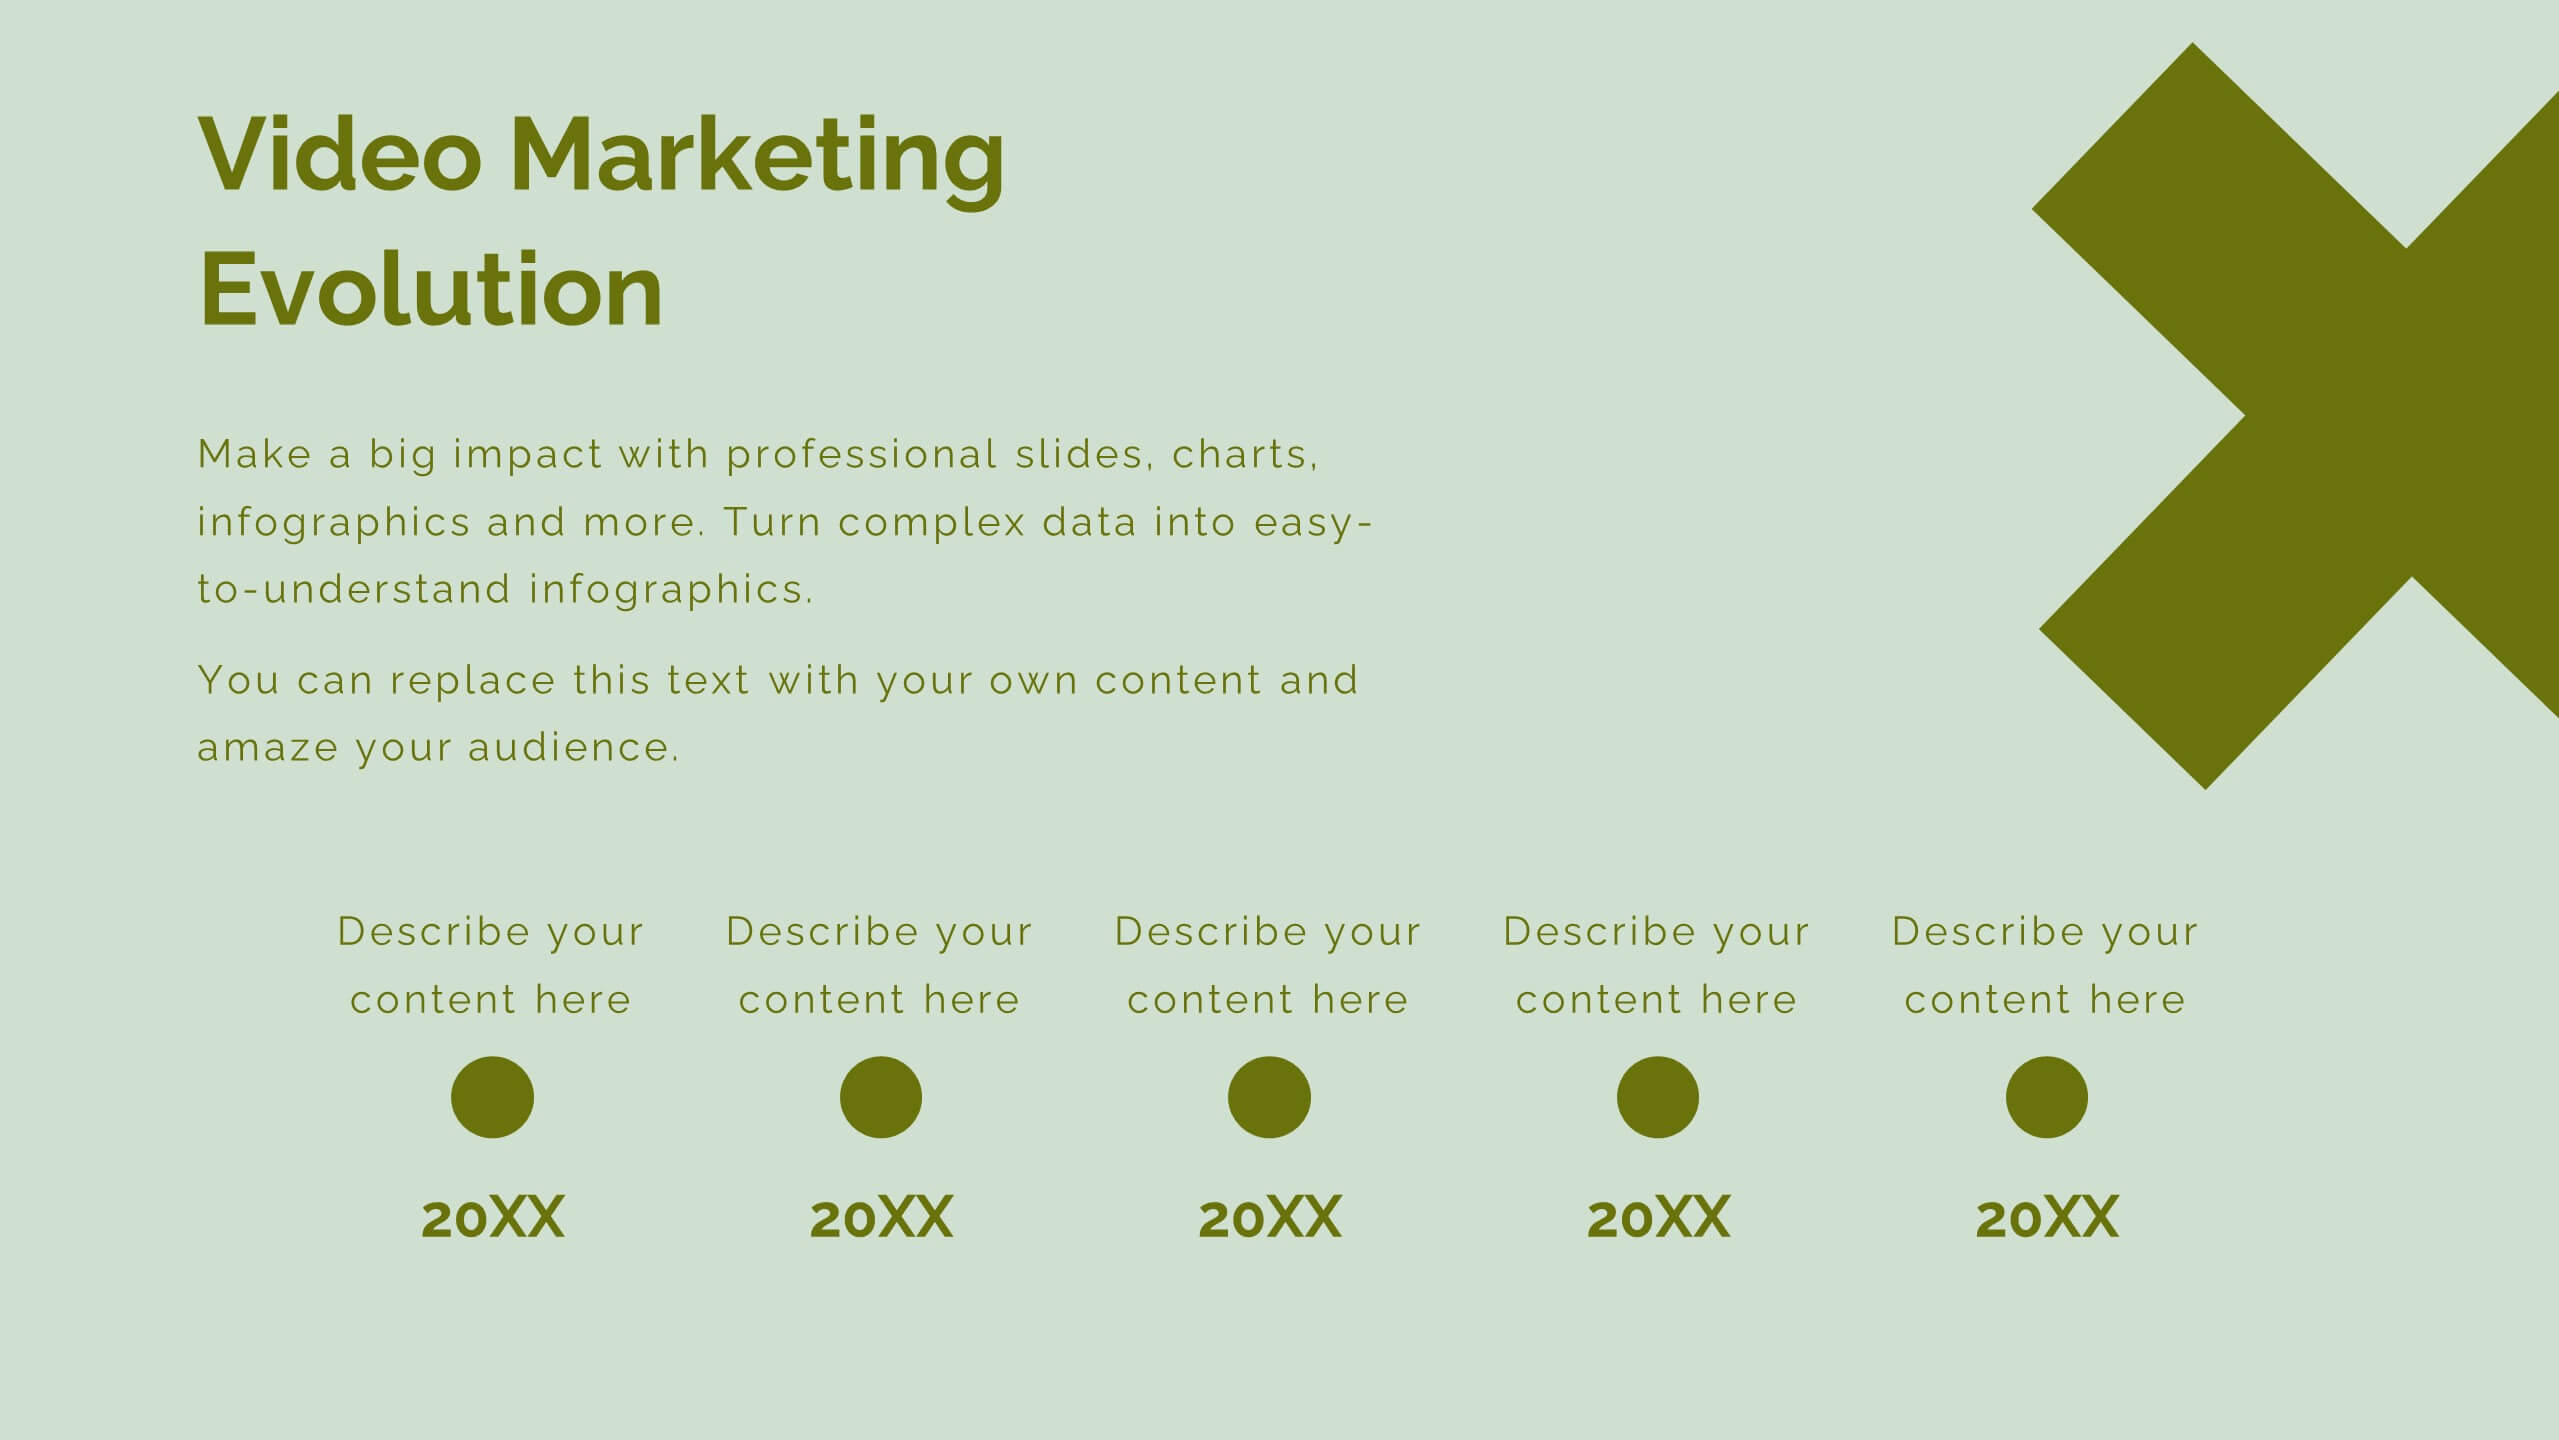
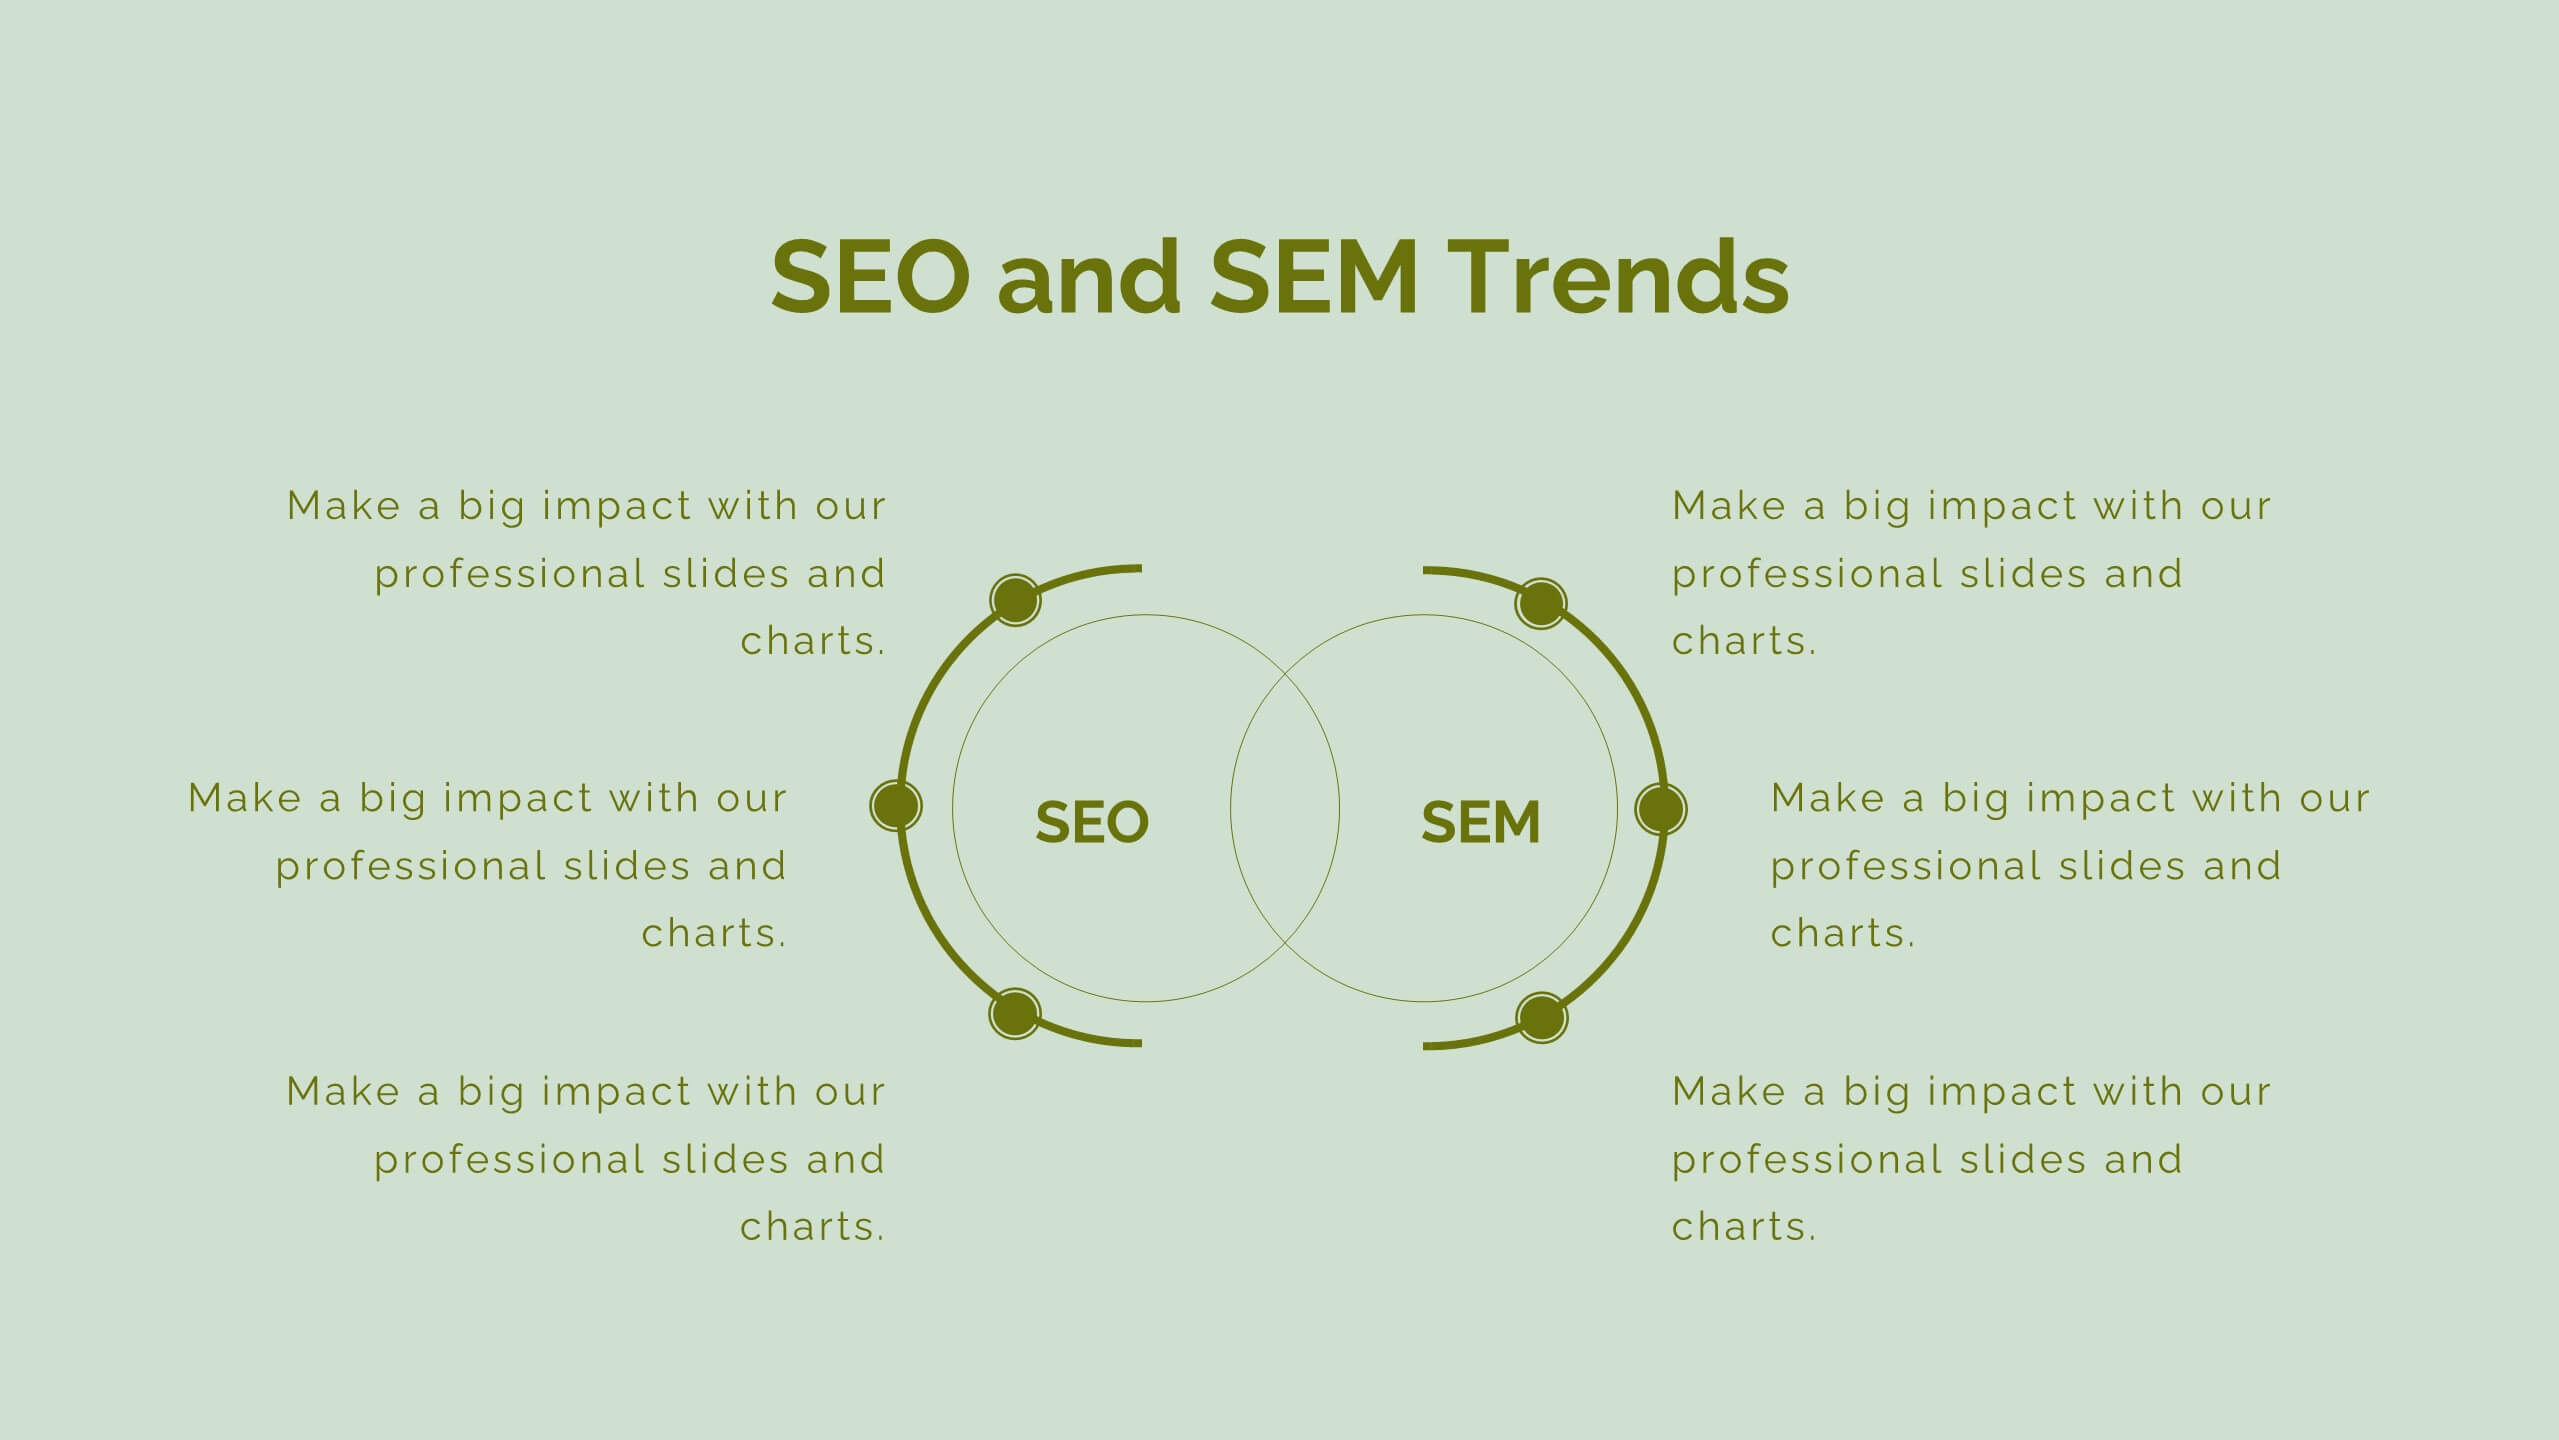
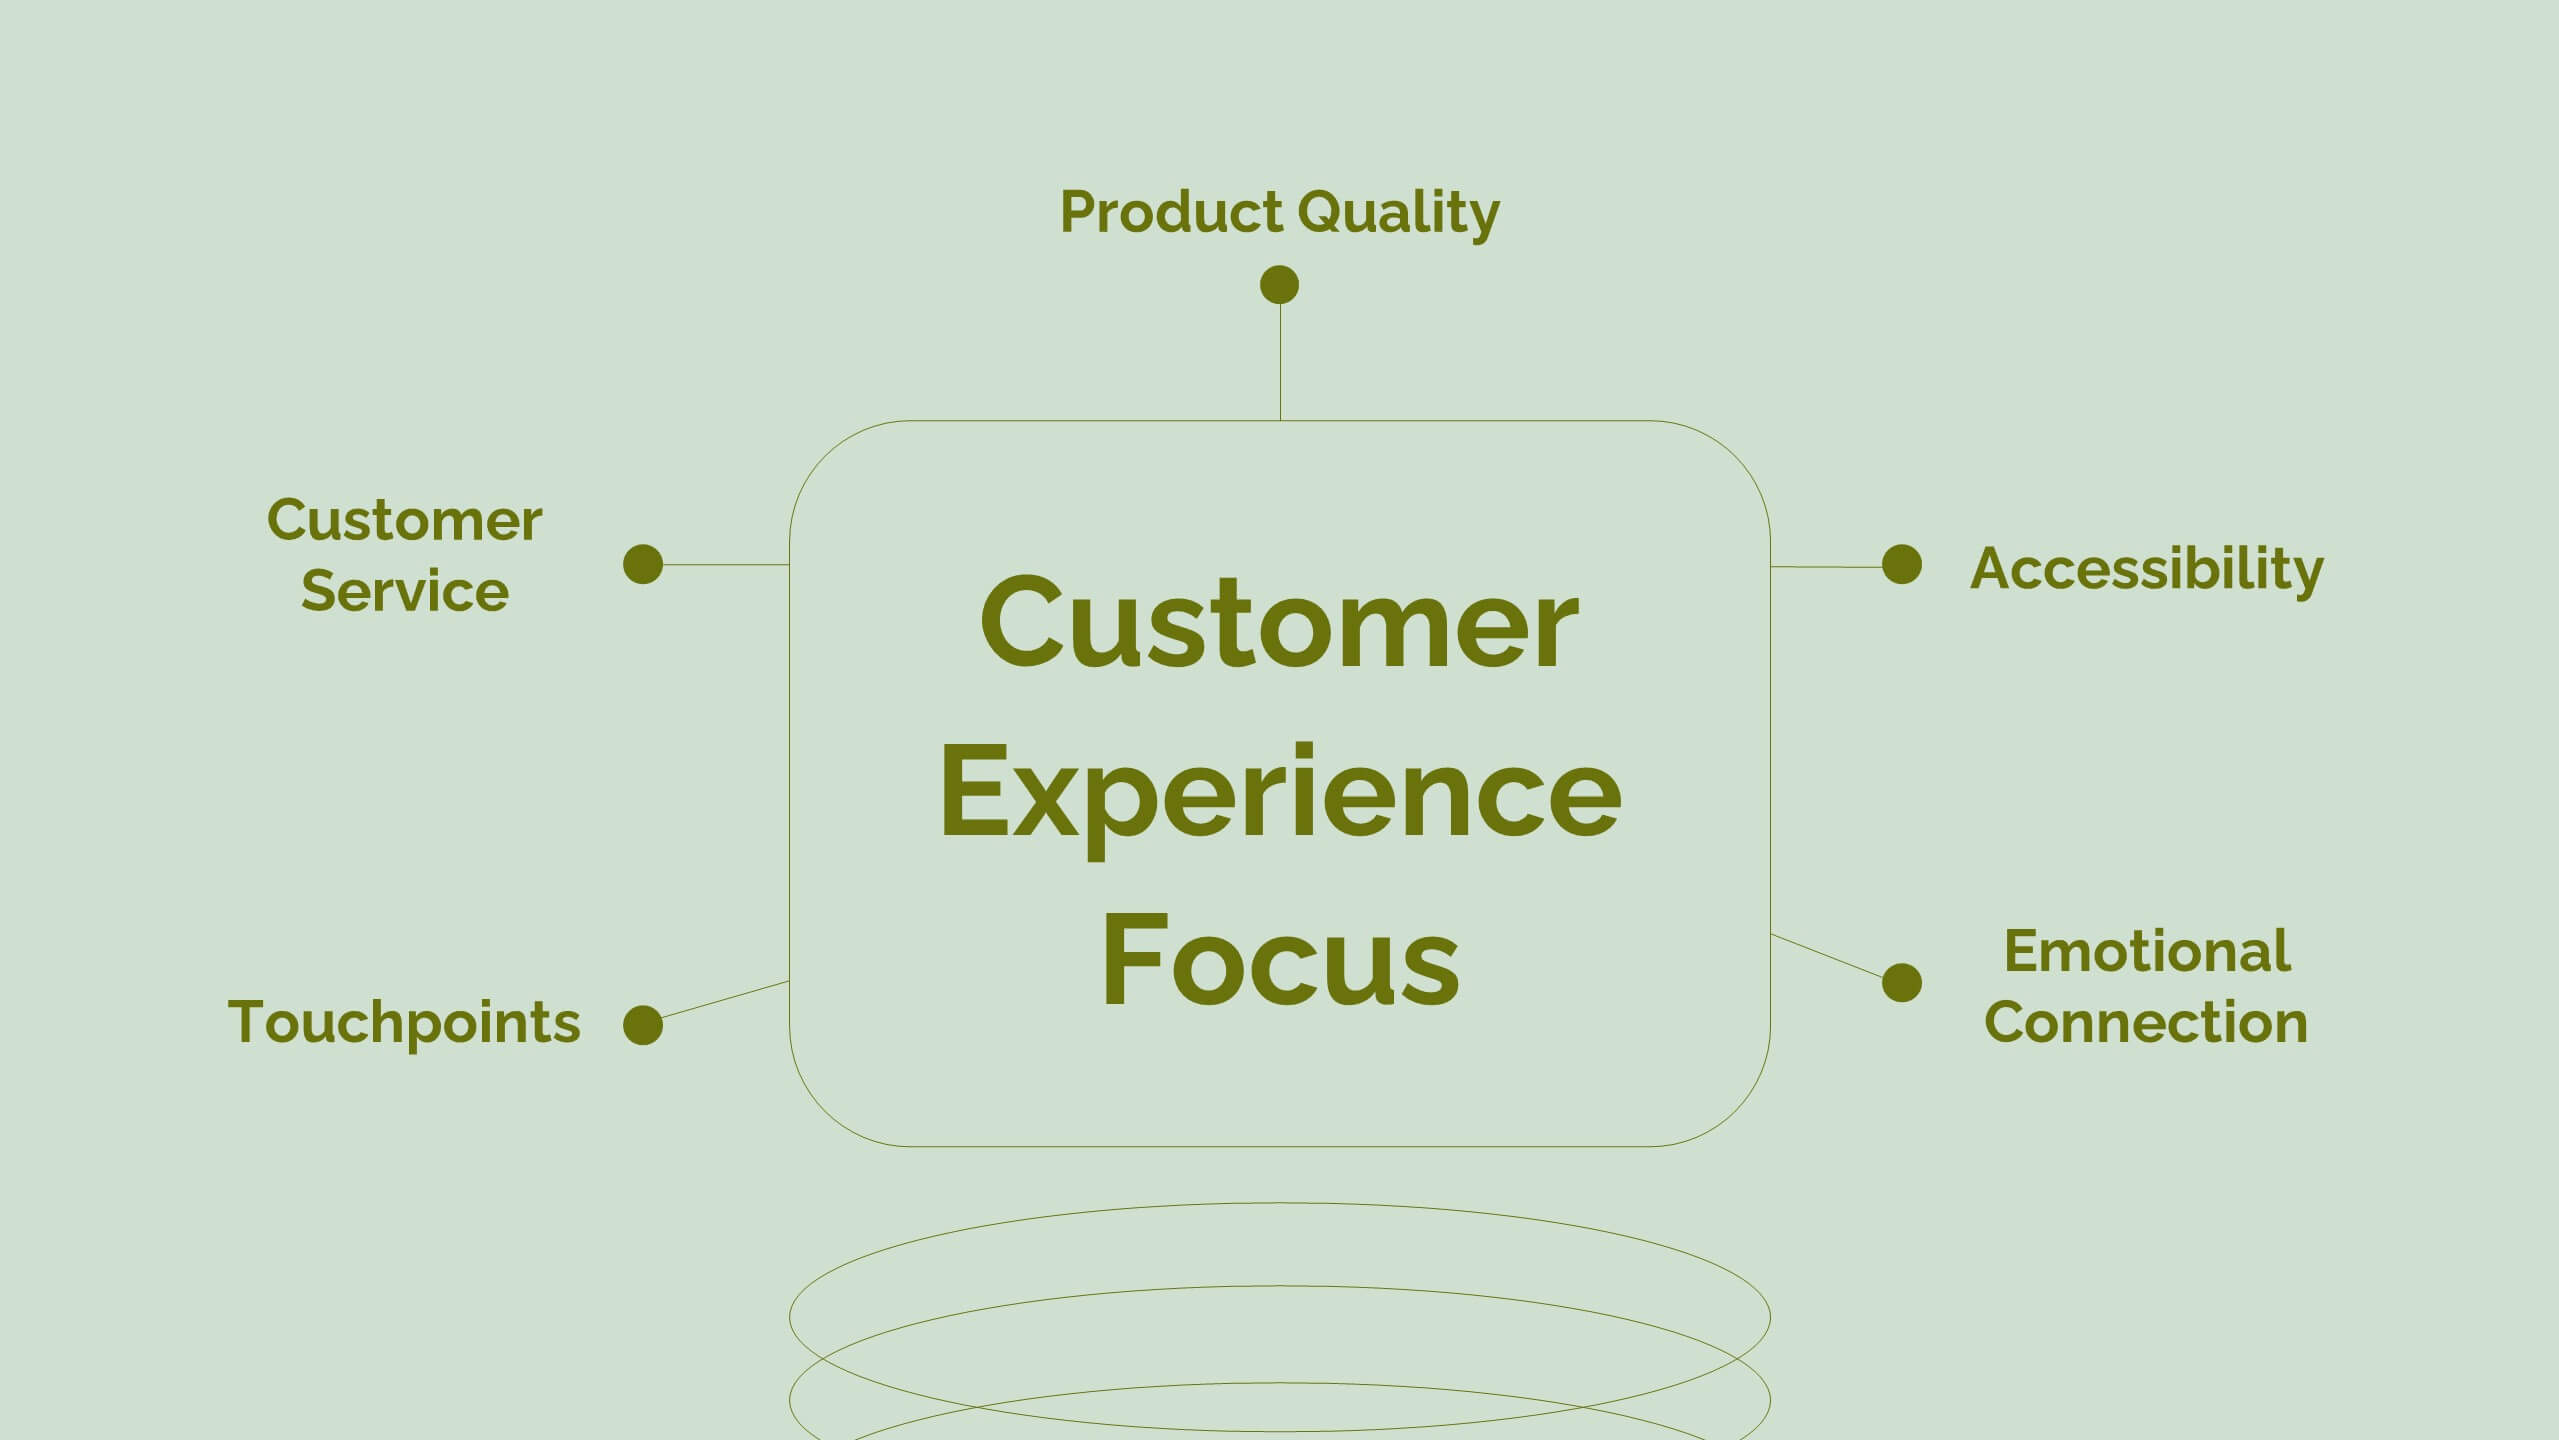
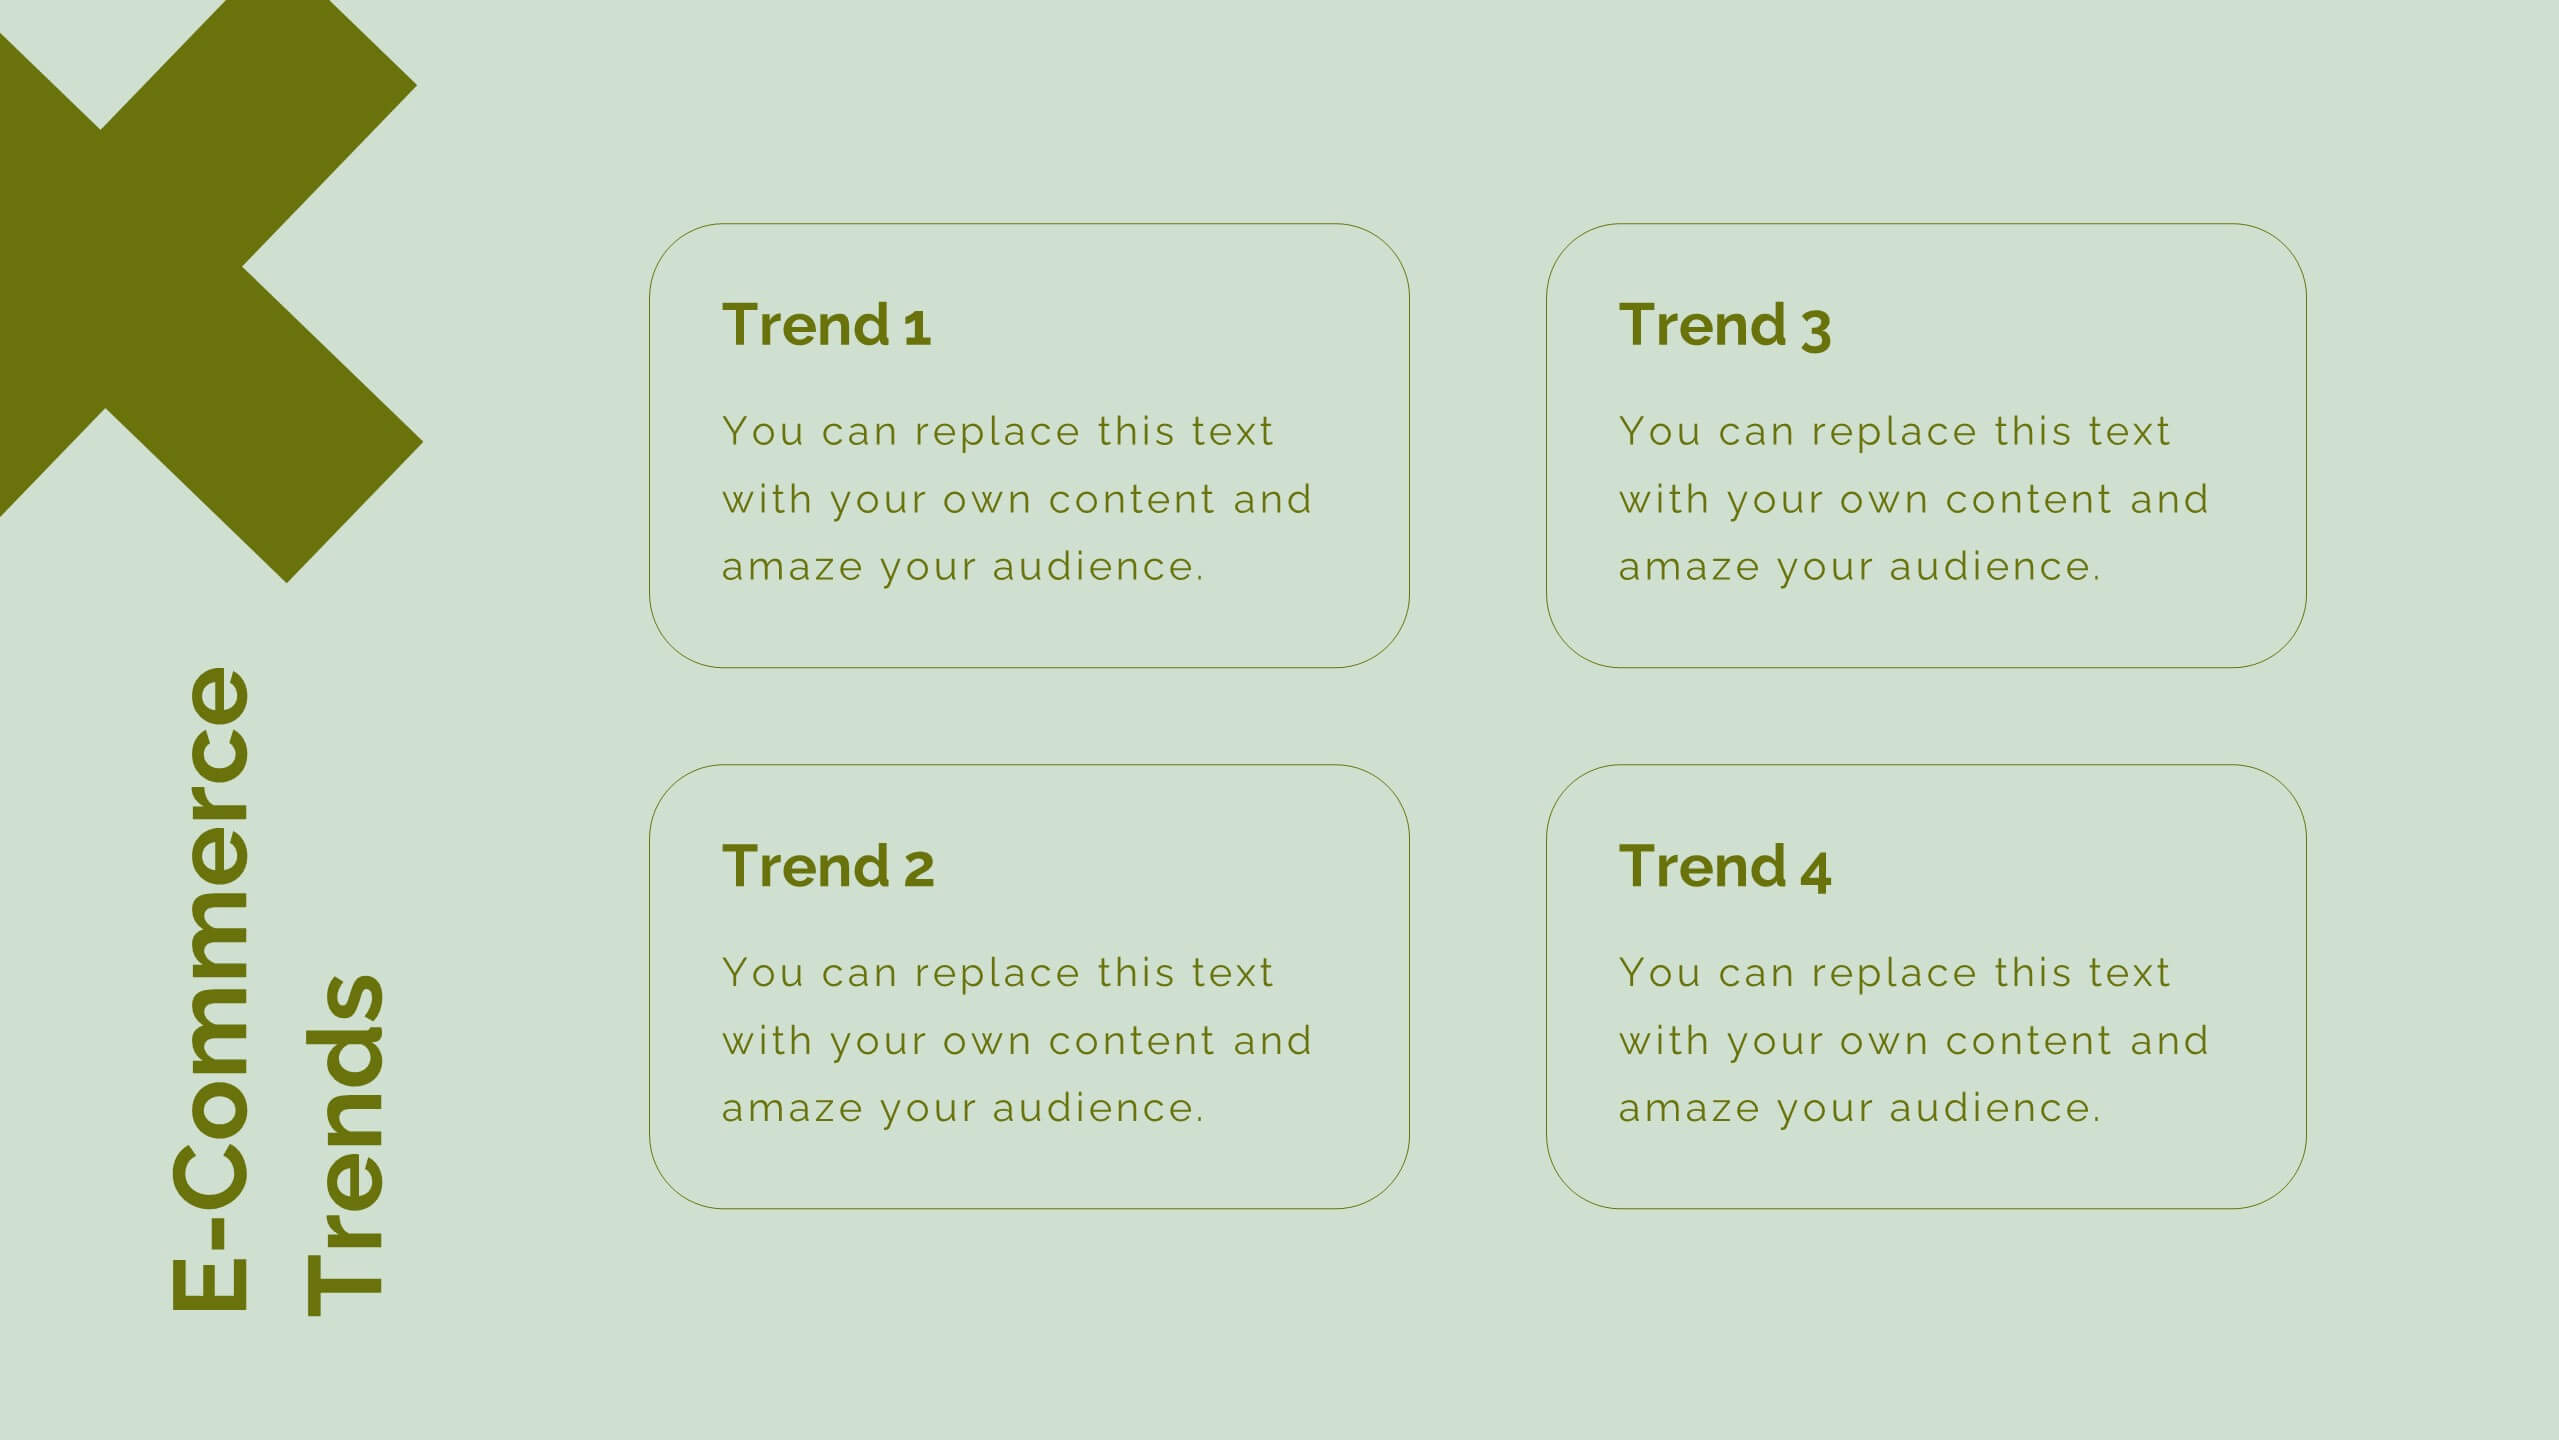
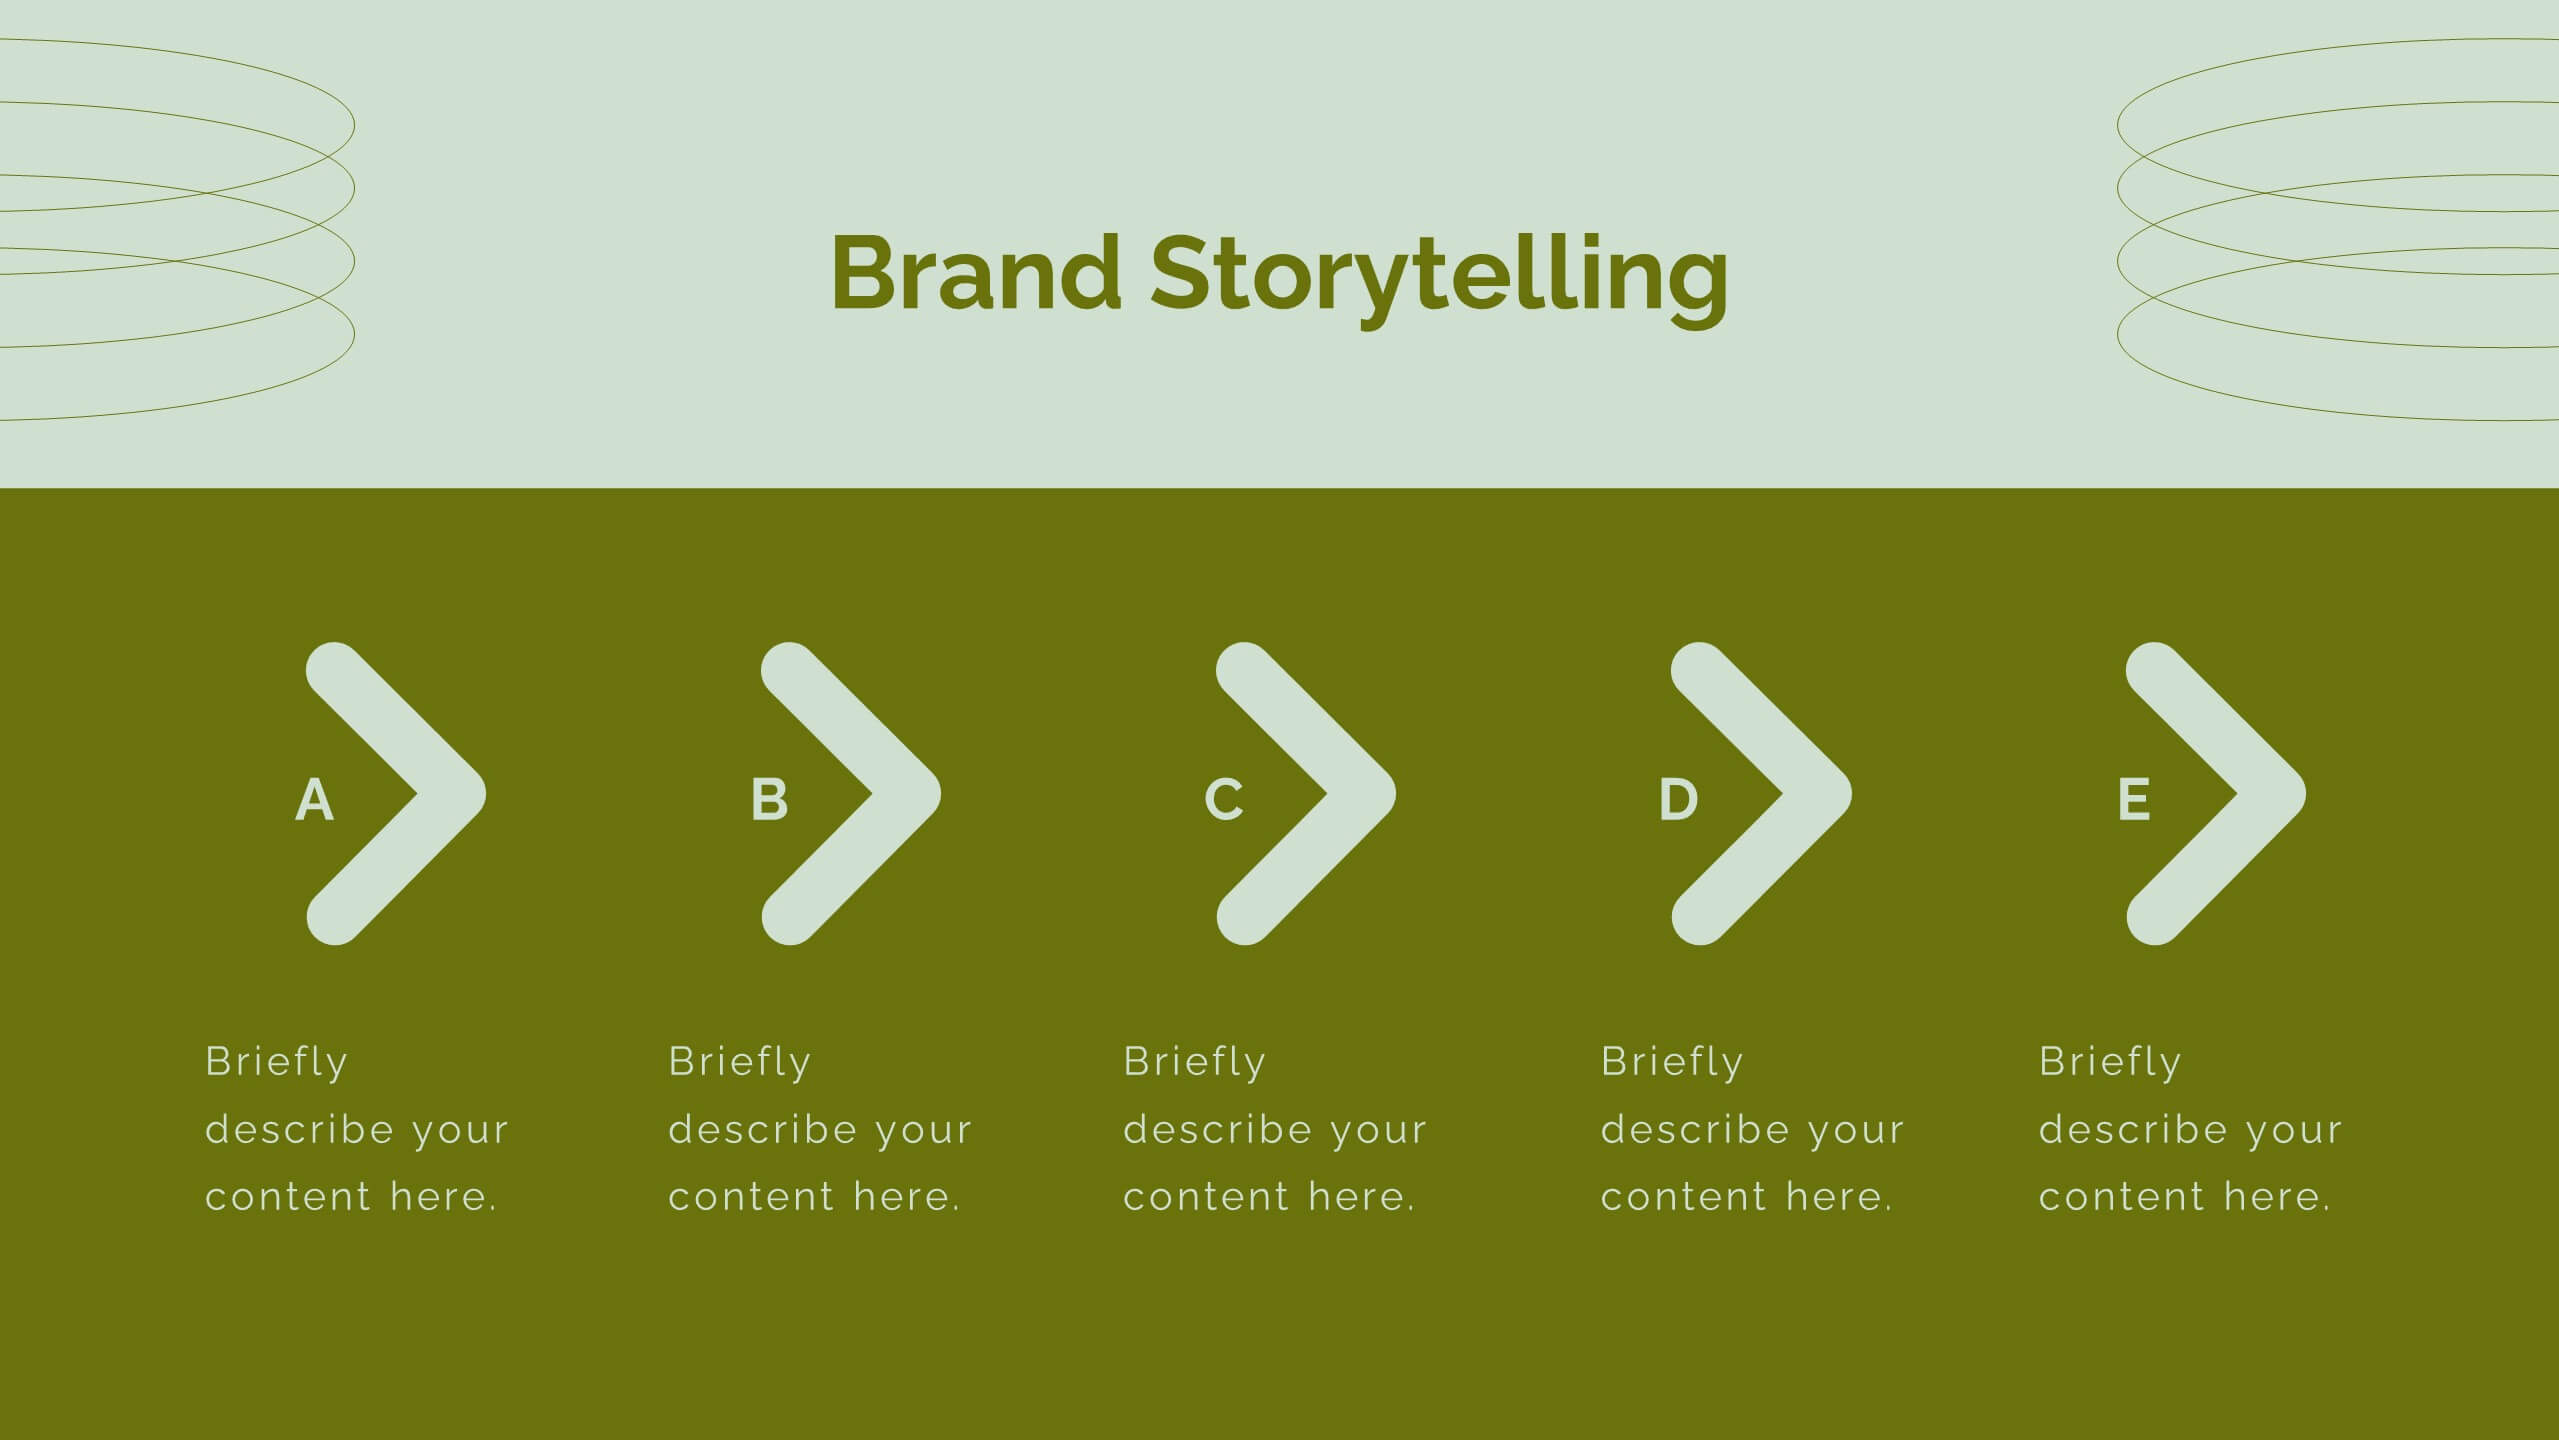
Aura Digital Marketing Strategy Plan Presentation
Revamp your digital marketing strategies with this dynamic template! Covering everything from industry overviews and consumer behavior analysis to emerging technologies and social media strategies, this template has it all. Perfect for creating compelling presentations that highlight data-driven marketing and brand storytelling. Compatible with PowerPoint, Keynote, and Google Slides.


26 diapositivas
Economic Market Analysis Simple Presentation
Delve into the dynamics of the marketplace with this professionally crafted economic market analysis presentation template. Designed for clarity and impact, it features a compelling blend of bold color blocks and fluid shapes, encapsulating the movement and rhythm of economic trends. The slides are tailored for versatility, from in-depth data visualizations like charts and graphs to conceptual diagrams and strategic layouts. High-resolution imagery of financial symbols reinforces the analytical theme, while the structured design makes complex information accessible and engaging. Whether presenting to stakeholders or students, the template promises to convey the intricacies of market forces with precision and authority. Offering seamless functionality across PowerPoint, Keynote, and Google Slides, it’s the perfect tool for anyone looking to articulate economic concepts with both confidence and sophistication. It's not just a presentation; it's a conversation starter, setting the stage for informed decision-making and insightful discussions.


6 diapositivas
Sales Associate Infographics
The "Sales Associate" infographic template is a vibrant and informative visual tool, meticulously crafted for PowerPoint, Keynote, and Google Slides. This template is an invaluable asset for retail managers, sales trainers, and marketing teams aiming to showcase the key responsibilities, skills, and performance metrics of a sales associate role. This template effectively highlights the diverse aspects of a sales associate's position, including customer service, product knowledge, sales techniques, and point-of-sale operations. It's designed to provide a comprehensive overview of the role, making it an essential tool for training new hires, setting performance standards, or enhancing sales strategies. The design is as engaging as the role itself, with a color scheme that is both lively and professional. This not only makes the presentation visually attractive but also resonates with the dynamic and customer-oriented nature of a sales associate's job. Whether used in a retail staff meeting, a training workshop, or a sales strategy session, this template ensures that the "Sales Associate" role is presented in a detailed, visually compelling, and easily understandable manner.


5 diapositivas
Process Improvement Cycle Mapping Presentation
Illustrate continuous growth and optimization with this modern process improvement cycle template. Featuring a dynamic circular flow design, it’s ideal for showcasing iterative strategies, workflow enhancements, or business development stages. Fully editable in Canva, PowerPoint, and Google Slides, it ensures clarity and professionalism in mapping each step toward better performance.


12 diapositivas
Sales Metrics Dashboard Presentation
Unlock a sharper view of your sales story with a clean, data-driven layout that highlights performance trends at a glance. This presentation organizes KPIs, charts, and progress indicators into an easy-to-follow dashboard that supports smarter decision-making. Fully compatible with PowerPoint, Keynote, and Google Slides.


12 diapositivas
Editable Chart Presentation
Present your data with impact using the Editable Chart Presentation. This versatile slide set includes colorful bar and line charts designed for performance metrics, sales growth, or budget comparisons. Easily swap out values and labels to match your story. Fully editable in PowerPoint, Keynote, Google Slides, and Canva.


5 diapositivas
Types of Pets Infographics
There are a wide variety of pets that people can choose from, depending on their preferences, lifestyle, and the level of care they are willing to provide. These infographic templates offer an engaging way to showcase different types of pets and provide valuable information to viewers. Its customizable features, visually appealing elements, and modern design make it an effective tool for educational presentations, pet-related events, or any presentation related to pet types and their characteristics. These infographics are perfect to showcase various types of pets that people can keep as companions.


4 diapositivas
Modern Transportation and Logistics Strategy Presentation
Move your audience through a fast-paced world of movement and delivery with a clean, visual slide that maps out each step of your logistics process. This layout helps explain workflows, supply chain stages, and transportation planning with clarity and ease. Fully compatible with PowerPoint, Keynote, and Google Slides.


7 diapositivas
Mission Infographic
The showcased templates are meticulously designed to articulate the mission of an organization effectively, making them an invaluable tool for any corporate or non-profit entity aiming to communicate its core purpose and objectives. Each slide is crafted to guide the audience through the foundational elements that define the company’s ethos, goals, and strategic approaches. These templates feature a clean and professional layout, incorporating subtle design elements that draw attention without overwhelming the content. They utilize a harmonious blend of typography, iconography, and spacing, which helps in making the presentation not only visually appealing but also highly readable. The versatility of these templates allows them to be adapted for various contexts, whether it's part of an employee onboarding packet, investor presentations, or external company introductions. The color schemes and design motifs can be customized to align with specific brand guidelines, ensuring consistency across all corporate communications. By employing these slides, organizations can effectively communicate their mission, foster a cohesive understanding among stakeholders, and reinforce their commitment to their foundational values and objectives. This not only enhances internal morale but also strengthens the organization’s image externally, making these templates a strategic asset for any business.