


Características


¿Tienes alguna pregunta?
Recomendar


7 diapositivas
Circle Chart Infographic Presentation
This unique design incorporates both circular and star-shaped elements to convey information in charts. Whether your goal is to showcase market shares, highlight trends, or simply enhance your academic presentation, this infographic will help you achieve it. You can edit this template without any need of design skills or technical knowledge. This presentation includes 7 slides, chart shapes with colors and fonts, all fully customizable. This template is an excellent choice for presenting content on any topic, in a circular format. Simply put your data on the design, add a title, and you're done!


5 diapositivas
Team Goals and Alignment Strategy Presentation
Align your team with clarity using the Team Goals and Alignment Strategy Presentation. This slide visually connects individual roles to a central target, making it ideal for showcasing strategic alignment, shared objectives, or team contributions. Fully customizable in Canva, PowerPoint, or Google Slides for seamless team planning.


6 diapositivas
Product Development Cycles Presentation
A great product starts with a clear, engaging story—this presentation brings that journey to life. It outlines each stage of the development cycle in a simple, visual flow that helps teams communicate progress, milestones, and next steps. Perfect for strategy, planning, and updates. Fully compatible with PowerPoint, Keynote, and Google Slides.


5 diapositivas
Employee Training Needs Skills Gap Presentation
Optimize Workforce Training with a Skills Gap Analysis! The Employee Training Needs Skills Gap template helps HR teams, trainers, and managers visualize skill gaps, assess employee competencies, and align training programs with business goals. Featuring an interactive dot matrix layout, this template enables clear comparisons across skill areas, ensuring targeted and efficient upskilling strategies. Fully customizable in PowerPoint, Keynote, and Google Slides, it streamlines workforce development planning for maximum impact and growth.


4 diapositivas
Workforce Skills Gap Analysis
Spot the gap. Bridge the skills. This Workforce Skills Gap Analysis slide helps visualize the journey from your team’s current capabilities to their desired performance level, with a clear action plan in between. Fully editable and works seamlessly in PowerPoint, Keynote, and Google Slides.


3 diapositivas
Financial Cost Management Strategies
Break down your financial action plan with the Financial Cost Management Strategies Presentation. Featuring a dynamic 3-step arc design, this template is ideal for illustrating cost-saving initiatives, expense control methods, or phased budget implementation strategies. Each curved step includes space for icons, step numbers, titles, and concise descriptions, making it easy to communicate each stage clearly. Fully editable in PowerPoint, Keynote, and Google Slides, it’s perfect for finance teams, consultants, or operations leaders.


34 diapositivas
Bootstrapping Pitch Deck
Introducing our Bootstrapping Pitch Deck presentation! This template is designed to help you create a compelling pitch deck for your startup or business. With its minimal and modern design, this template will help you communicate your approach and showcase your business to potential investors, partners, or stakeholders. The slides are designed with a minimalist layout that allows for easy comprehension and emphasizes the key points of your pitch. The visuals, such as charts, graphs, and icons, are strategically used to convey information in a visually engaging manner and support your key messages. This template is fully customizable.


7 diapositivas
Investment Infographic Presentation Template
This Investment Infographic template is a professionally designed presentation made to present your ideas in an easy to understand format. This template features a professional design, easy color customization and a number of other useful elements to help you create an amazing infographic. This template is designed to include a variety of charts and graphs to visually demonstrate key points, and incorporates animated elements that make it more interesting for the viewer. This is the perfect presentation to introduce your company's investment portfolio to potential investors.


6 diapositivas
Simple Workflow Process Presentation
Streamline your workflow presentations with this Simple Workflow Process template. Featuring a clean, step-by-step layout with intuitive lightbulb icons, it effectively visualizes processes. Fully customizable with editable colors, icons, and text to match your branding. Compatible with PowerPoint, Keynote, and Google Slides for effortless integration into your presentations.


7 diapositivas
Six Sigma Methodology Infographic Presentation Template
Our Six Sigma Methodology template is a great way to start any project. This can be used as a guideline to create the foundations of the Six Sigma model and allow you to think about how to approach your project in terms of how it will be analyzed, making it easier for people working on the same projects to analyze their own results and make sure they are all aligned with the core principles of Six Sigma. With our Six Sigma Methodology template, you can easily organize and manage your entire process. Using this template will save you time and allow you to get more work done in less time.


6 diapositivas
Circular Wheel Diagram Presentation
Bring motion and balance to your ideas with this clean, circular design that connects every element in a seamless flow. Ideal for showcasing continuous processes, team dynamics, or strategic cycles, it keeps your message clear and engaging. Fully compatible with PowerPoint, Keynote, and Google Slides for easy editing.


6 diapositivas
Project Timeline Calendar Presentation
Kick your planning into high gear with a clean, colorful layout that makes tracking progress feel effortless. This presentation helps you map tasks across the week, visualize timelines, and communicate project schedules with absolute clarity. It’s fully editable and works seamlessly in PowerPoint, Keynote, and Google Slides.
21 diapositivas
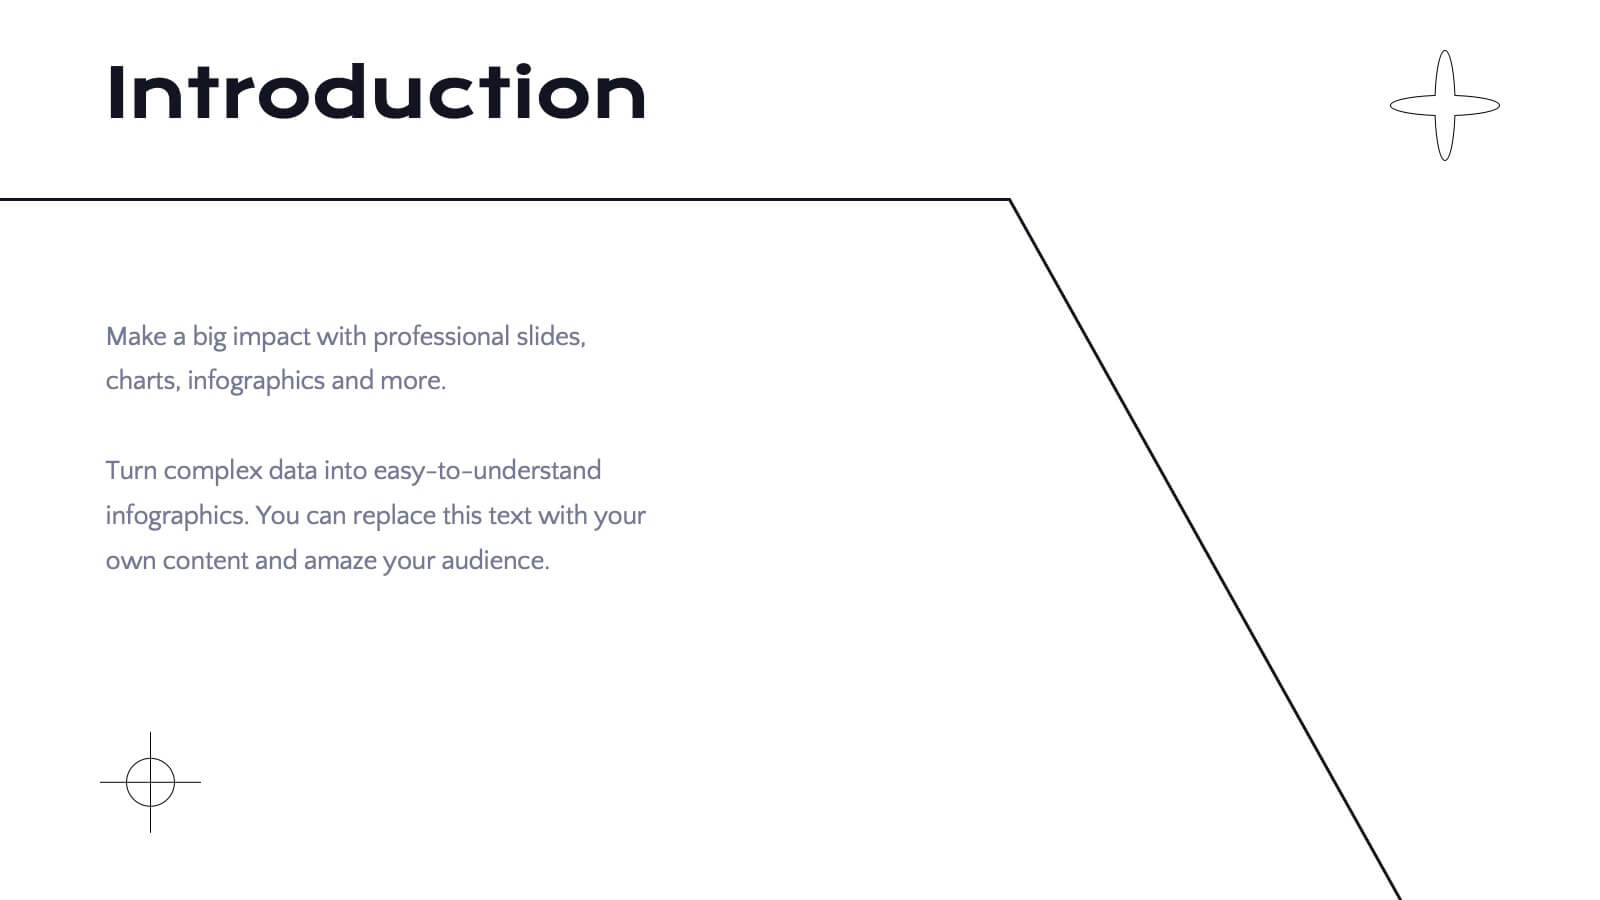
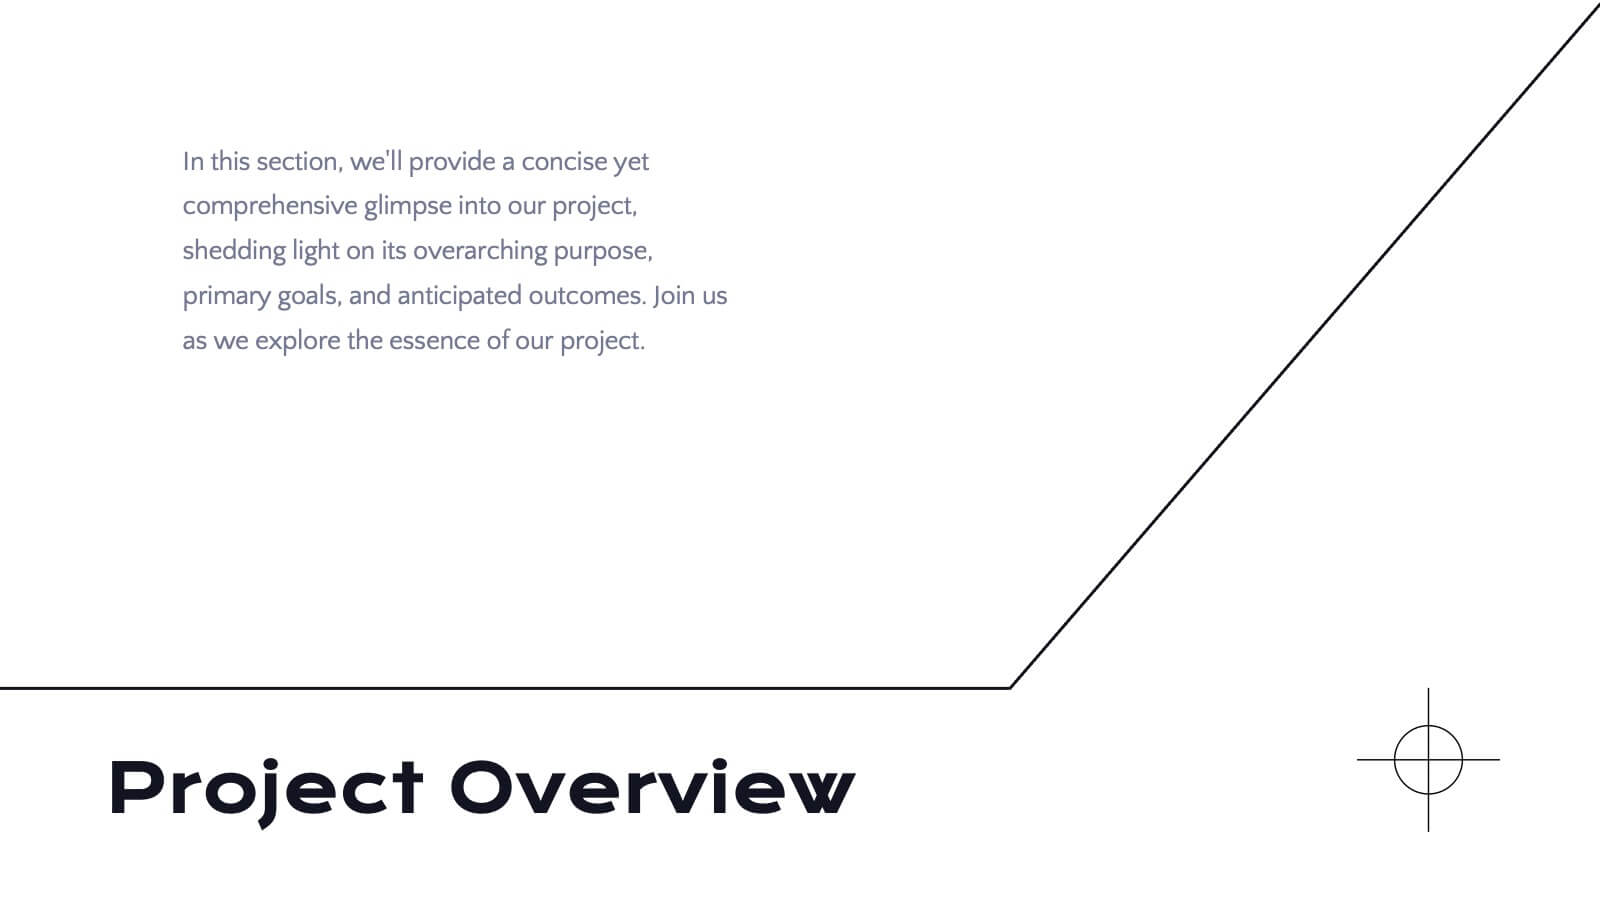
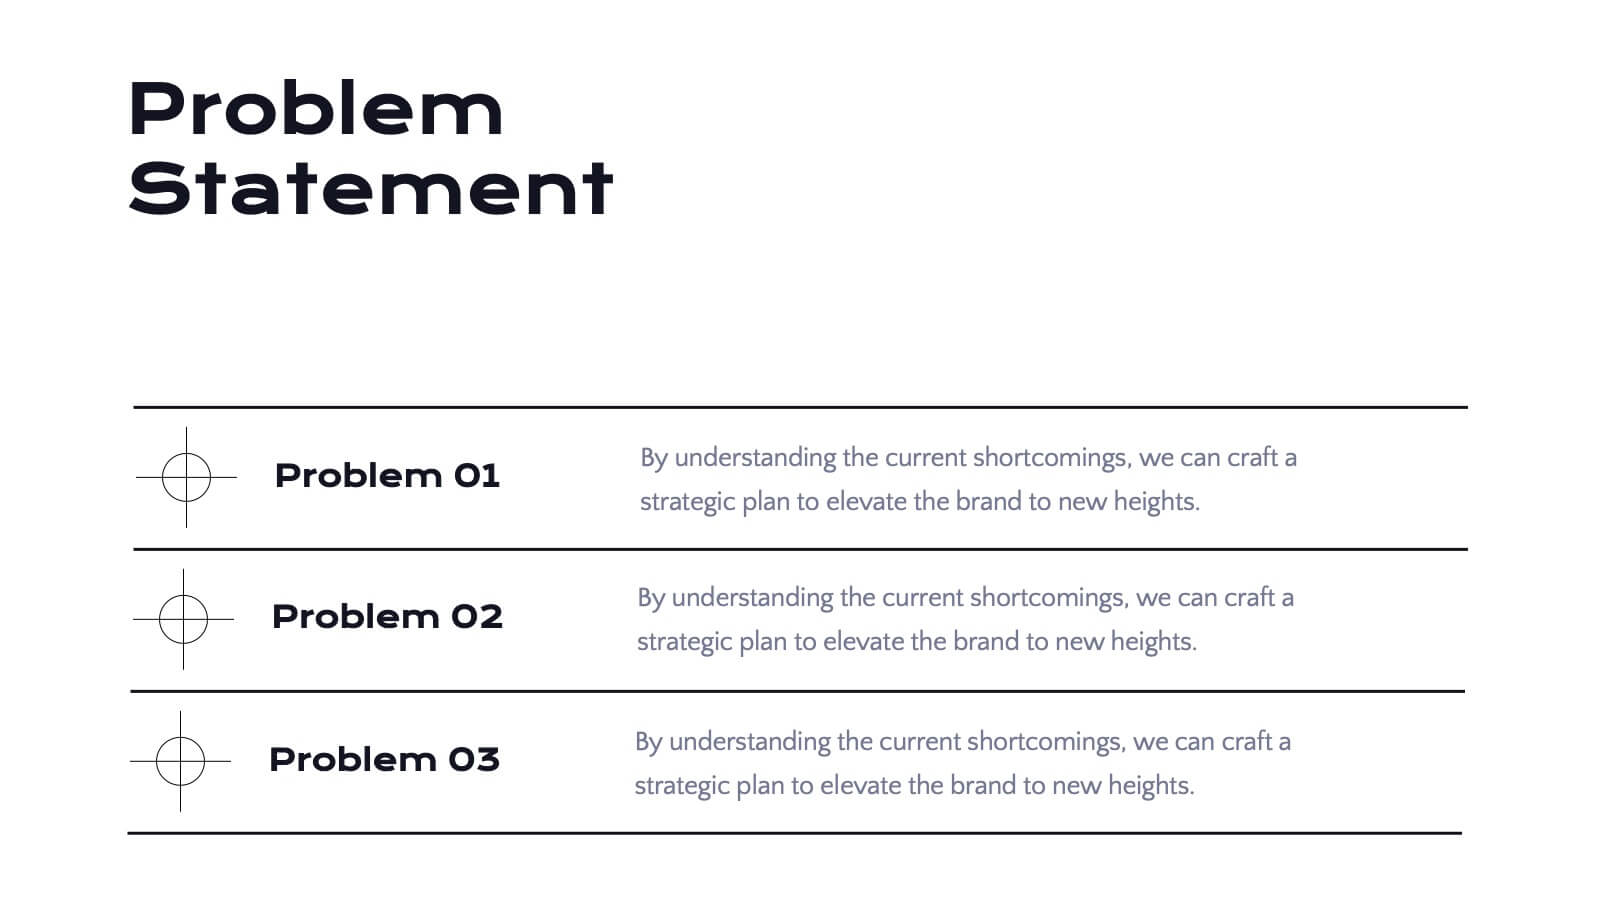
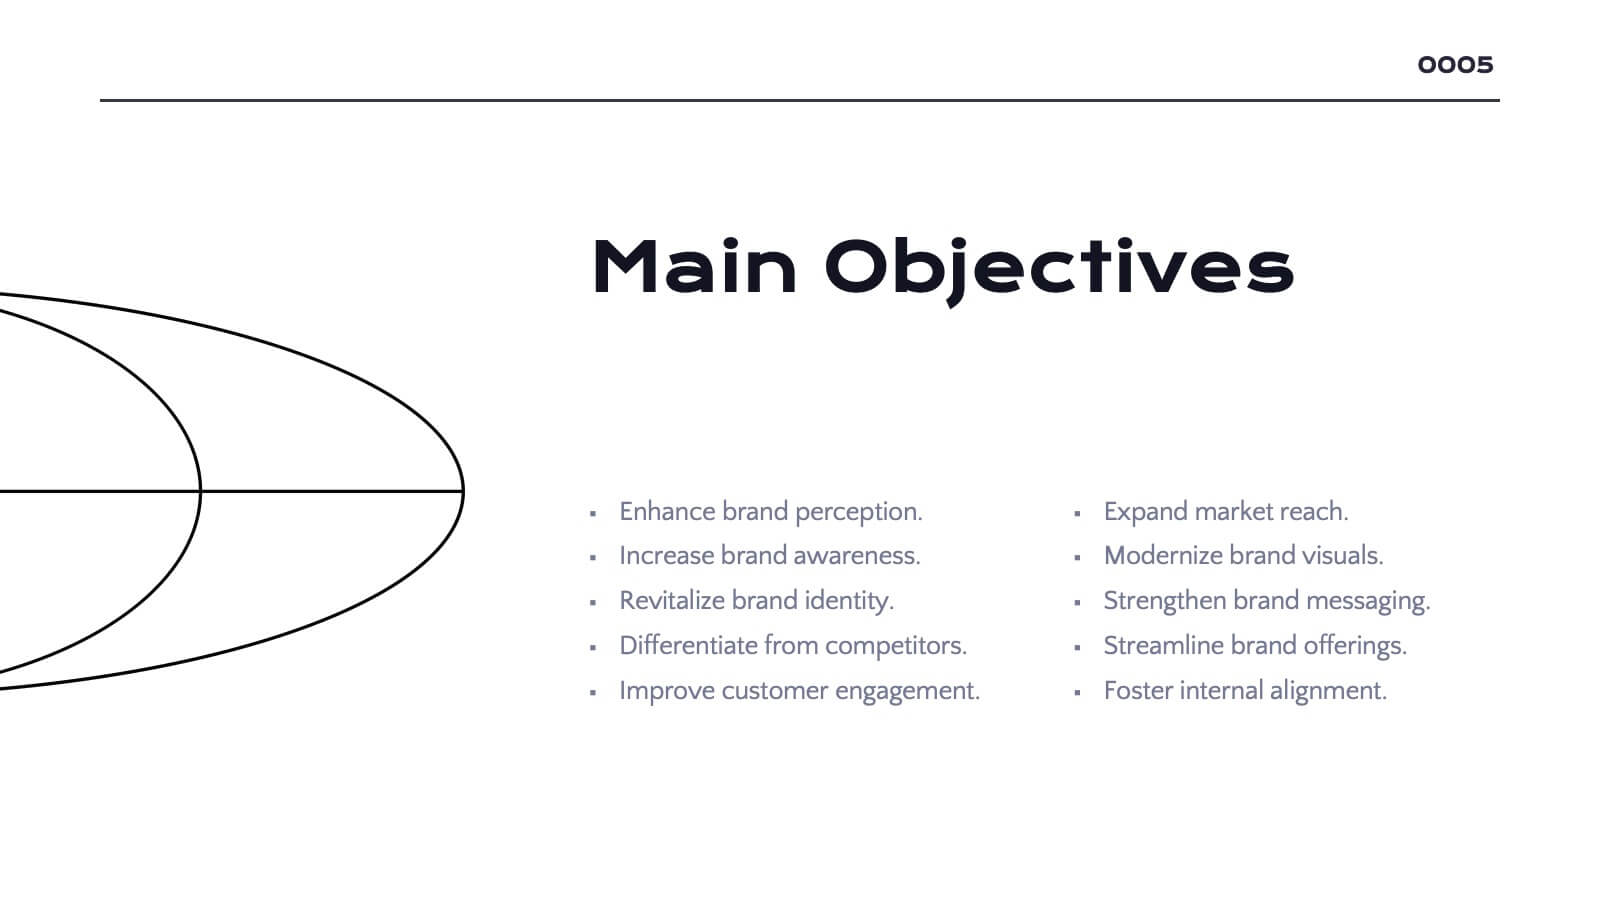
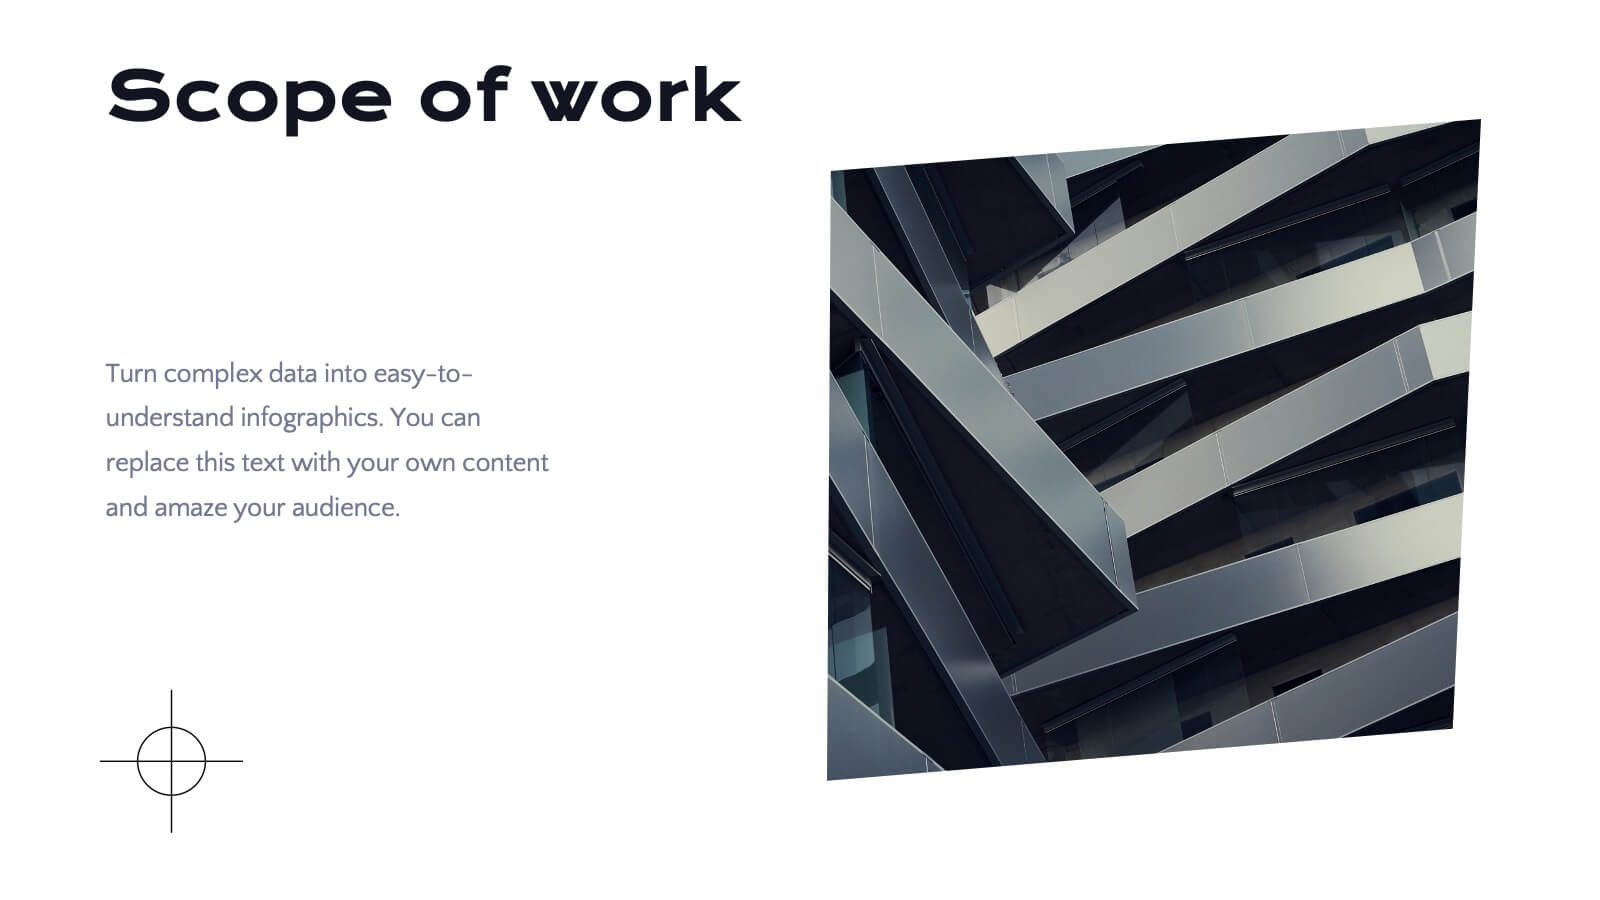
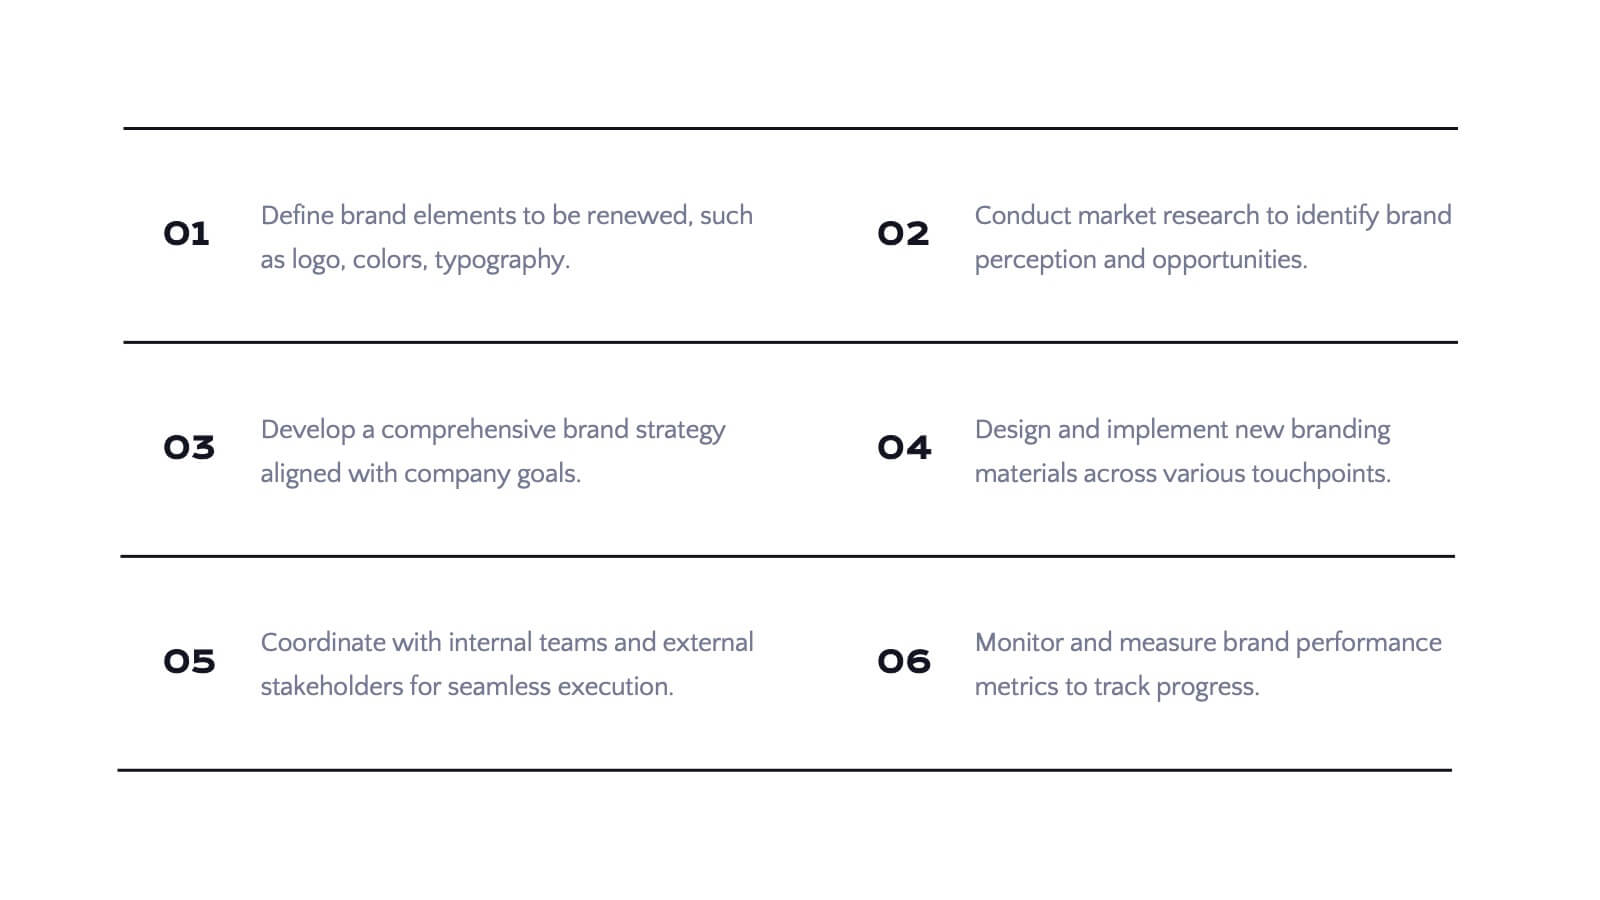
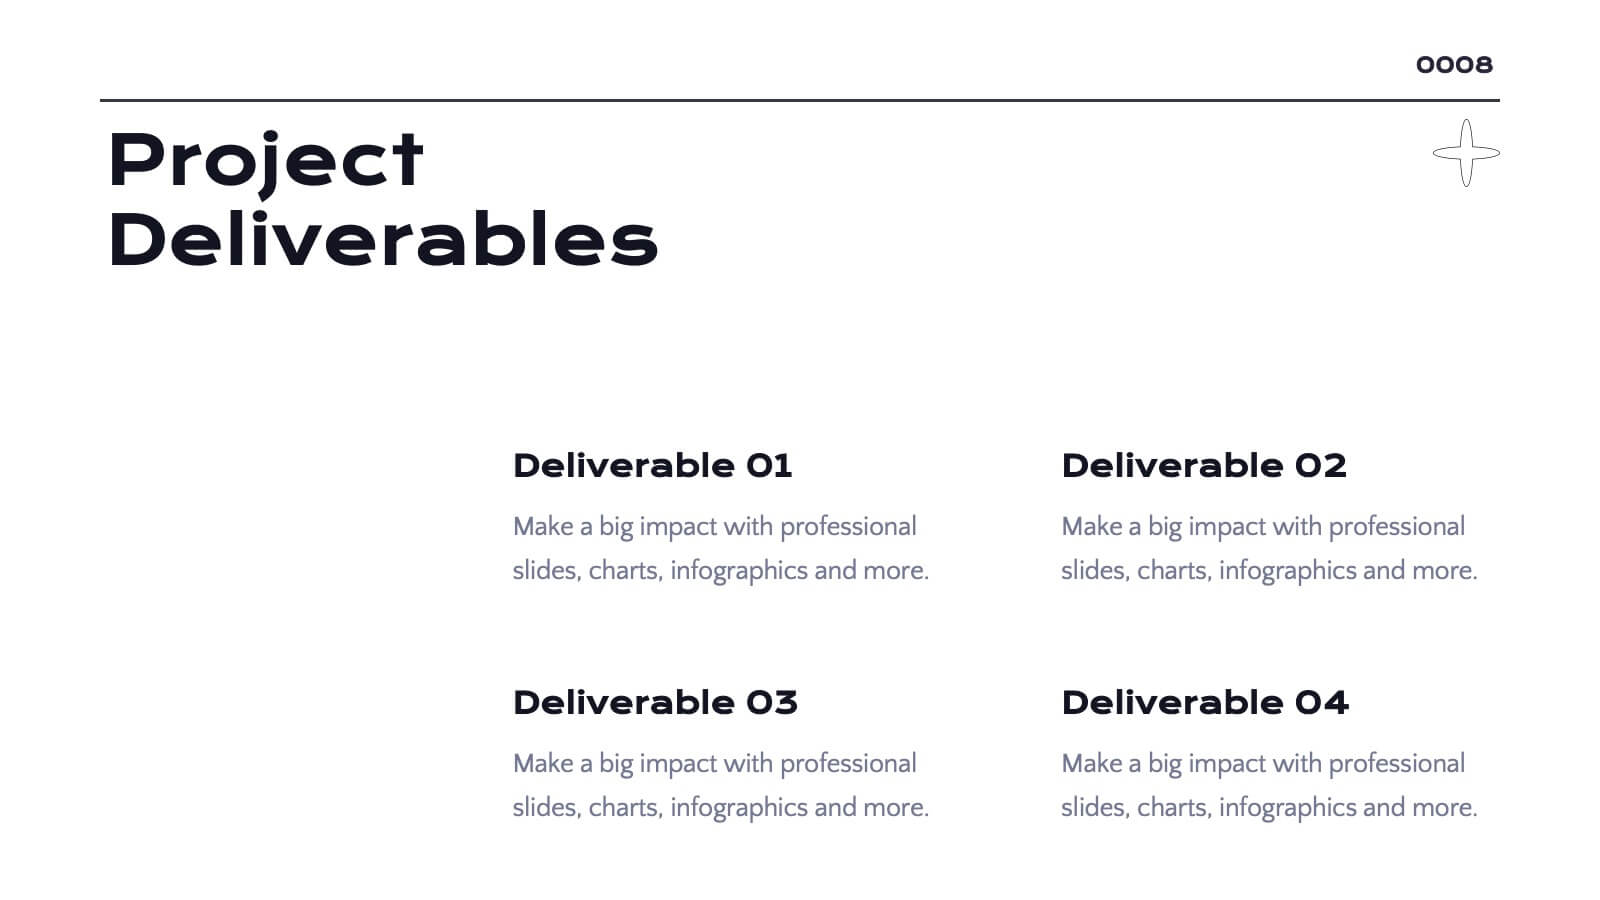
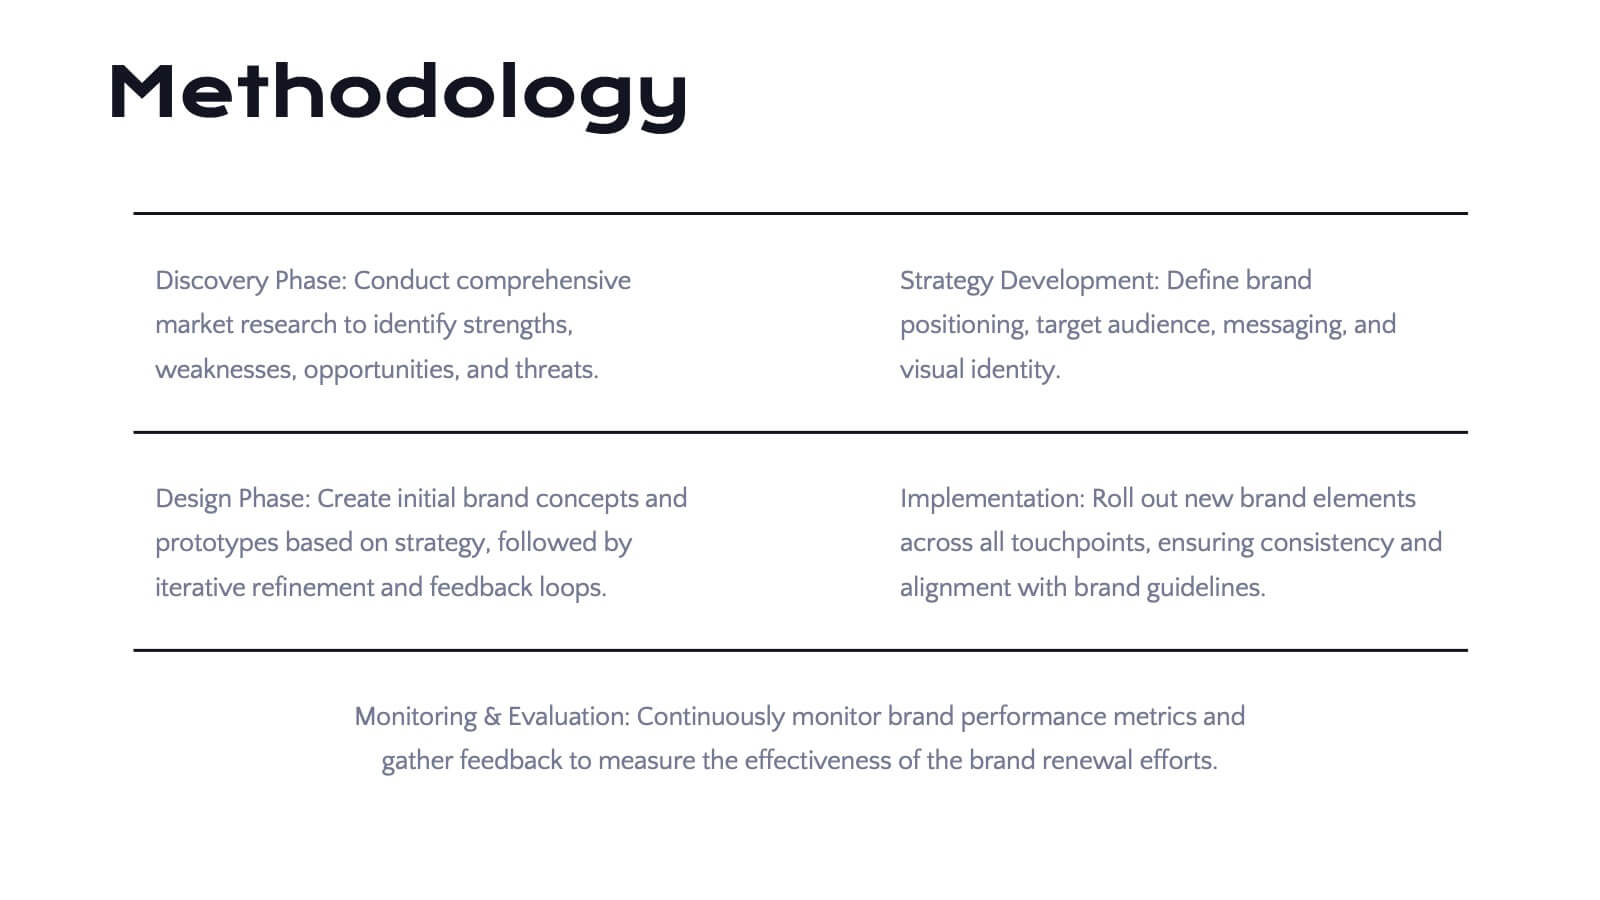
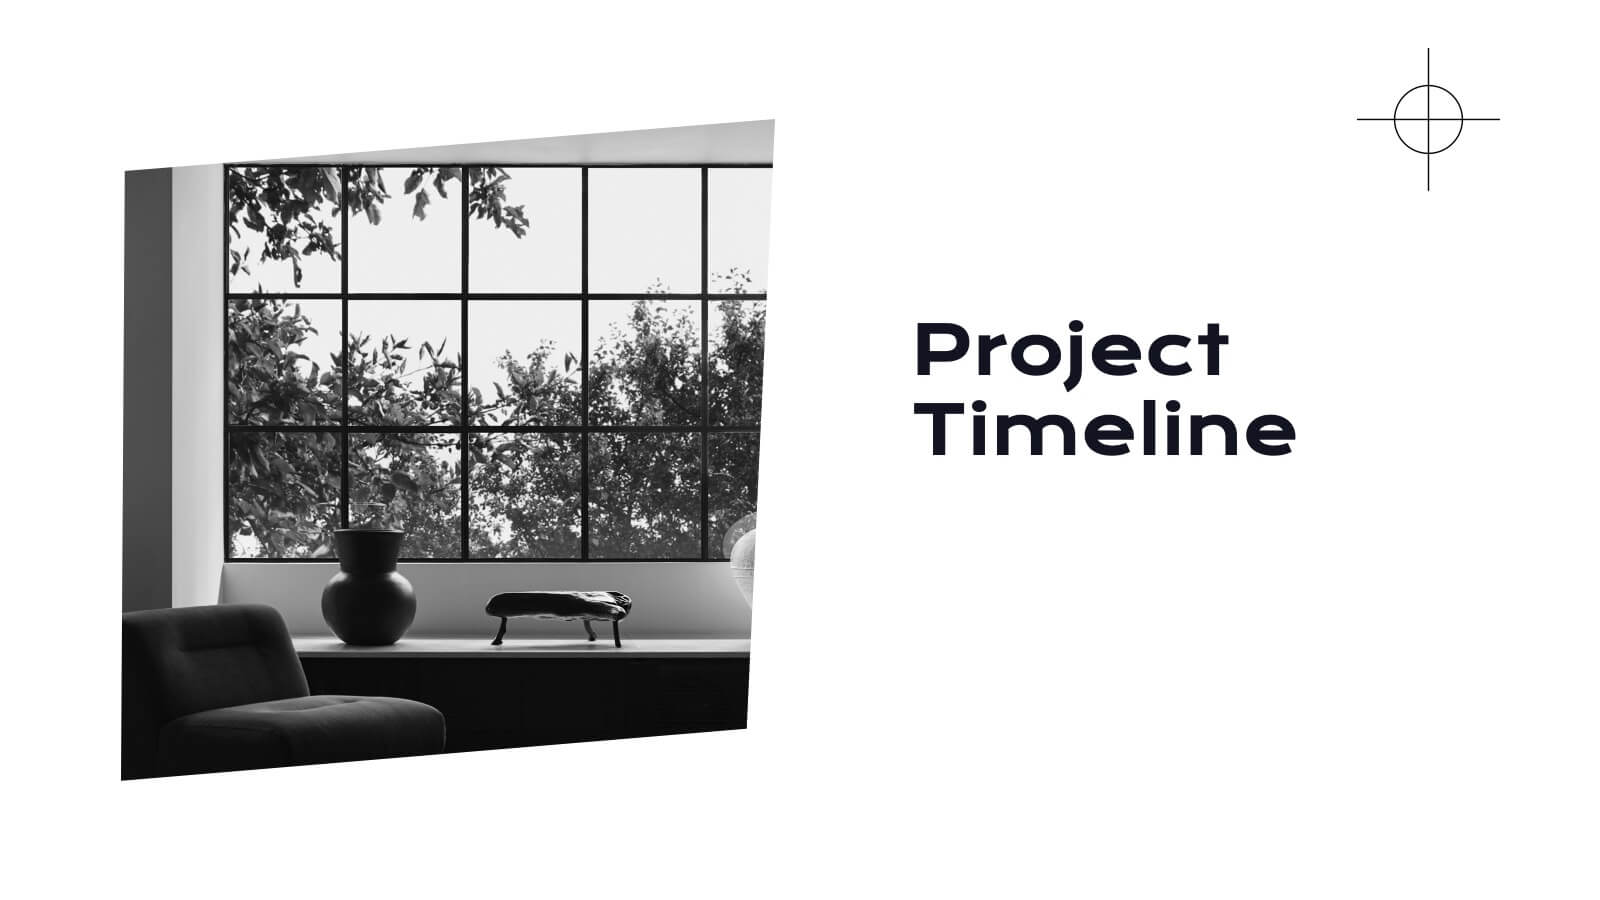
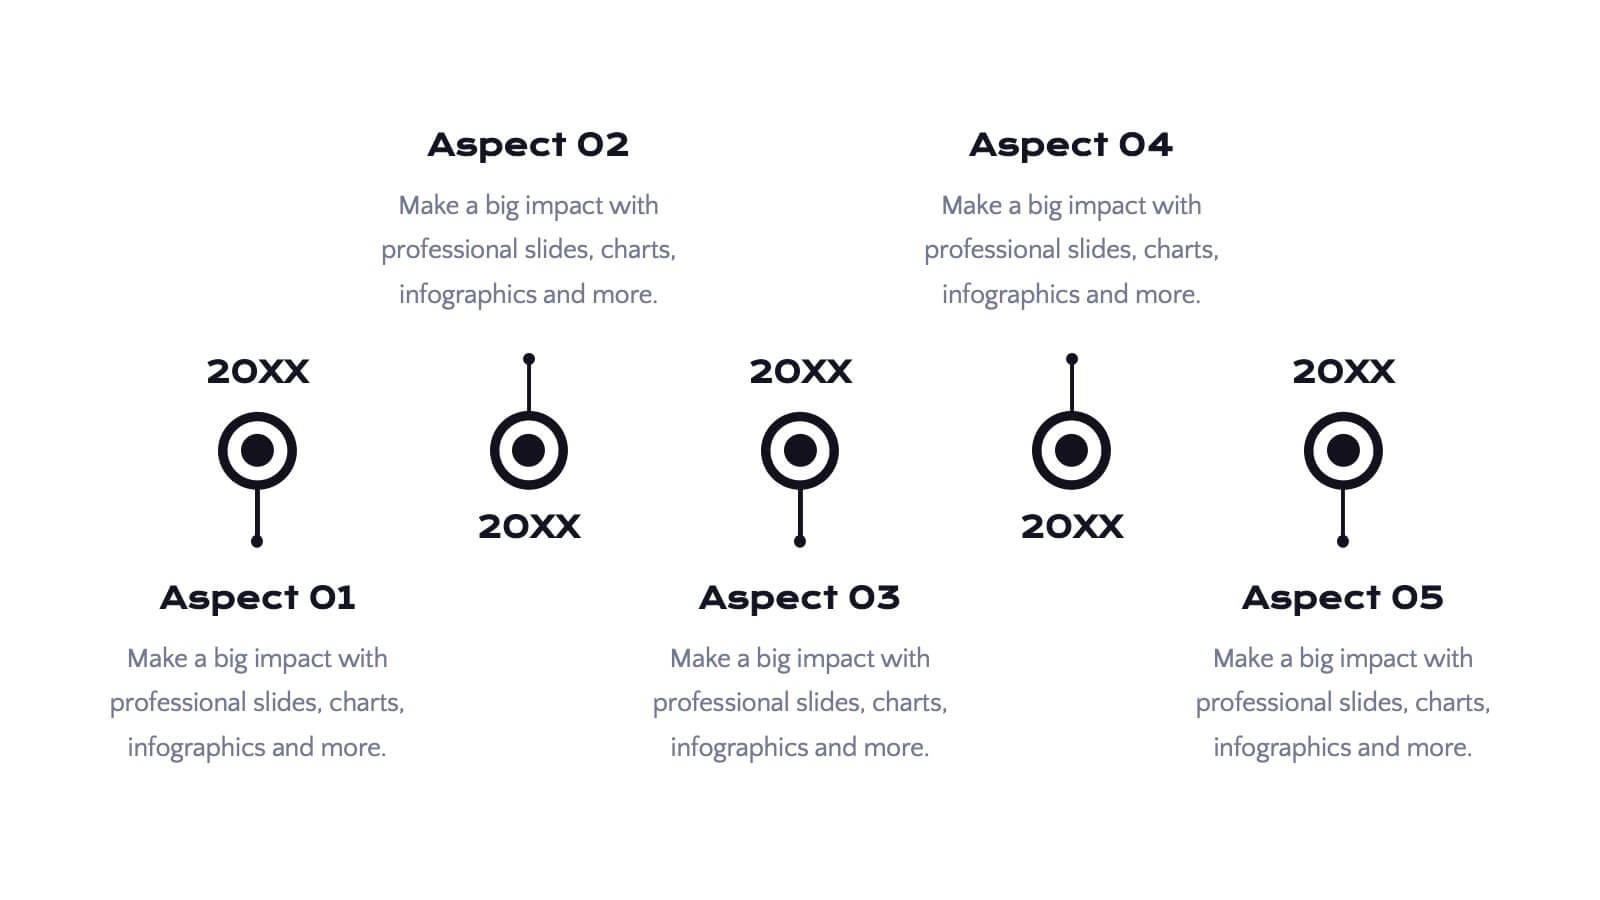
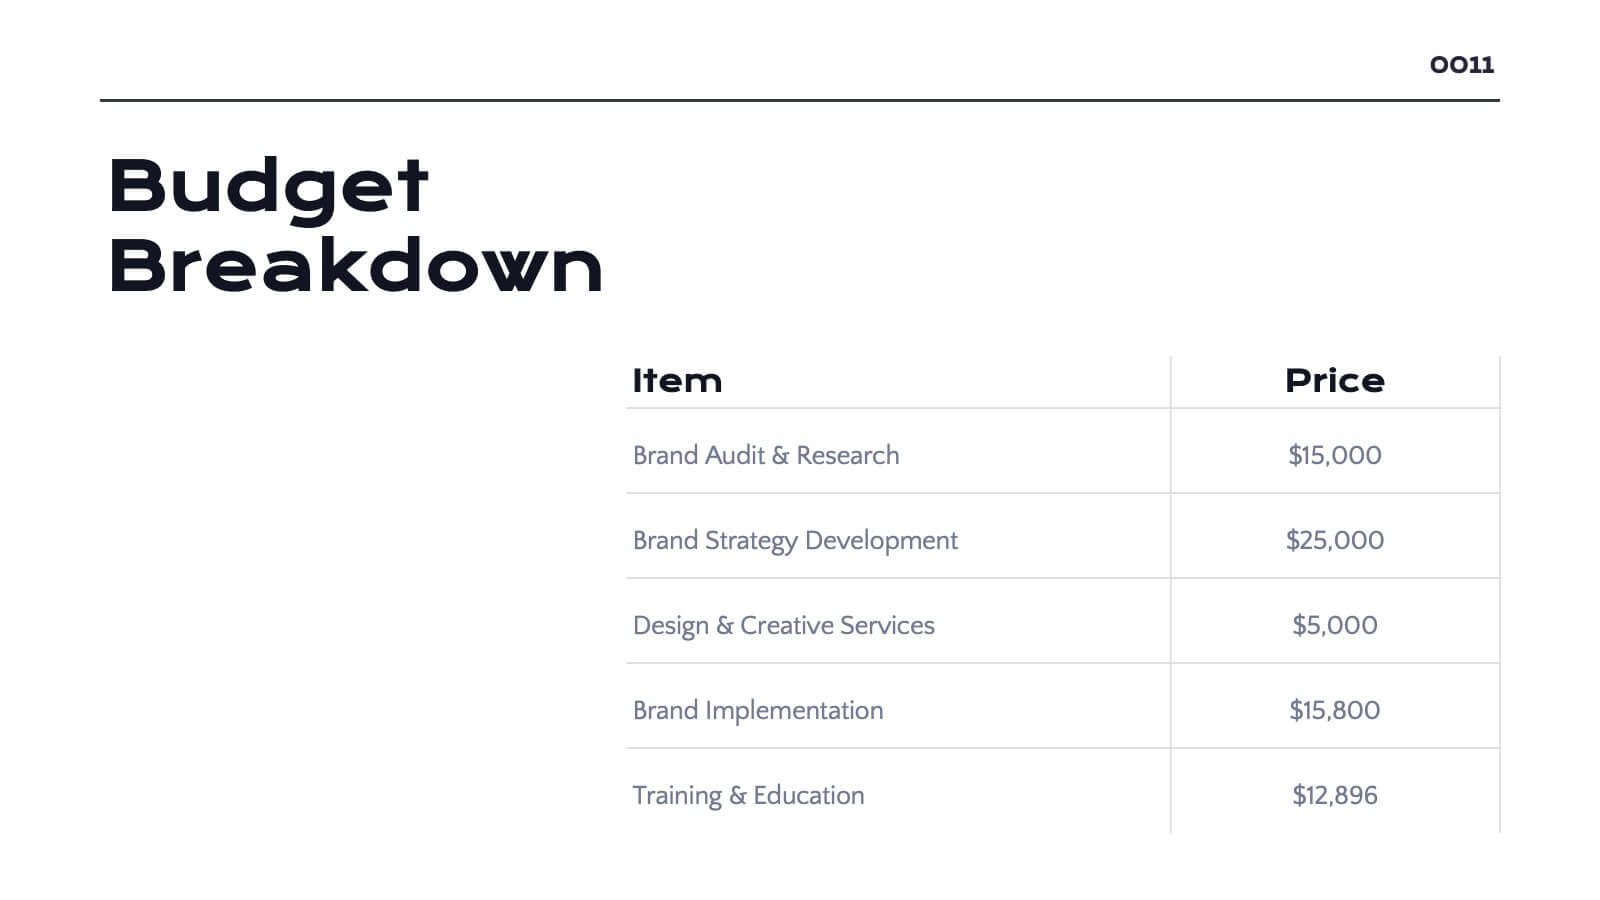
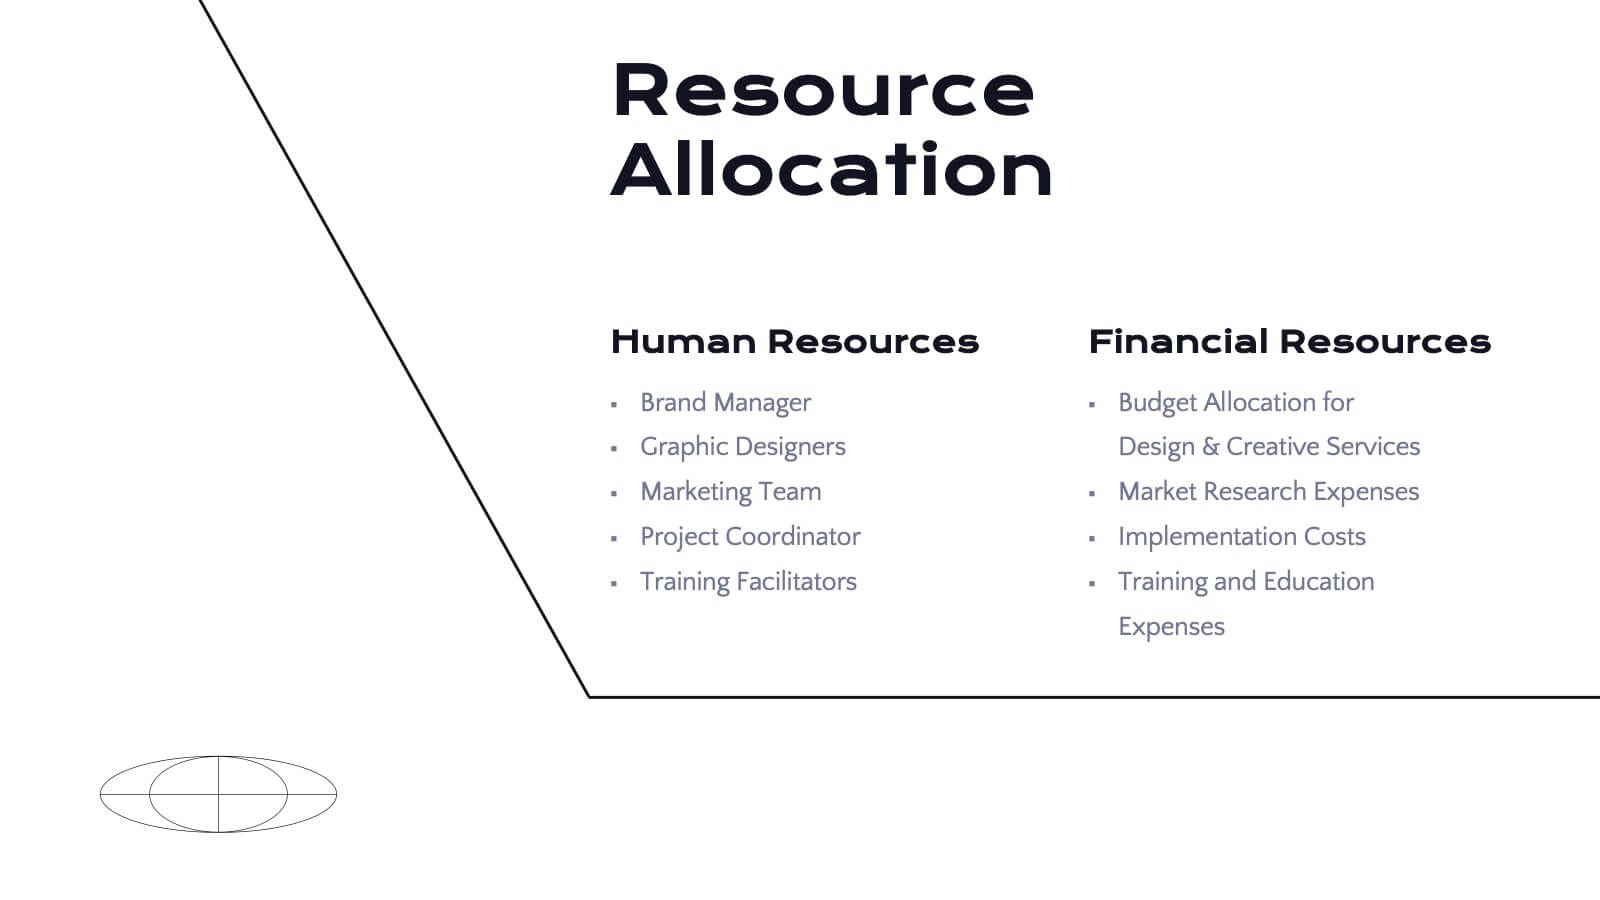
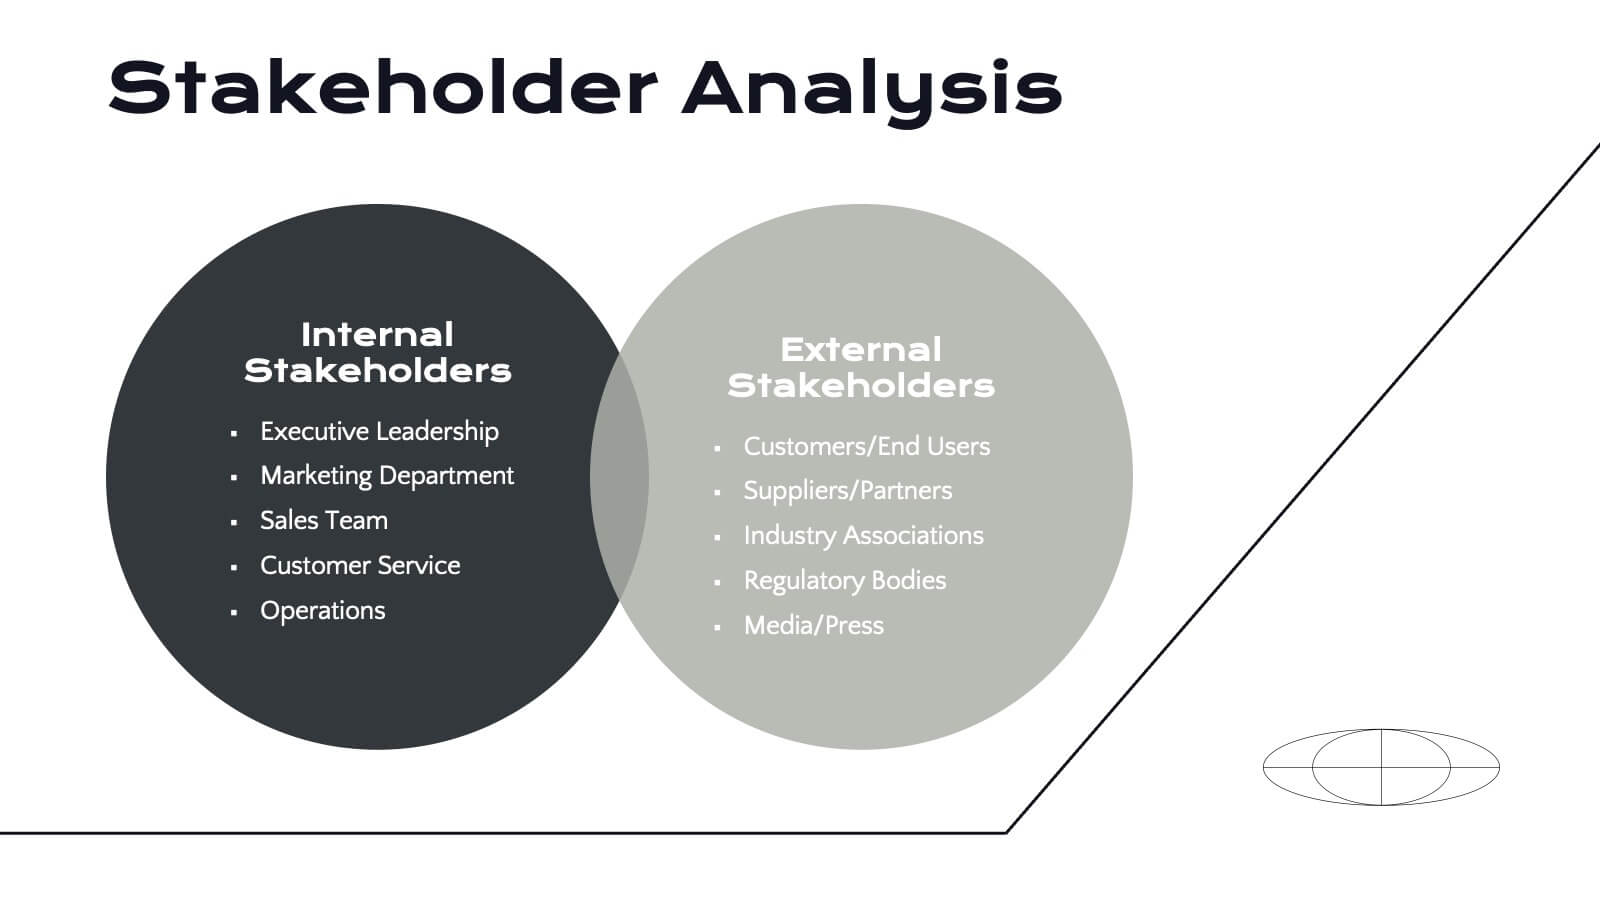
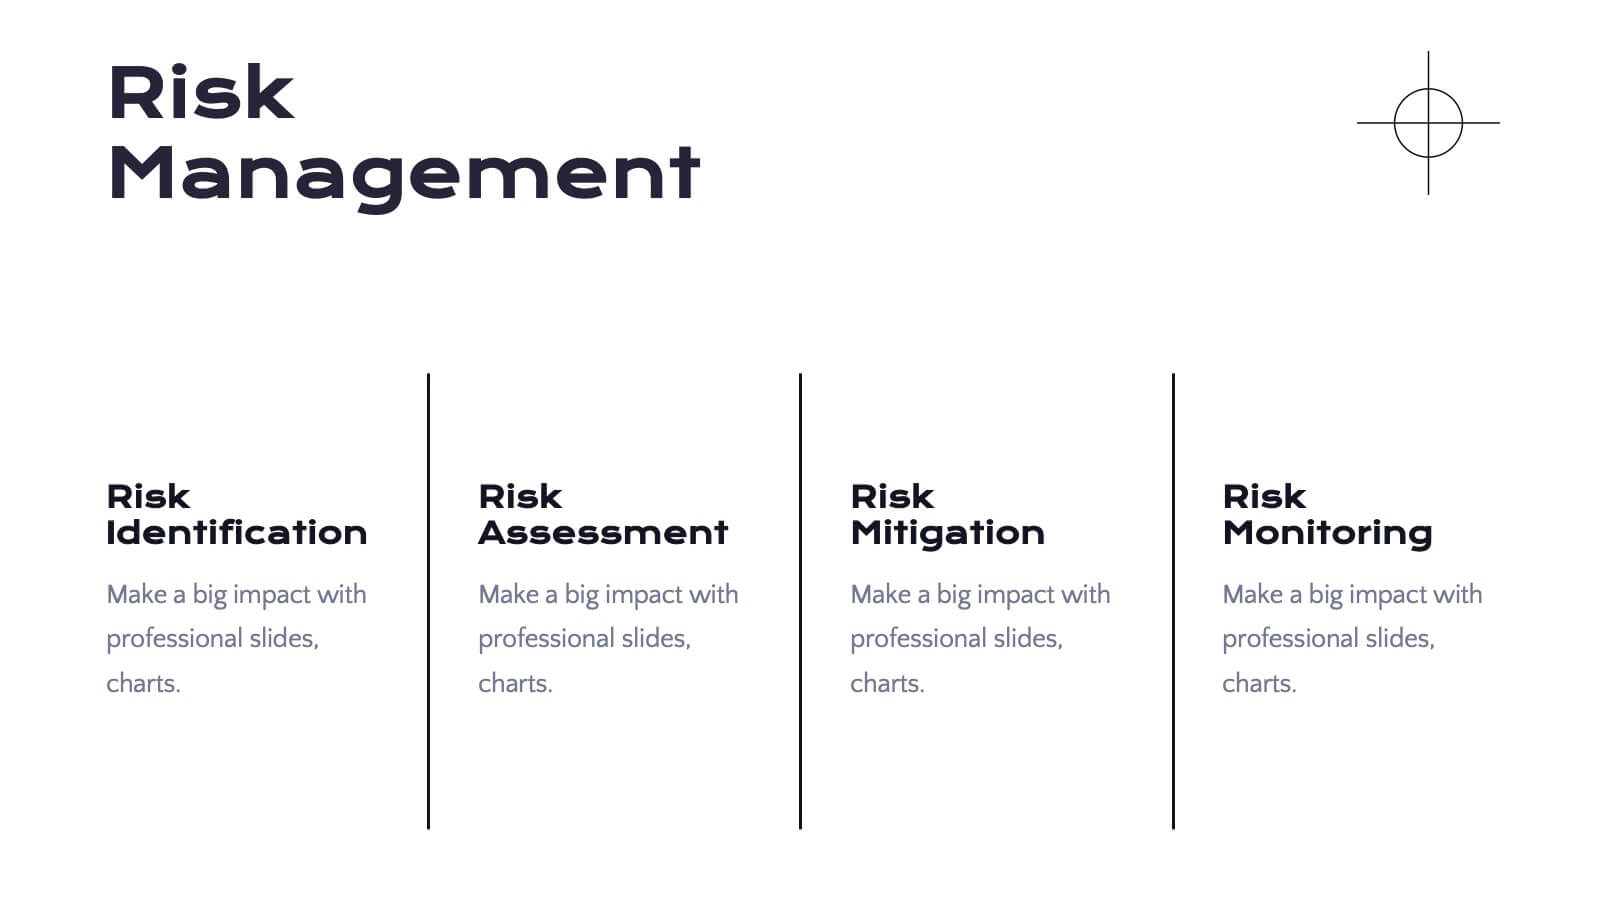
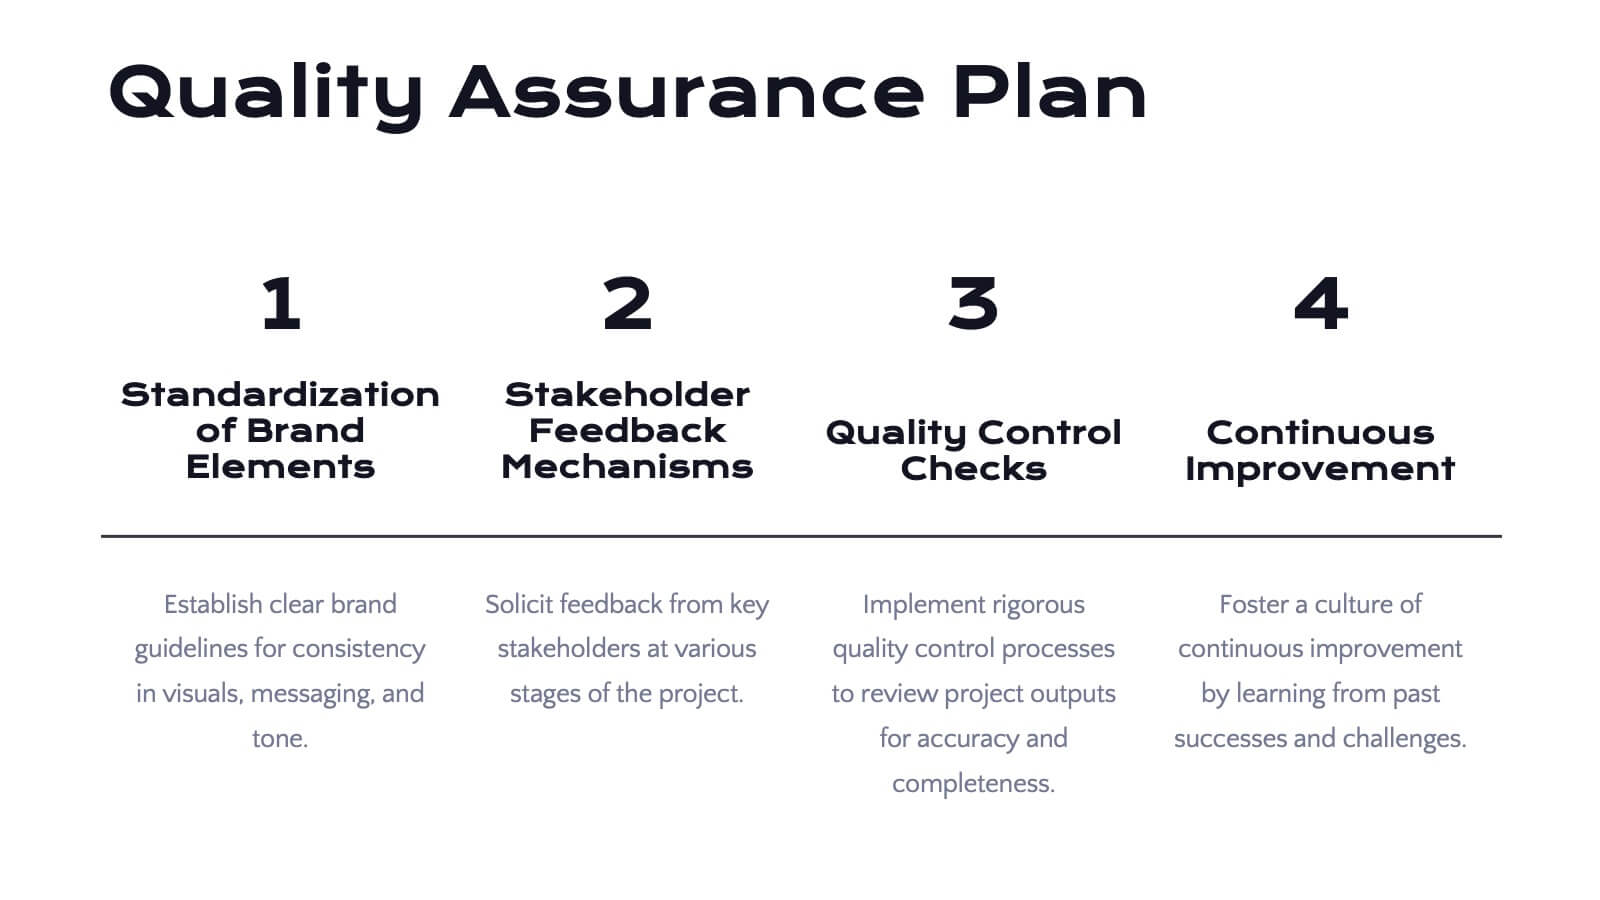
Radiance Detailed Project Execution Plan Presentation
Elevate your project execution presentations with this sleek template, covering everything from objectives to timelines and budget breakdowns. It's perfect for aligning your team and stakeholders. Compatible with PowerPoint, Keynote, and Google Slides, it ensures professionalism and clarity in showcasing your project plans.


4 diapositivas
Left and Right Brain Diagram Presentation
Unlock the perfect blend of logic and creativity with a visual layout that highlights how analytical thinking and imaginative ideas work together. This presentation makes it easy to compare concepts, explain processes, and illustrate dual perspectives with clarity and color. Fully compatible with PowerPoint, Keynote, and Google Slides.


7 diapositivas
Root Cause Analysis for Problem Solving Presentation
Identify and Resolve Issues Effectively with this Root Cause Analysis for Problem Solving presentation template. Designed to streamline complex problem-solving, this layout features clear visual markers, structured iconography, and step-by-step segmentation to help teams analyze causes, pinpoint bottlenecks, and implement solutions efficiently. Ideal for project managers, business analysts, and operational teams, this template is fully customizable and works seamlessly in PowerPoint, Keynote, and Google Slides, ensuring a professional and engaging presentation experience.


2 diapositivas
Professional Closing Thank You
End your presentation with clarity and professionalism using this bold yet minimalist "Thank You" slide. Designed with modern aesthetics and contact detail placeholders, it’s ideal for business reports, marketing decks, and corporate pitches. Fully customizable in PowerPoint, Keynote, and Google Slides.


4 diapositivas
Communication Model and Channels Presentation
Illustrate how your messages move through various channels using this clean, visual communication model slide. Ideal for team briefings, marketing workflows, or internal training, it simplifies how information is shared across platforms. Fully editable in Canva, PowerPoint, and Google Slides for seamless customization to match your branding and messaging goals.