


Características


¿Tienes alguna pregunta?
Recomendar


21 diapositivas
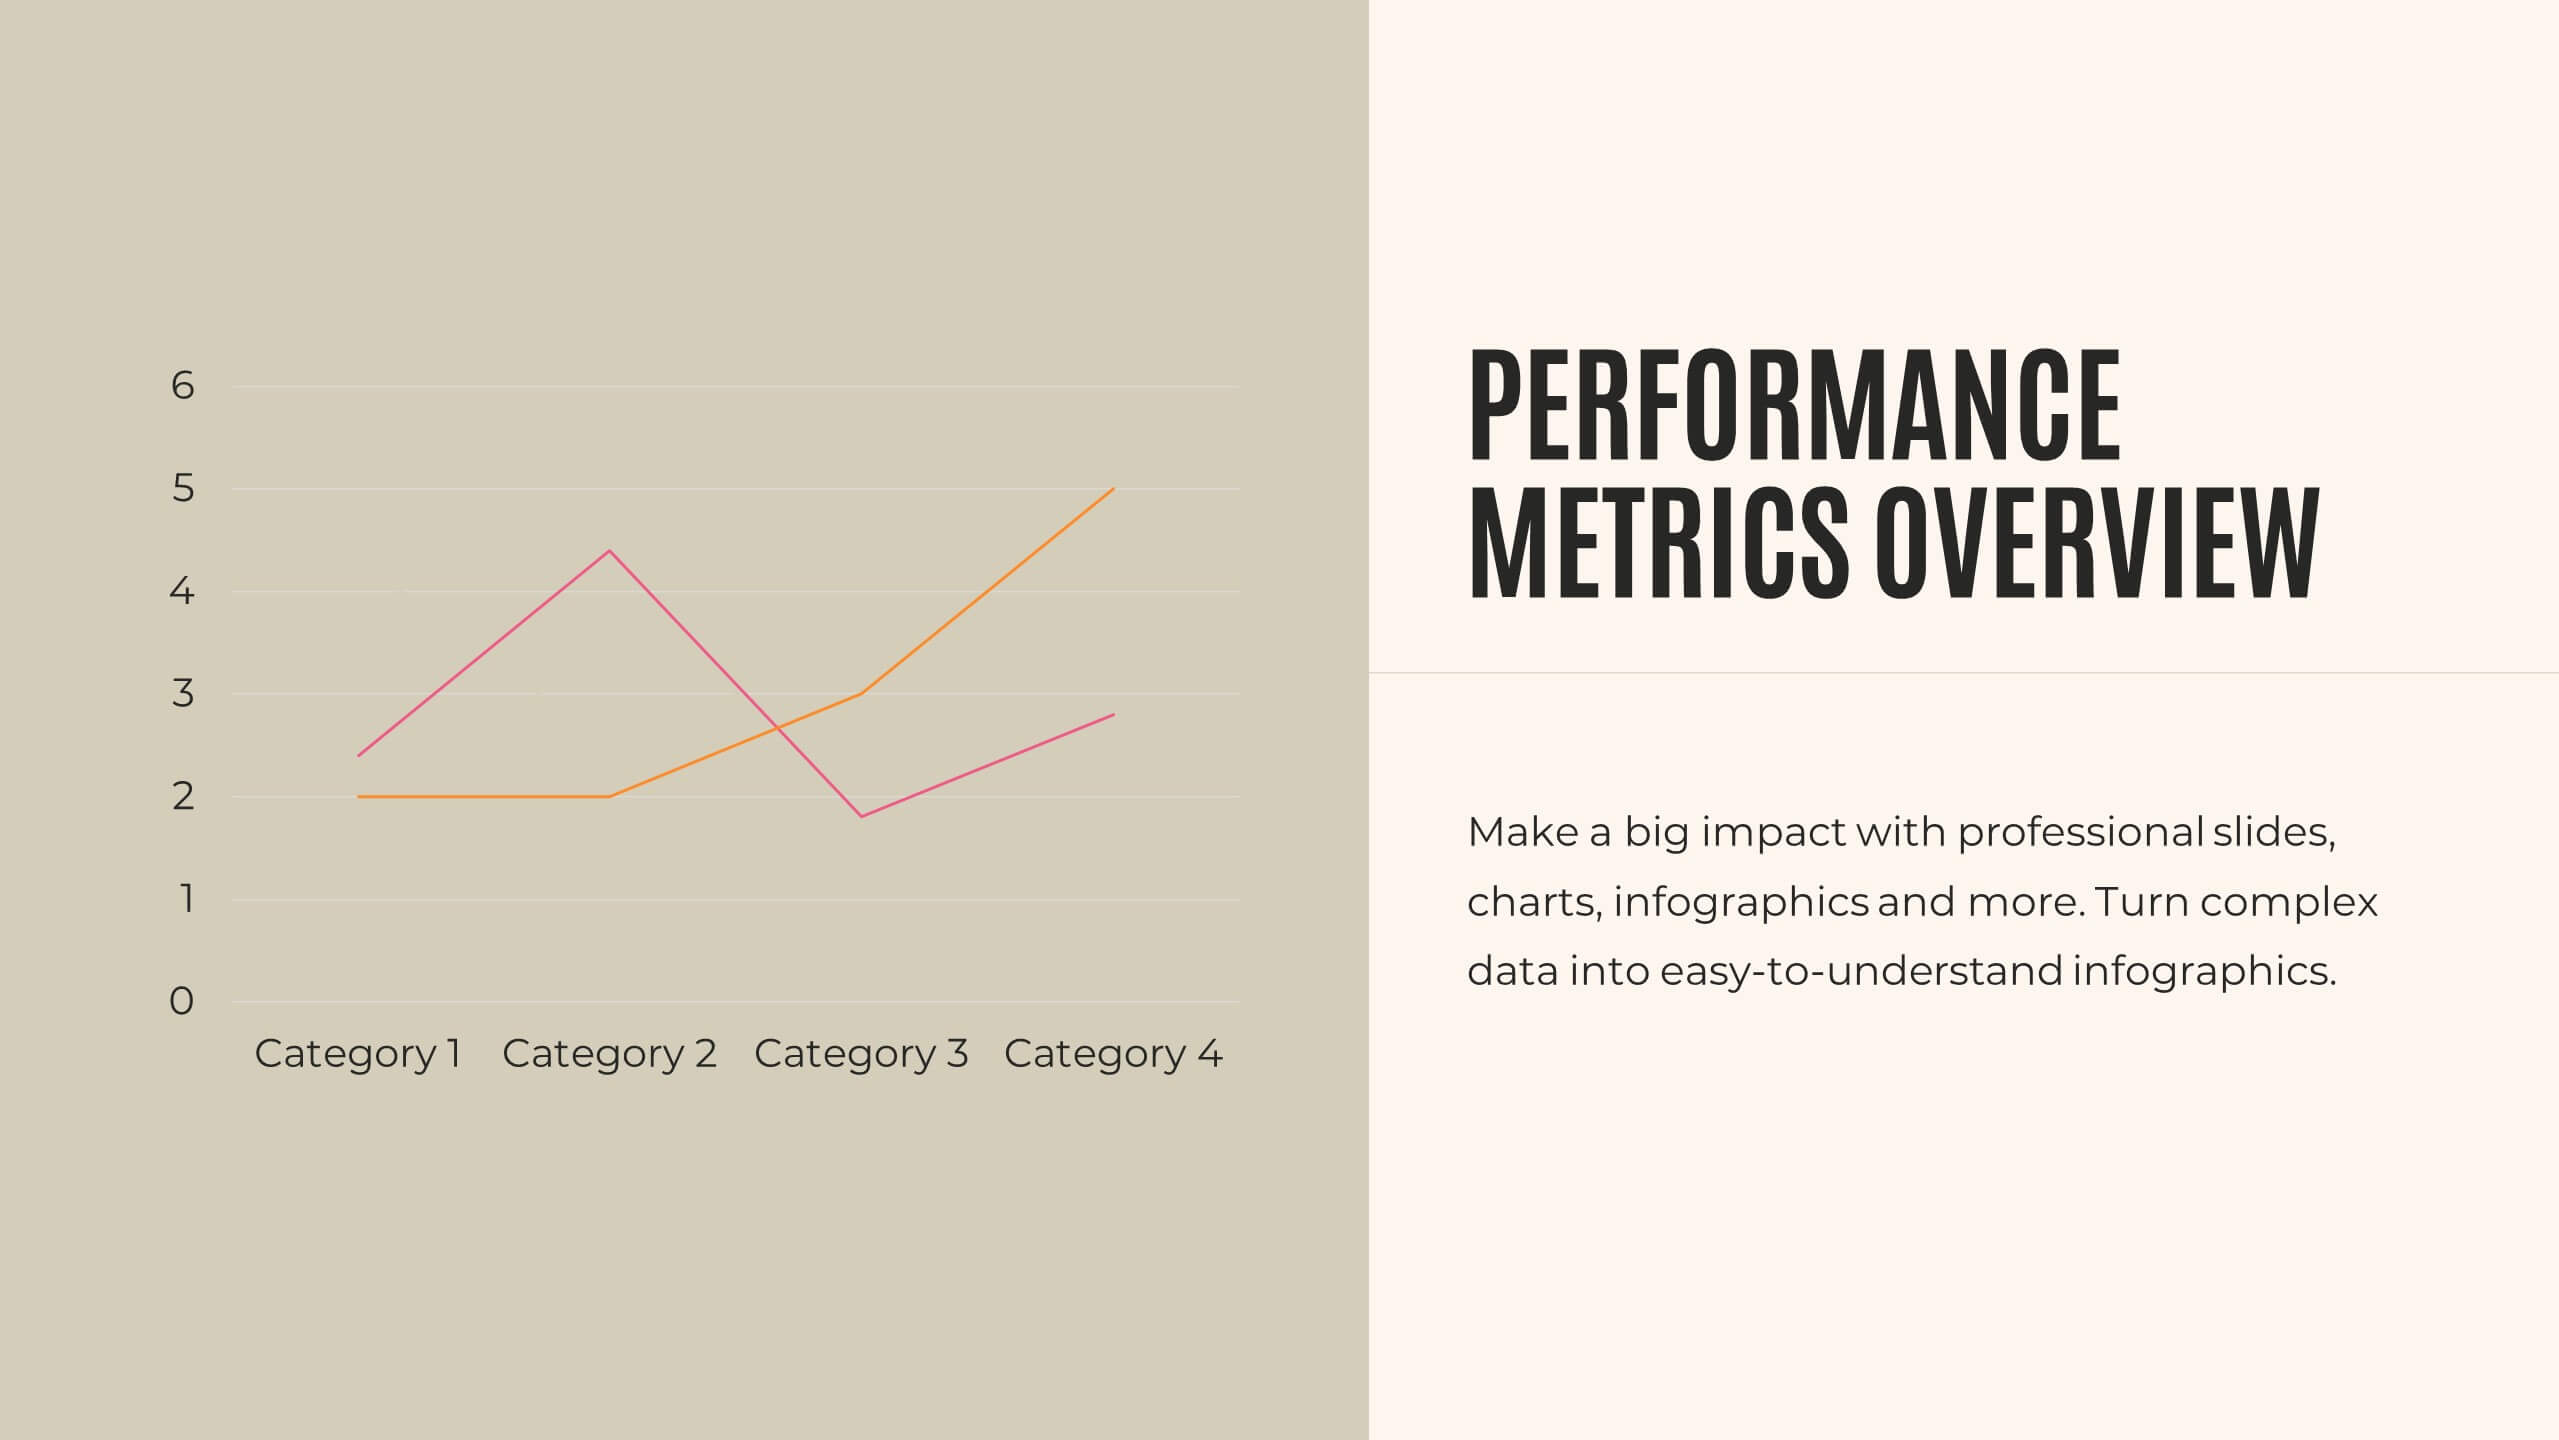
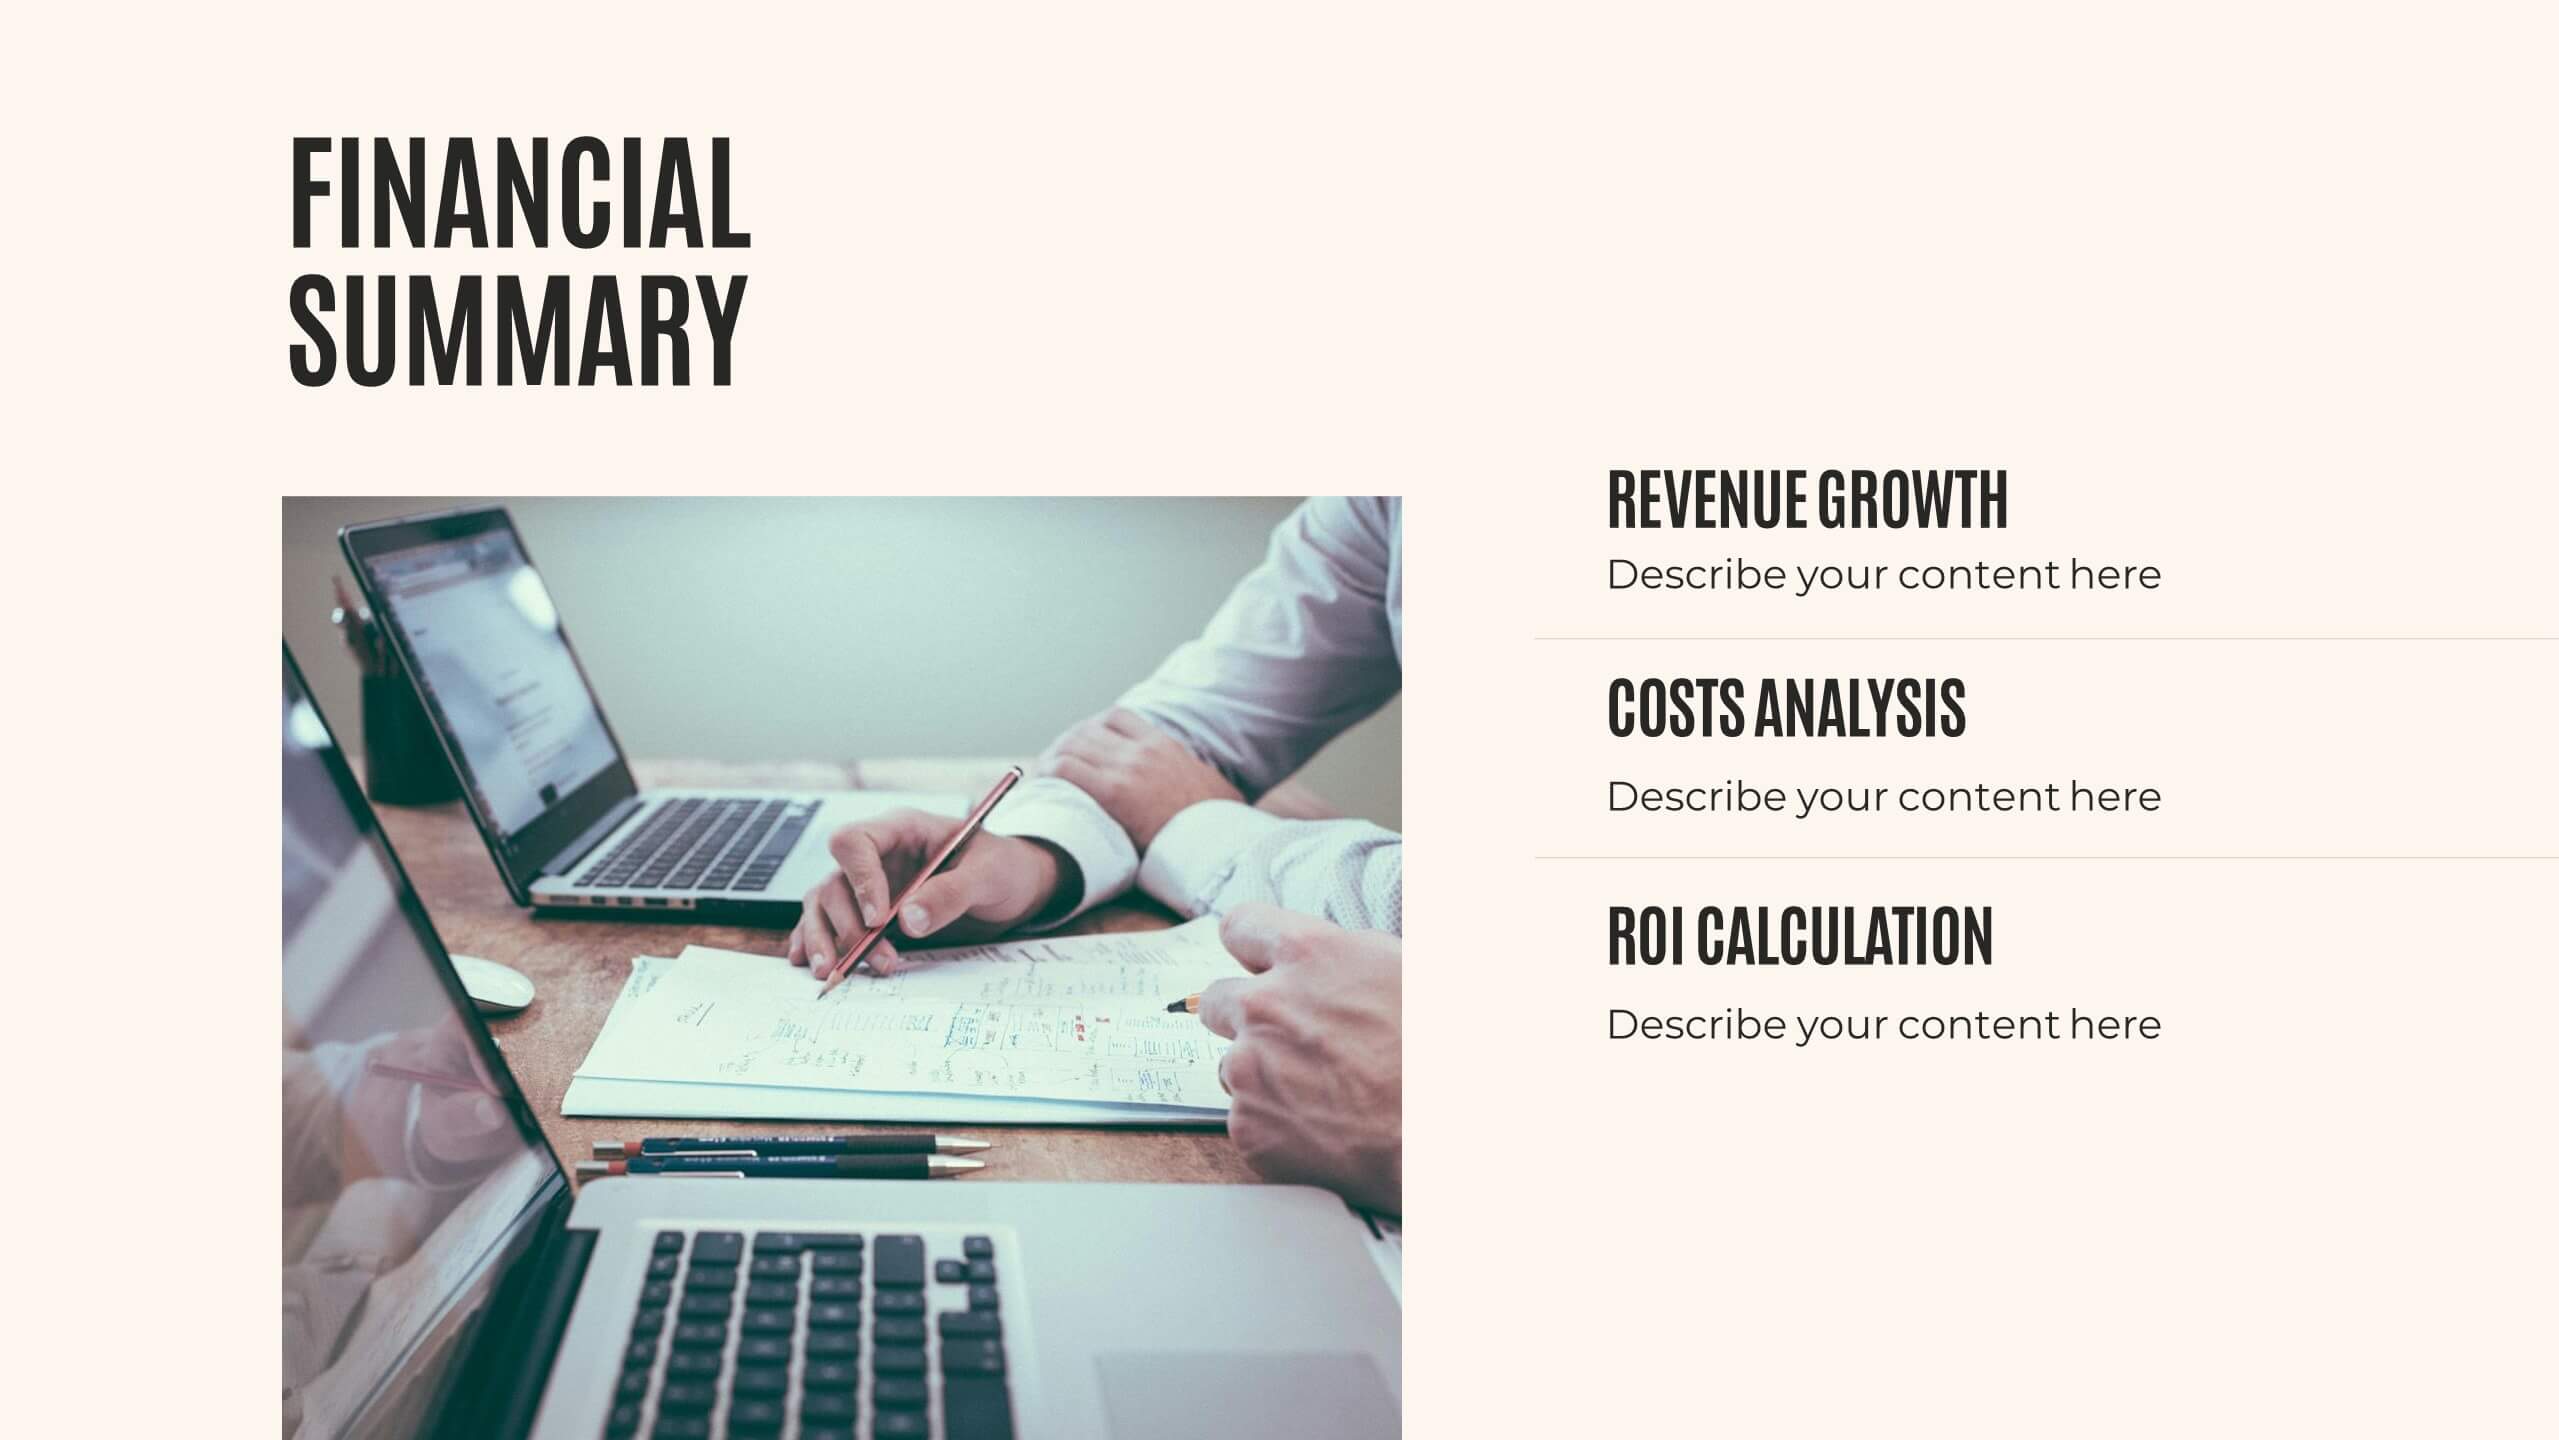
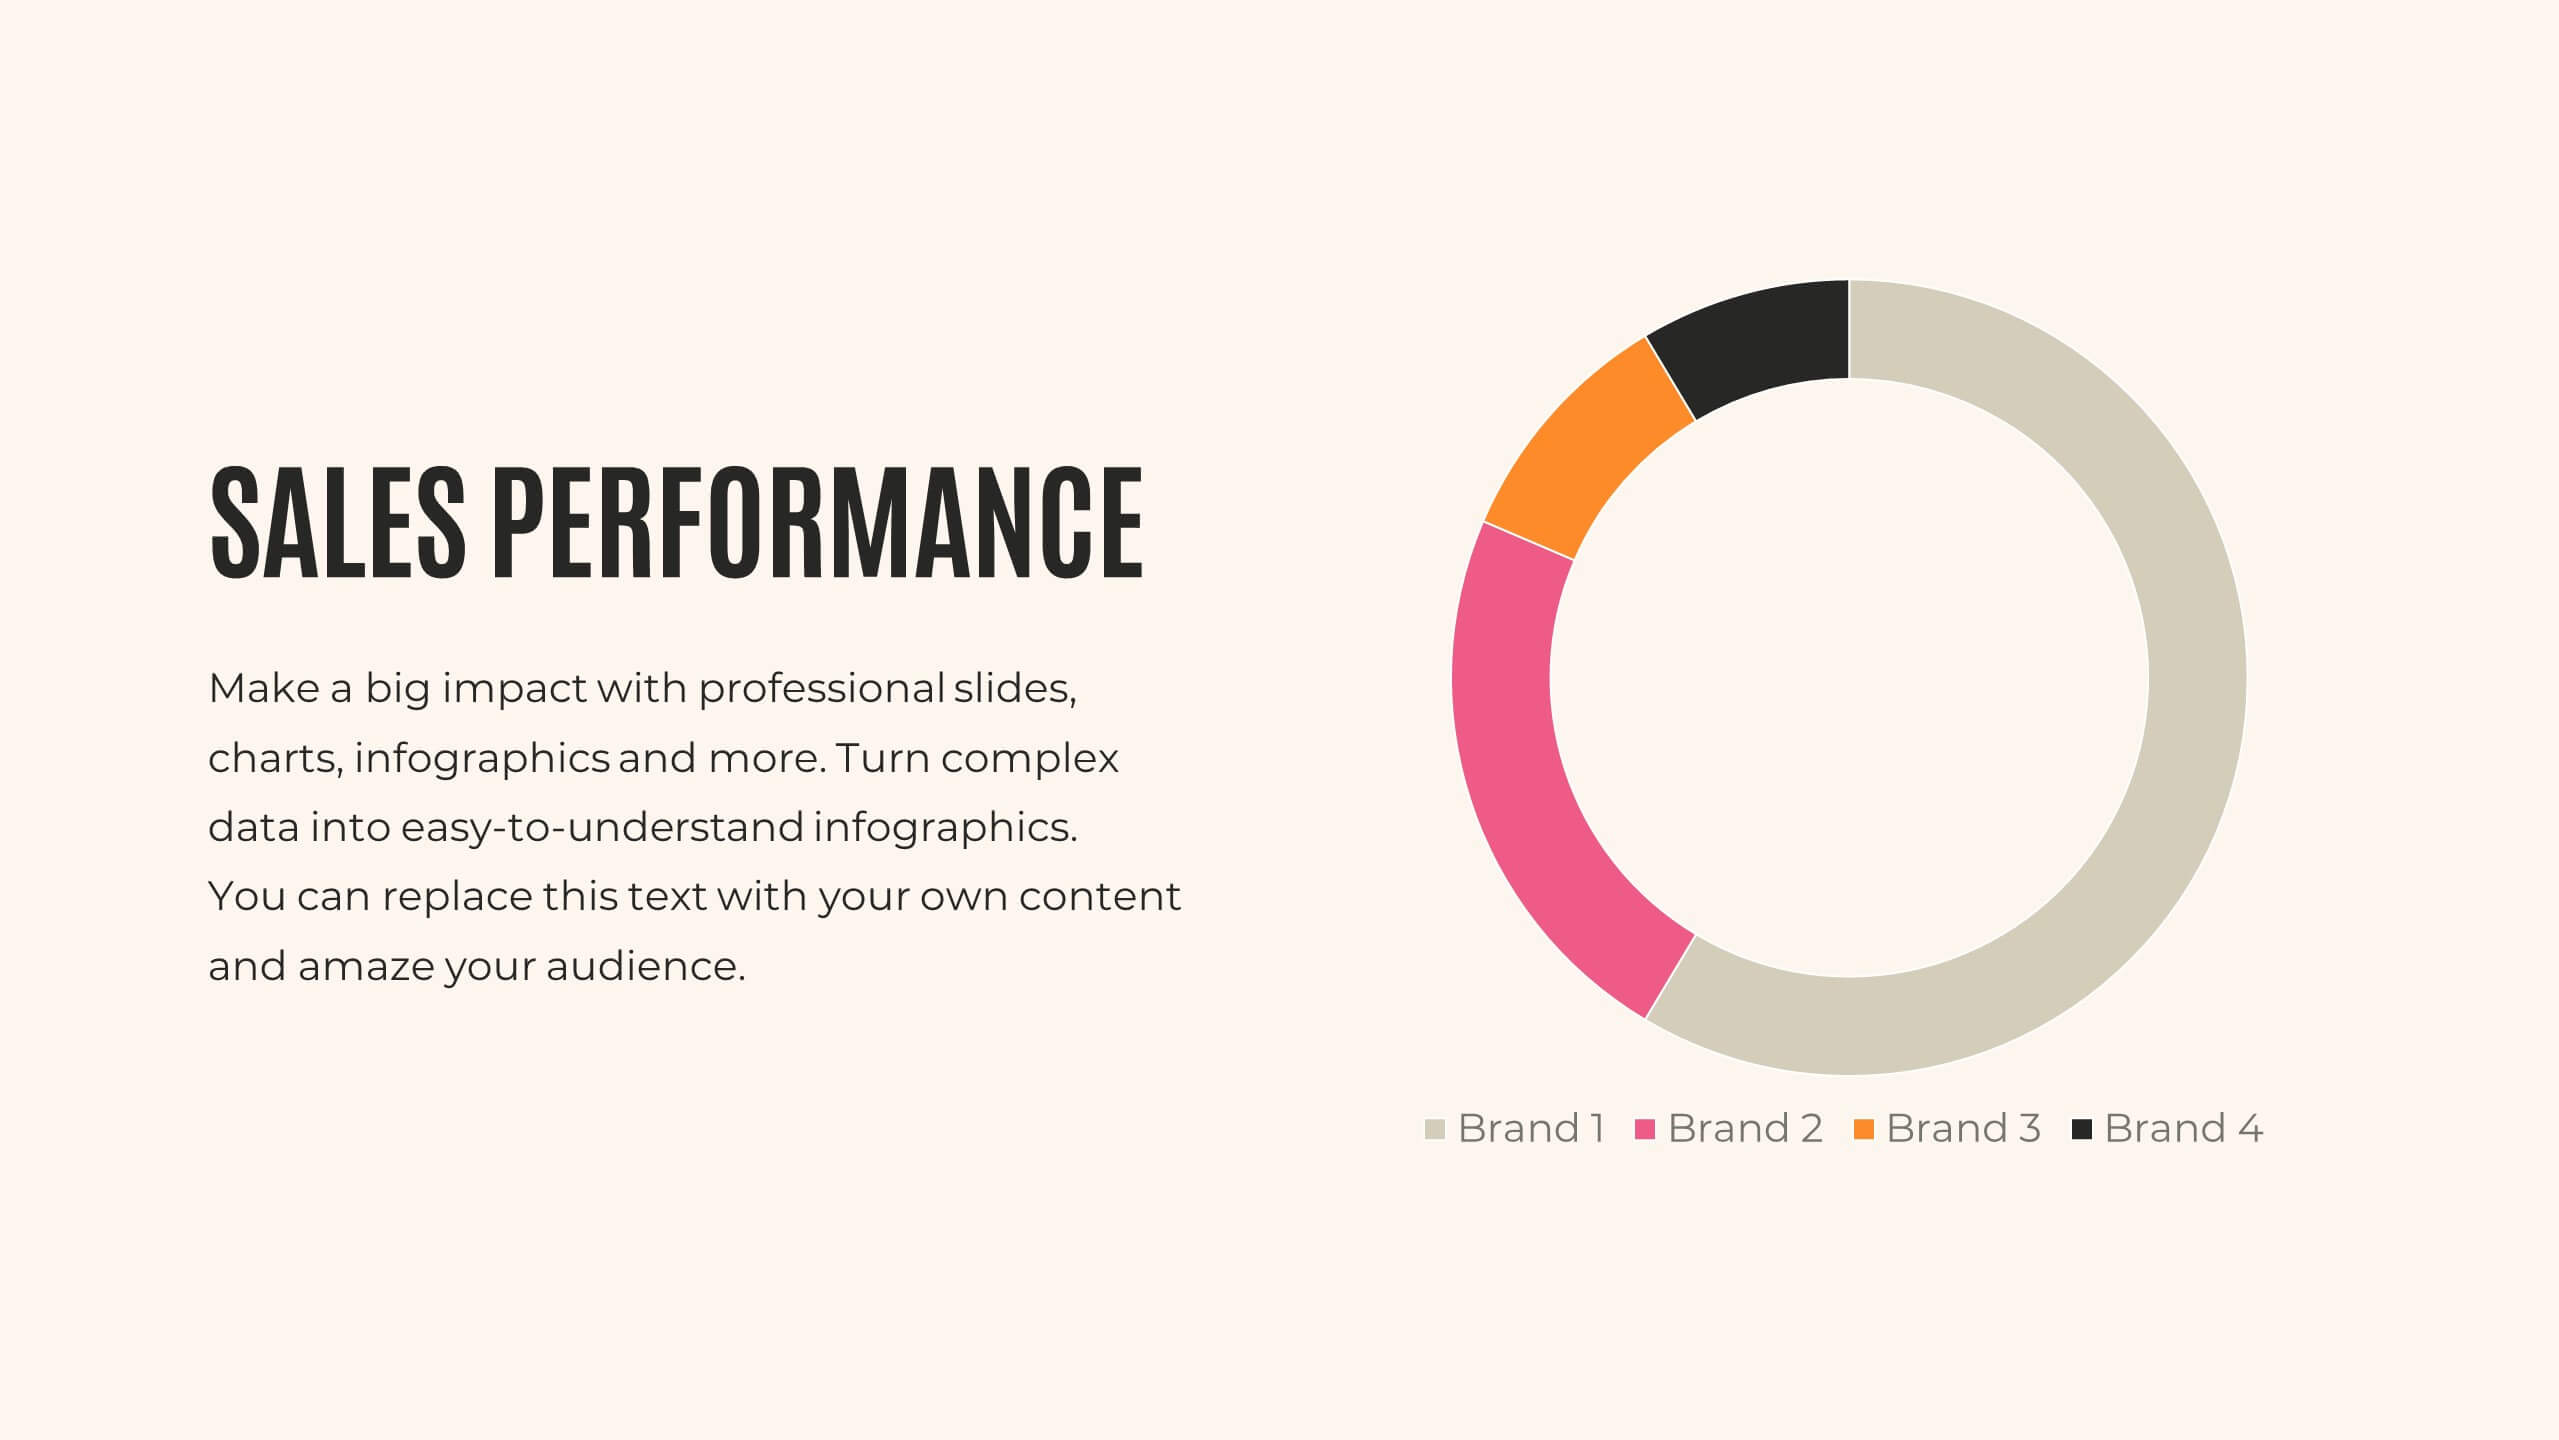
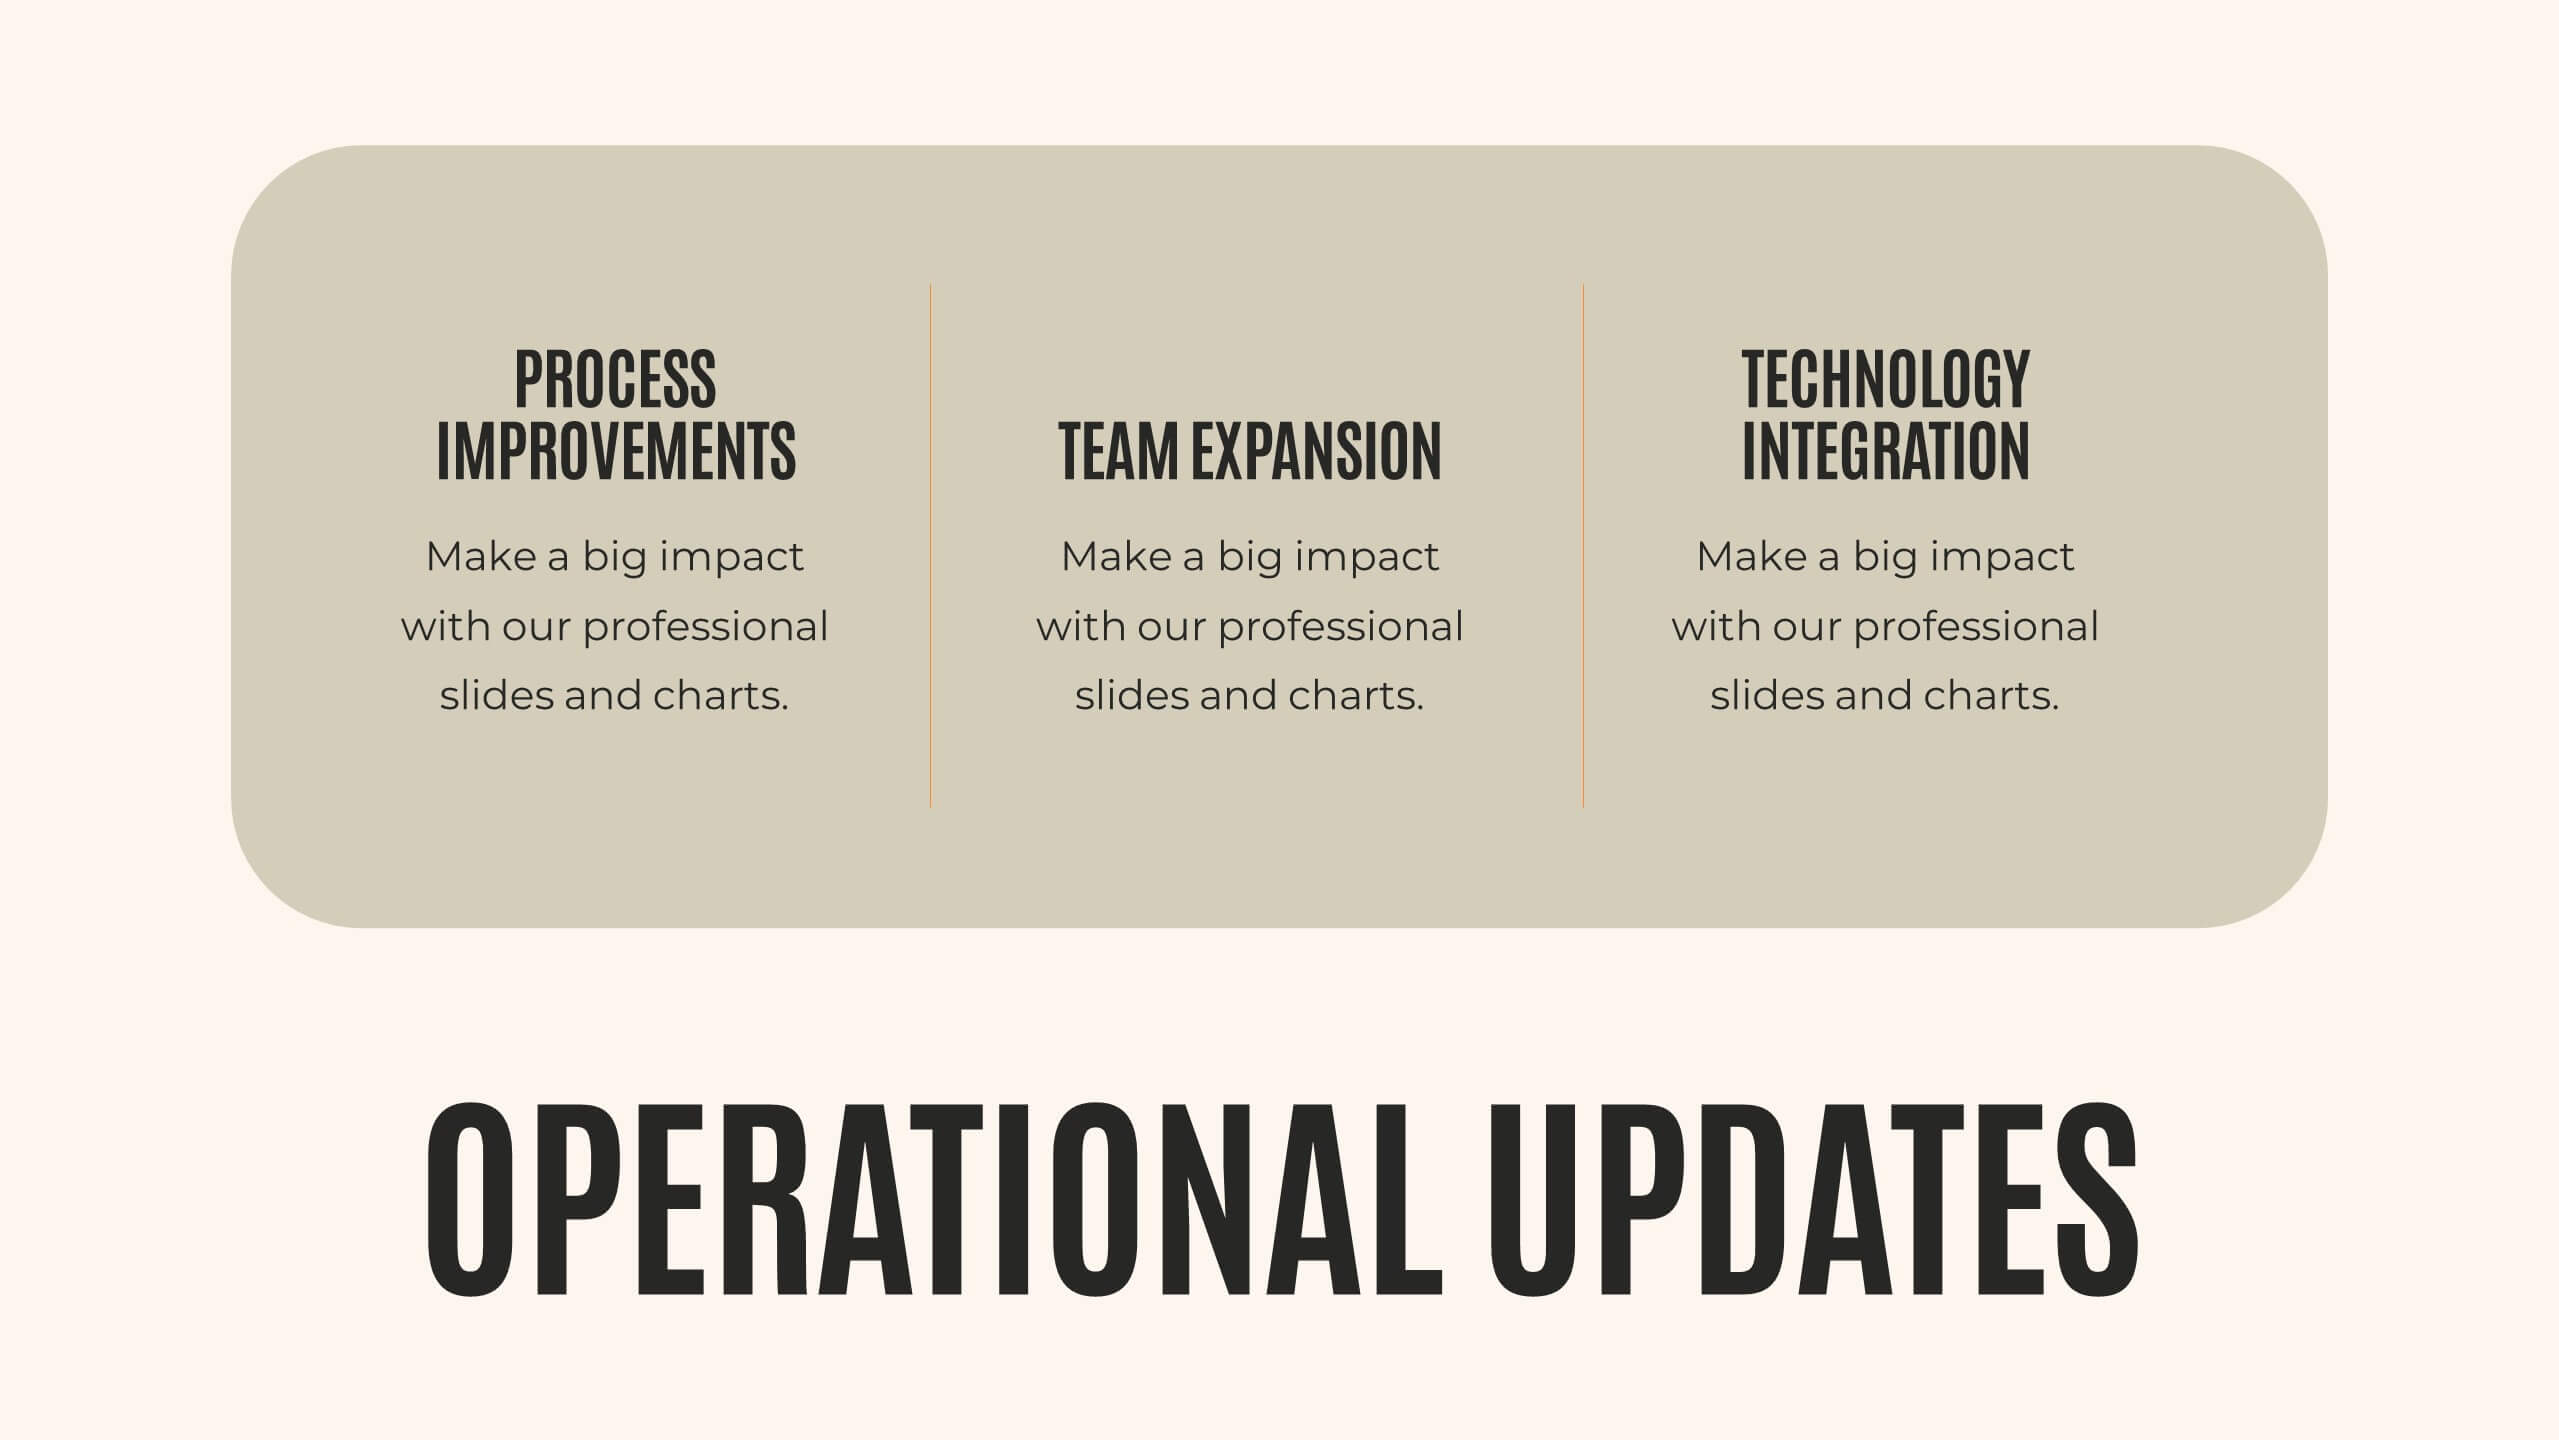
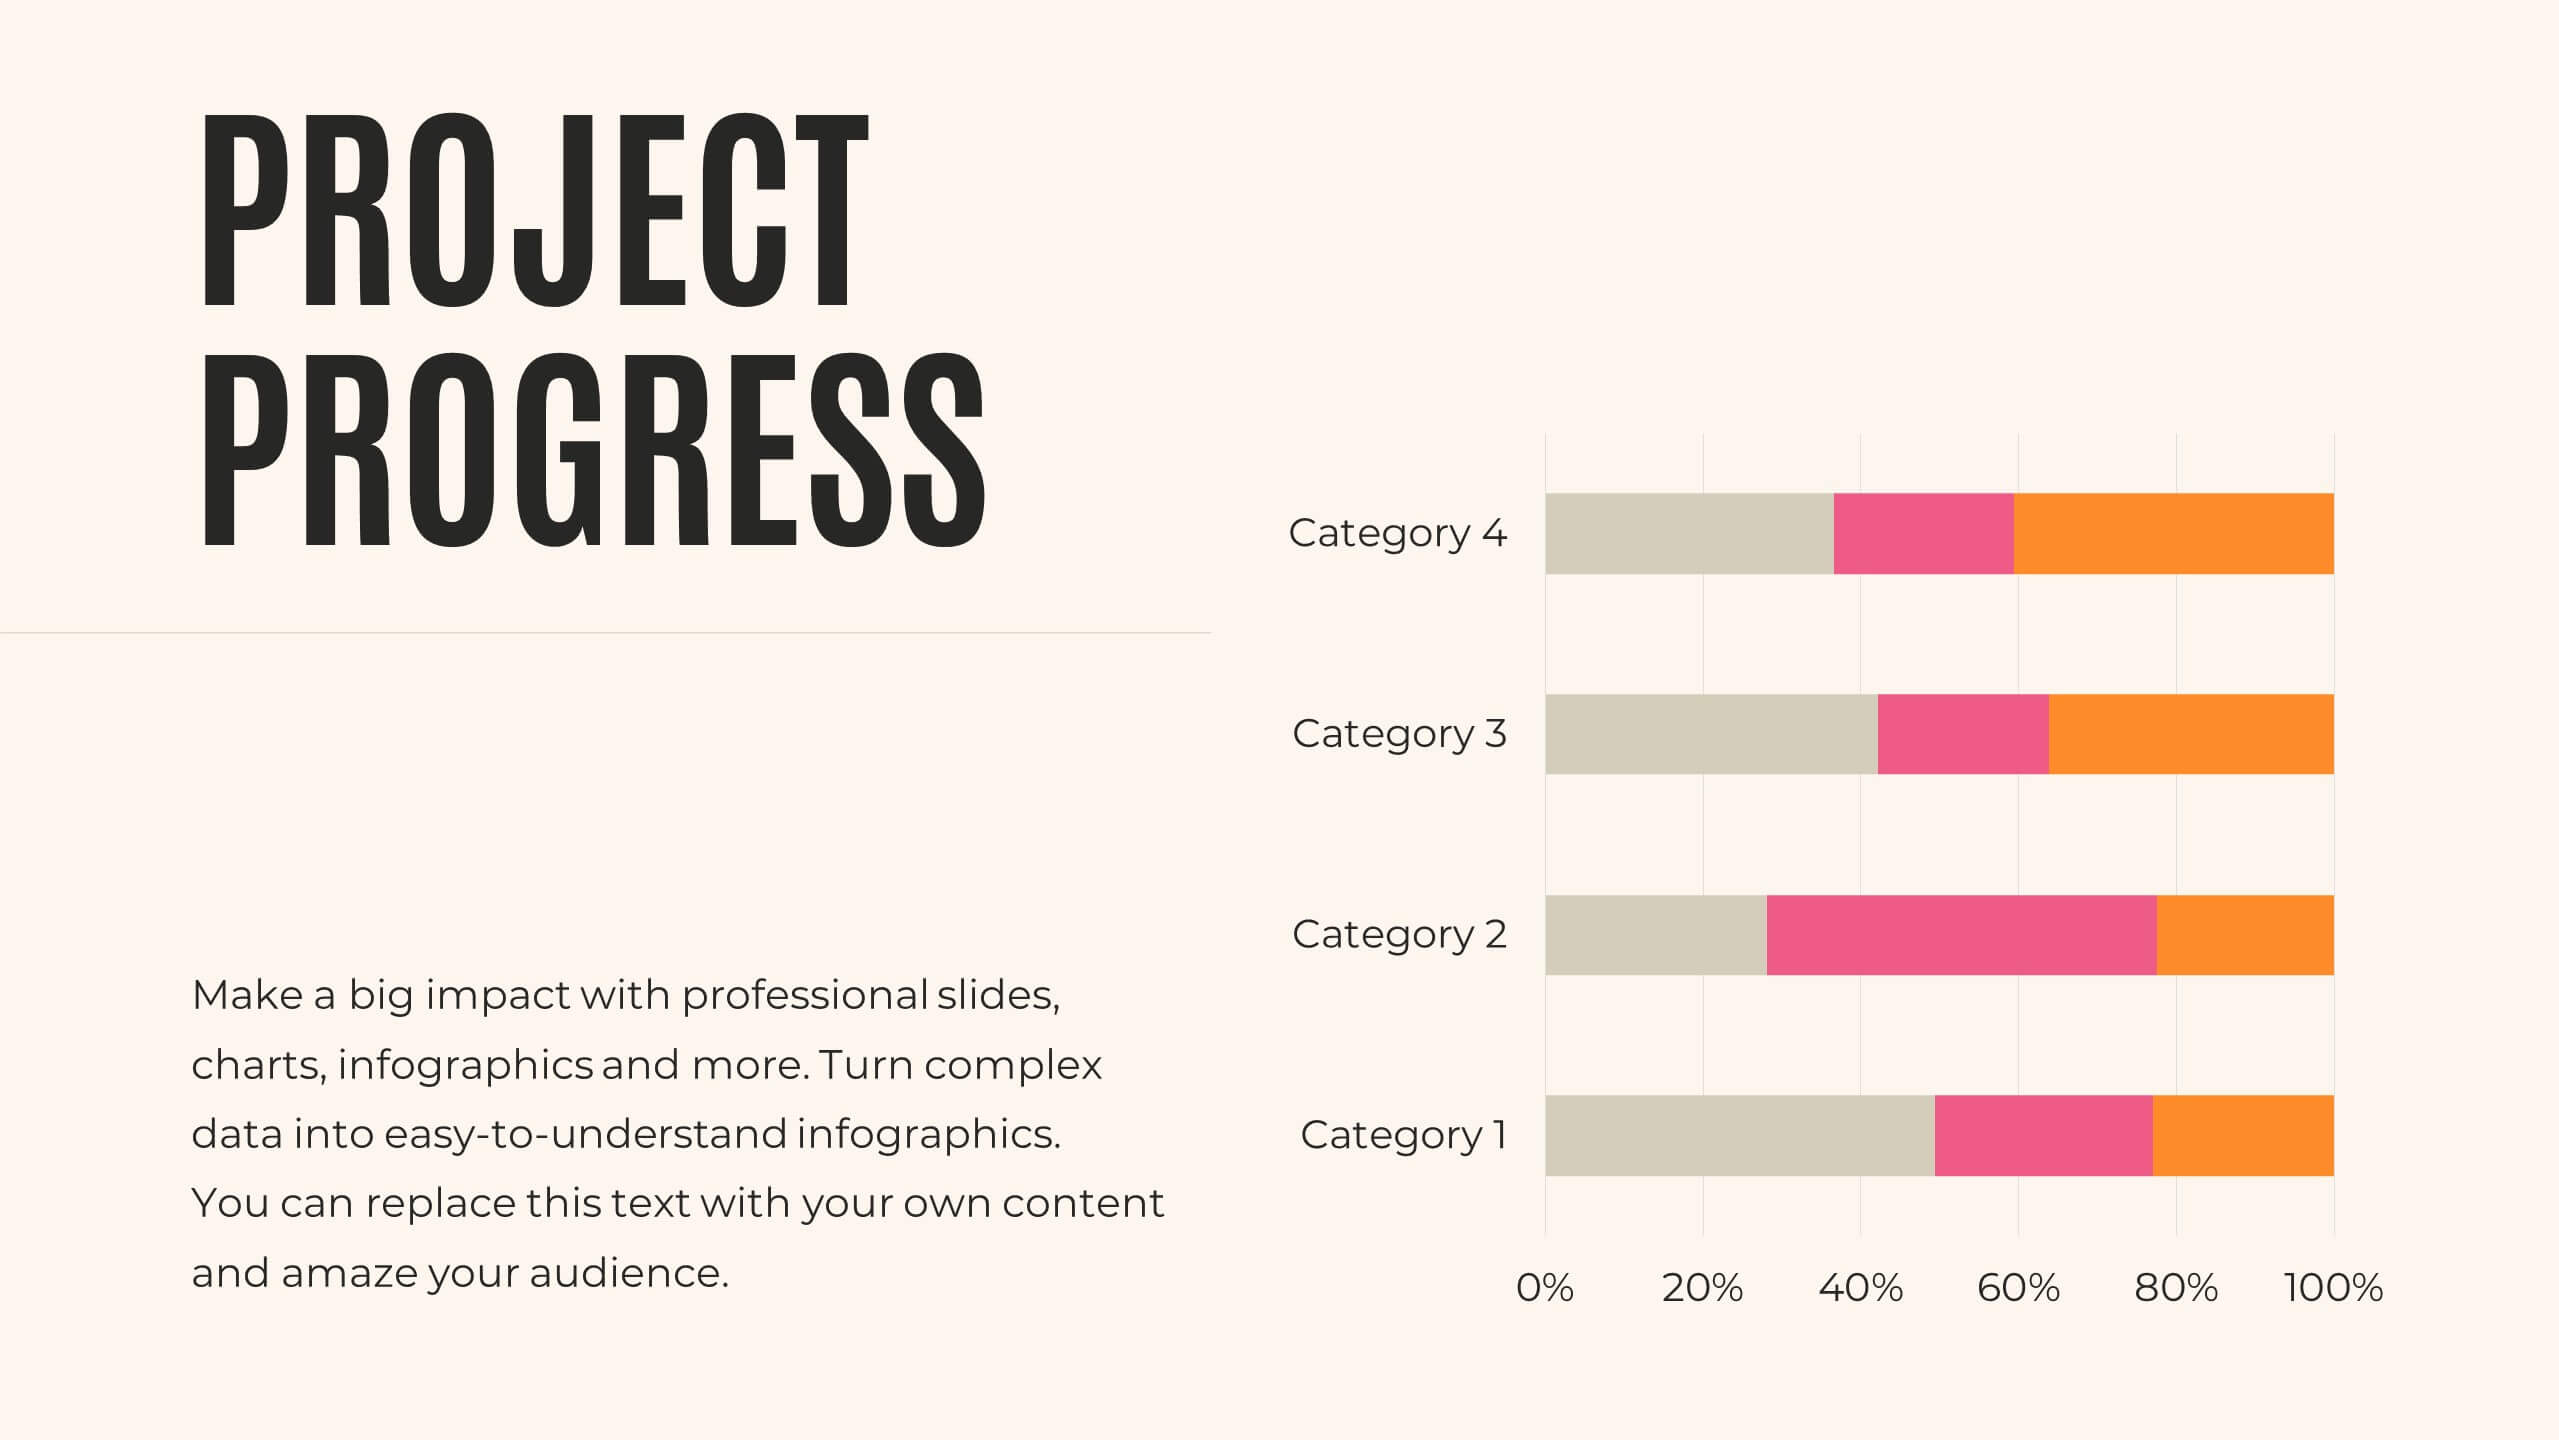
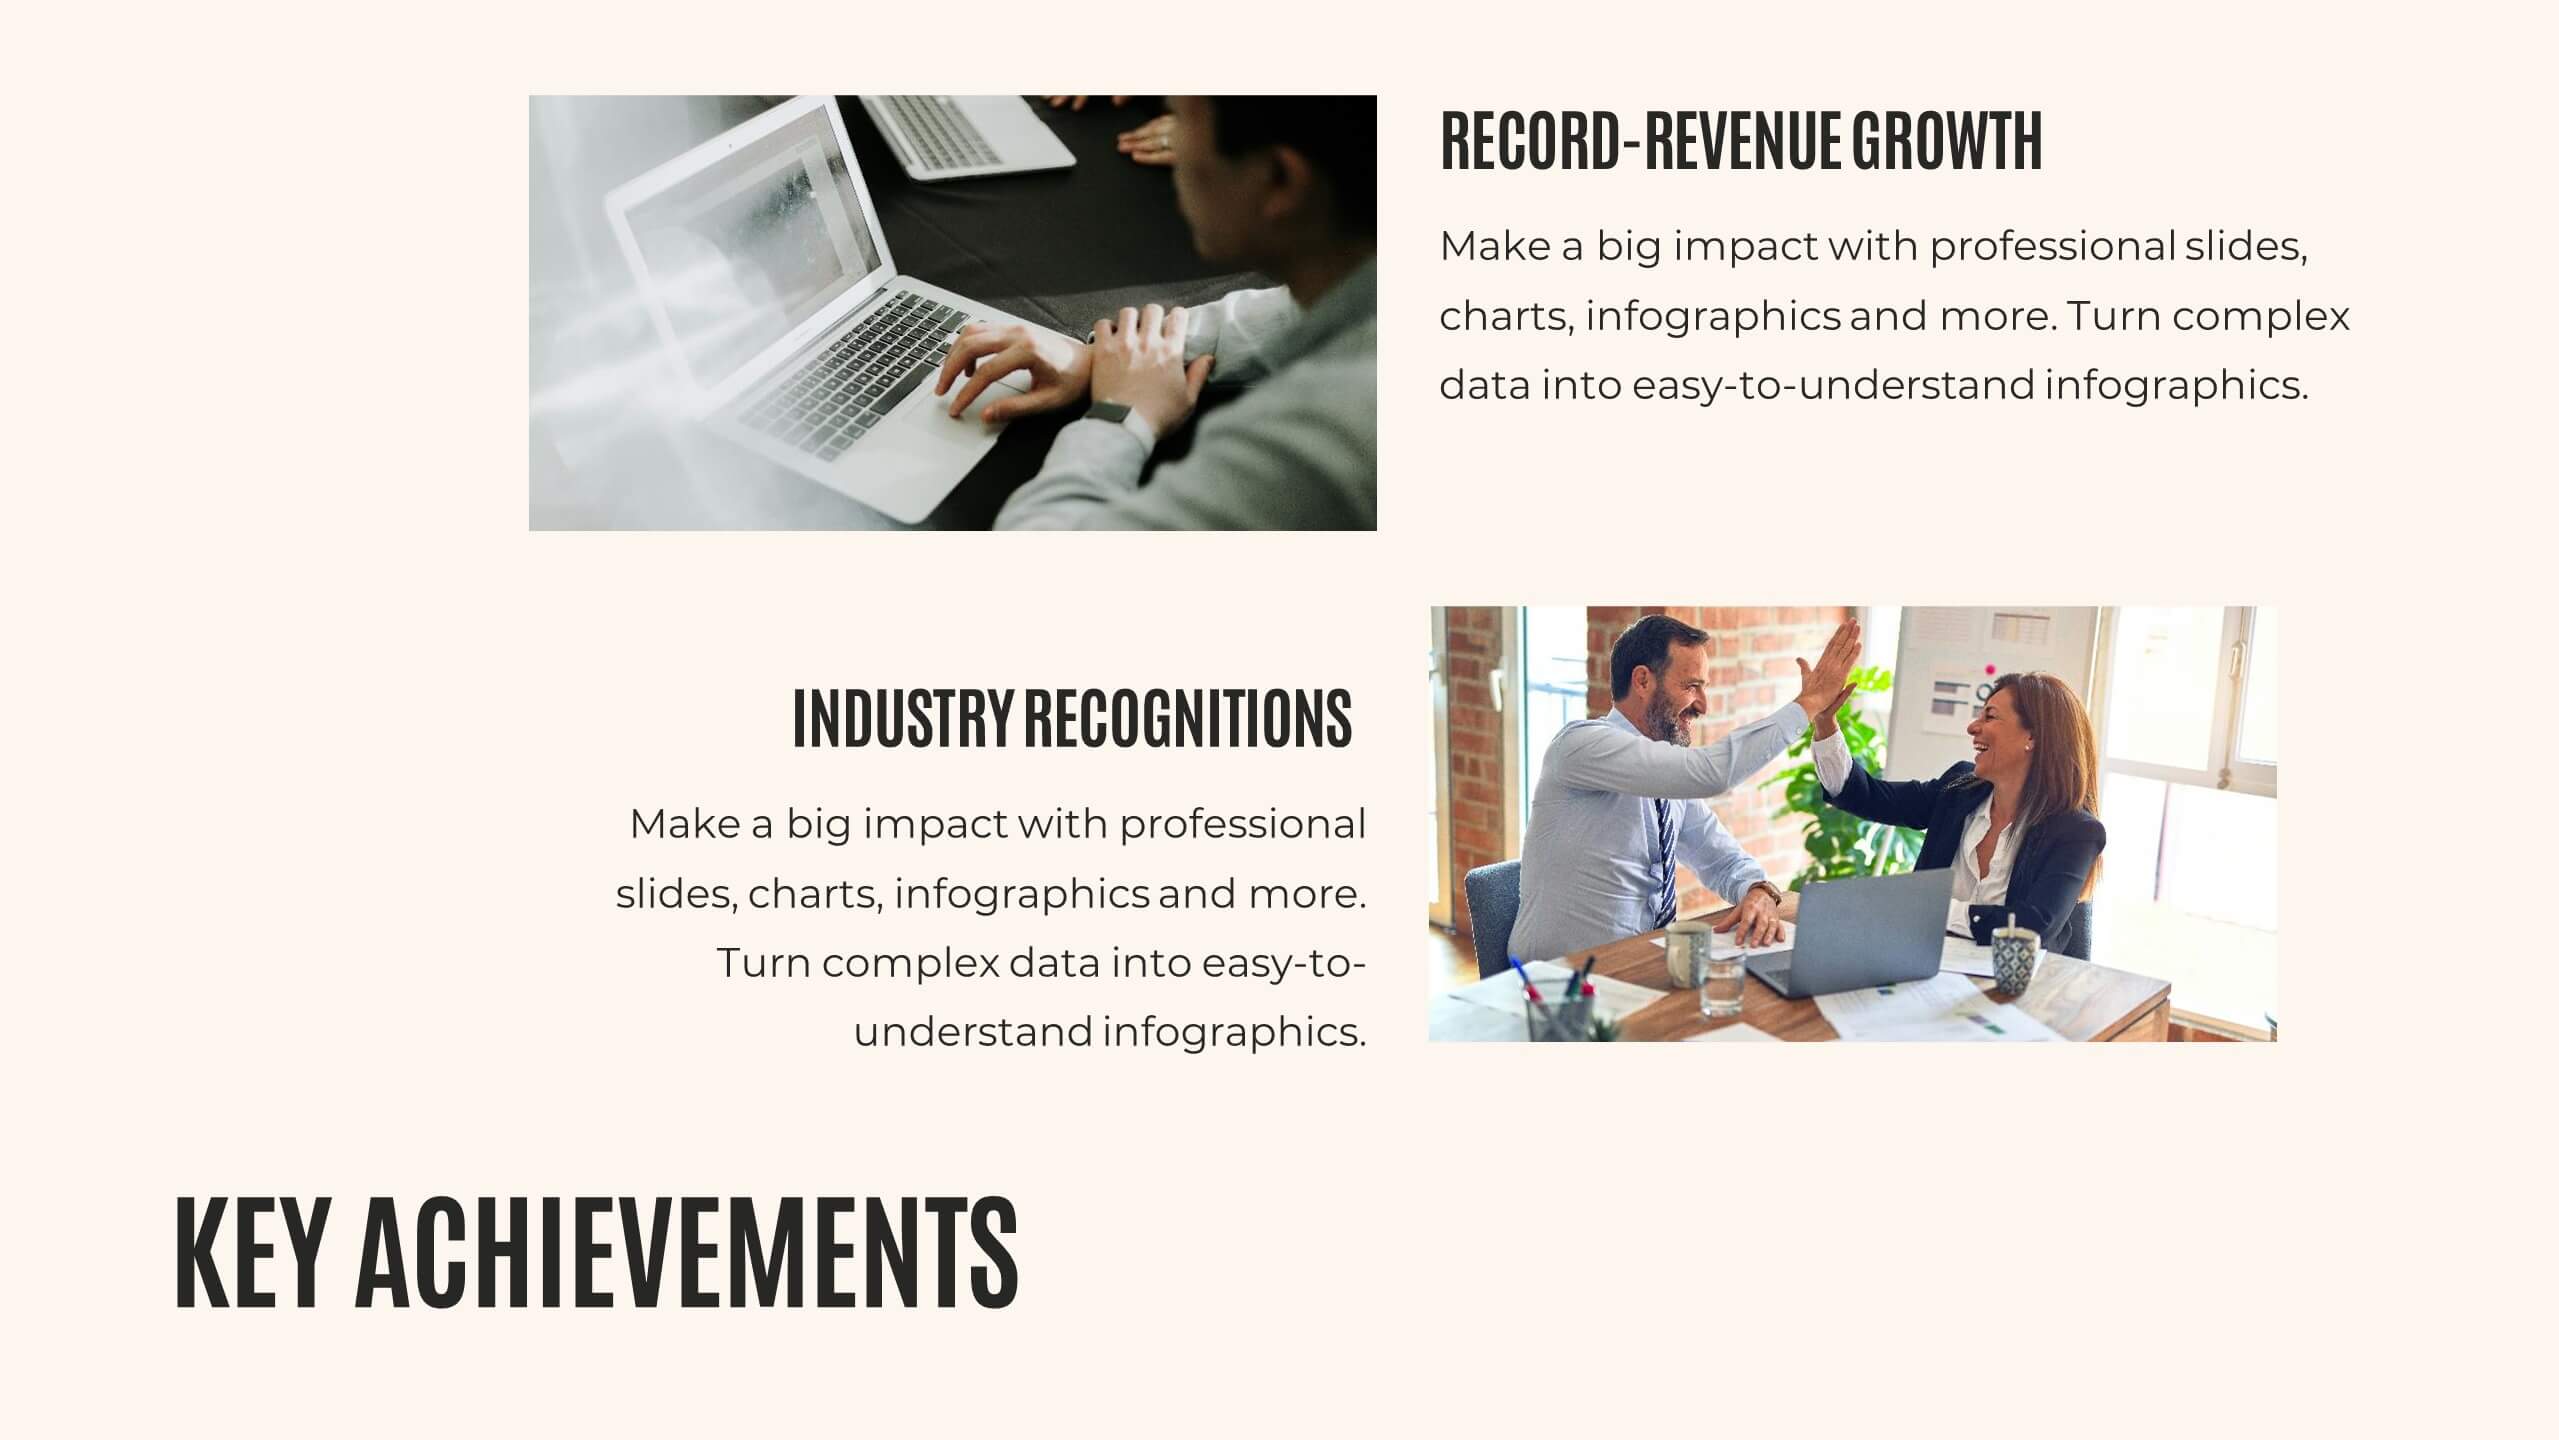
Journey Annual Report Presentation
Present your annual report with clarity and impact! This template covers agenda, key highlights, financial summary, sales performance, and project progress. Ideal for detailing achievements, insights, and future priorities. Compatible with PowerPoint, Keynote, and Google Slides, it ensures your data is visually compelling and easy to understand. Showcase your success effortlessly!


6 diapositivas
Real Estate and Building Development Presentation
Present key insights into the real estate market with the Real Estate and Building Development template. Designed for property investors and urban planners, this visual framework highlights financial trends, project phases, and market analysis. Fully customizable and compatible with PowerPoint, Keynote, and Google Slides for seamless presentation delivery.


5 diapositivas
Investment Portfolio & Stock Forecast Presentation
Present key investment insights with clarity using the Investment Portfolio & Stock Forecast presentation template. Featuring a central briefcase visual and surrounding data points, this layout is perfect for showcasing portfolio allocation, stock predictions, market movements, or financial planning elements. Designed for finance professionals, analysts, and advisors, it simplifies complex data into digestible visuals. Fully editable and compatible with PowerPoint, Keynote, and Google Slides.


7 diapositivas
Asia Map Geography Infographic
Explore the diverse landscapes and key data of Asia with our collection of Asia Map Infographics. These templates are expertly designed to illustrate various geographical and demographic insights across the continent, making them ideal for educational purposes, business presentations, or travel-related projects. Each infographic is crafted with a clean, clear layout that highlights different countries, regions, and significant data points such as population density, economic indicators, or cultural statistics. The use of color coding and spatial markers ensures that information is easily understandable and visually appealing. Fully customizable, these templates allow you to adjust the data points, colors, and text to suit specific presentation needs or to focus on particular areas of interest. Whether you're a teacher, a business analyst, or a traveler preparing a presentation, these slides offer a valuable resource for conveying complex geographical data in a straightforward and engaging manner.


21 diapositivas
Terraflare Project Status Report Presentation
Keep stakeholders updated with this comprehensive project status report template, featuring agenda, key highlights, performance metrics, project progress, risk assessments, and goals. Easily track progress, strategic initiatives, and team productivity. Perfect for PowerPoint, Keynote, and Google Slides, ensuring clear communication of project updates and priorities.


8 diapositivas
Leadership and Management Presentation
The "Leadership and Management" presentation template uses a mountain metaphor to visually depict the challenges and achievements in leadership and management roles. Each slide features a series of peaks, symbolizing different stages or goals within a project or initiative. The climbers on various parts of the mountain can represent team members or leaders at different phases of their tasks. This template is versatile, suitable for presentations aimed at discussing strategies, milestones, or team dynamics in corporate settings. It offers a clear and engaging way to present complex information through a straightforward visual narrative.


5 diapositivas
Organizational Tree Model
Present team structures or company hierarchies with ease using this Organizational Tree Model slide. With five clearly defined roles branching from a central trunk, it’s perfect for visualizing leadership flow, reporting lines, or role responsibilities. Fully editable in PowerPoint, Keynote, and Google Slides.


5 diapositivas
Strategic Growth Next Steps
Highlight your business roadmap with this rocket-themed infographic tailored for strategic growth. Ideal for showcasing step-by-step initiatives or departmental alignment, it features five labeled stages with ample space for insights and icons. Fully editable in PowerPoint, Keynote, and Google Slides—perfect for growth strategy, planning, or vision-setting decks.


7 diapositivas
Supply Chain Logistic Infographics
Streamline your logistics insights with our Supply Chain Logistics Infographic, tailored for logistics managers, supply chain analysts, and operations directors. This infographic provides a visual tool to depict the intricacies and flow of your supply chain from procurement to distribution. Our infographic offers a comprehensive layout to map out each step of the supply chain, highlighting key processes such as supplier selection, manufacturing, inventory management, and logistics. It's designed to facilitate a better understanding of each segment's role in the overall efficiency and effectiveness of the supply chain. Customize this infographic with specific data points, such as lead times, turnover rates, and transportation modes, to provide a detailed view of your logistics operations. This SEO-optimized infographic is crafted to make your supply chain data accessible and actionable. Implement our infographic to communicate the complexities of supply chain logistics succinctly, ensuring that stakeholders grasp the full scope of your supply chain dynamics.


5 diapositivas
RACI Matrix Responsibility Breakdown Presentation
Visualize roles and responsibilities with this RACI Matrix slide. Clearly assign who is Responsible, Accountable, Consulted, or Informed across key tasks. Ideal for project planning and team alignment, this editable layout helps avoid confusion and ensures accountability. Perfect for PowerPoint, Keynote, or Google Slides in any business context.


26 diapositivas
Human Resources Colorful Vectors
Dive into the dynamic realm of human resources, where talent thrives and organizations find their heartbeat. Radiating with a playful palette of sunny yellow, refreshing green, blush pink, and crisp white, our template captures the vibrancy and diversity of the HR world. Adorned with colorful graphics, relatable icons, and insightful image placeholders, it's a testament to the human touch in every organization. Expertly tailored for Powerpoint, Keynote, or Google Slides. An invaluable tool for HR professionals, recruitment agencies, corporate trainers, or anyone focused on building and nurturing talent. Engage, empower, and elevate; let your HR endeavors shine.


6 diapositivas
Decision Flow Diagram Presentation
Make complex decisions easier to follow with the Decision Flow Diagram Presentation. This clean and logical layout breaks down two main options and guides viewers through possible outcomes using a visual tree structure. Featuring checkmark and X icons to clearly denote decisions, this template is ideal for strategic planning, operations, or troubleshooting. Includes light and dark modes, editable in PowerPoint, Keynote, and Google Slides.


4 diapositivas
Step-by-Step Company Workflow Map Presentation
Visually track business processes with this step-by-step workflow map. Each stage is illustrated as a vertical bar, representing progression and task hierarchy. Ideal for project managers, operations teams, and onboarding sessions. Fully editable in PowerPoint, Keynote, and Google Slides for quick customization of labels, icons, and stage descriptions to fit your goals.


7 diapositivas
Comparative Analysis with Butterfly Chart
Showcase side-by-side insights with clarity using the Comparative Analysis with Butterfly Chart Presentation. Designed for balanced visual storytelling, this template contrasts two sets of three data points—perfect for comparing teams, strategies, features, or timelines. The symmetrical butterfly layout draws focus to the center "VS" section, ideal for highlighting your core comparison or conclusion. Fully editable in PowerPoint, Keynote, and Google Slides for fast, tailored presentations.


12 diapositivas
Breast Cancer Awareness Day Presentation
The Breast Cancer Awareness Day presentation template is an essential tool for health awareness campaigns. With distinctive pink icons symbolizing support and education, this template is perfect for seminars and presentations. It's fully compatible with PowerPoint, Keynote, and Google Slides, enhancing accessibility and user experience.


6 diapositivas
Weekly Gantt Schedule Management
Plan smarter, work smoother with the Weekly Gantt Schedule Management Presentation. This clean and structured timeline slide helps you map out tasks across the week, ideal for managing team workloads, tracking progress, and aligning project deadlines. Fully editable in PowerPoint, Keynote, and Google Slides to match your workflow.


5 diapositivas
Organizational Management Frameworks Overview Presentation
Clarify reporting lines and decision-making roles with the Organizational Management Frameworks Overview Presentation. This clean and color-coded hierarchy chart helps visualize team structure, leadership levels, or departmental breakdowns. Ideal for organizational design, onboarding, or strategic alignment discussions, each placeholder is fully customizable to reflect your company’s framework. Compatible with PowerPoint, Keynote, and Google Slides—perfect for HR professionals, managers, and consultants seeking structure and clarity.