


Características


¿Tienes alguna pregunta?
Recomendar


7 diapositivas
Communication Styles Infographic
Dive into the diverse world of communication with our communication styles infographic. Set against a palette of blue, yellow, and white, this template offers a visual exploration of different communication methods and their nuances. Whether it's assertive, passive, aggressive, or passive-aggressive, understanding these styles is vital in both personal and professional settings. Ideal for corporate trainers, educators, students, or anyone aiming to improve their interpersonal skills. Crafted for clarity and compatibility, this infographic is an excellent addition to PowerPoint, Keynote, and Google Slides, ensuring your presentations resonate with both substance and style.


20 diapositivas
Amethyst Marketing Proposal Template Presentation
Bring your marketing ideas to life with this eye-catching amethyst-themed presentation! Tailored for presenting your marketing proposals, this template helps you outline key strategies, campaigns, and target audiences in a sleek, professional design. Its bold layout ensures your message shines through. Compatible with PowerPoint, Keynote, and Google Slides.


26 diapositivas
Textures Company Profile Black Presentation
A company profile is a concise document that provides an overview of a business, its history, products or services, achievements, mission, vision, values, and other relevant information. This presentation template is designed for businesses to showcase their brand identity and services in an elegant and professional manner. With a dominant black color theme, this presentation exudes a sense of modernity and class, making it perfect for businesses in various industries. Introduce your company's history, mission, and values in a concise and compelling manner. Utilize the clean and clear typography to maintain a professional and sophisticated look.


6 diapositivas
Team Vision Infographic
Explore our collection of Slide Templates tailored to showcase your team's vision and future ambitions. These templates offer a blend of modern and professional designs that are perfect for laying out your team's objectives and strategies. Each slide is crafted to facilitate clear communication of your vision, ensuring every team member is aligned and motivated. These visually appealing templates are ideal for team meetings, strategic planning sessions, and leadership presentations. They are fully customizable, allowing you to adapt the colors, text, and graphics to match your team's identity and goals. Optimize your team's presentations with these versatile templates, designed to promote understanding and enthusiasm for your collective vision.


7 diapositivas
Medical Care Infographic Presentation
A medical infographic is a visual representation of information related to medicine, health and healthcare. This infographic design can help people understand complex topics and communicate more effectively about science. This medical infographic template features a dynamic background image, along with a visual representation of information related to healthcare. It is a great way to promote your health-related content. This infographic is a great tool to provide patients with a breakdown of information. This template is compatible with Powerpoint, Keynote and Google Slides.


7 diapositivas
Project Schedule Infographics
The Project Schedule Infographic offers a dynamic and clear visual representation of project timelines and tasks. Fully compatible with PowerPoint, Google Slides, and Keynote. It is designed to facilitate project managers, team leads, and members in tracking milestones and deadlines effectively. The infographic breaks down the week into individual days and assigns specific tasks and goals to each, allowing for a comprehensive overview of the project's progression. This schedule template is not only a tool for maintaining organization within a team but also acts as a communication aid to provide updates at a glance.


7 diapositivas
6 Steps Circle Diagram
Streamline complex processes with our "6 Steps Circle Diagram" template. This visually appealing infographic elegantly organizes interconnected stages in a circular layout, ideal for outlining workflows, development cycles, or project phases. Each segment is color-coded and provides ample space for detailed descriptions, enhancing the clarity and effectiveness of presentations. This format allows viewers to easily grasp relationships and dependencies, improving comprehension and retention. Perfect for educators, project managers, and business analysts, this template ensures that all stages are interconnected and clearly communicated. Compatible with PowerPoint, Keynote, and Google Slides, it's a versatile tool for professional and educational environments.


4 diapositivas
Three-Dimensional Business Model Slide Presentation
Visualize growth and complexity with the Three-Dimensional Business Model Slide Presentation. This template uses sleek 3D chart elements to illustrate layered business concepts across 1D, 2D, and 3D perspectives. Ideal for modeling scalability, market maturity, or performance comparisons. Fully customizable in PowerPoint, Keynote, and Google Slides.


6 diapositivas
Results & Milestones Shown with Numbers
Track progress and showcase success with the Results & Milestones Shown with Numbers Presentation. This visual timeline highlights five key steps using numbered markers connected by a path—perfect for reporting achievements, product phases, or strategic milestones. Fully editable in PowerPoint, Keynote, and Google Slides.


7 diapositivas
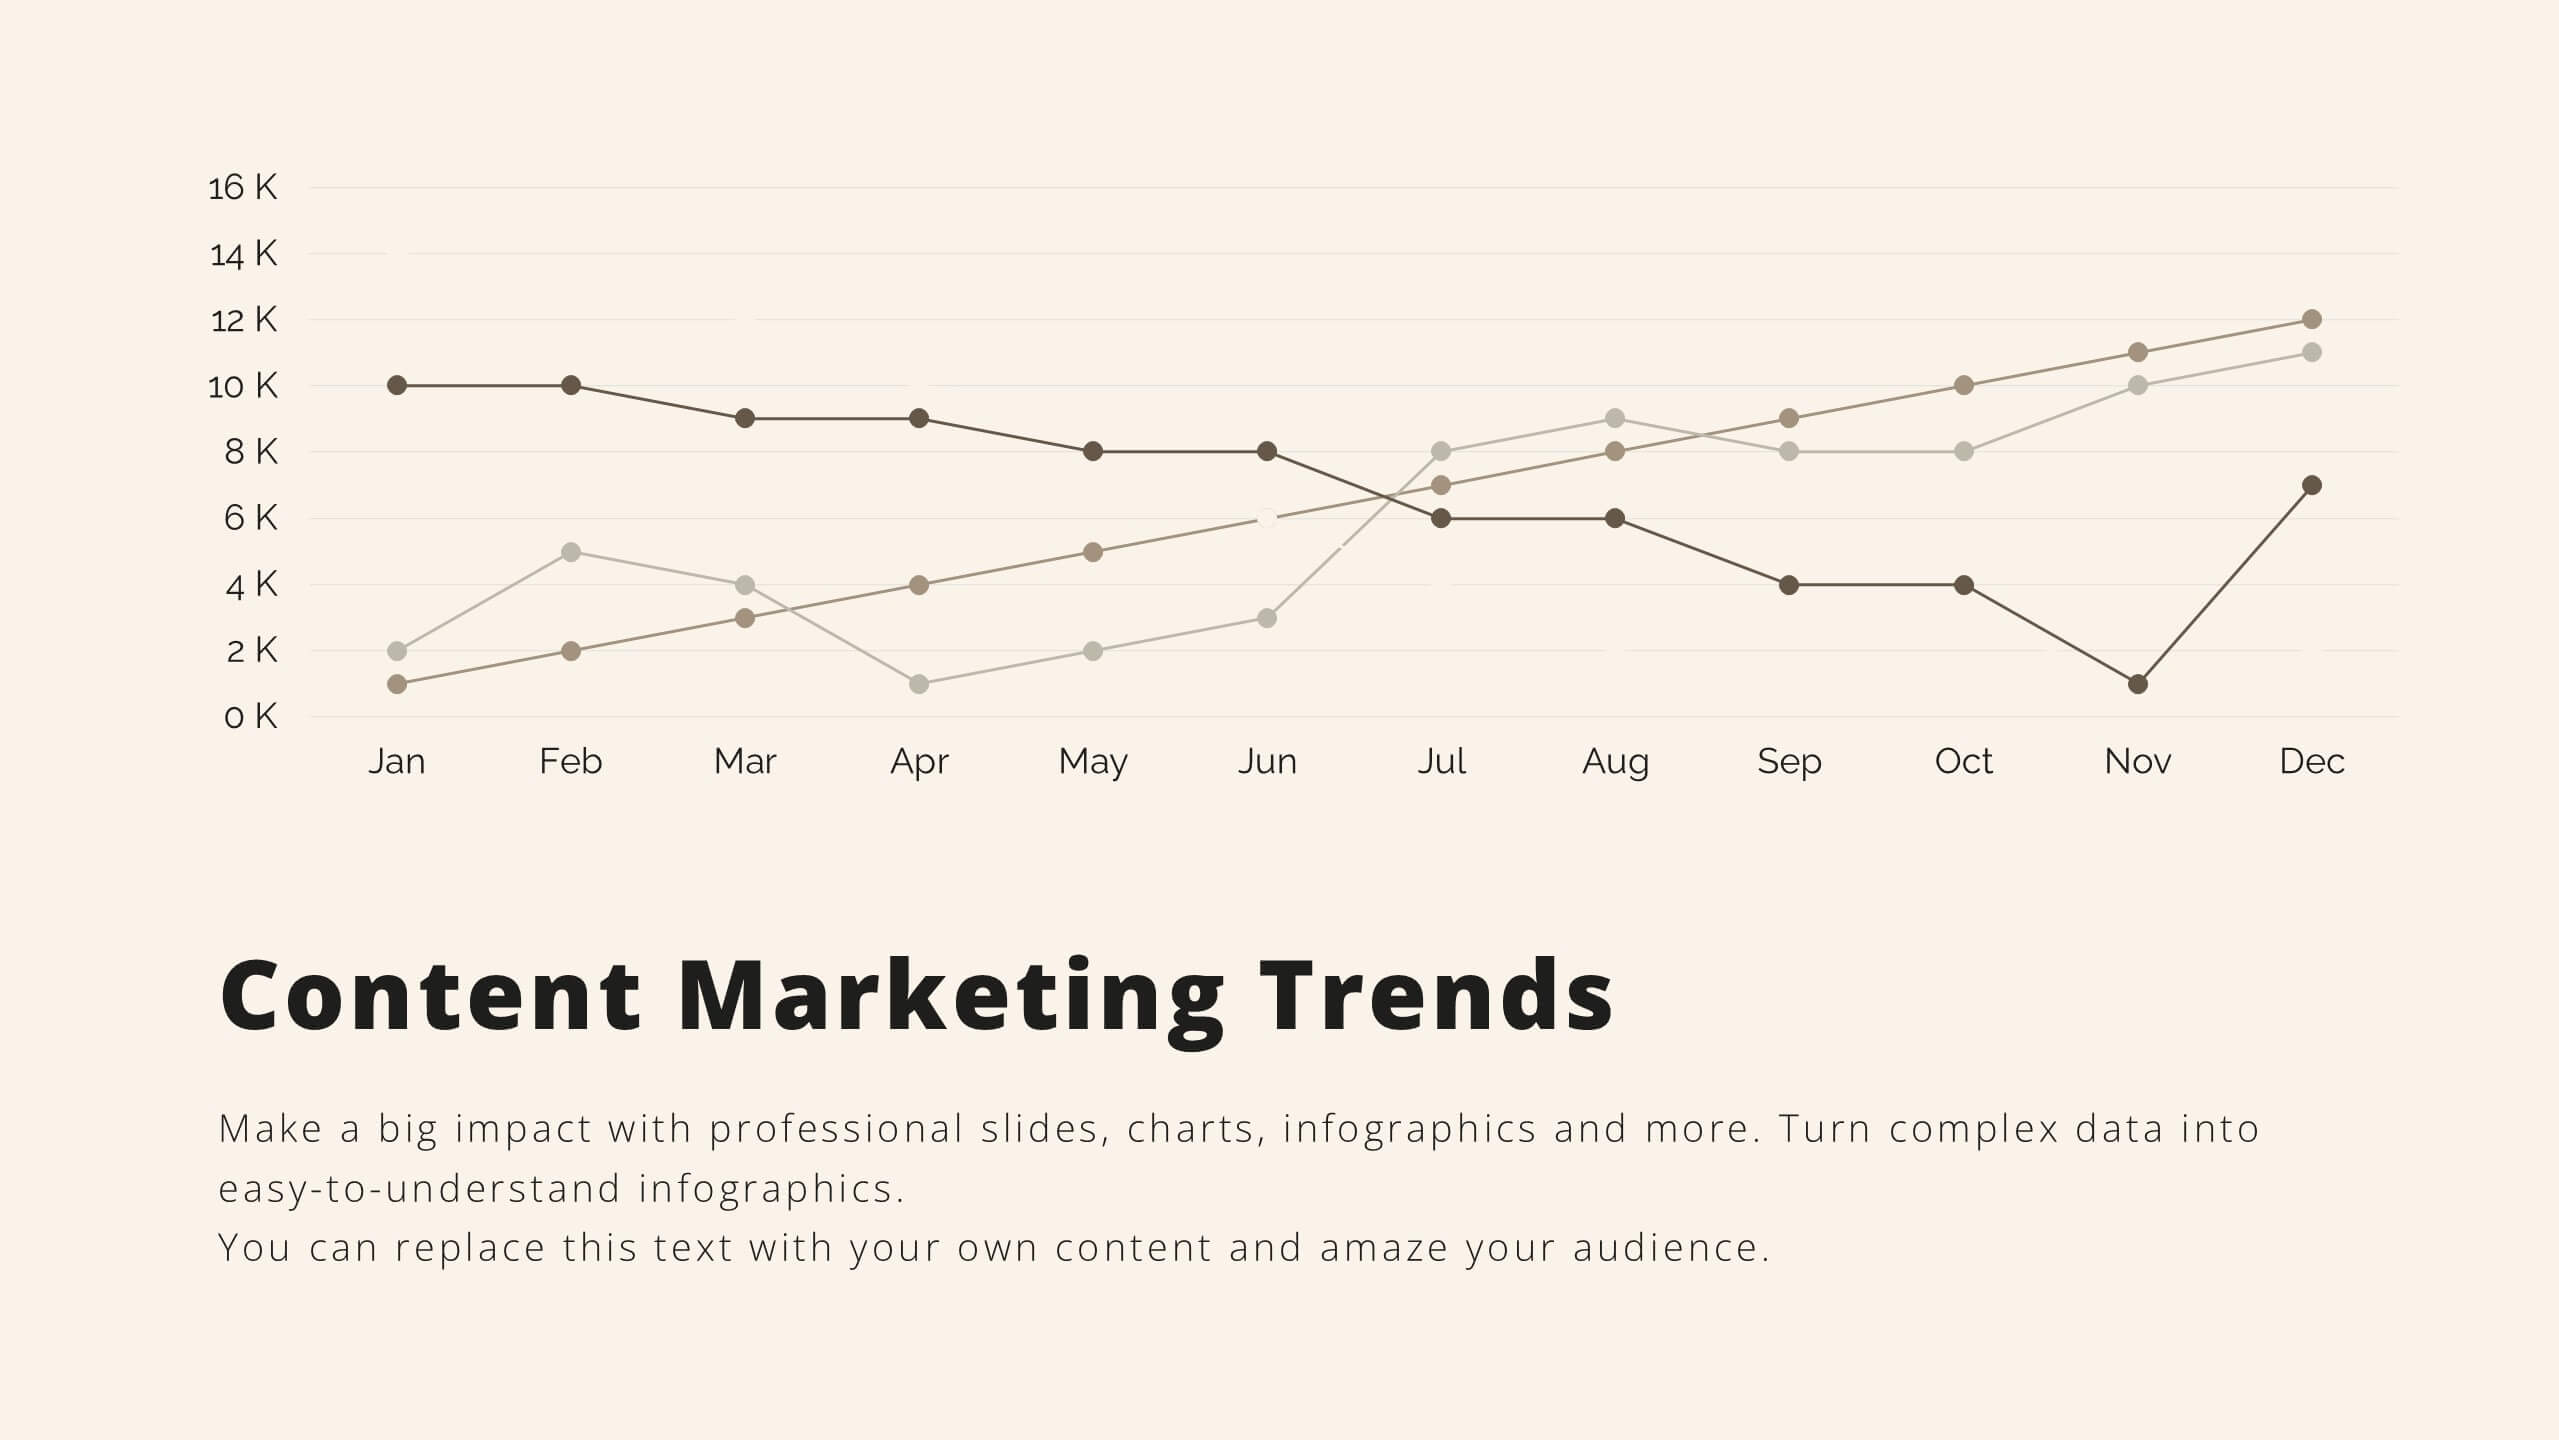
Data Analysis Infographics Presentation Template
Data Analysis is a process used to turn raw data into information useful for decision making by users. Data that has been collected, is analyzed to answer questions, or disprove theories. Analyses include tasks such as statistical modeling and hypothesis testing. This template can be used to collect data via surveys or experiments. It is a great tool for those conducting research and analyzing data. This template allows you to create an efficient and organized data collection process using multiple methods of data collection. Graphs and statistics are available to help visualize your data.


7 diapositivas
SEO Optimization Infographic Presentation
Search engine optimization (SEO) is the practice of optimizing websites and digital content to rank higher in search engine result pages. Use this template to lay out the basics of optimization, including best practices and examples, as well as a checklist for everything you need to know. This template is perfect to show your audience a step by step process of SEO. It includes a great space to enter data, knowledge and helpful tips with a simple design and bright colors. This can be used in an article, presentation or even a blog post to give your audience all the information needed about SEO.


5 diapositivas
Porter's Model of Competitive Strategy Presentation
The Porter's Model of Competitive Strategy Presentation offers a unique and modern take on the classic 5 Forces framework. Each force—Buyers, Suppliers, Competitors, Substitutions, and New Entry—is visually represented in a pentagonal arrangement, making it easy to see how each element interacts. With customizable sections for text and icons, this layout is perfect for strategic analysis, consulting reports, or business planning. Compatible with PowerPoint, Keynote, and Google Slides.


6 diapositivas
Framework Version Infographic
A framework infographic is a visual representation that outlines a structured approach, model, or framework for understanding a concept, solving a problem, or making decisions. This infographic template involves visually presenting different versions of a software or system framework along with their features and benefits. Summarize the improvements and benefits introduced by each framework version. This template provides a clear overview of the evolution of the framework and how each version brought value to users. By using icons, graphics, and concise descriptions, you can make the information easily digestible and engaging for your audience.


5 diapositivas
Product Launch Pitch Deck Presentation
Launch your product with impact using this Product Launch Pitch Deck template. Designed to outline key strategies, market positioning, and product benefits, this template helps you deliver a compelling presentation. Engage stakeholders with clear, structured visuals. Fully compatible with PowerPoint, Keynote, and Google Slides for seamless customization.


5 diapositivas
Management Levels Hierarchy Presentation
Effectively outline Management Levels Hierarchy with this structured pyramid diagram. Ideal for corporate presentations, HR strategy, and leadership training, this template visually represents top, middle, and lower management roles. Fully customizable in PowerPoint, Keynote, and Google Slides, making it easy to tailor for business planning and organizational structure discussions.


7 diapositivas
Cycle Infographic Presentation Template
A cycle infographic is a visual representation of a repeating pattern of events. This template can be used to show the stages of a process or the sequence of events that make up a cycle. The purpose of this cycle infographic is to provide a clear and easy-to-understand illustration of a repeating pattern, helping to clarify the steps involved and to show the interrelationships between different elements. This well-designed cycle infographic can help you identify areas for improvement, improve communication and collaboration, and support decision-making by providing a view of the cycle.


5 diapositivas
Porter's Five Forces Competitive Analysis Presentation
Illustrate market dynamics and industry competitiveness using Porter’s Five Forces. This template covers New Entrants, Buyer Power, Supplier Power, Substitutes, and Customer Power in a clean, letter-coded format. Fully editable in PowerPoint, Keynote, and Google Slides, it's perfect for strategic analysis and investor presentations. Clear, structured, and easy to customize.