


Características


¿Tienes alguna pregunta?
Recomendar
22 diapositivas
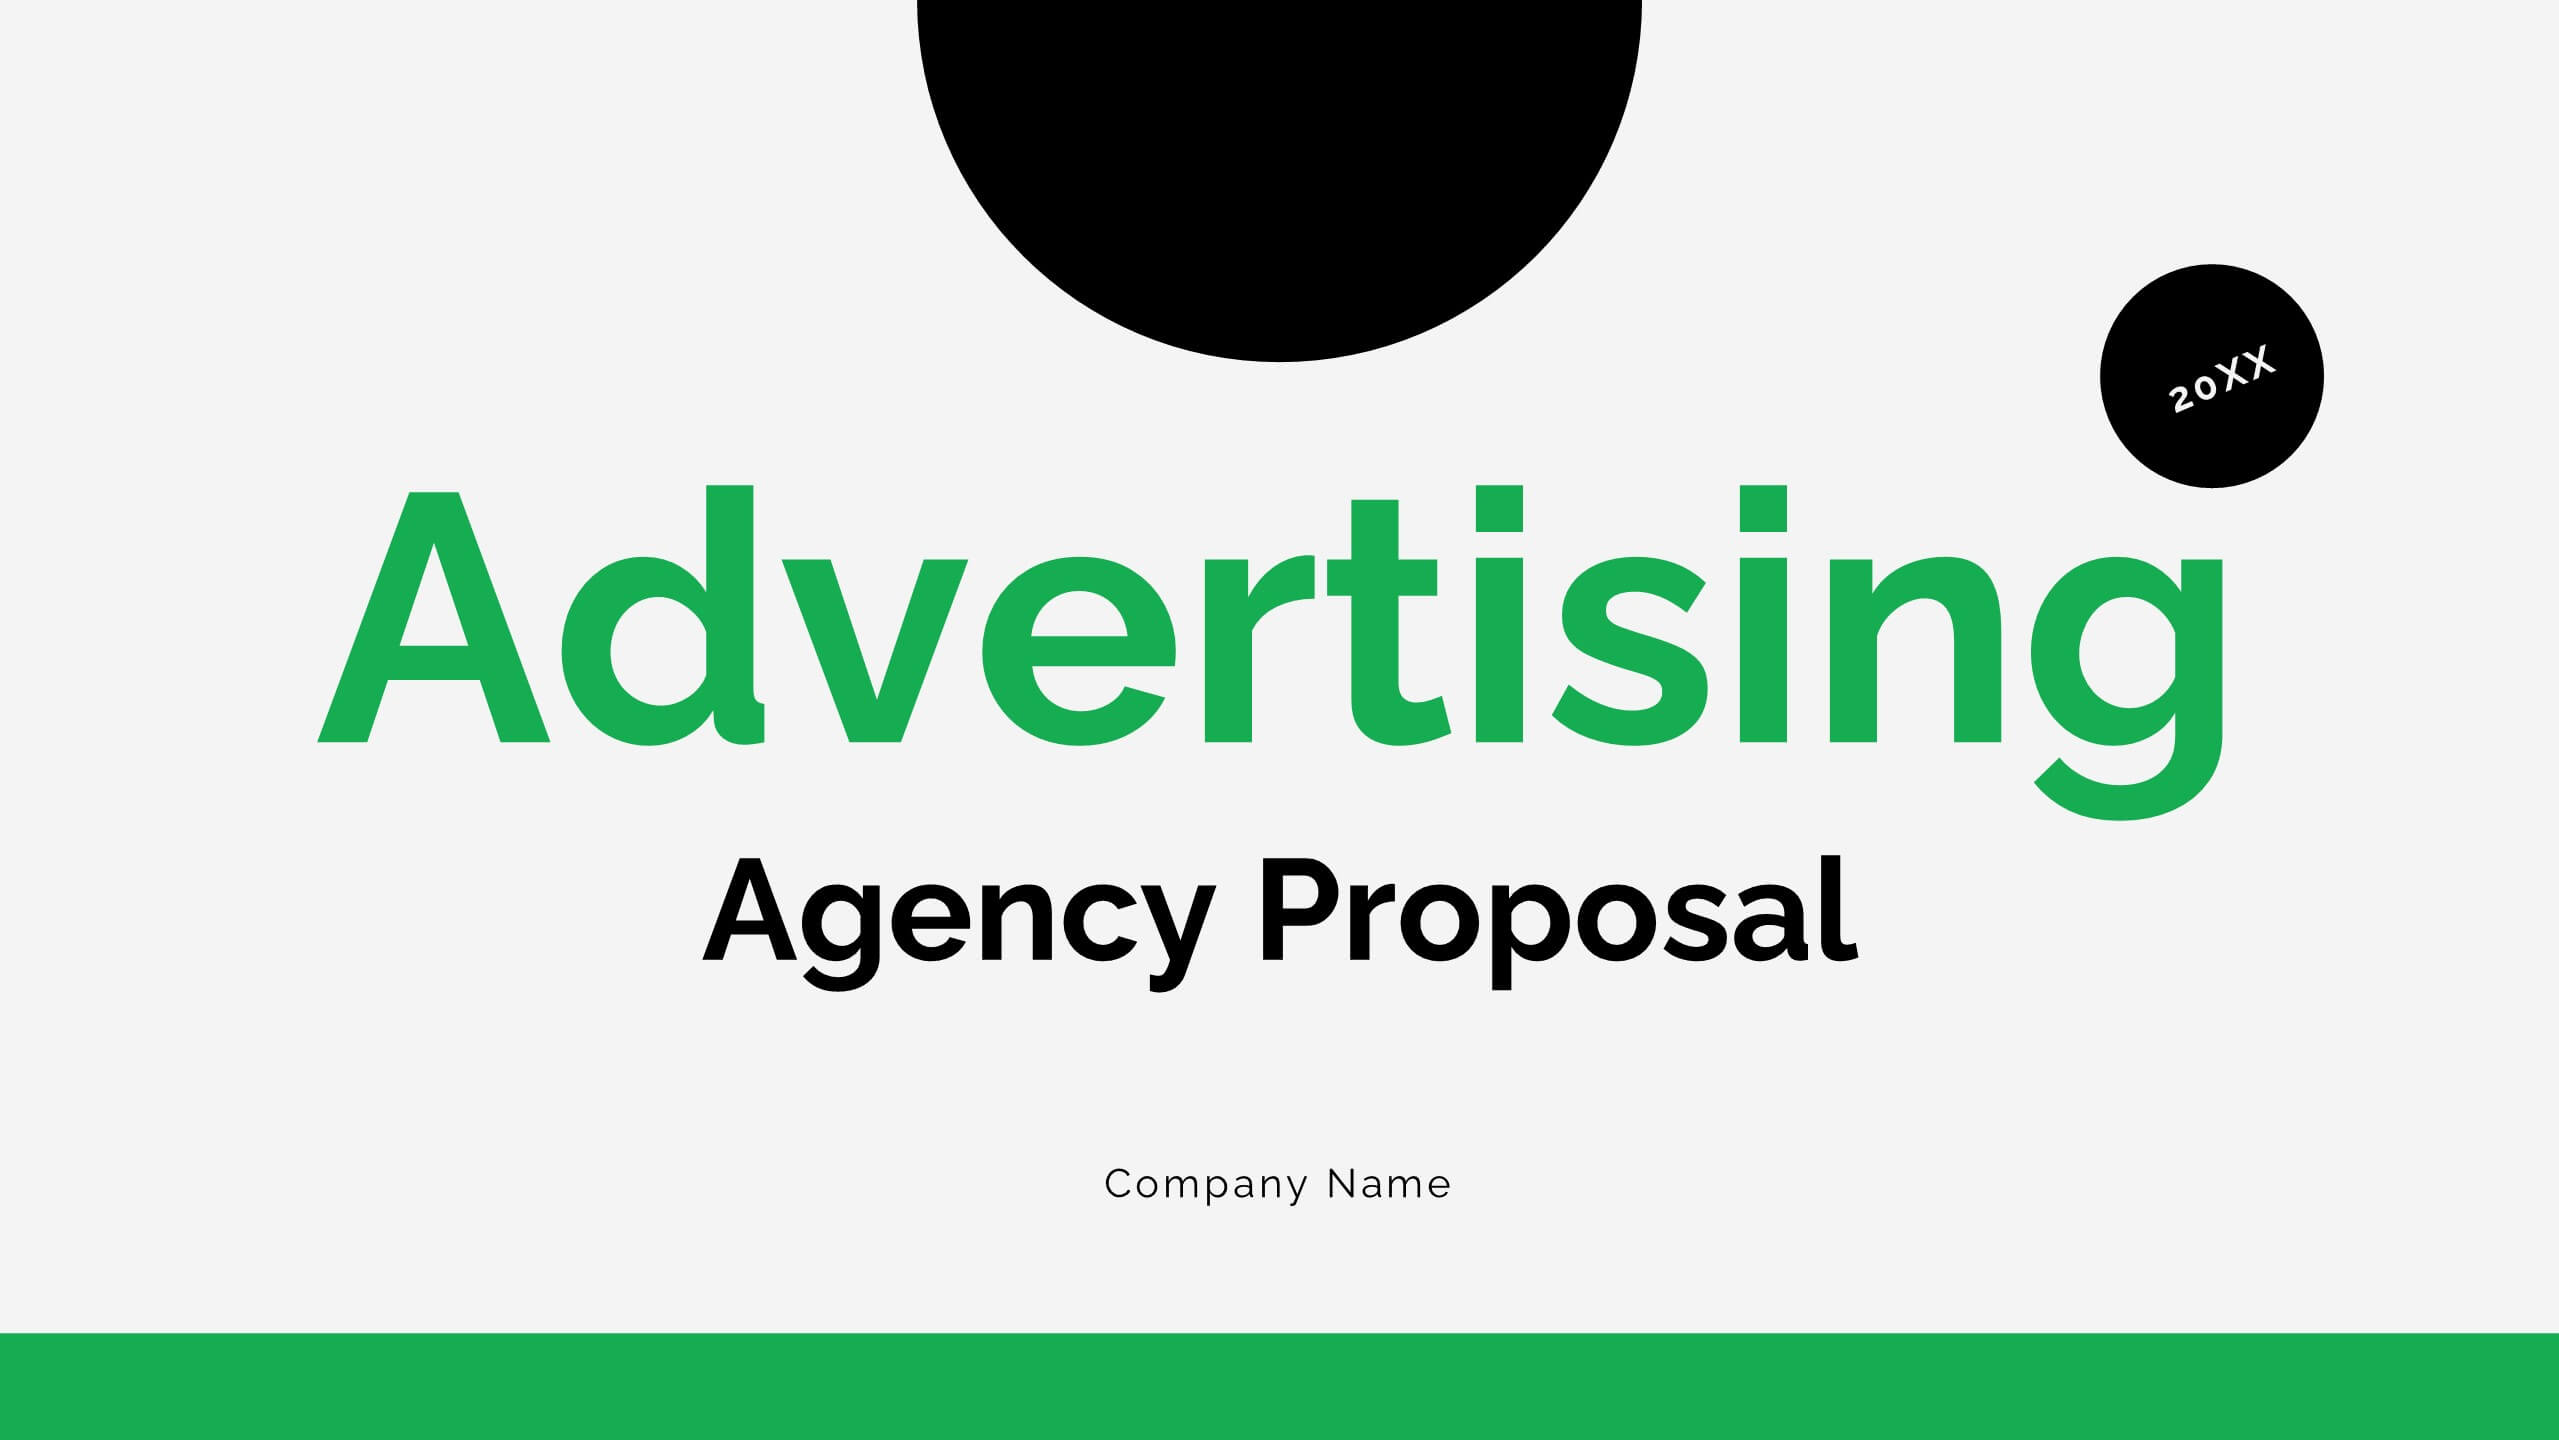
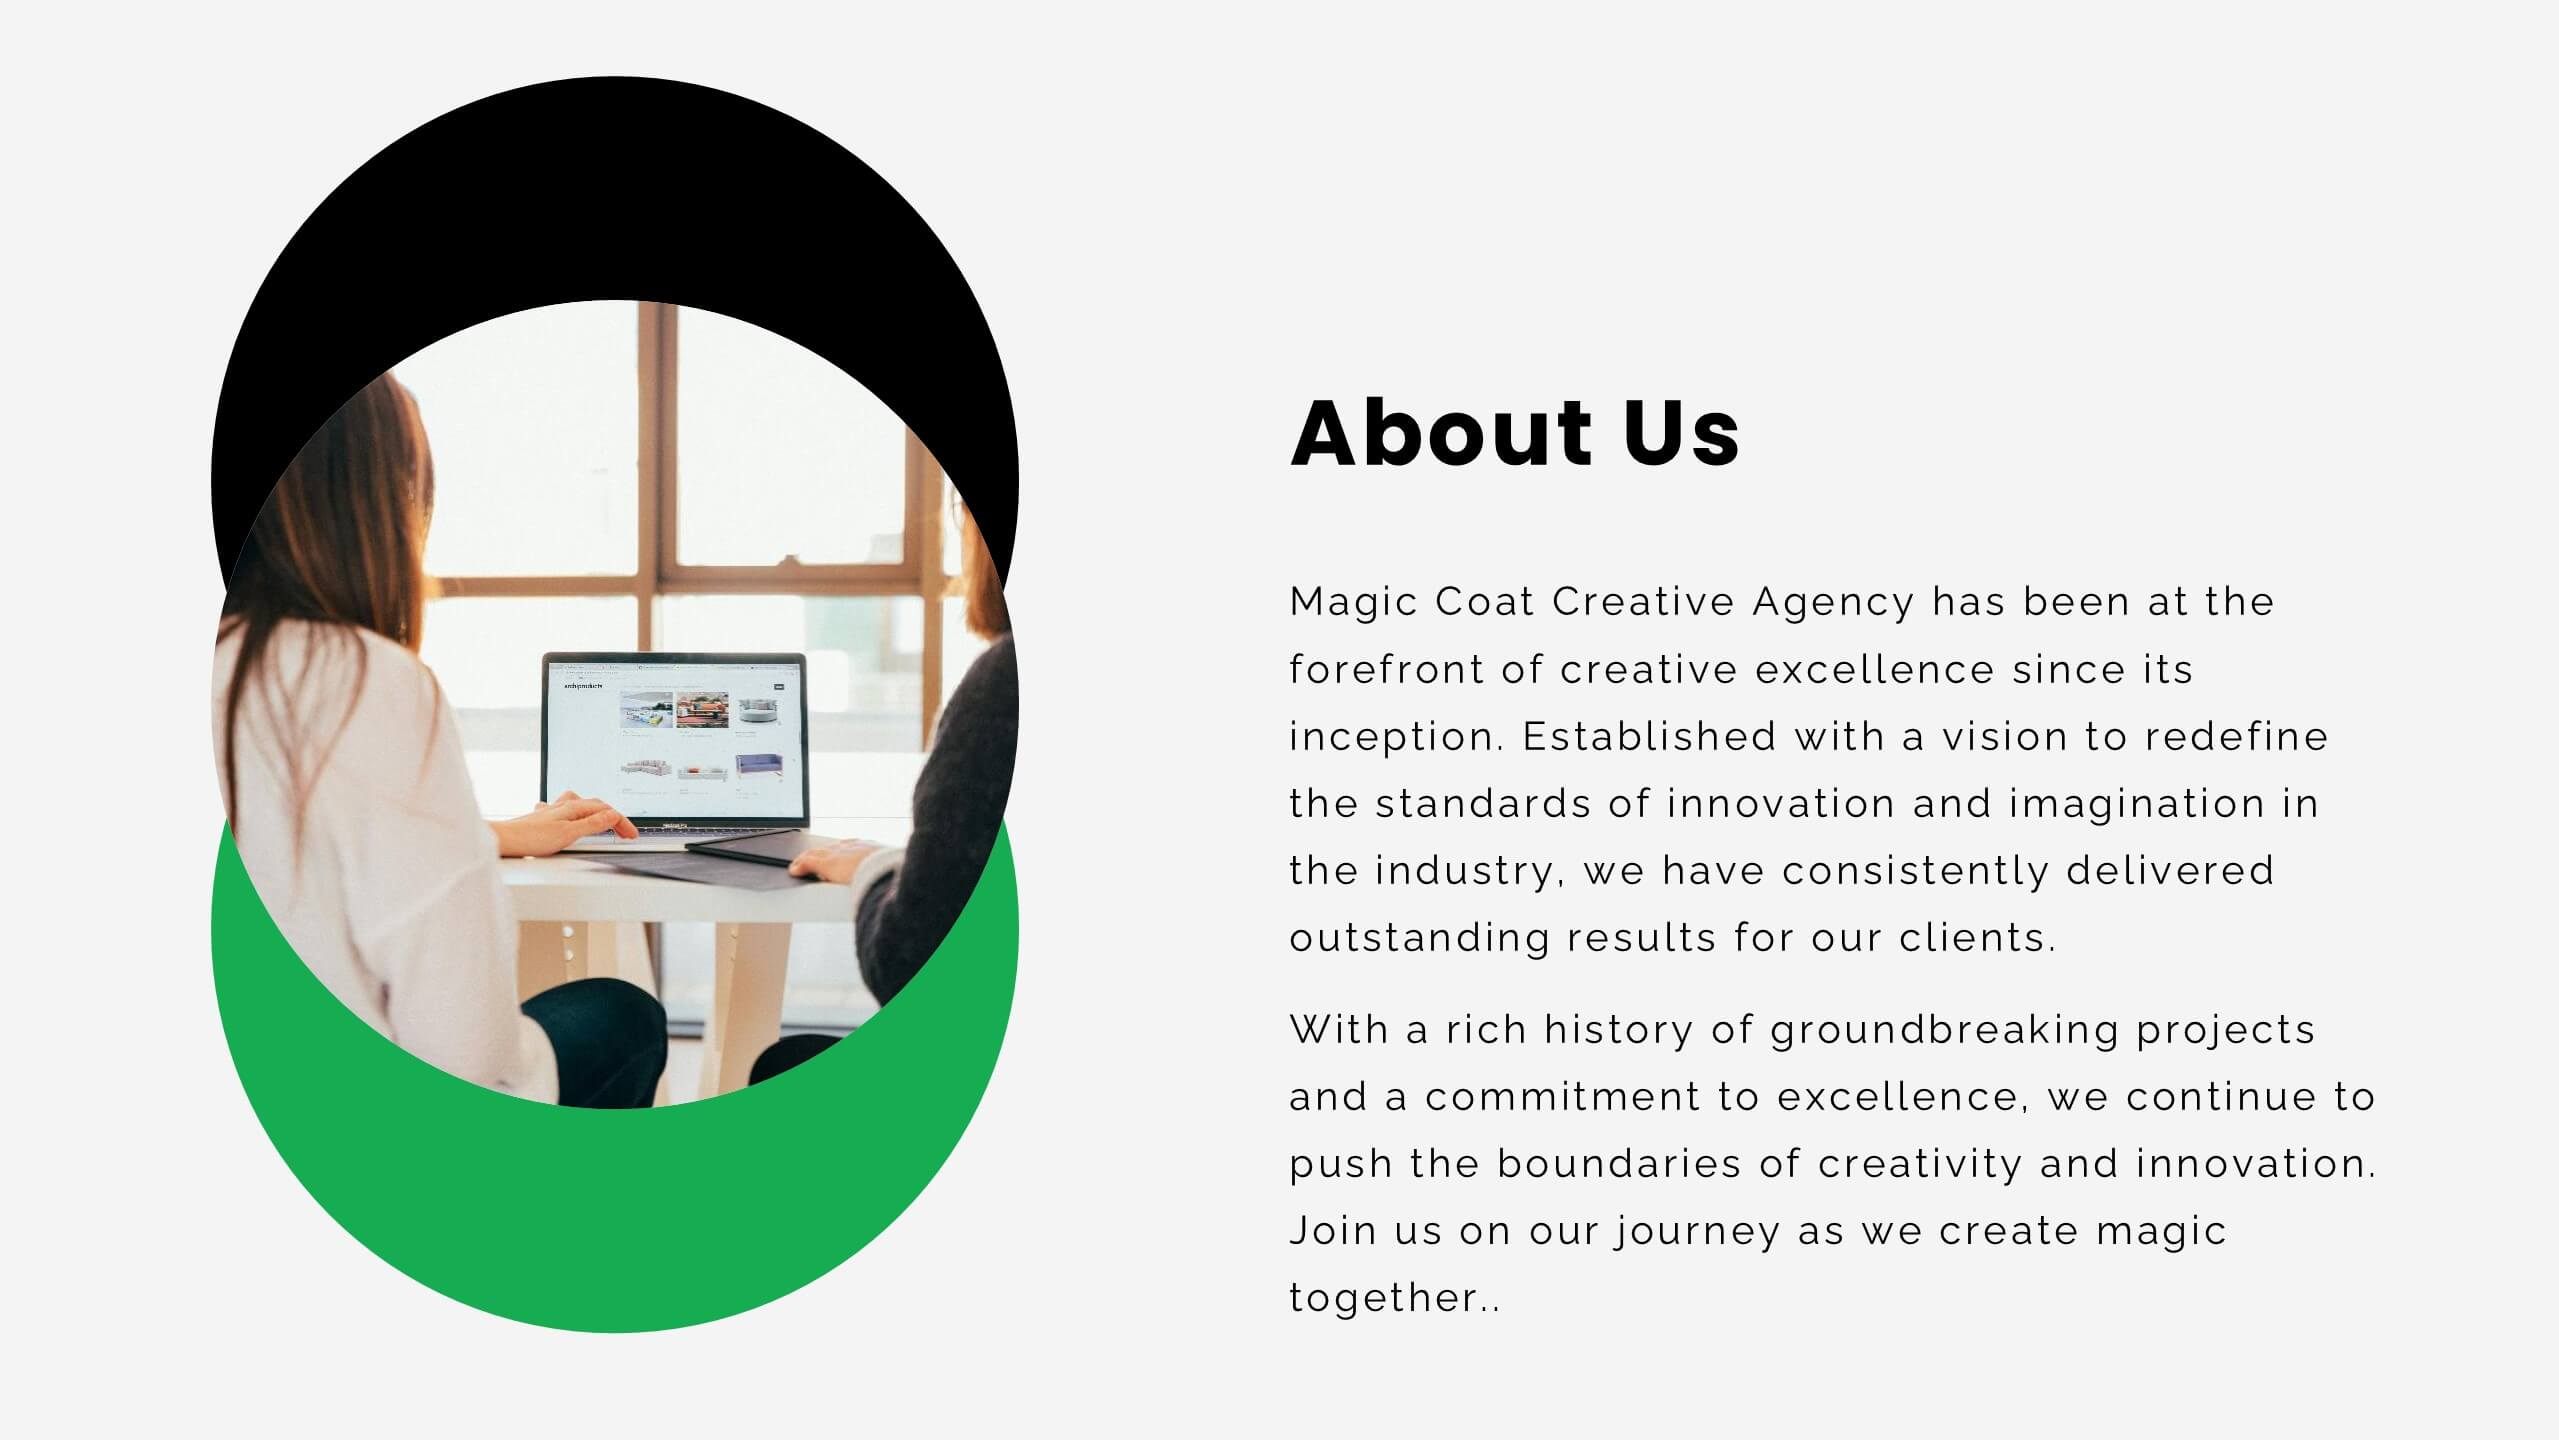
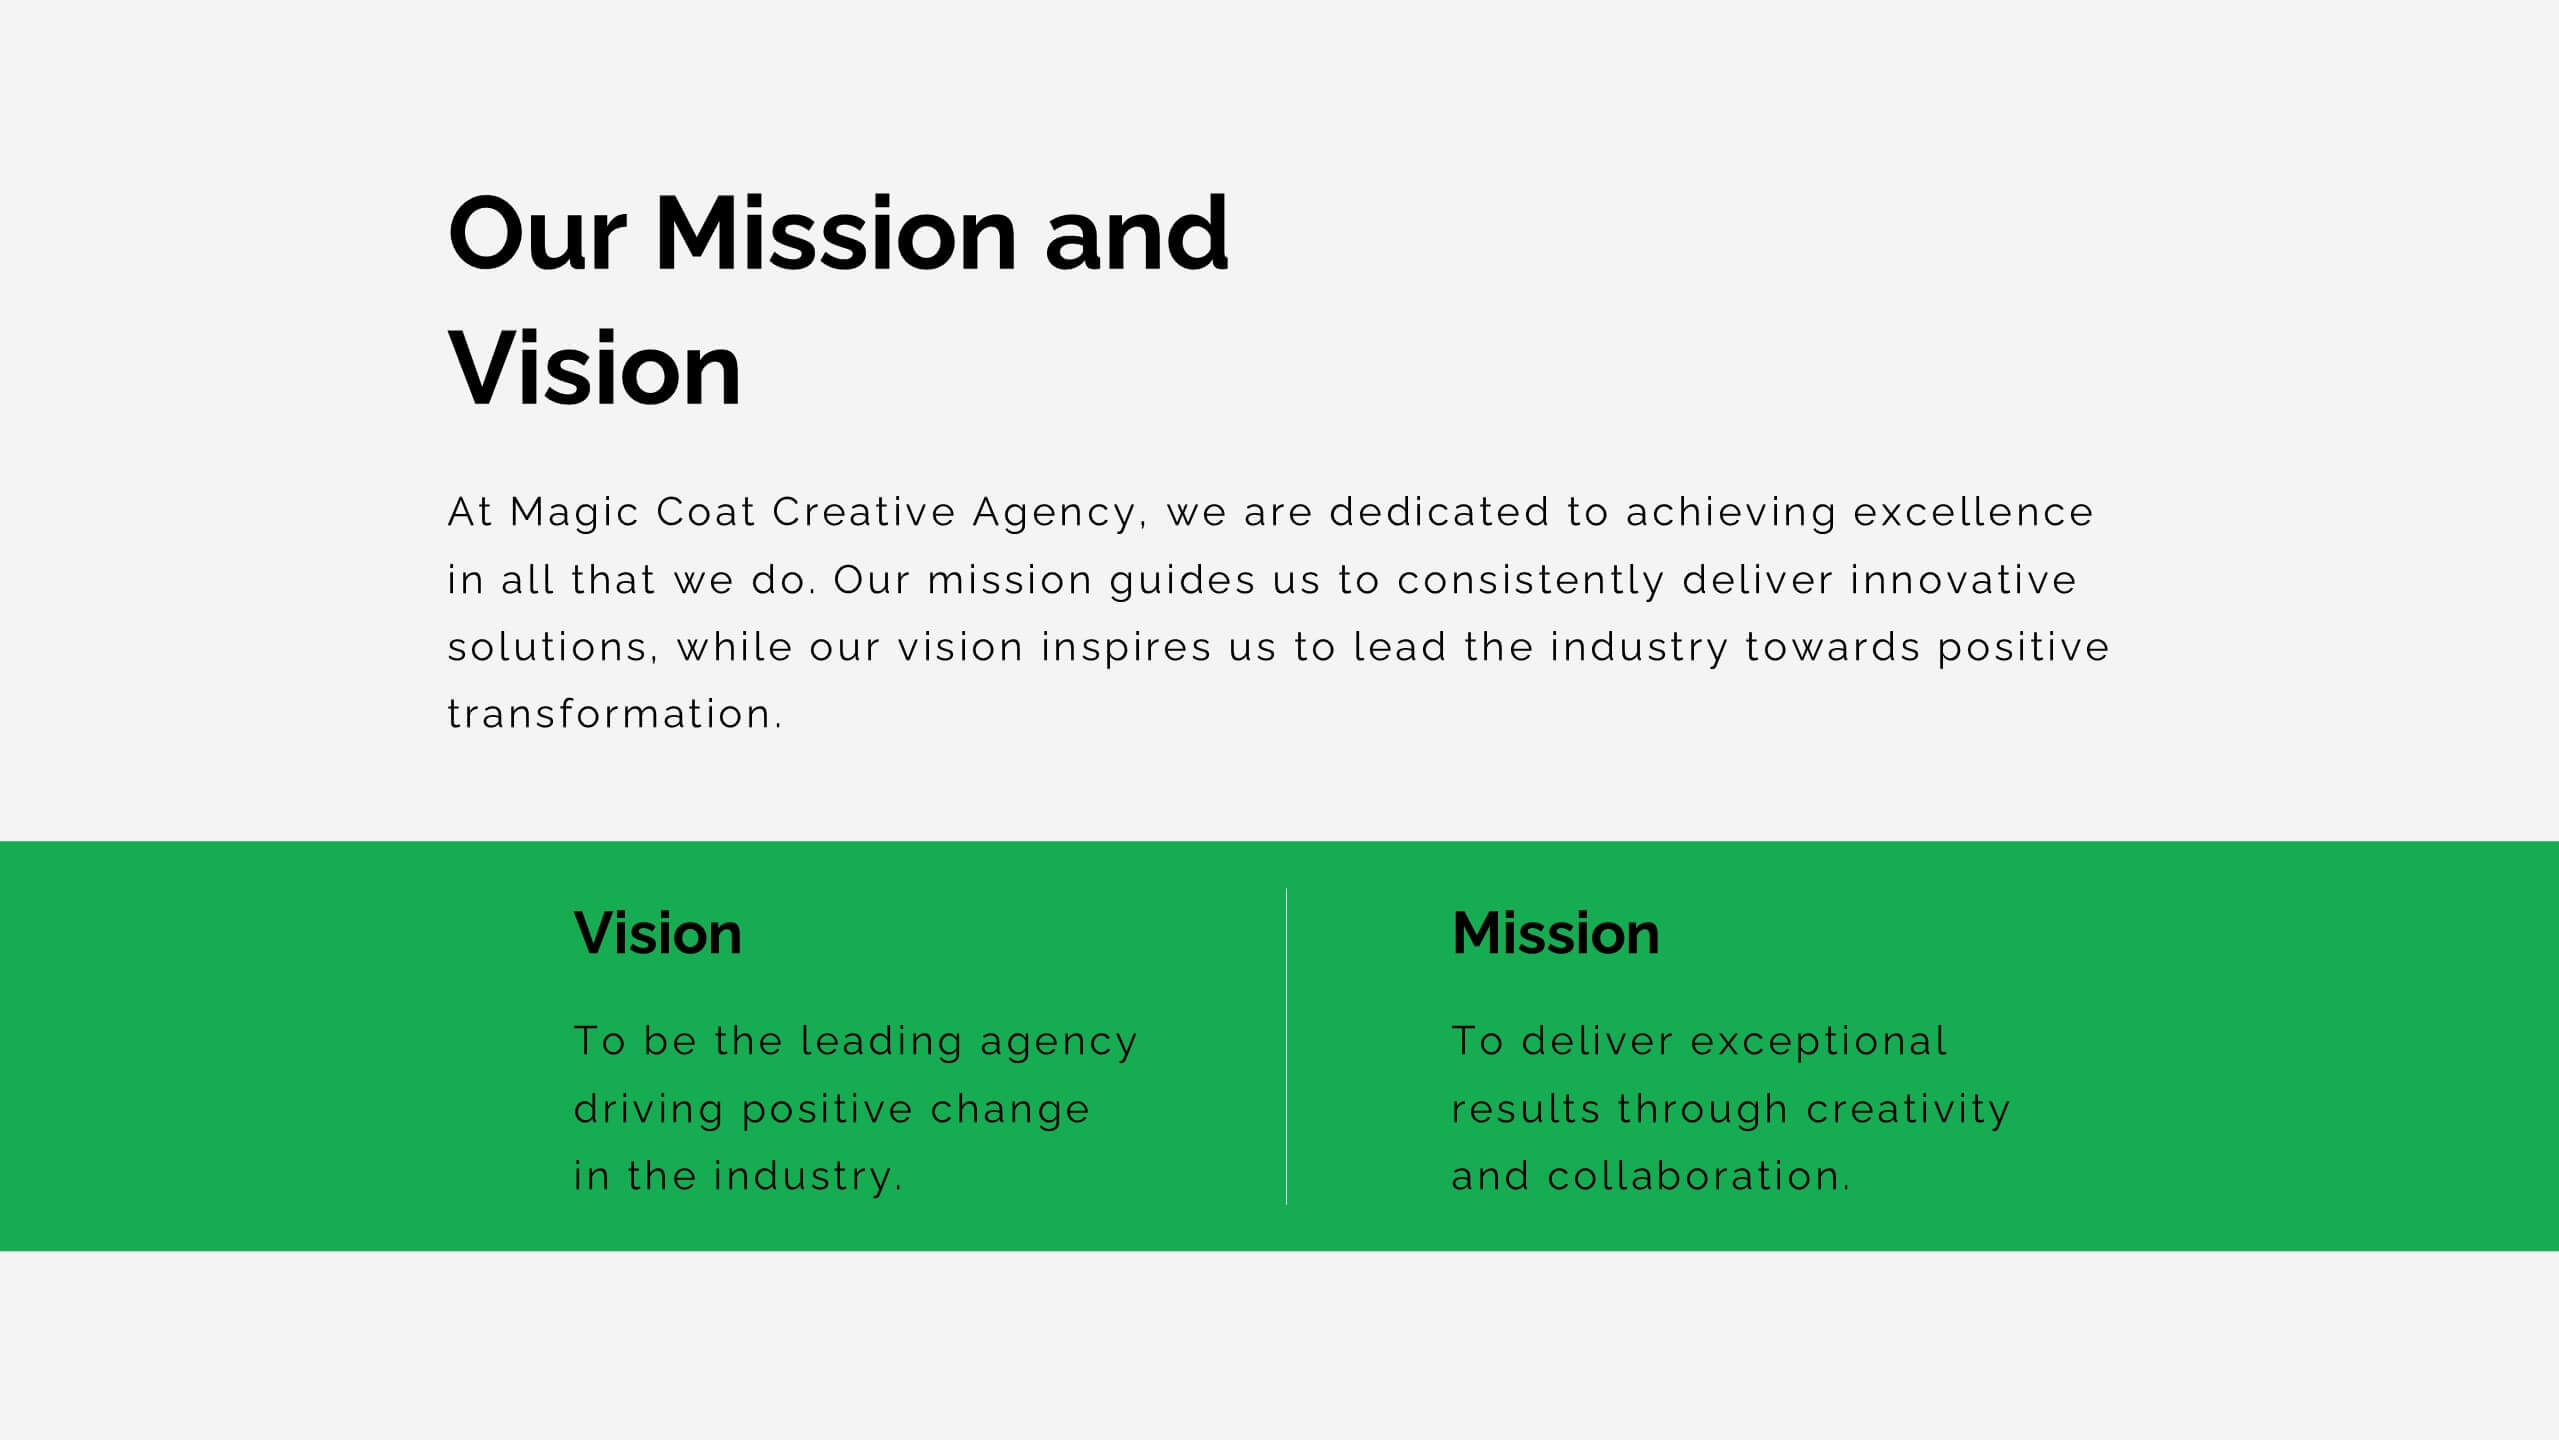
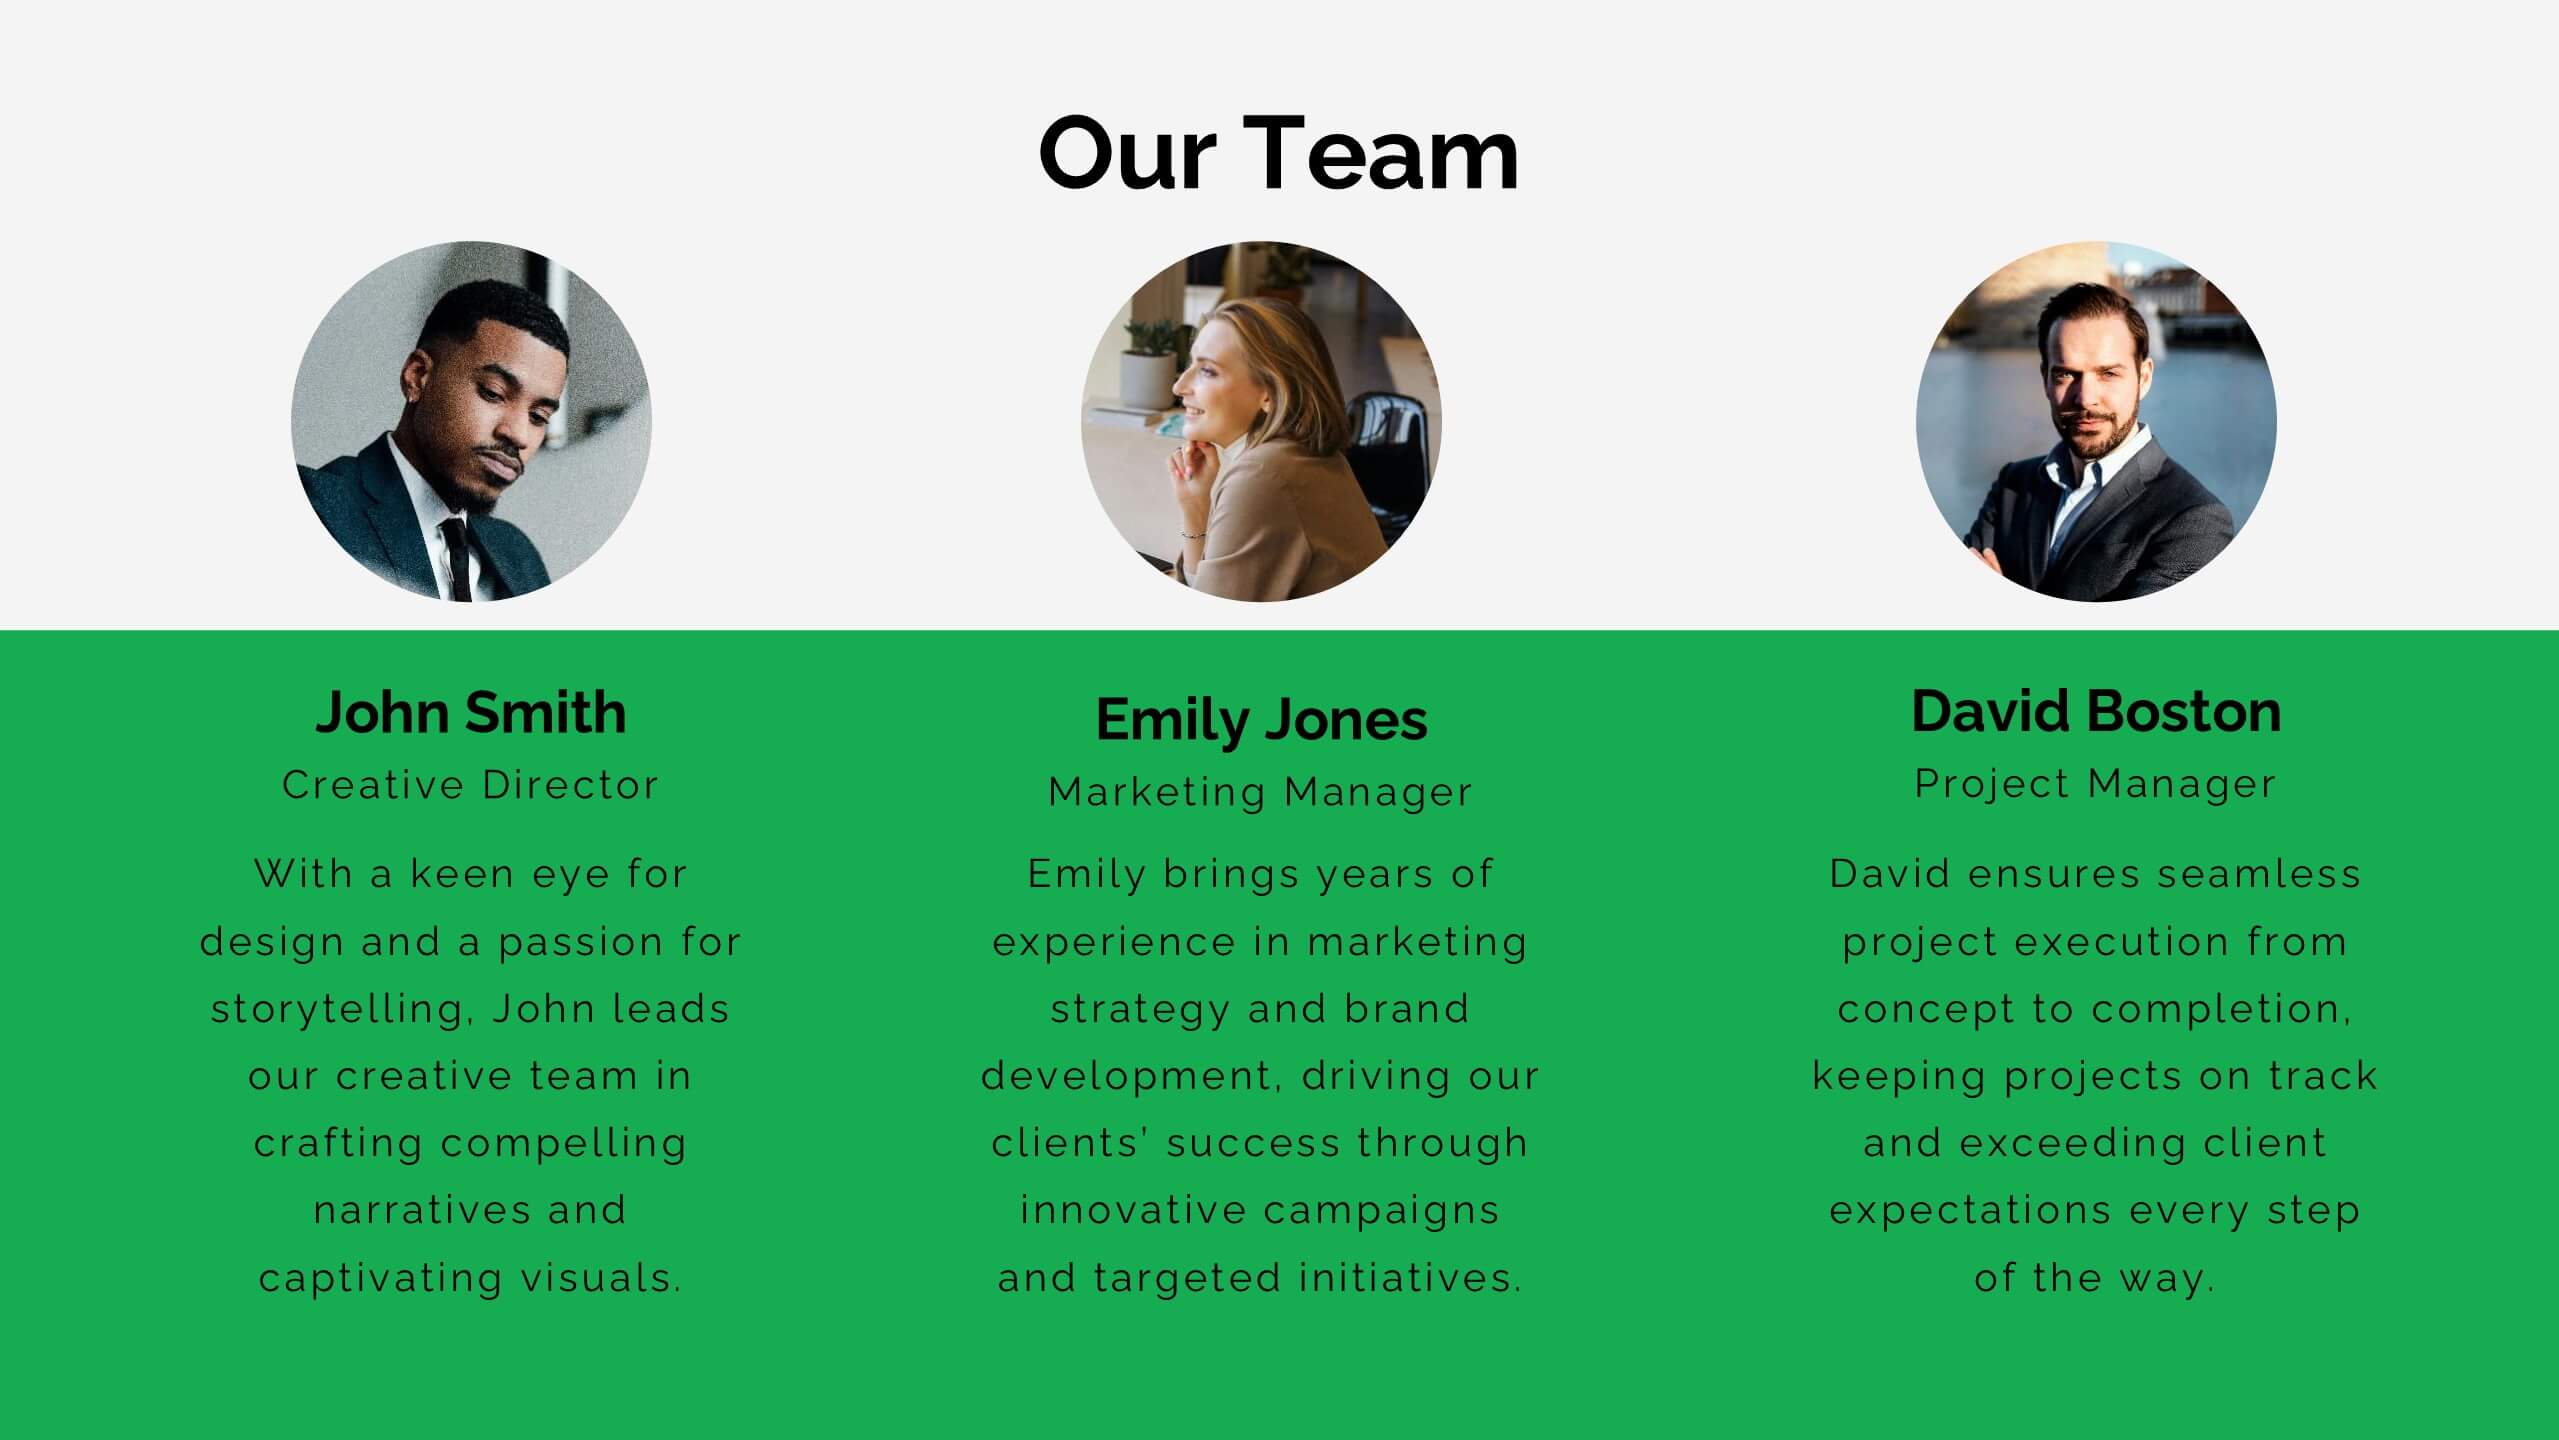
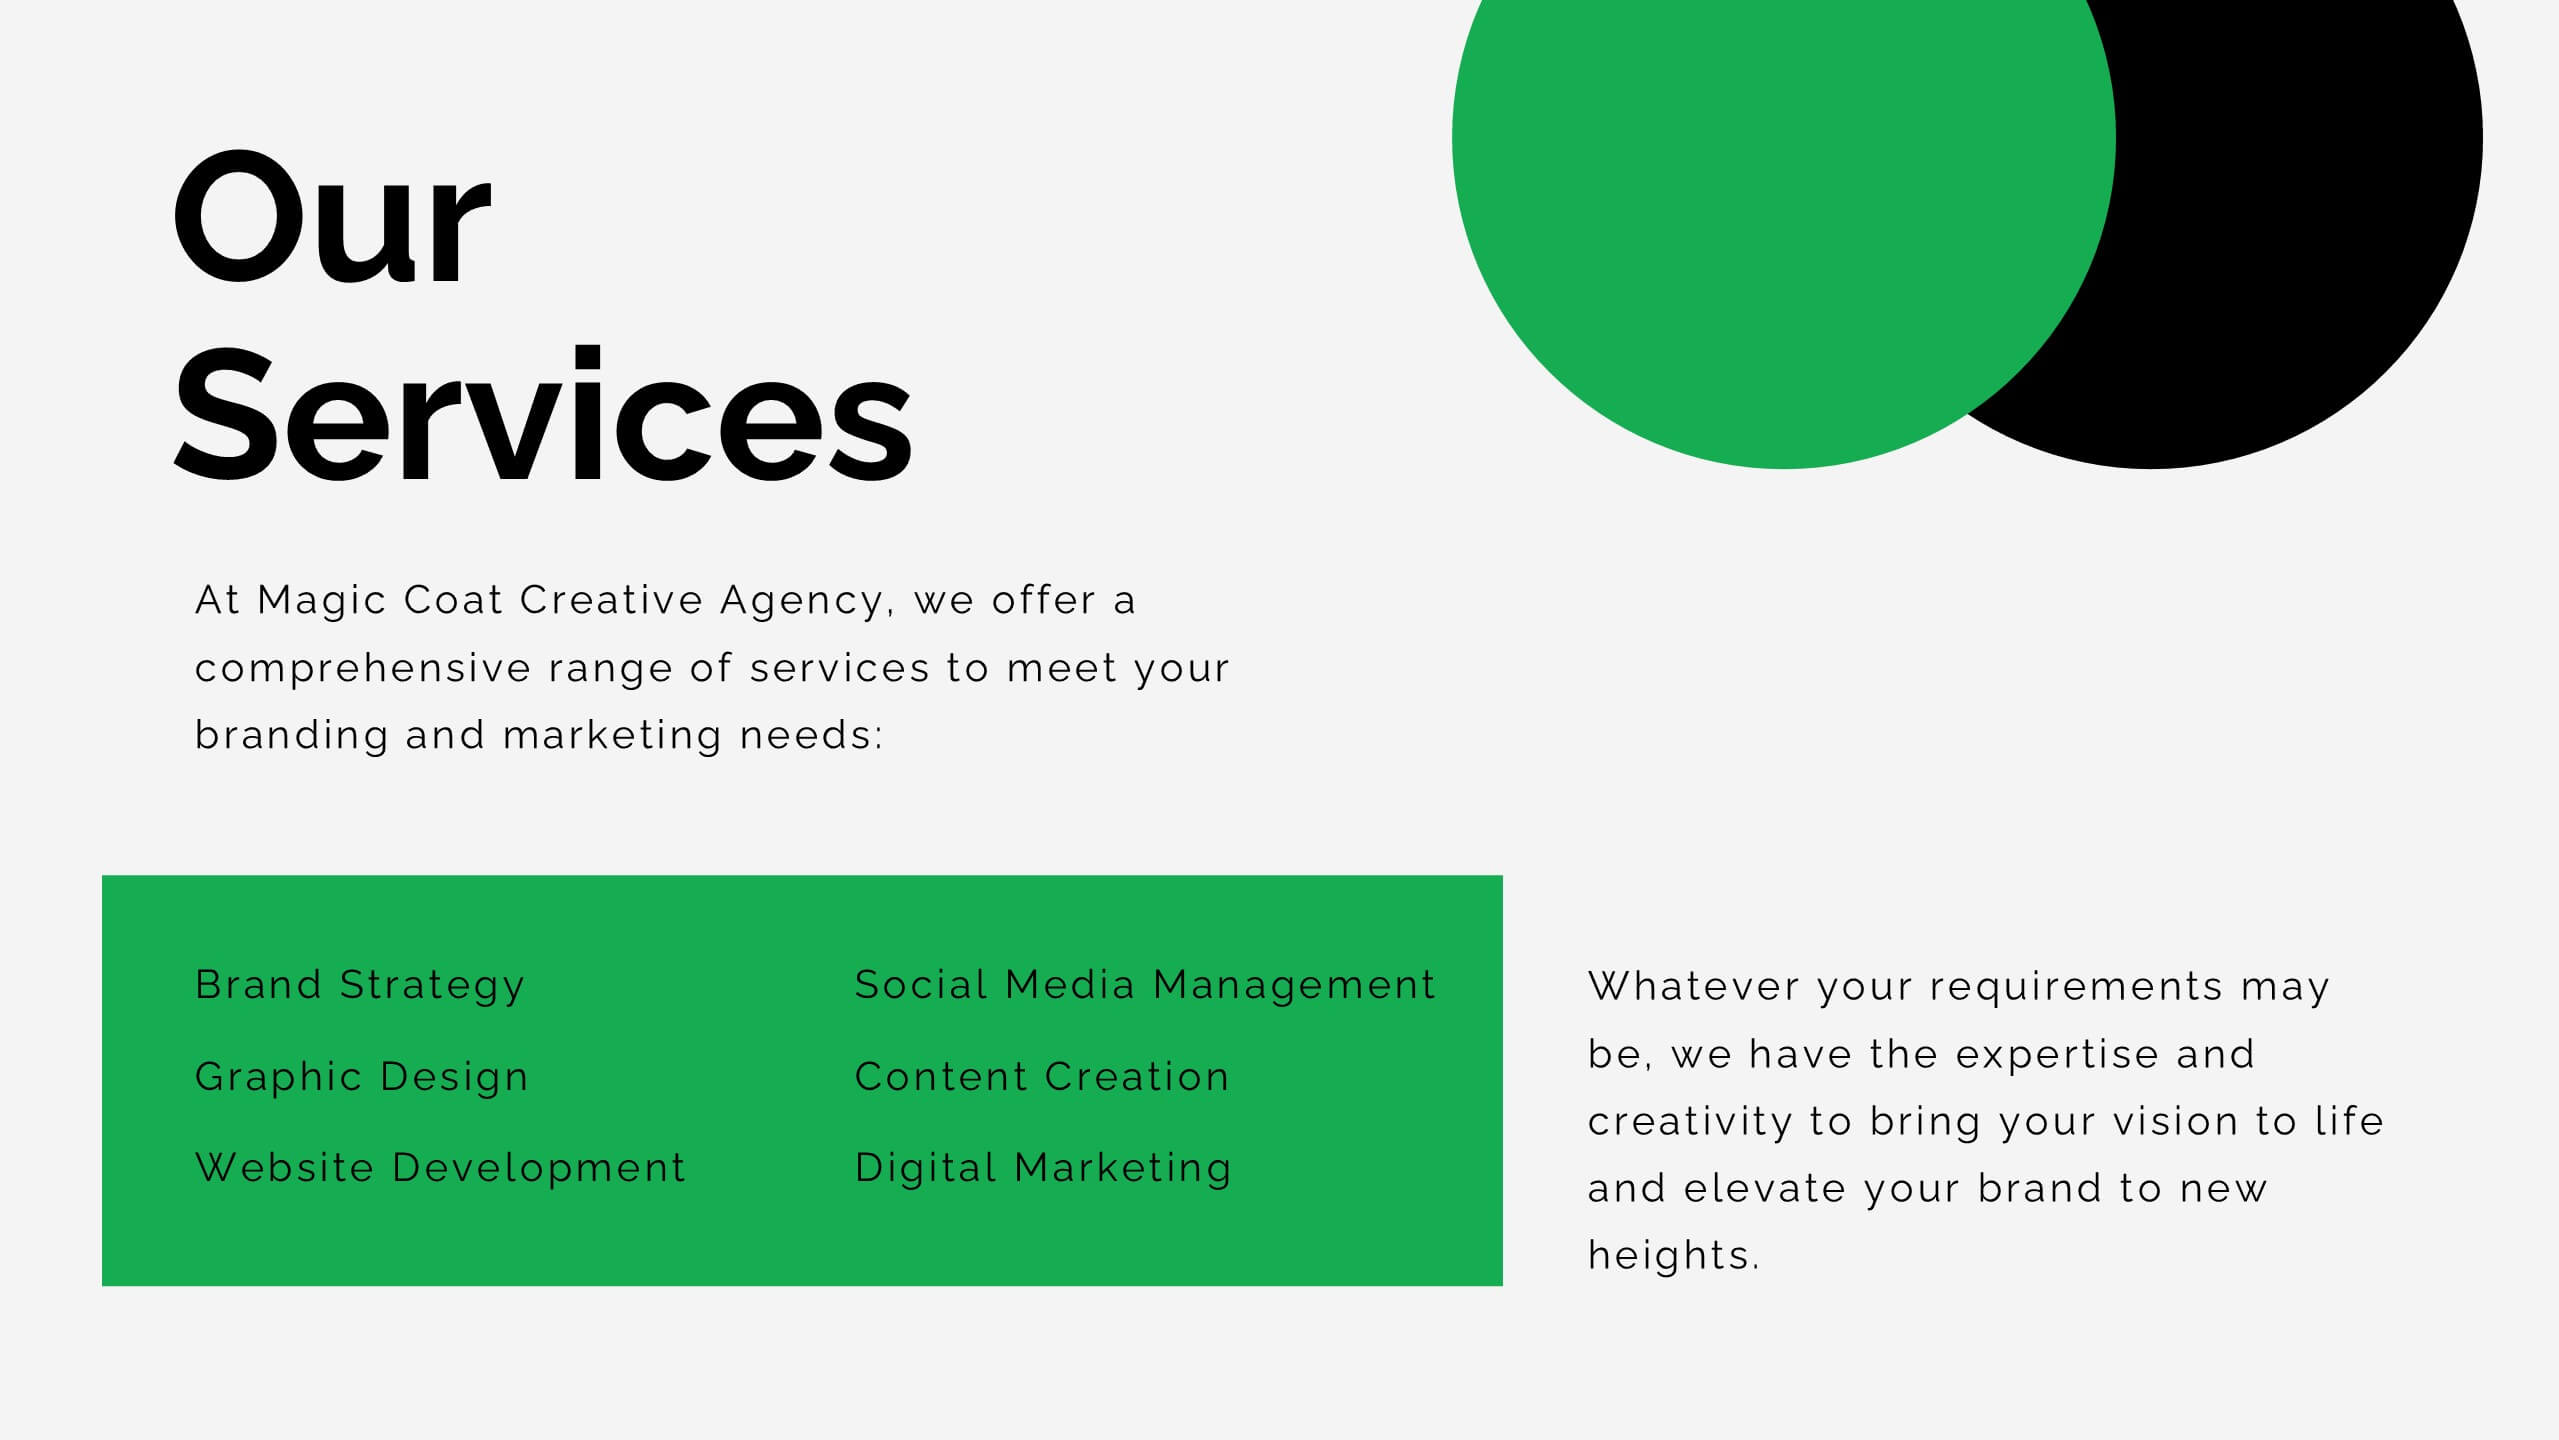
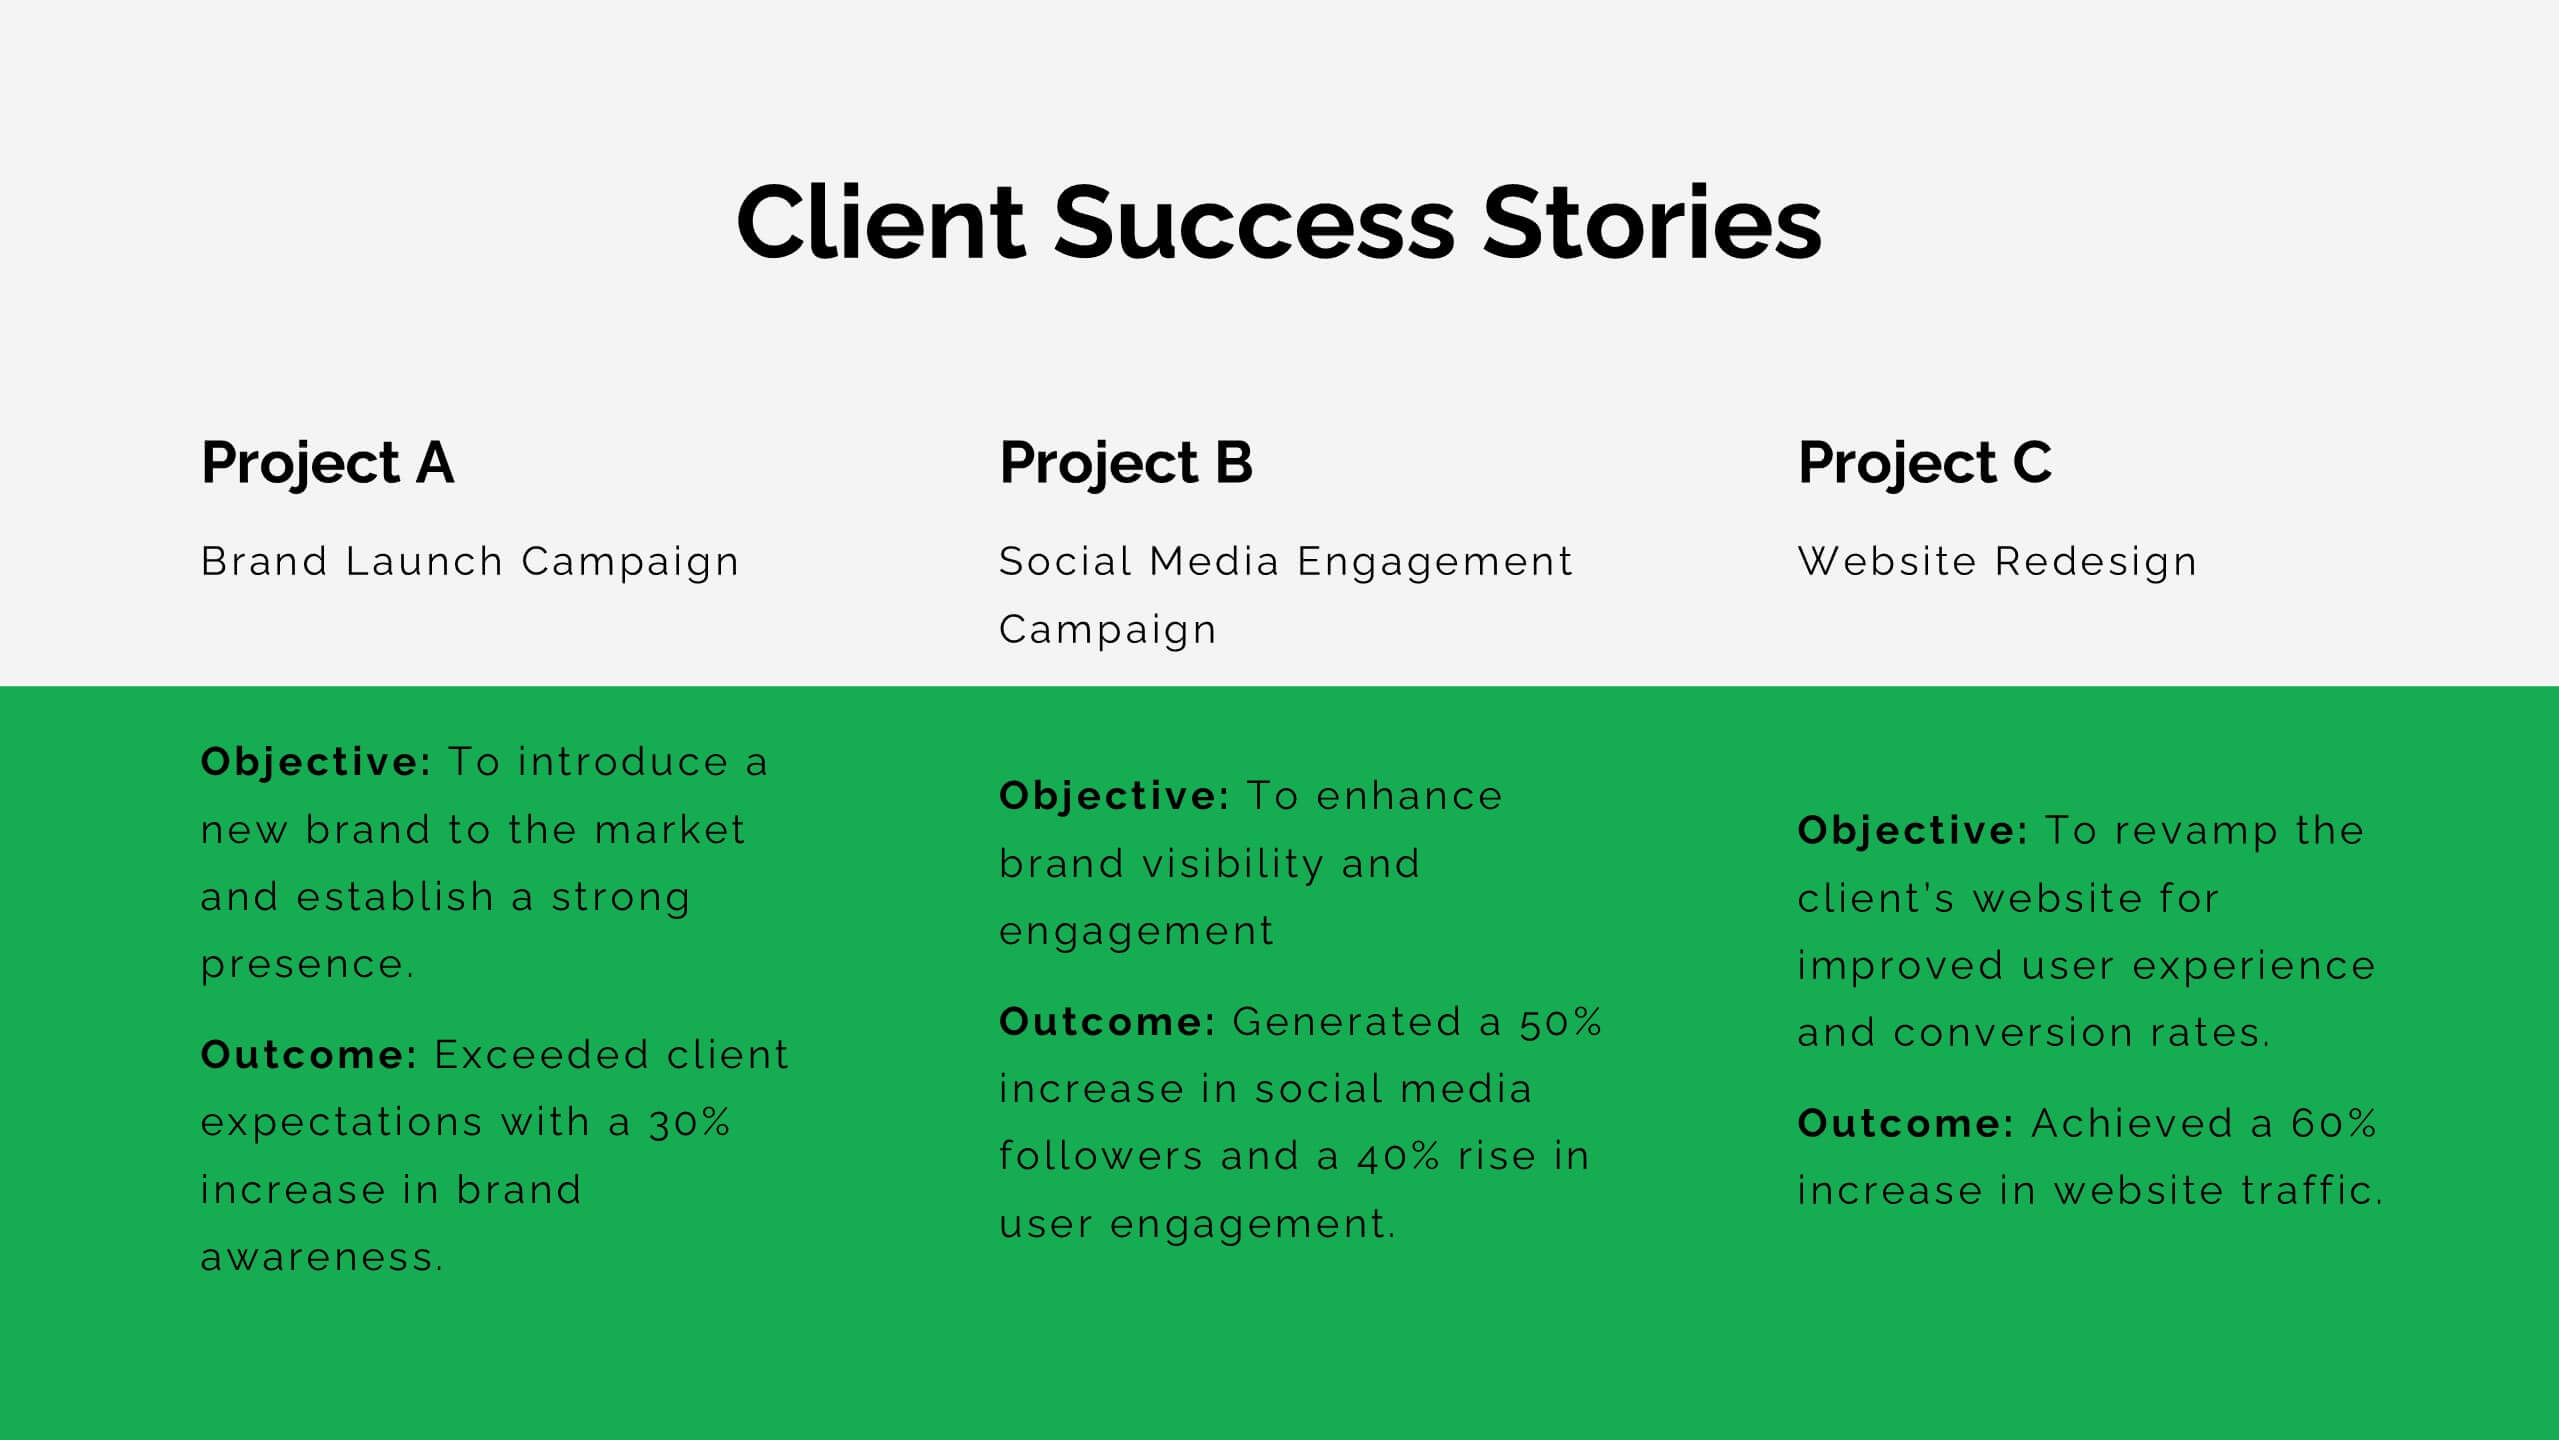
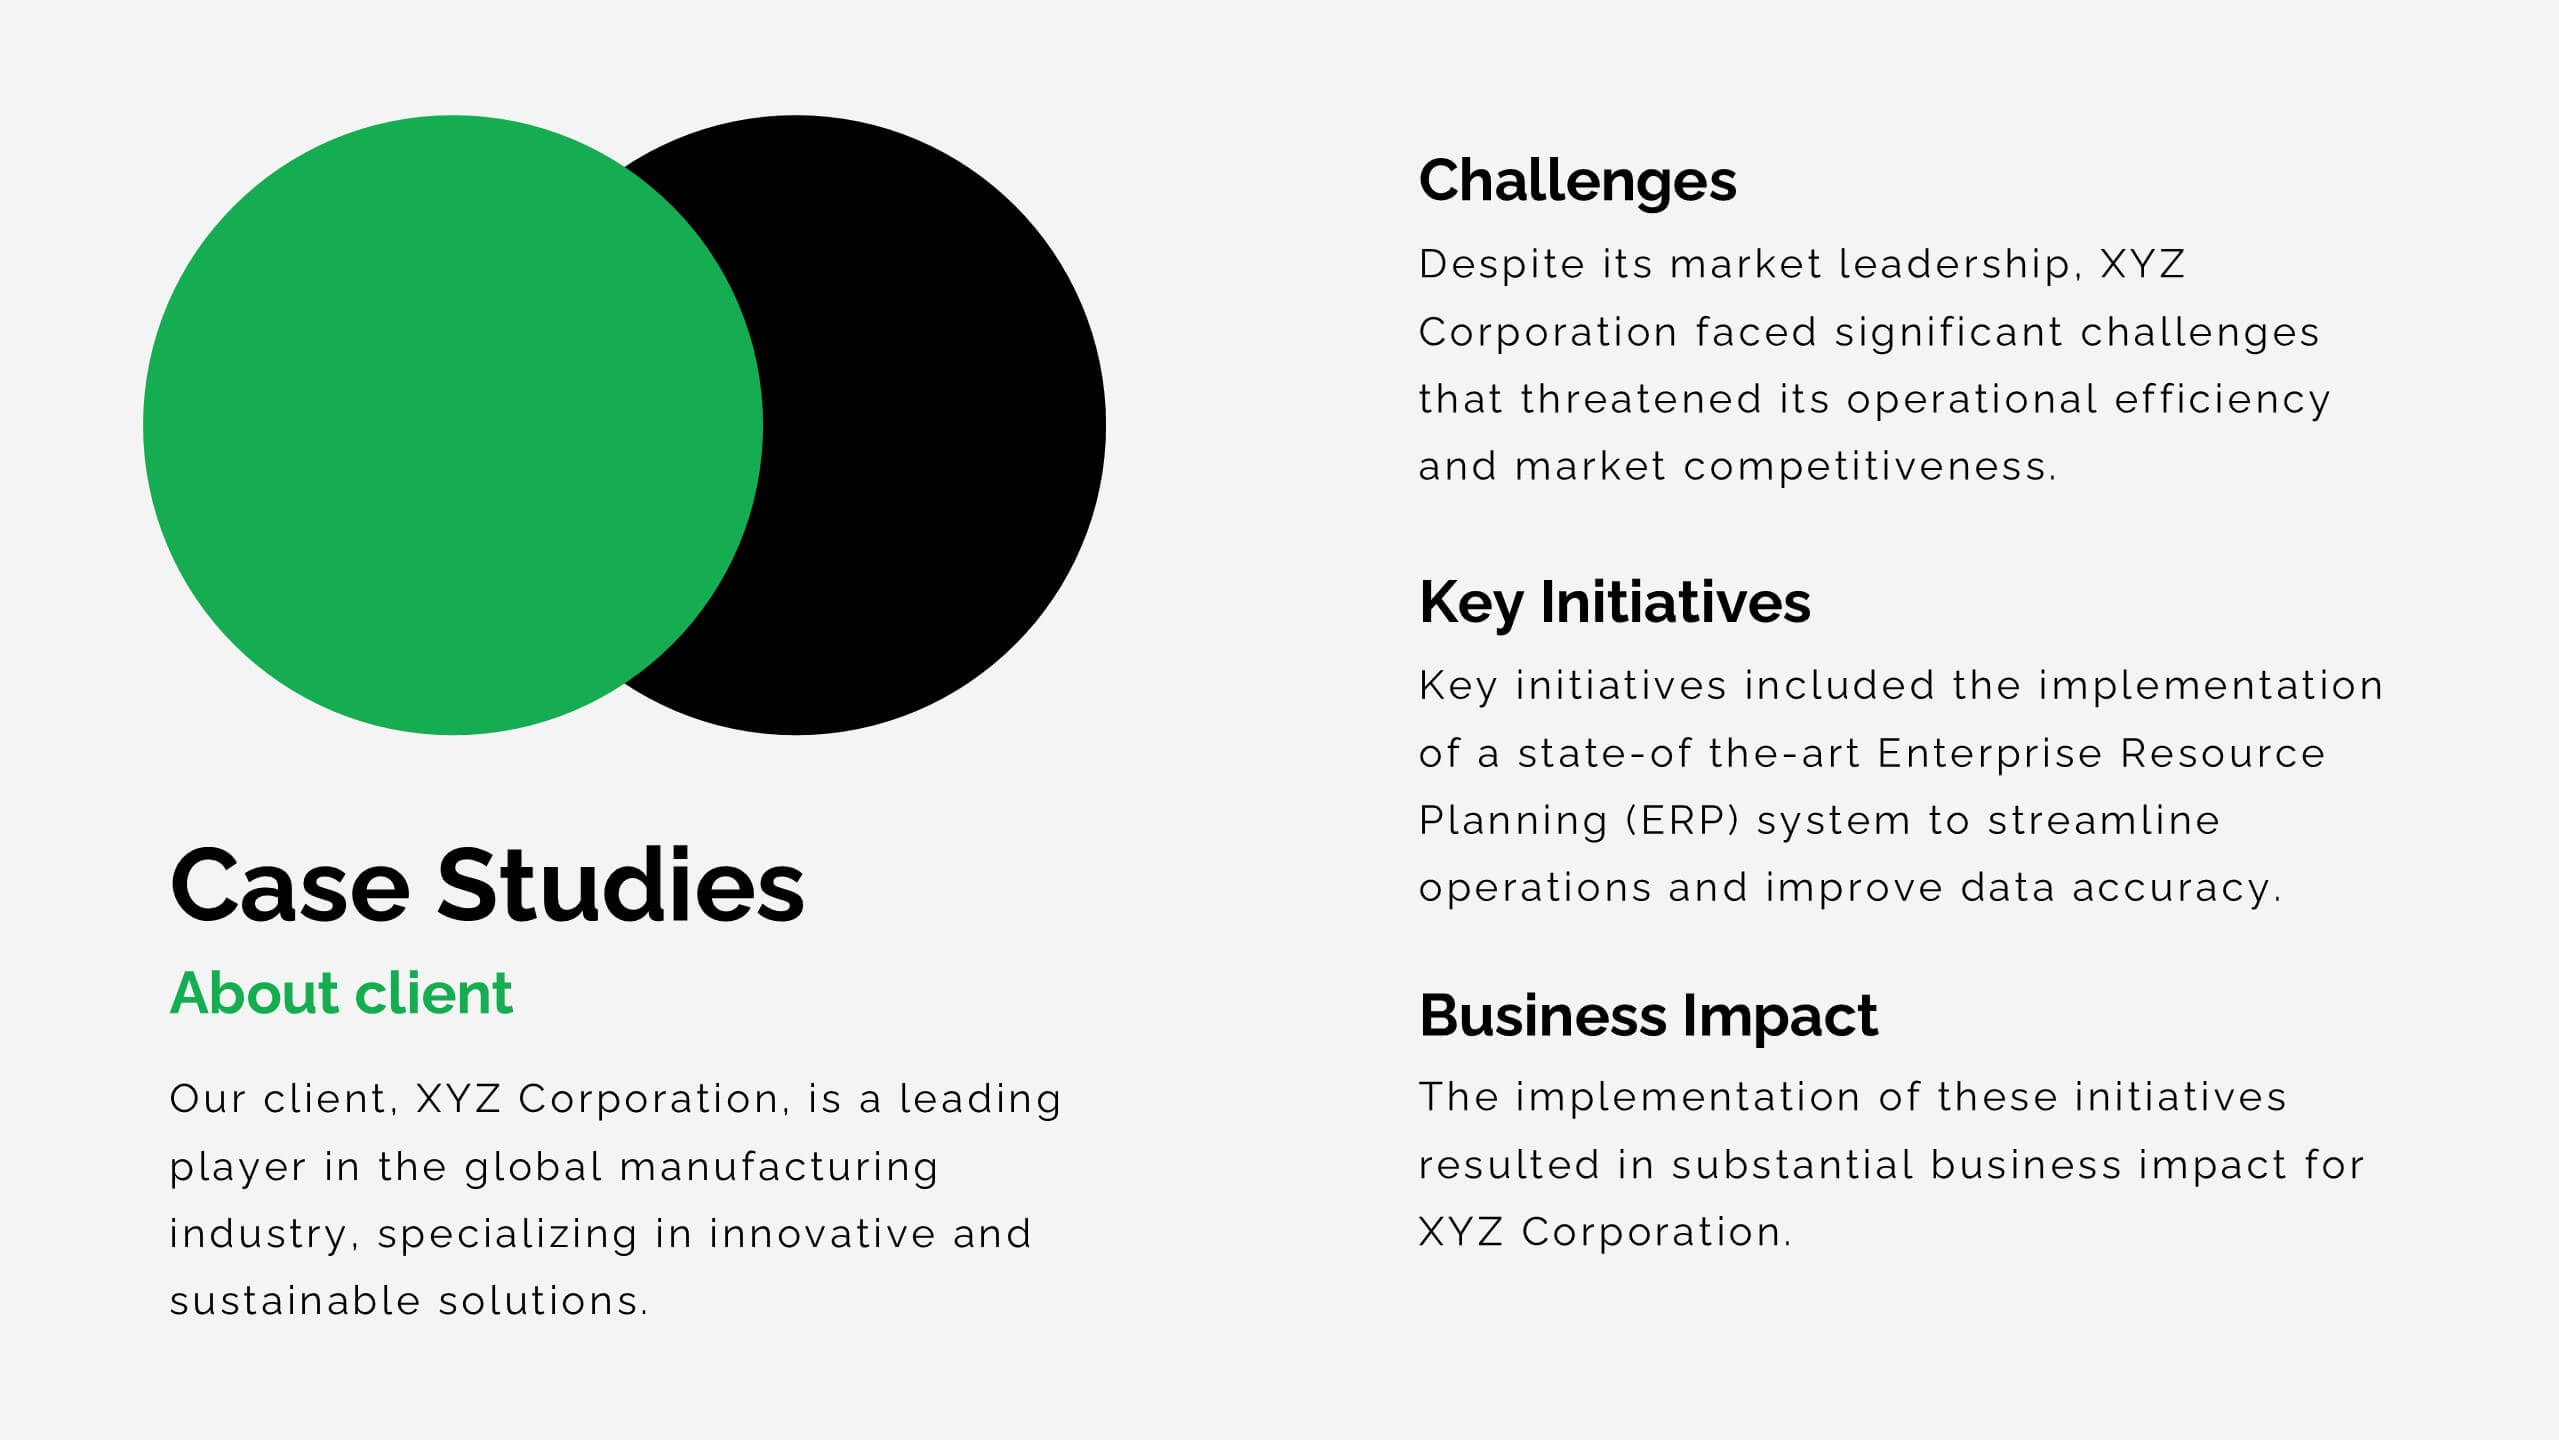
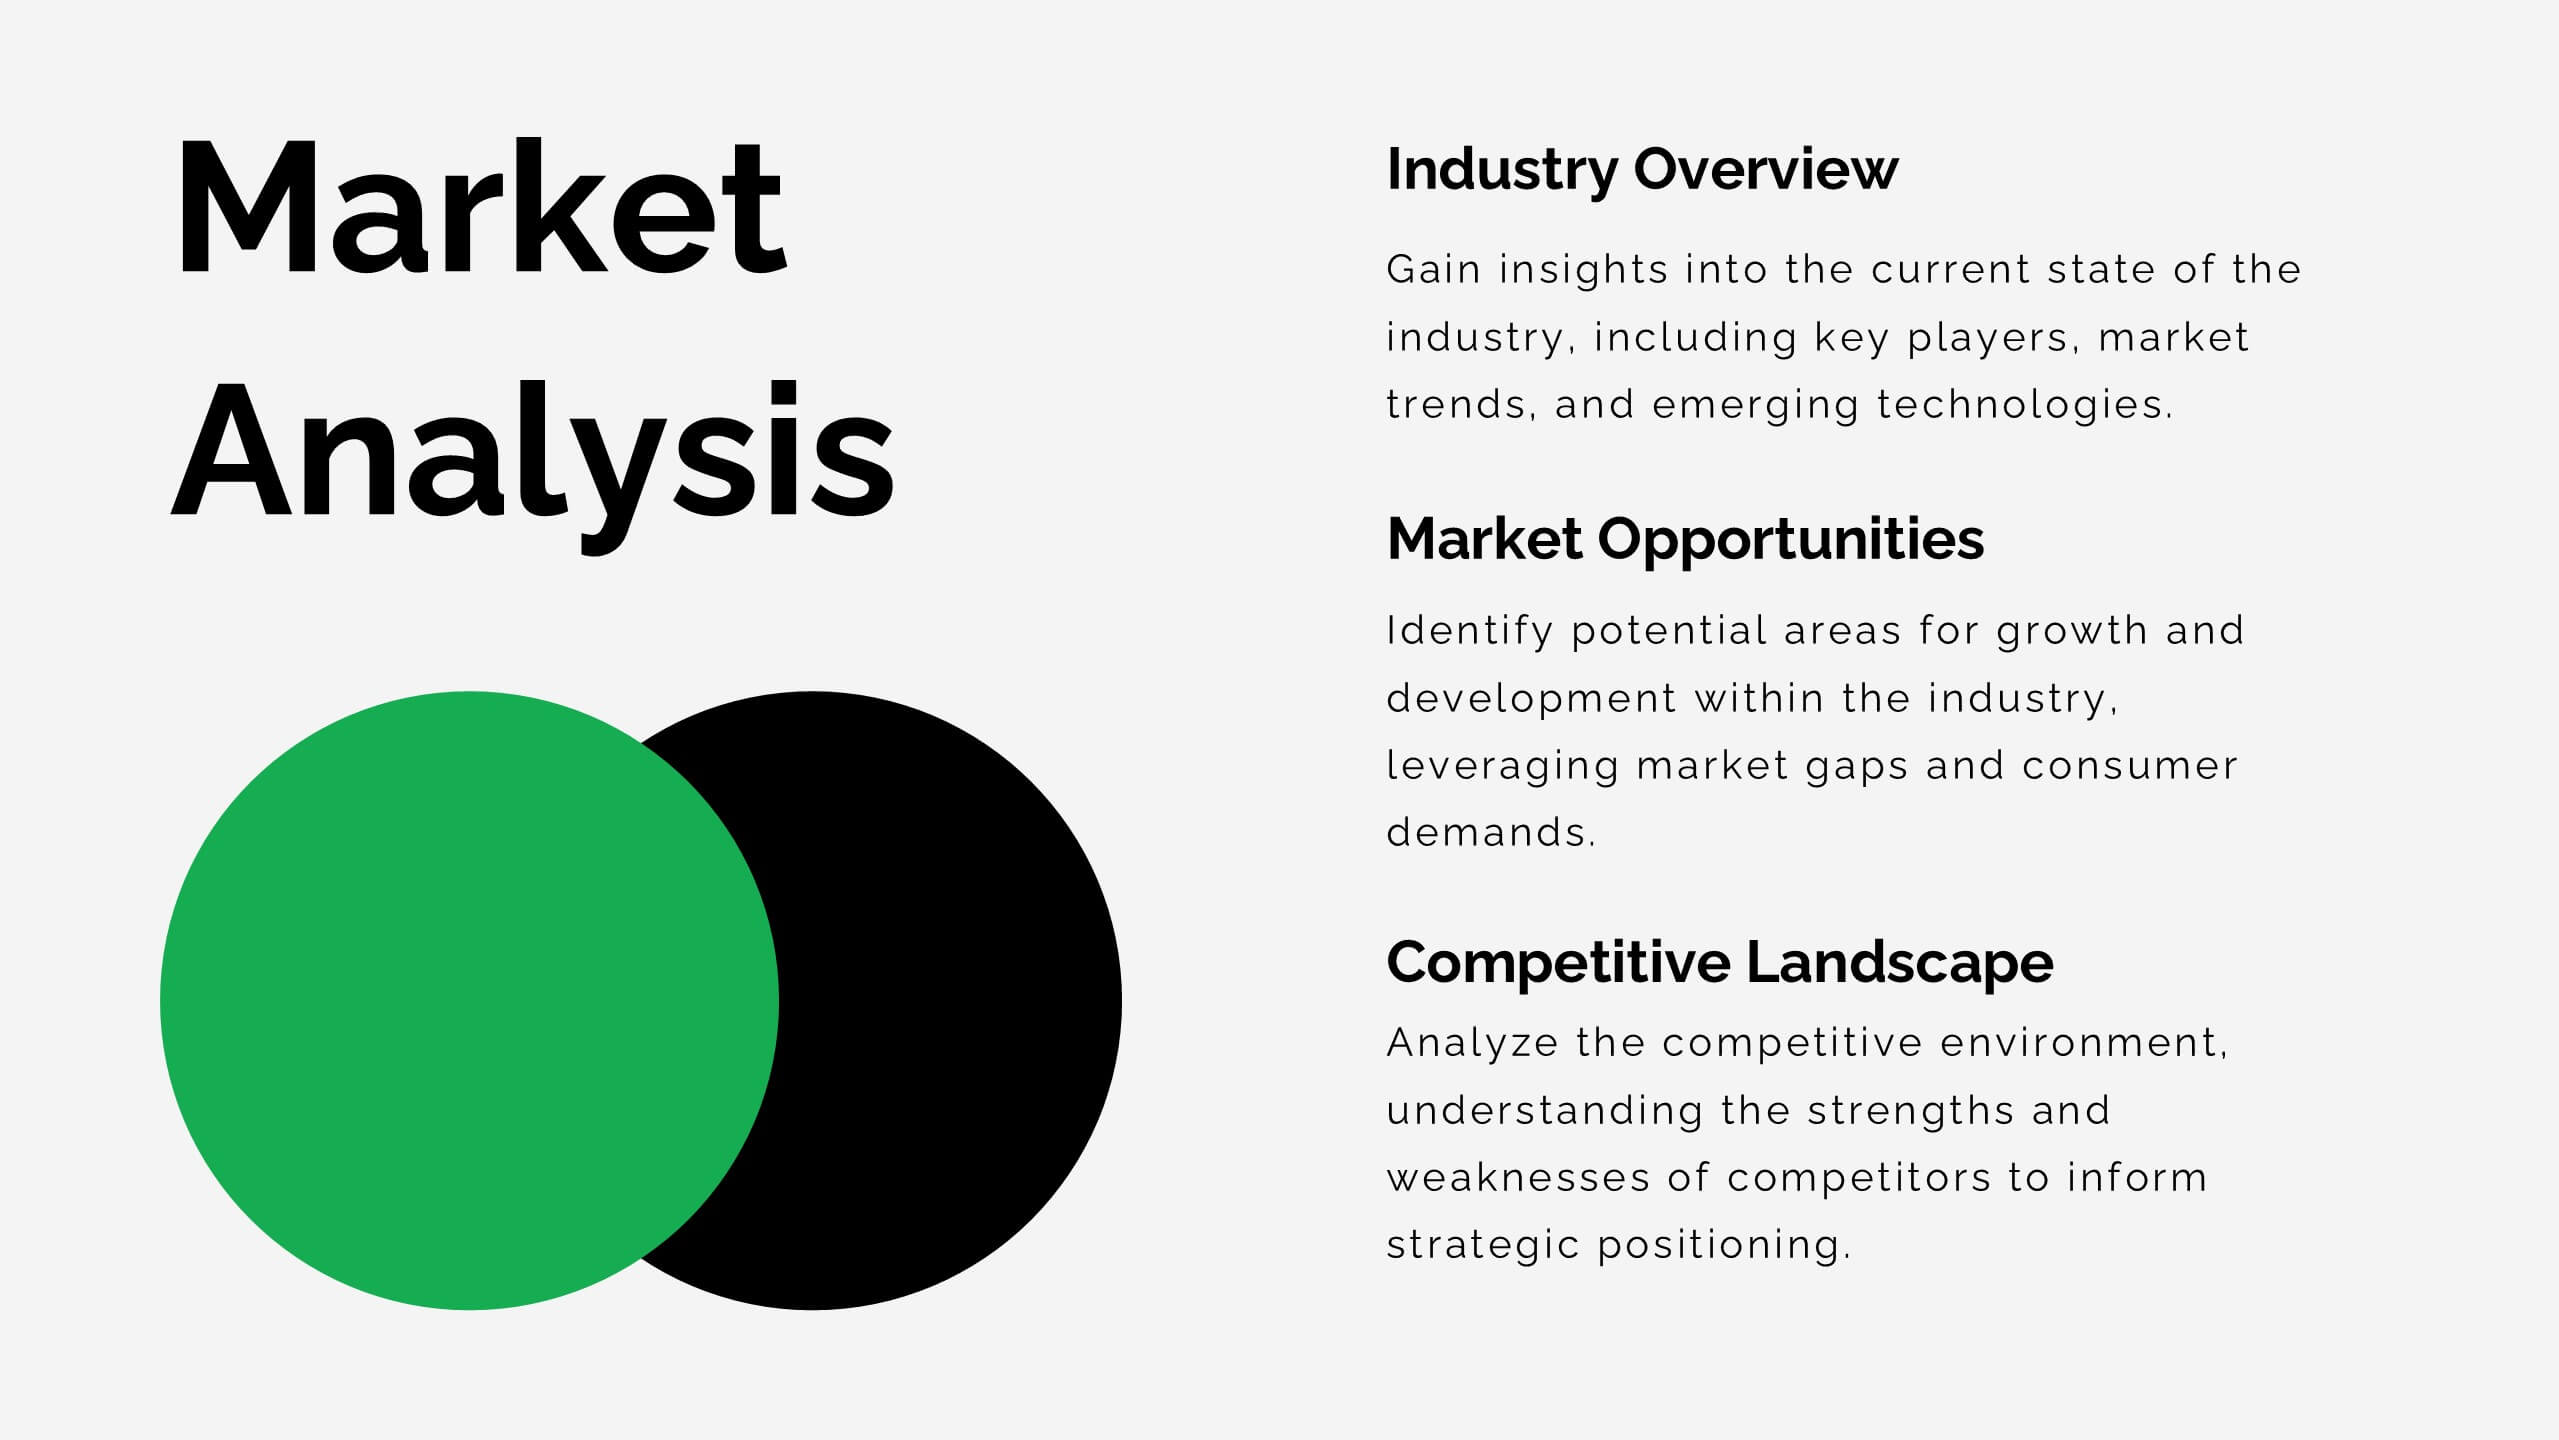
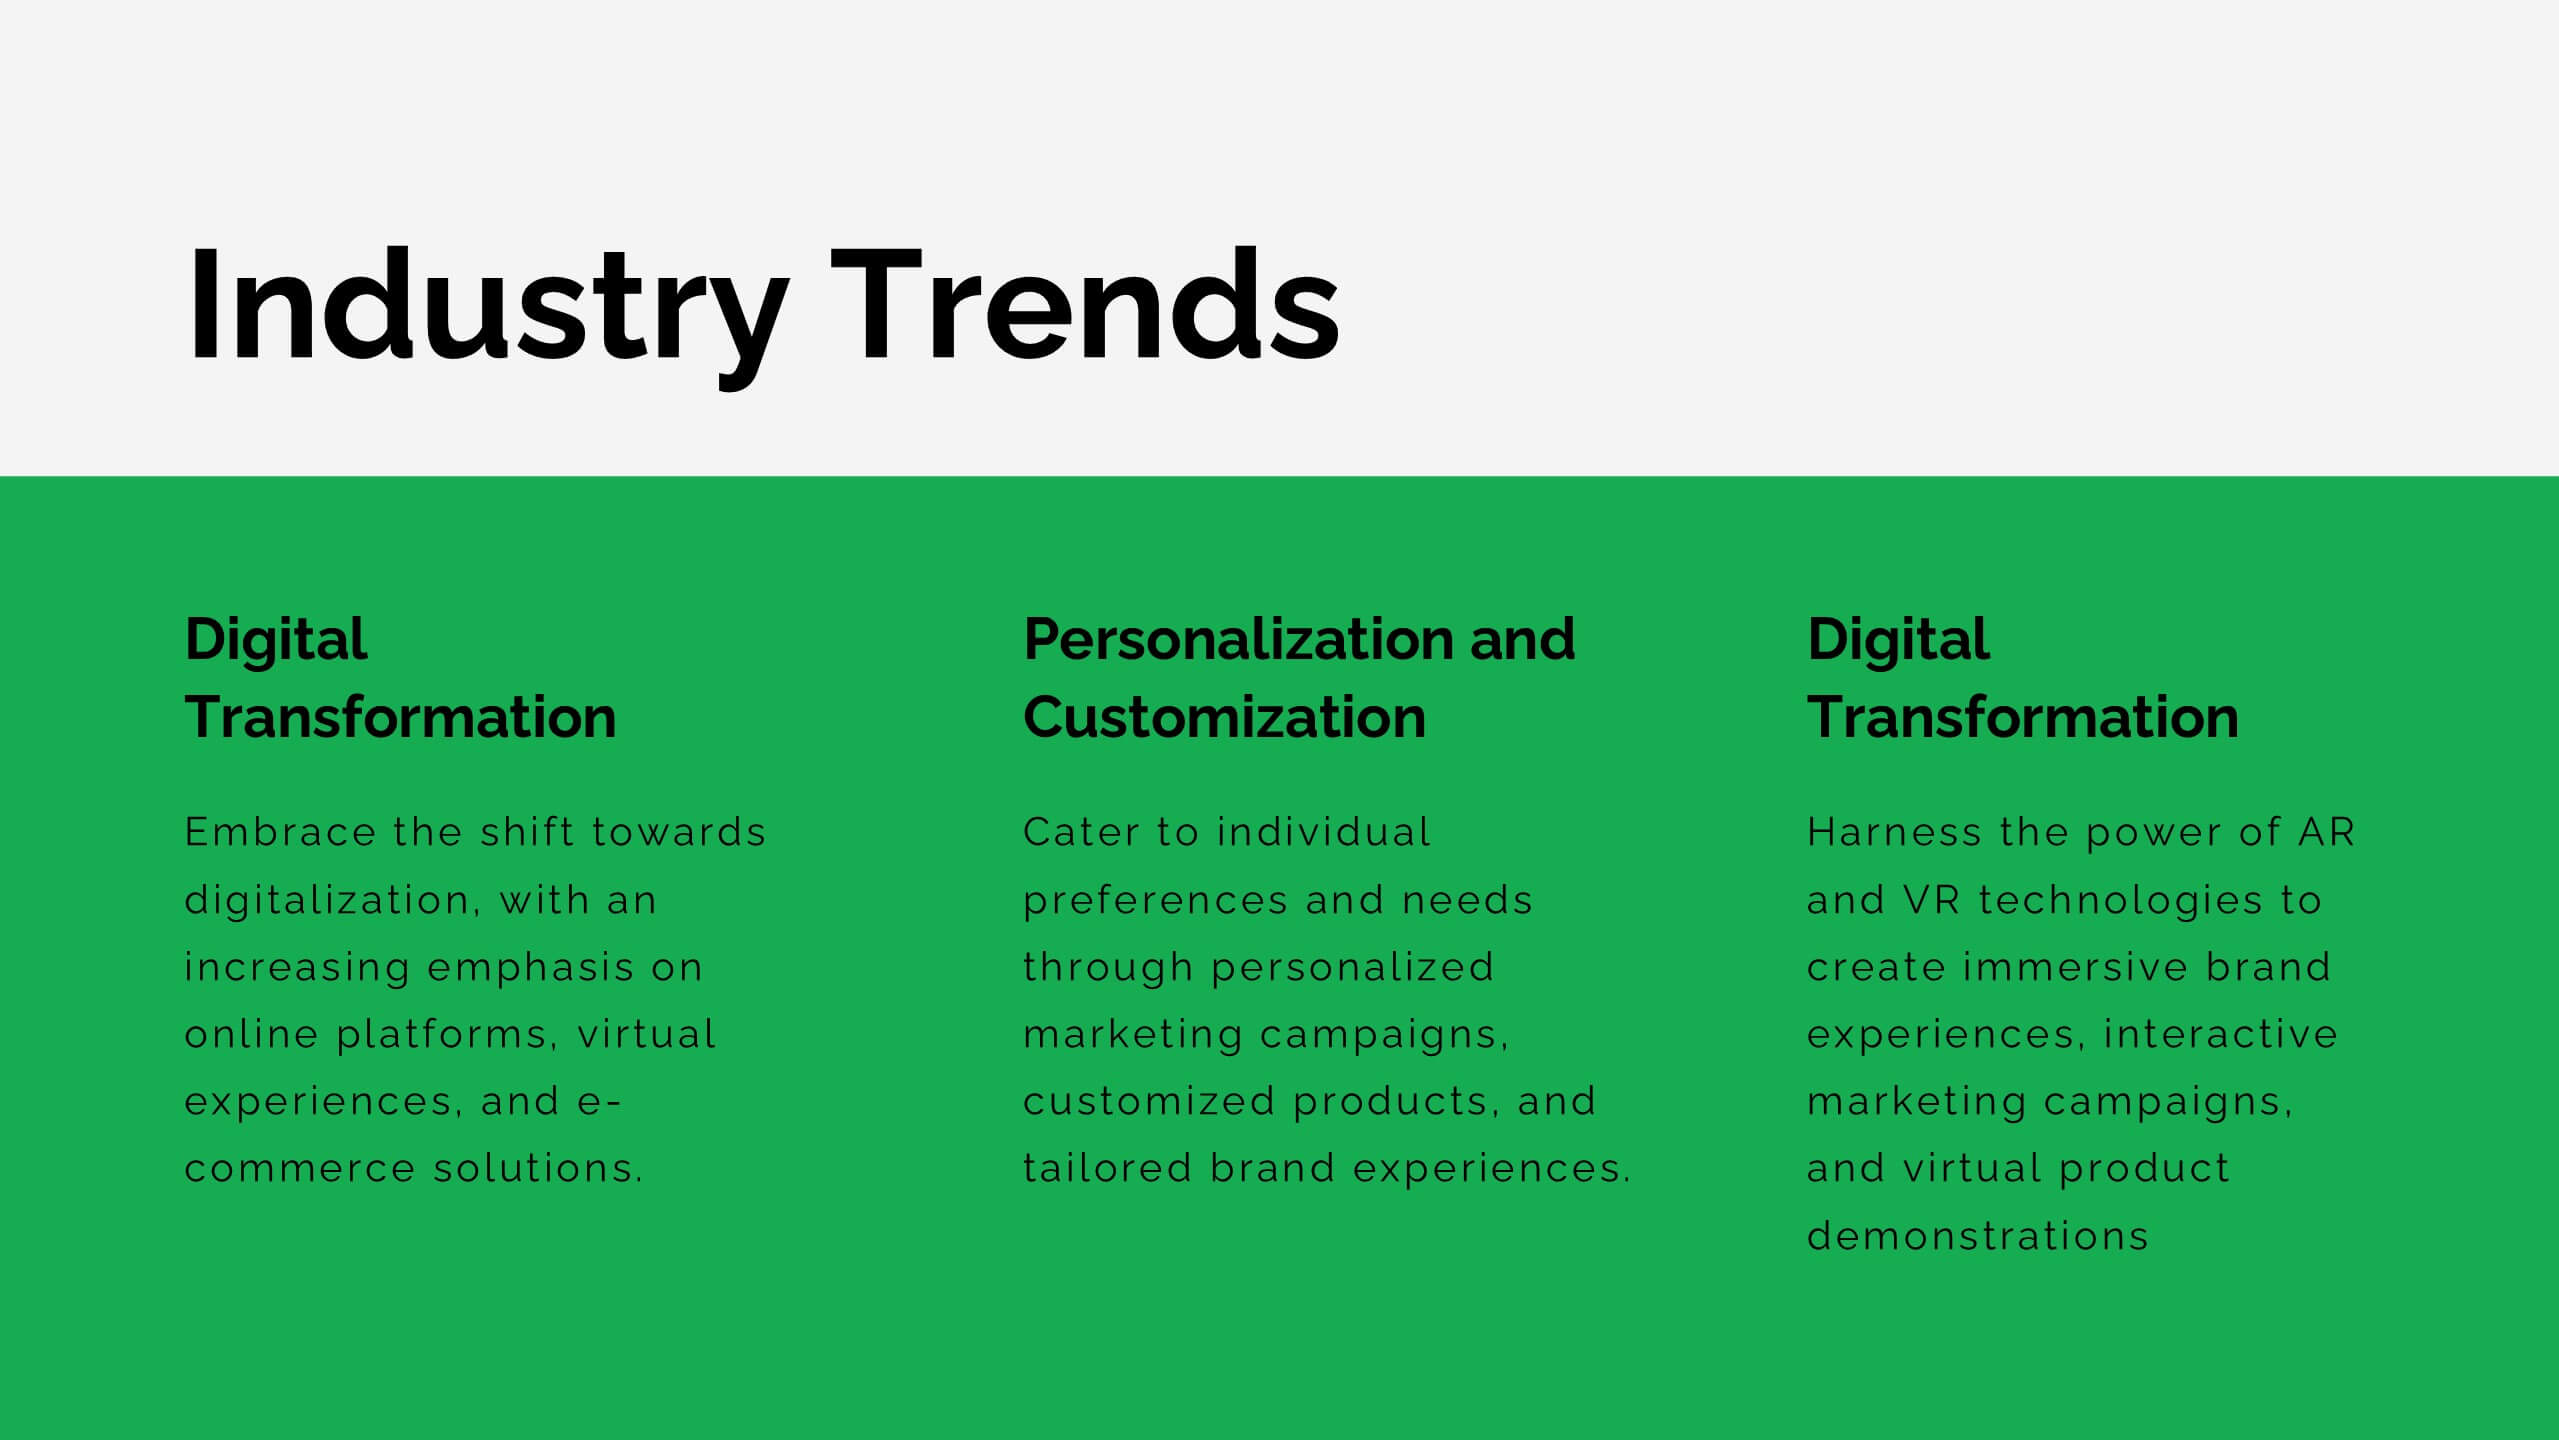
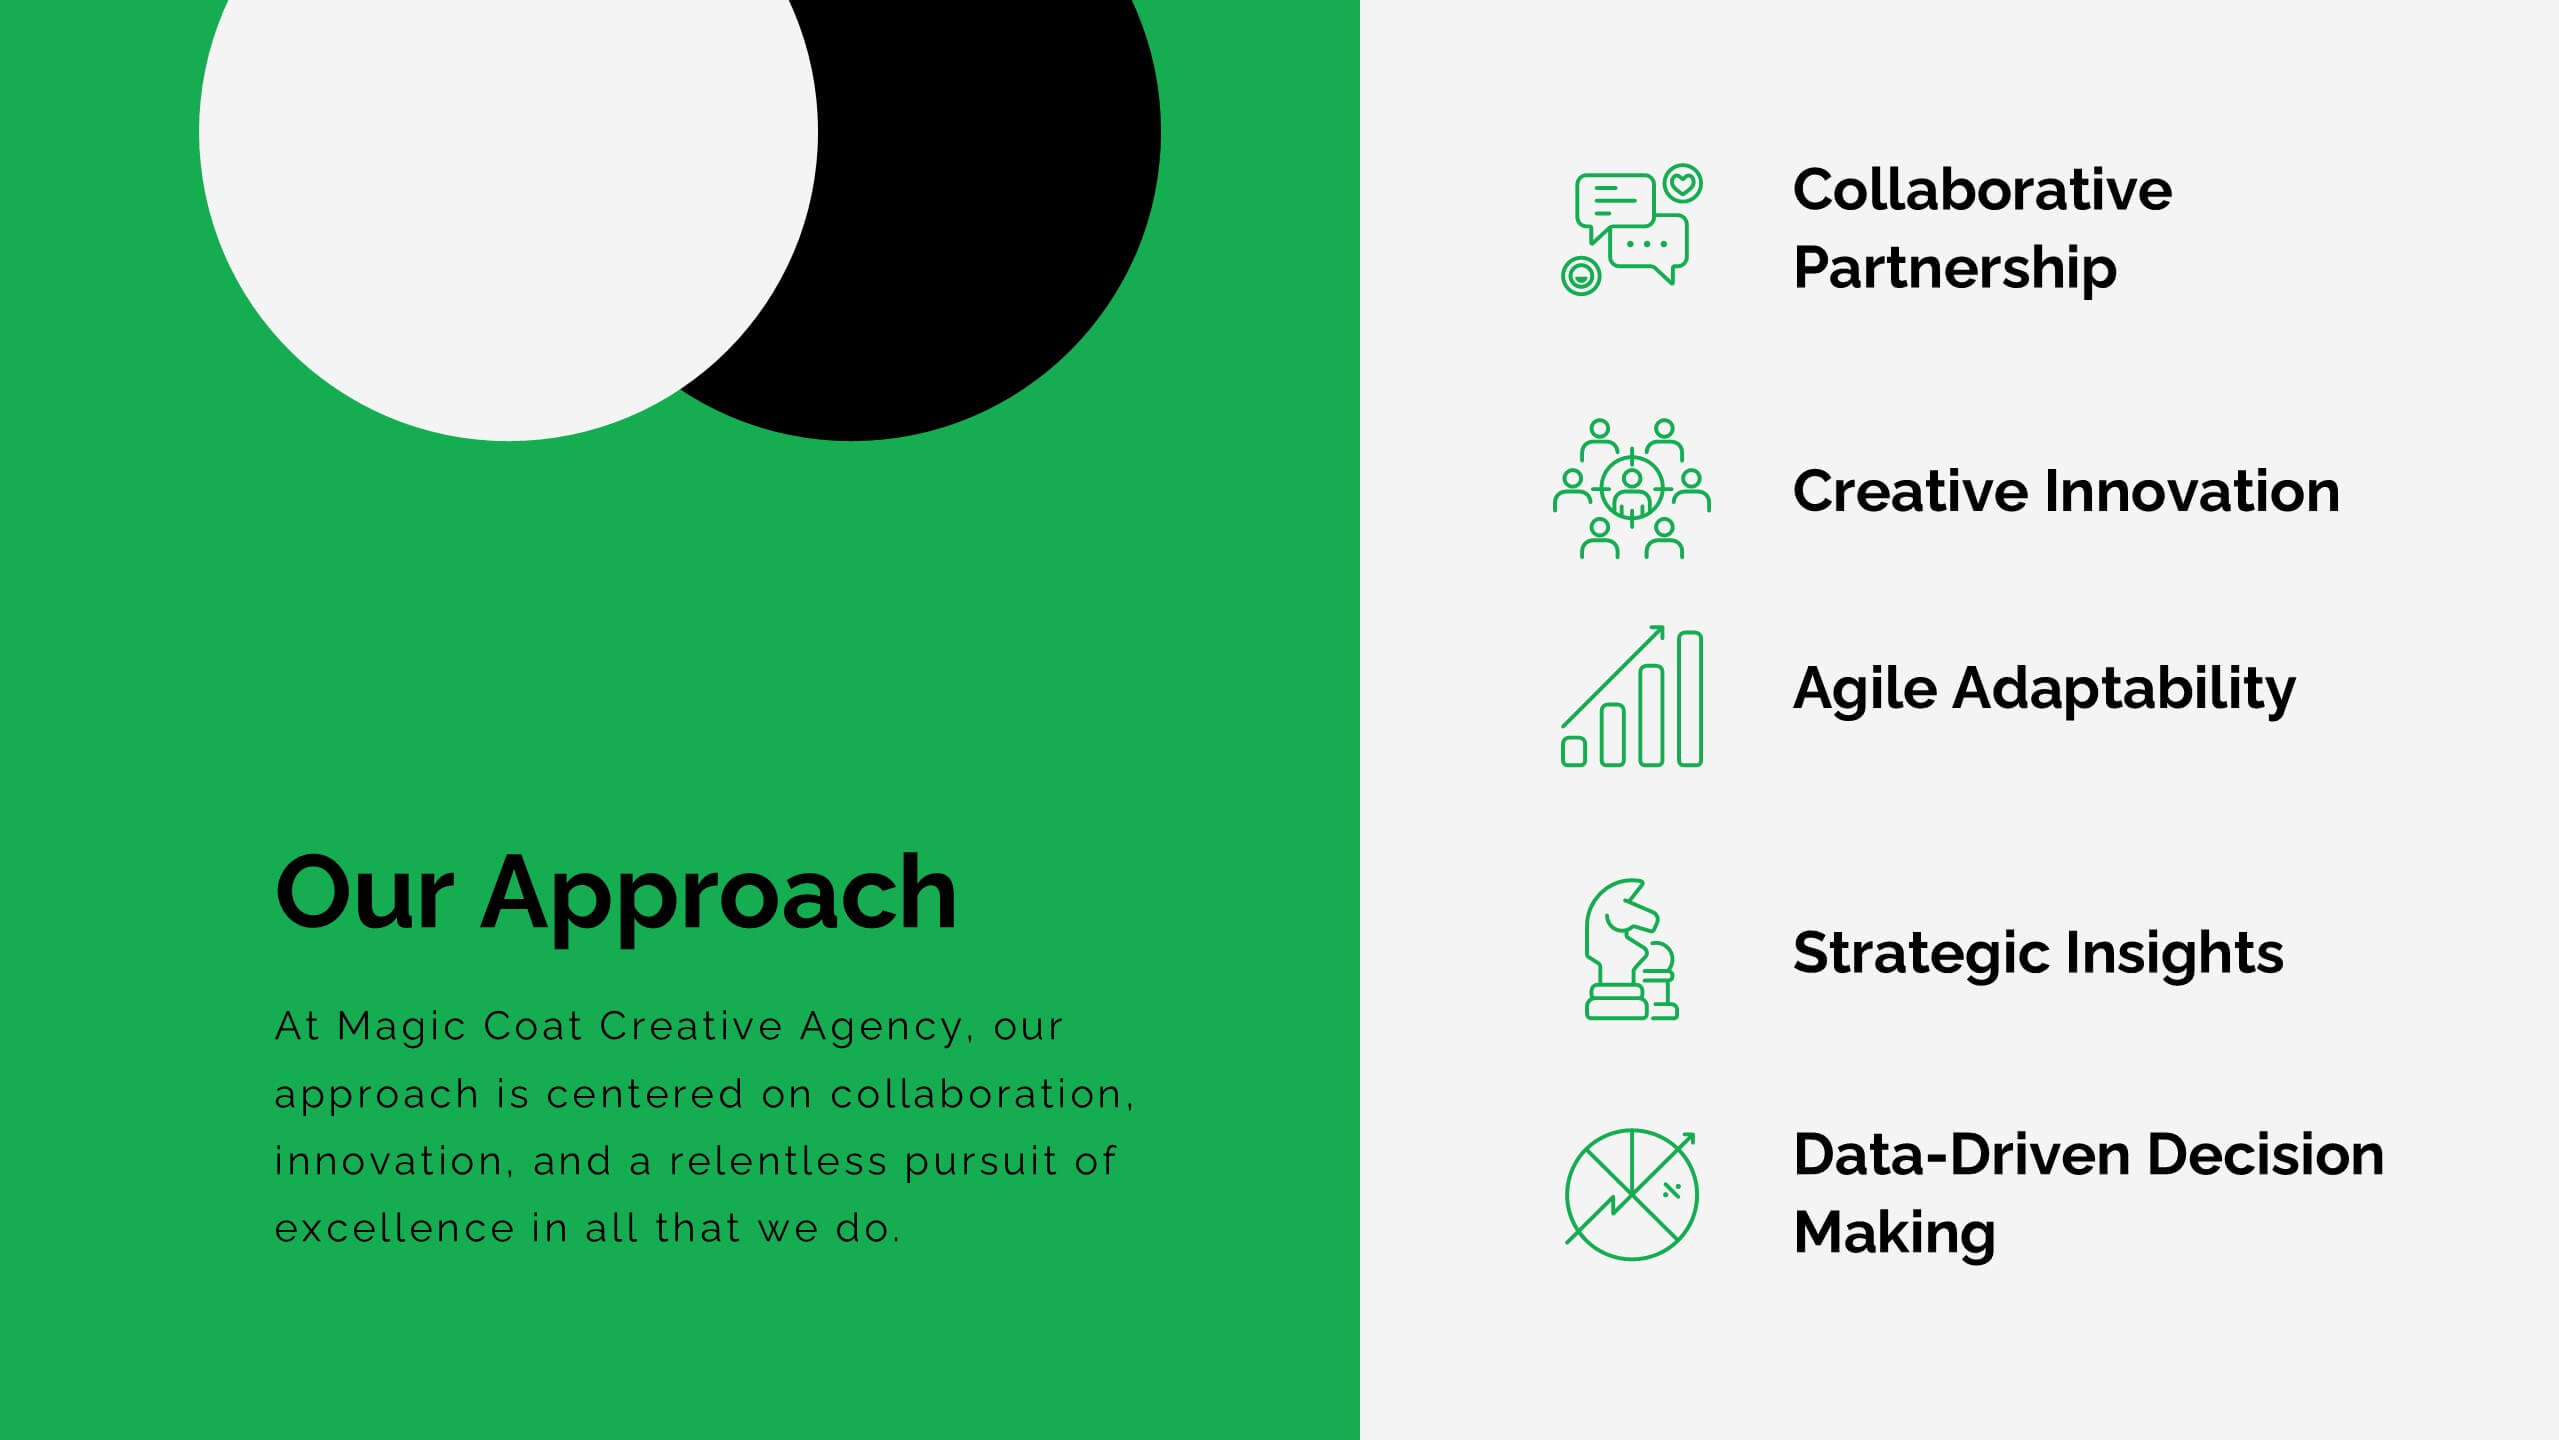
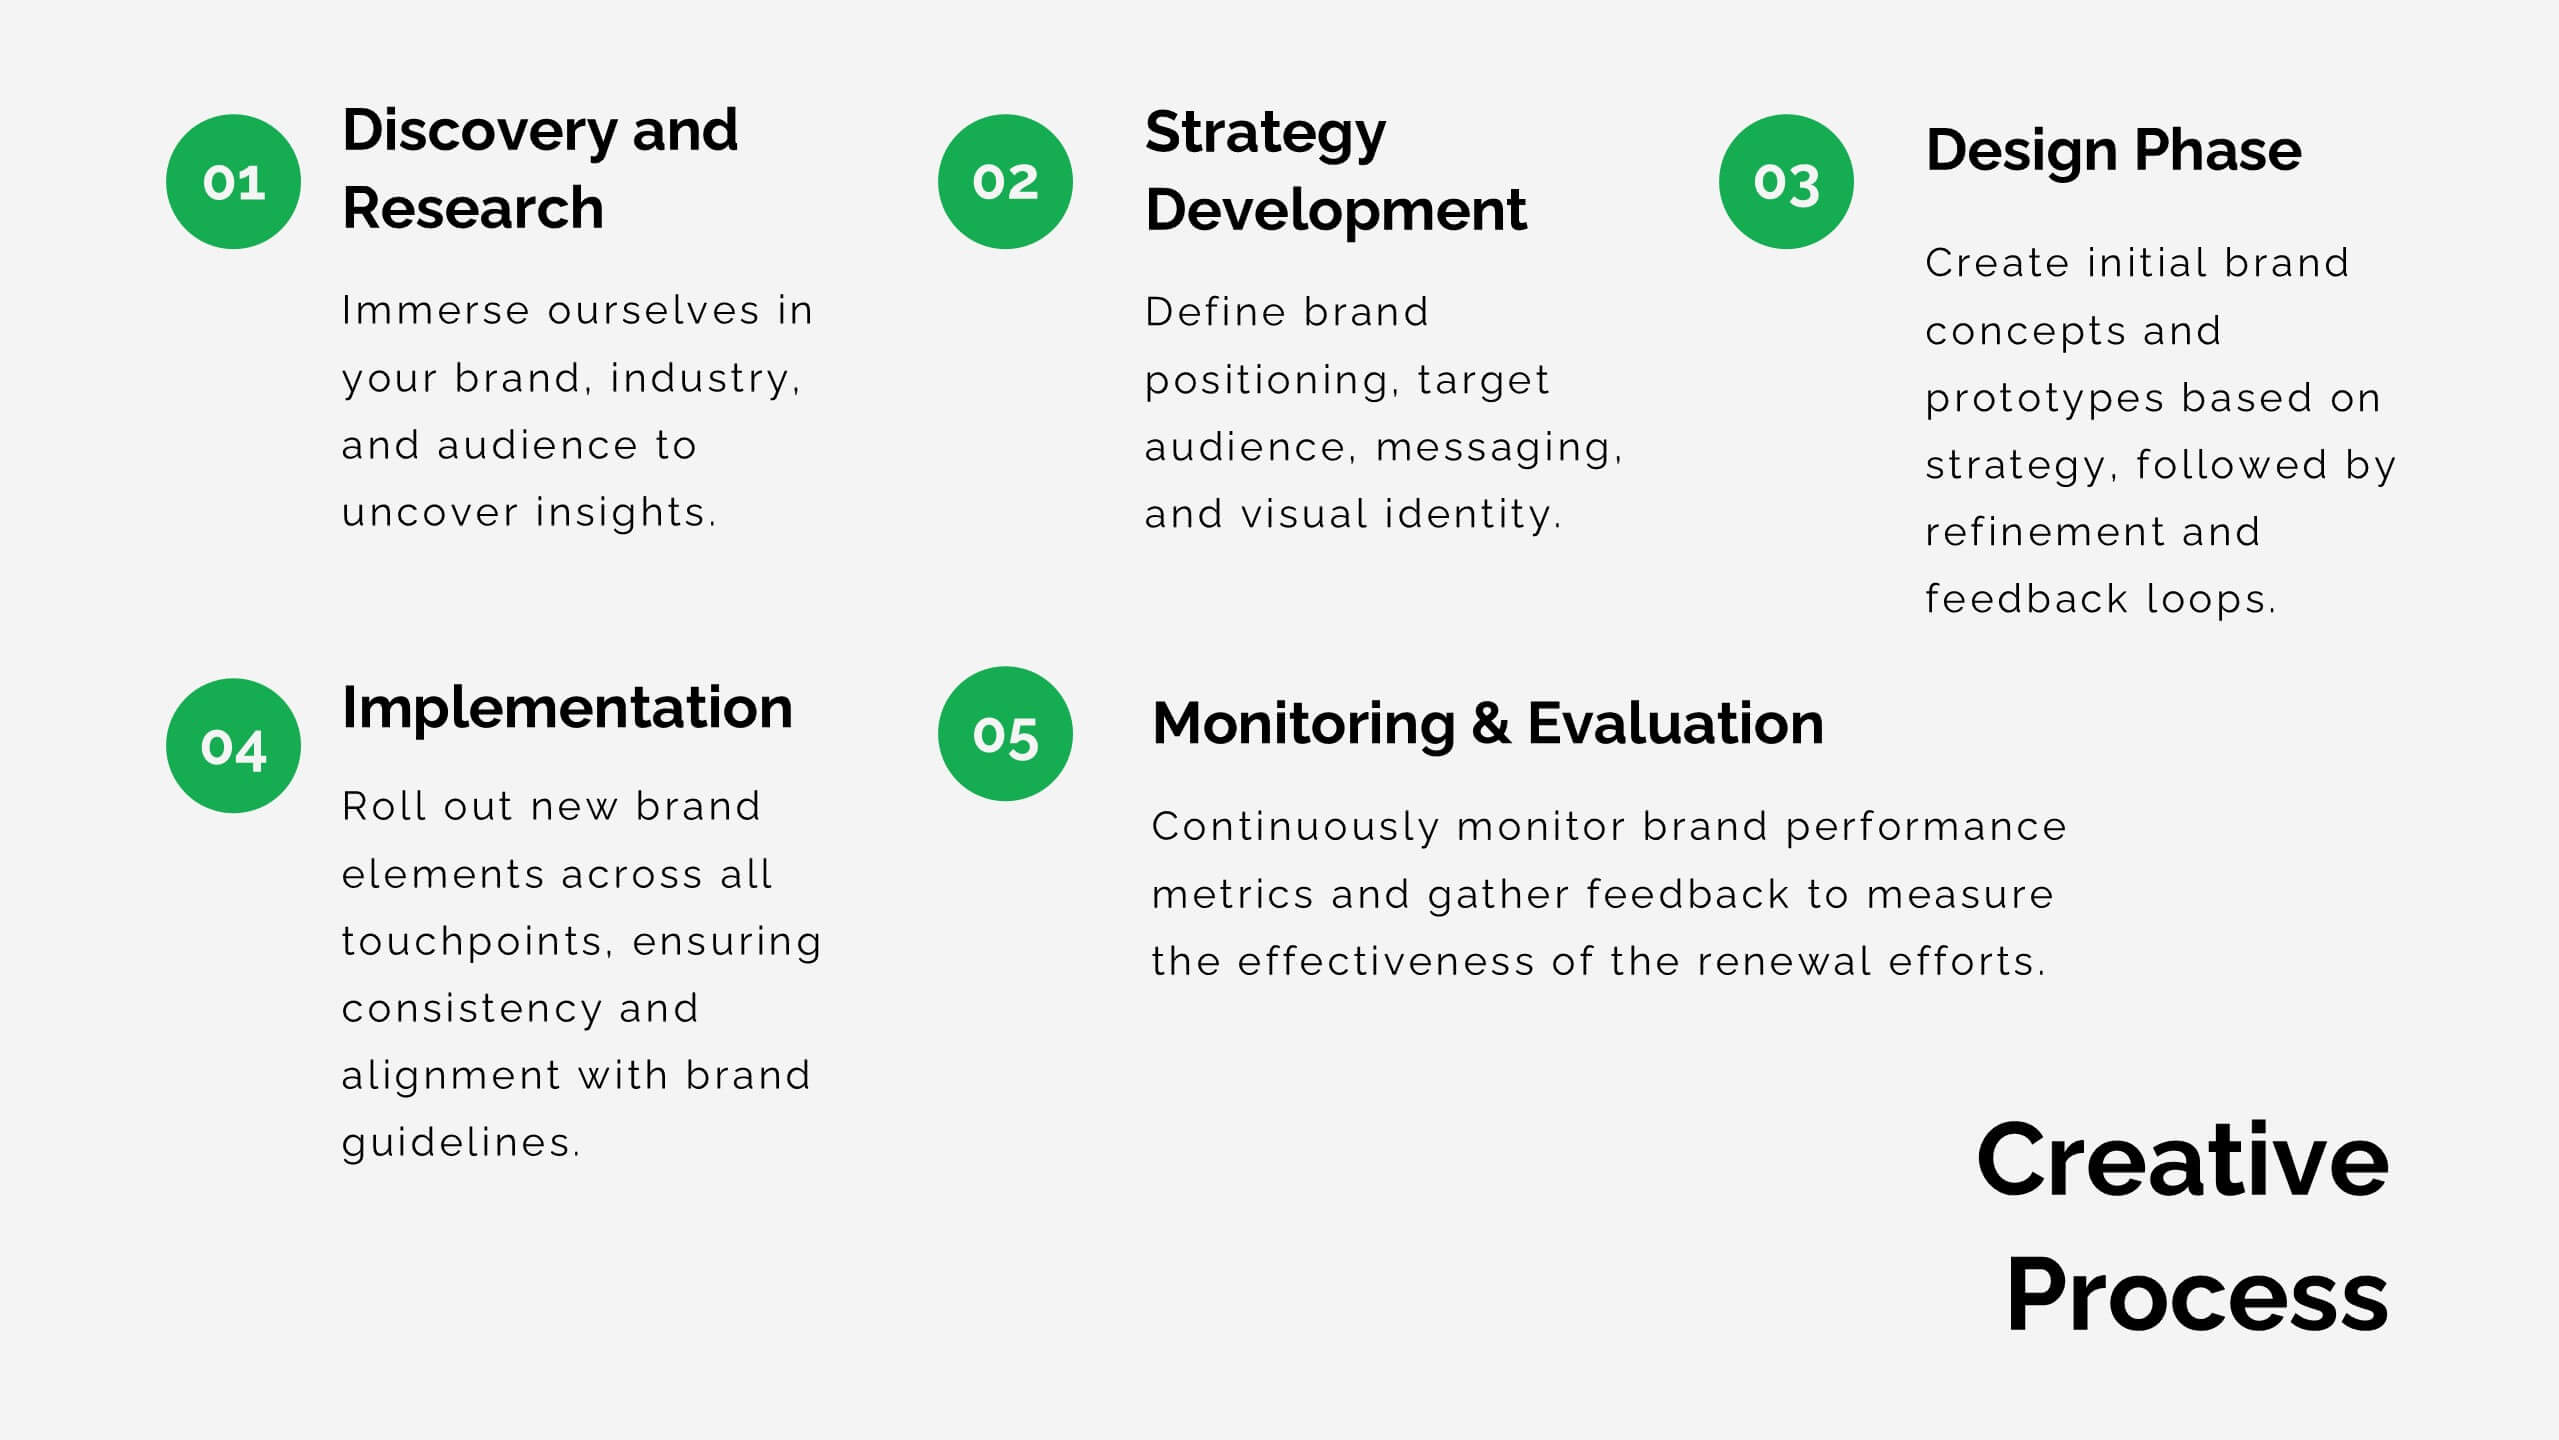
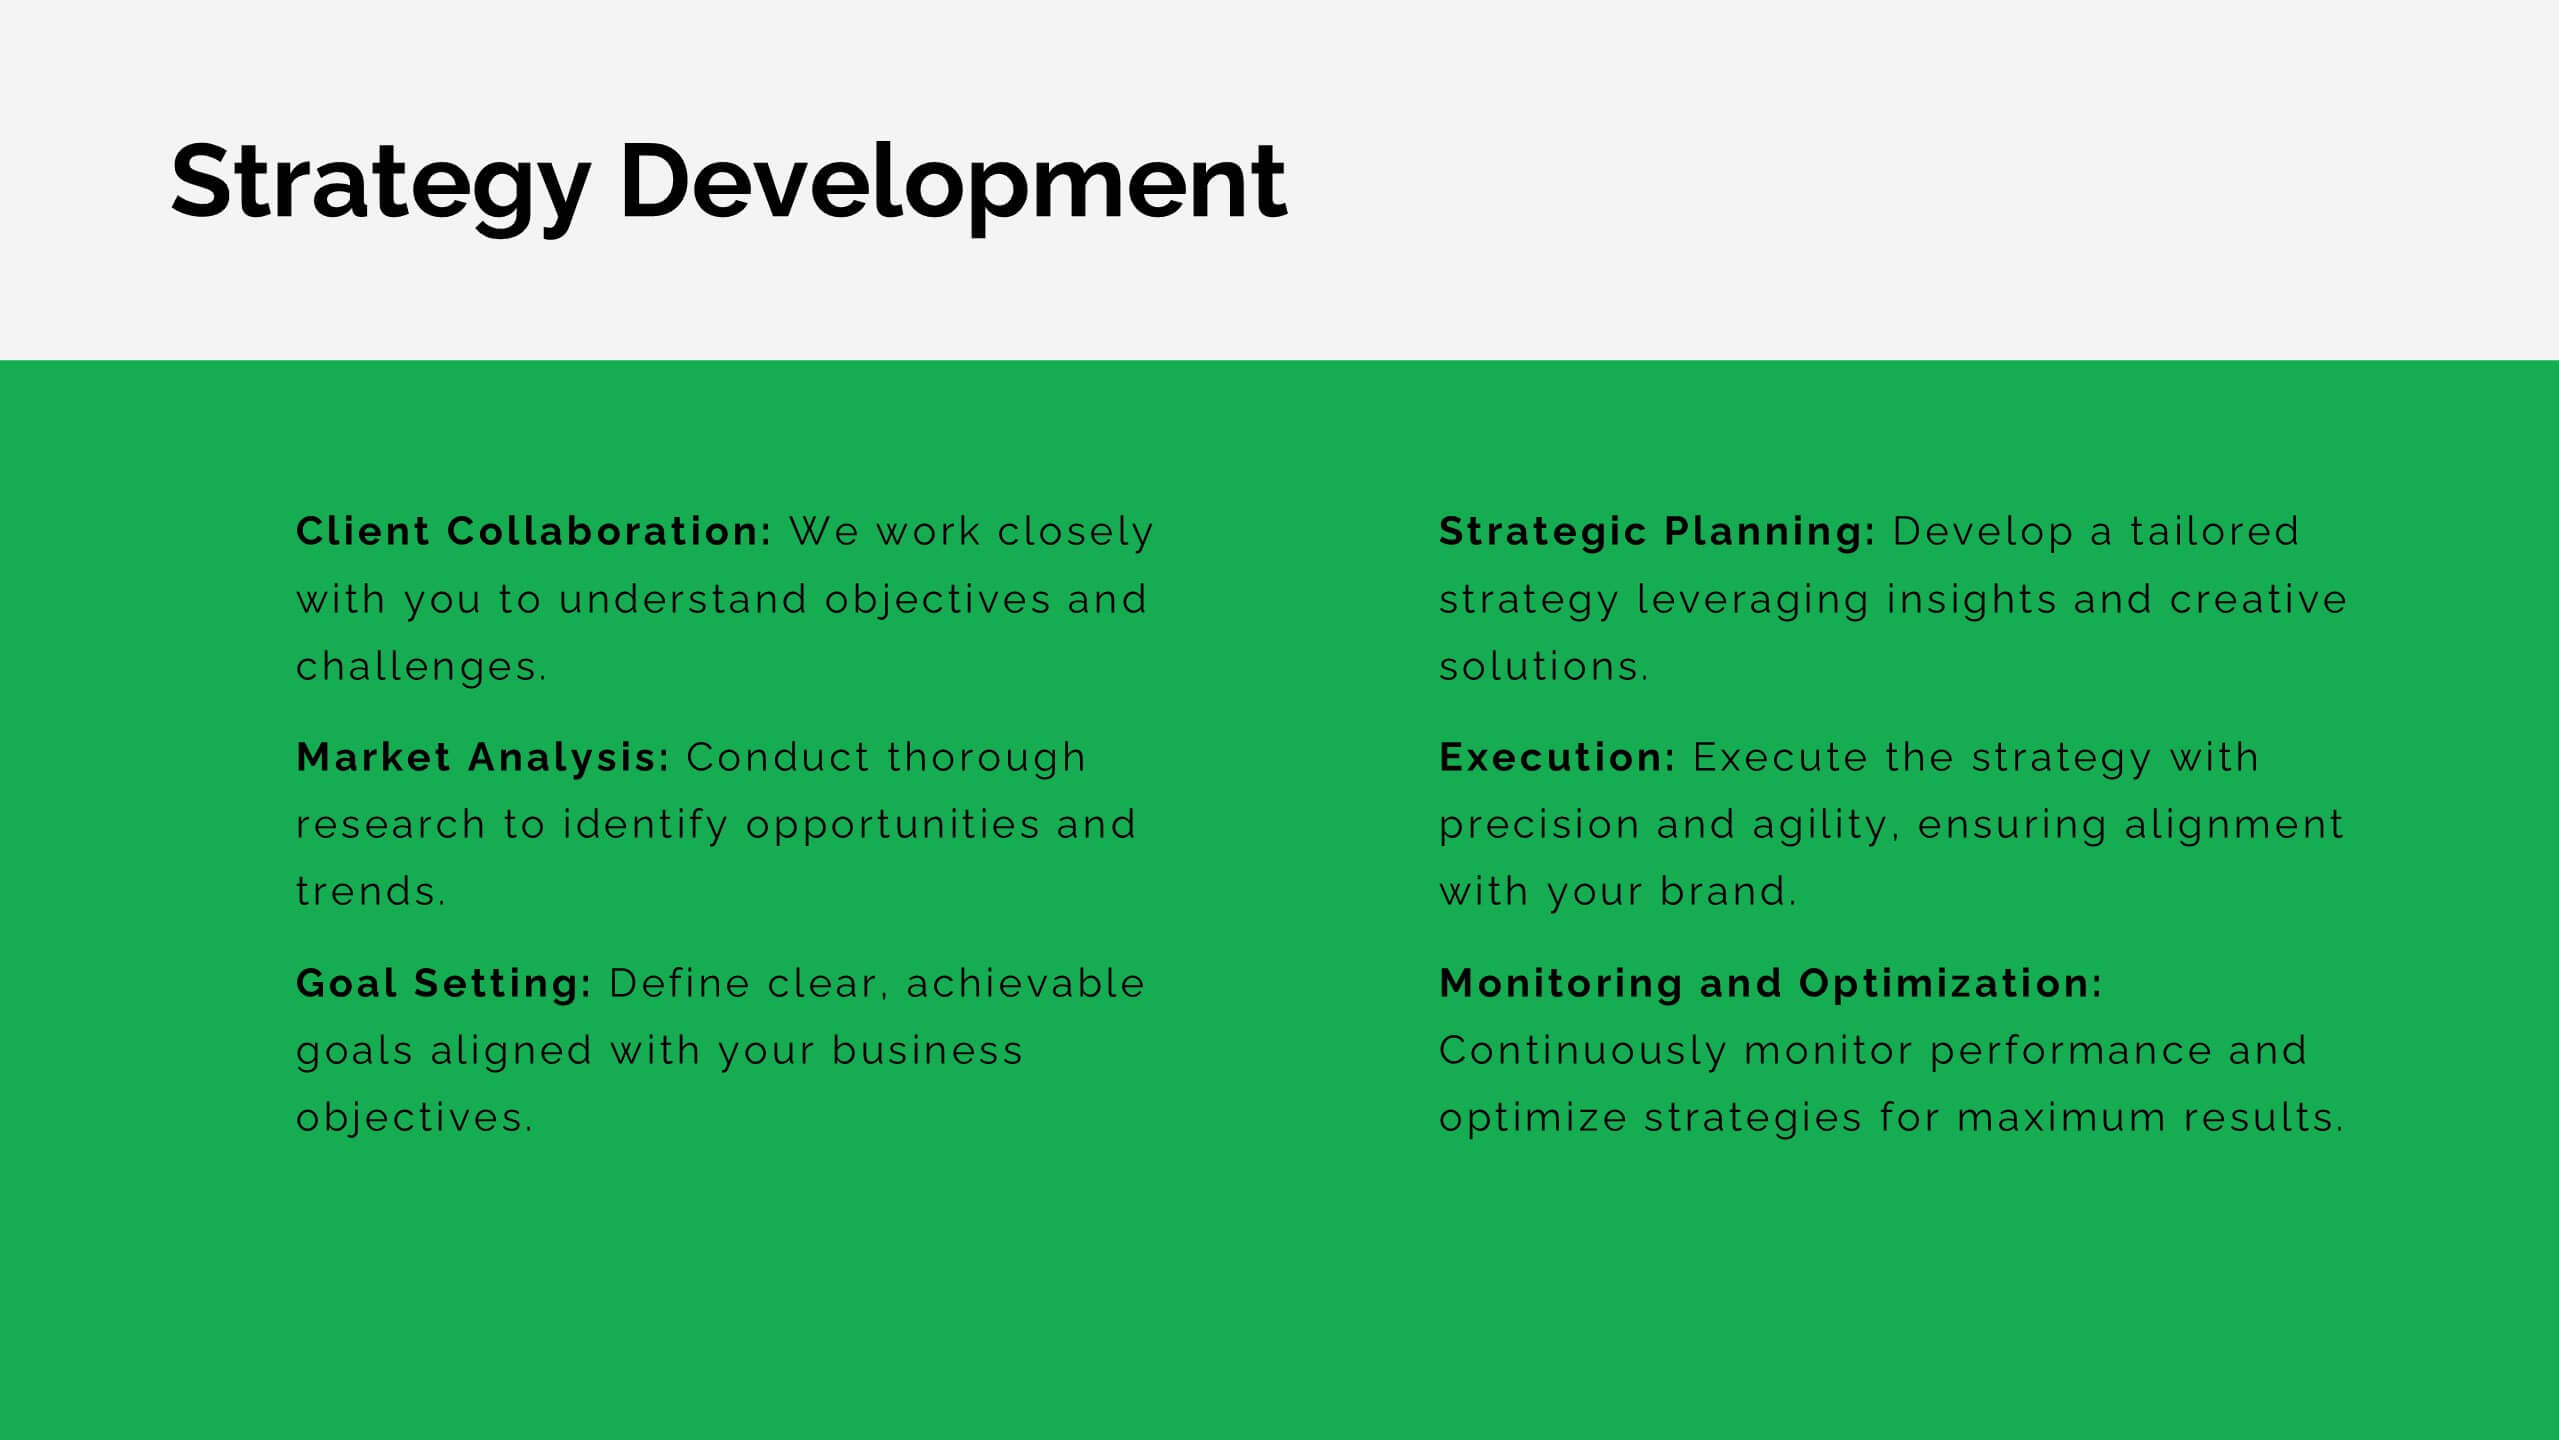
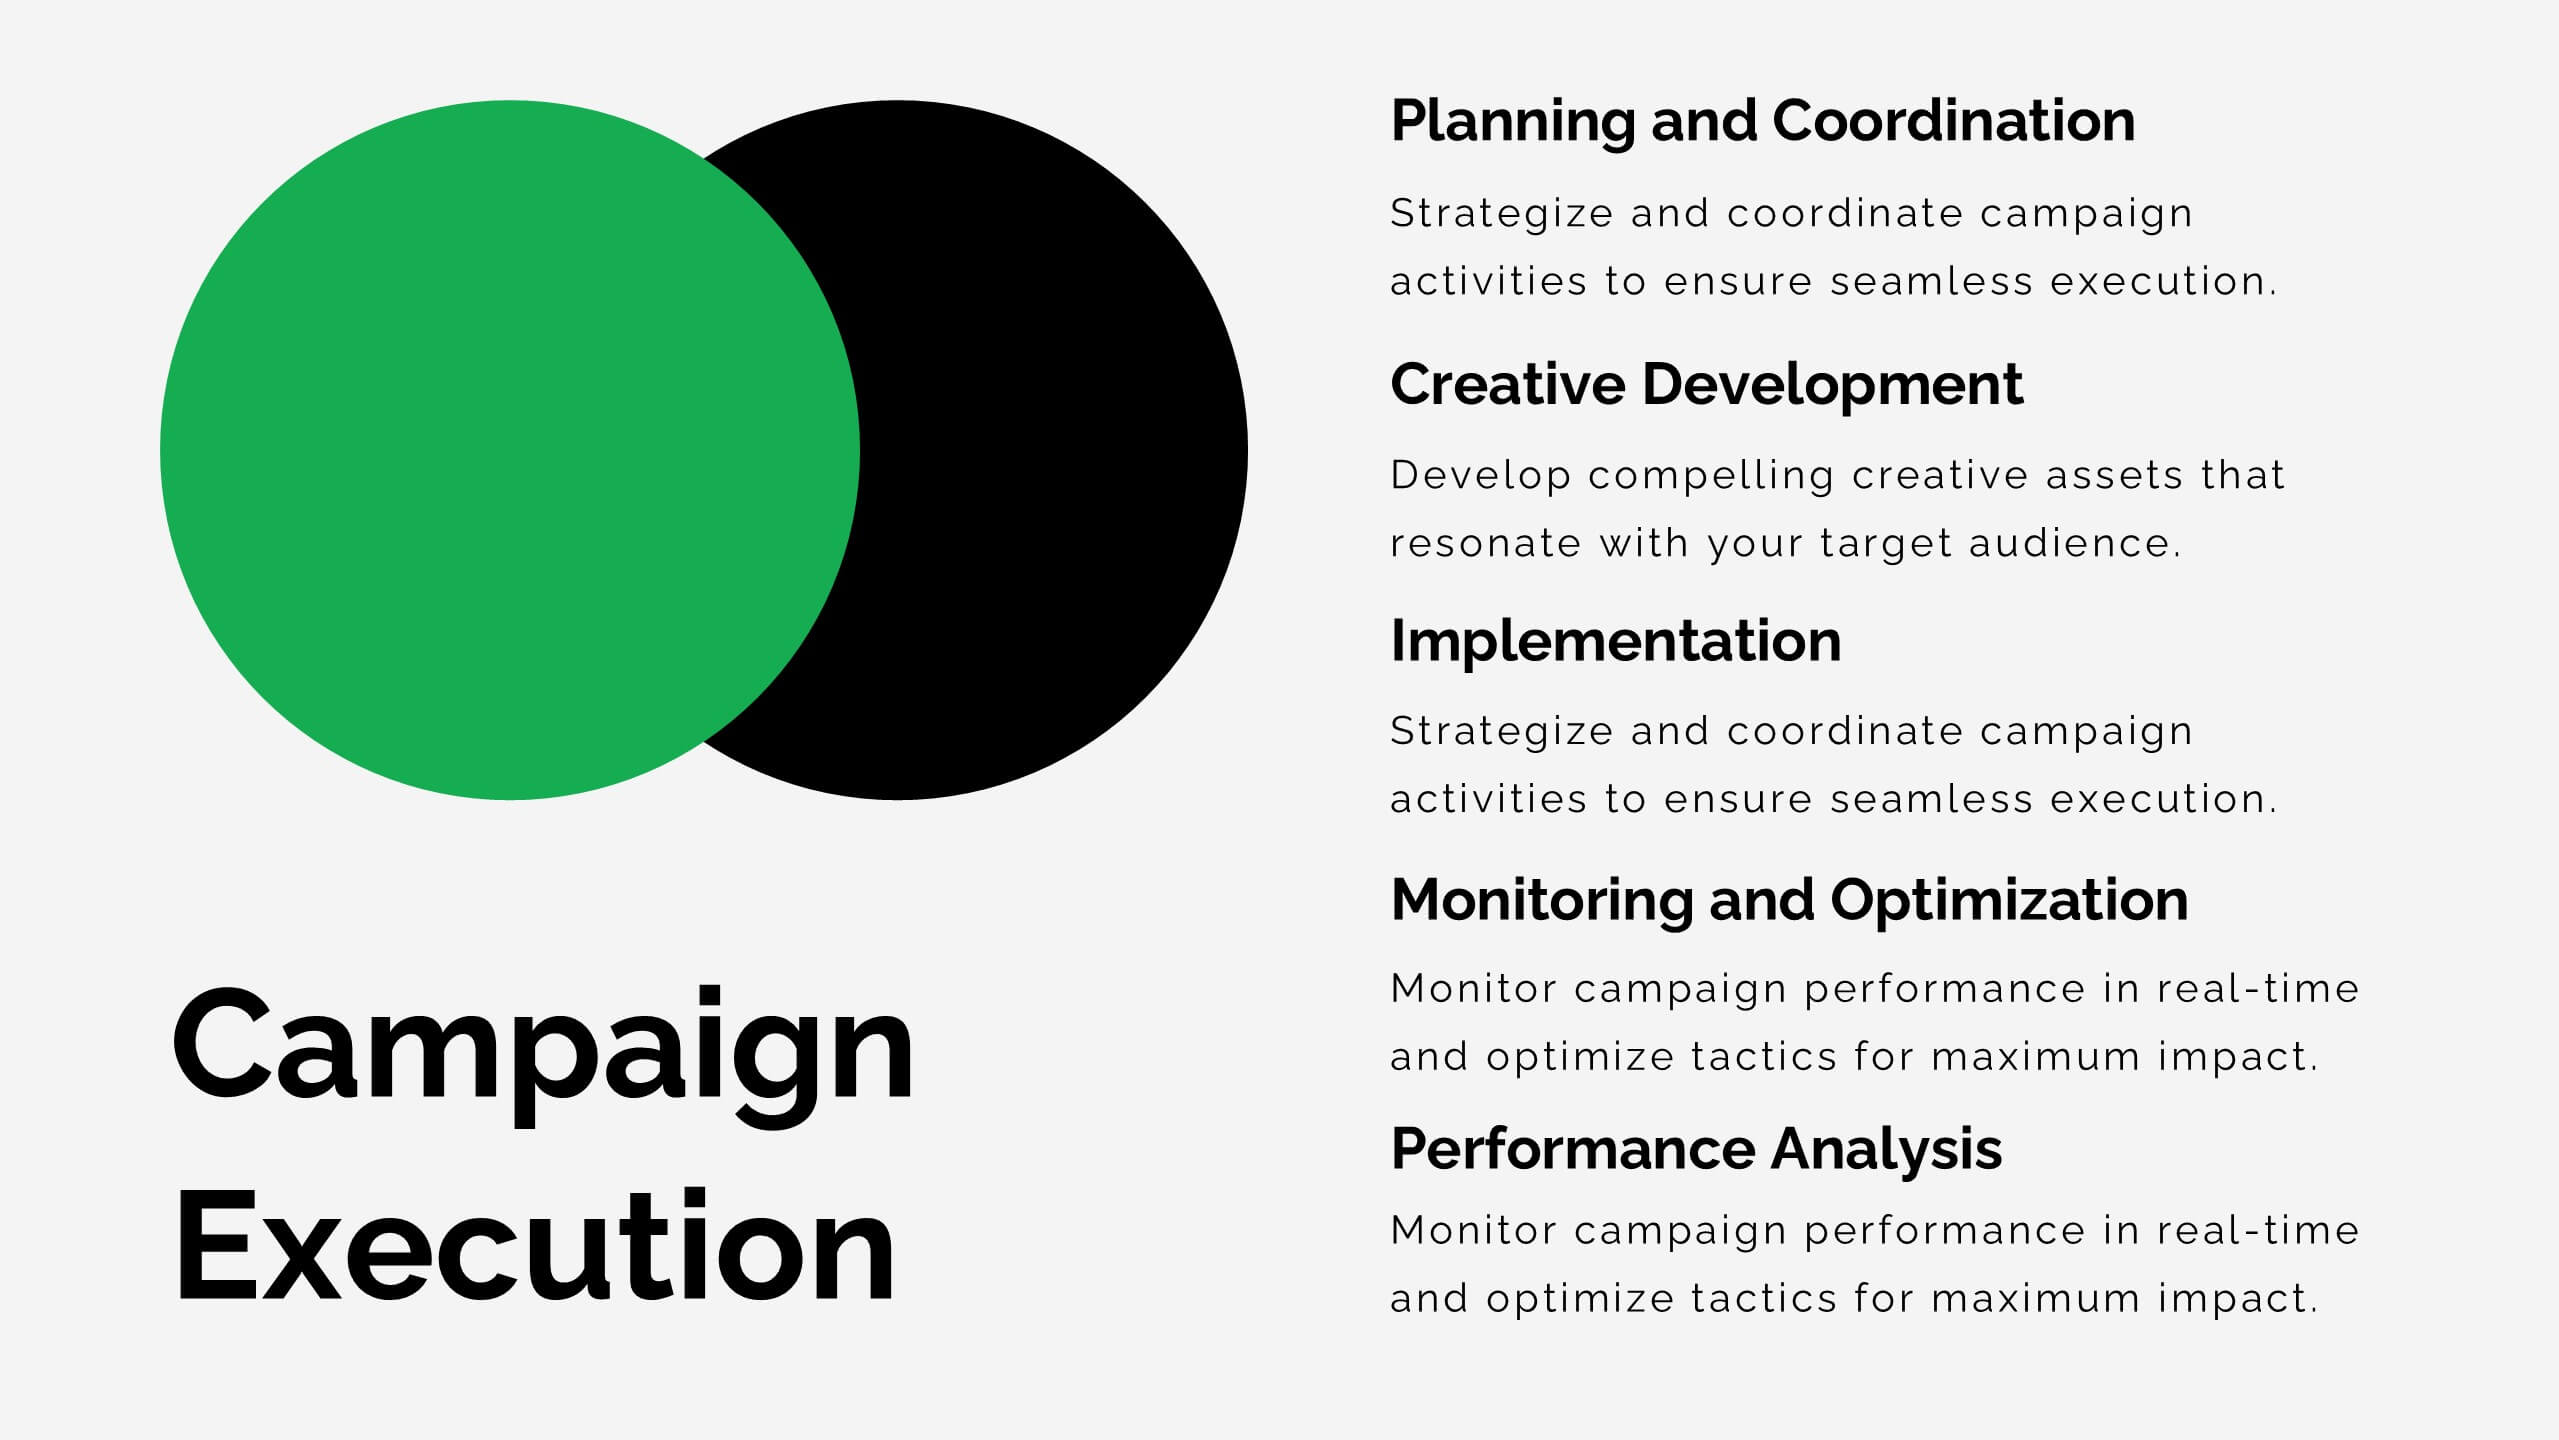
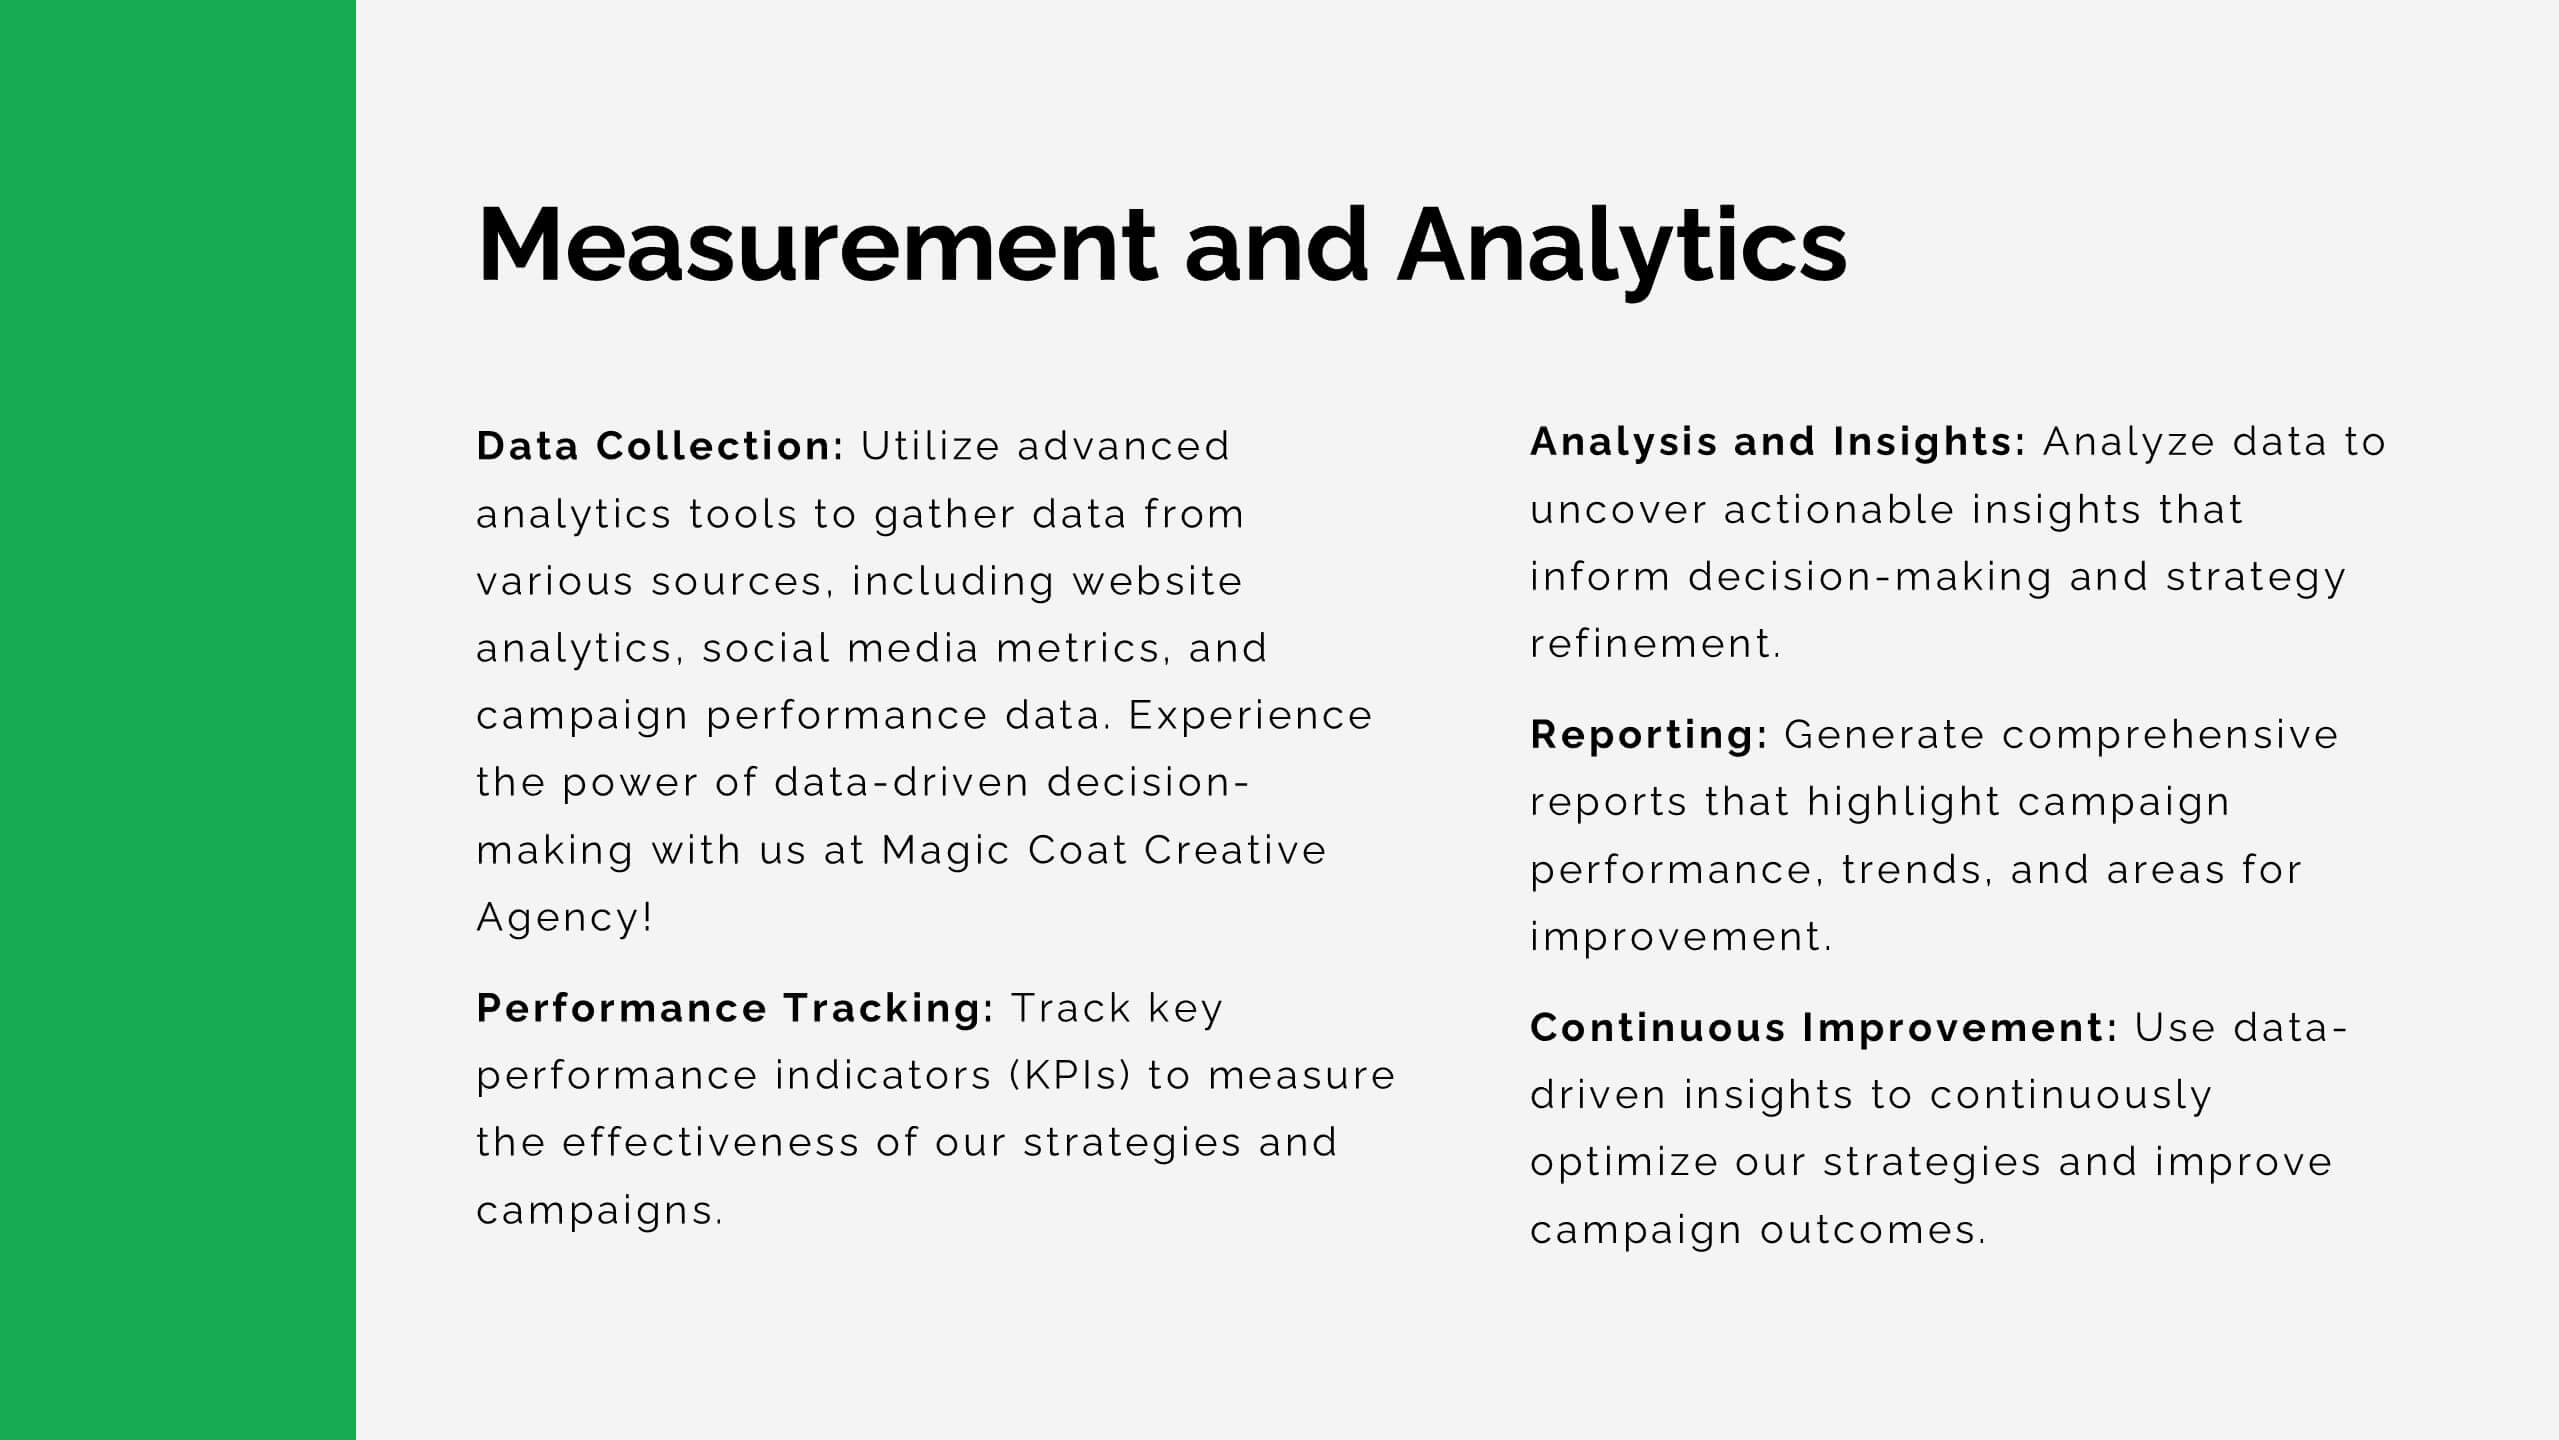
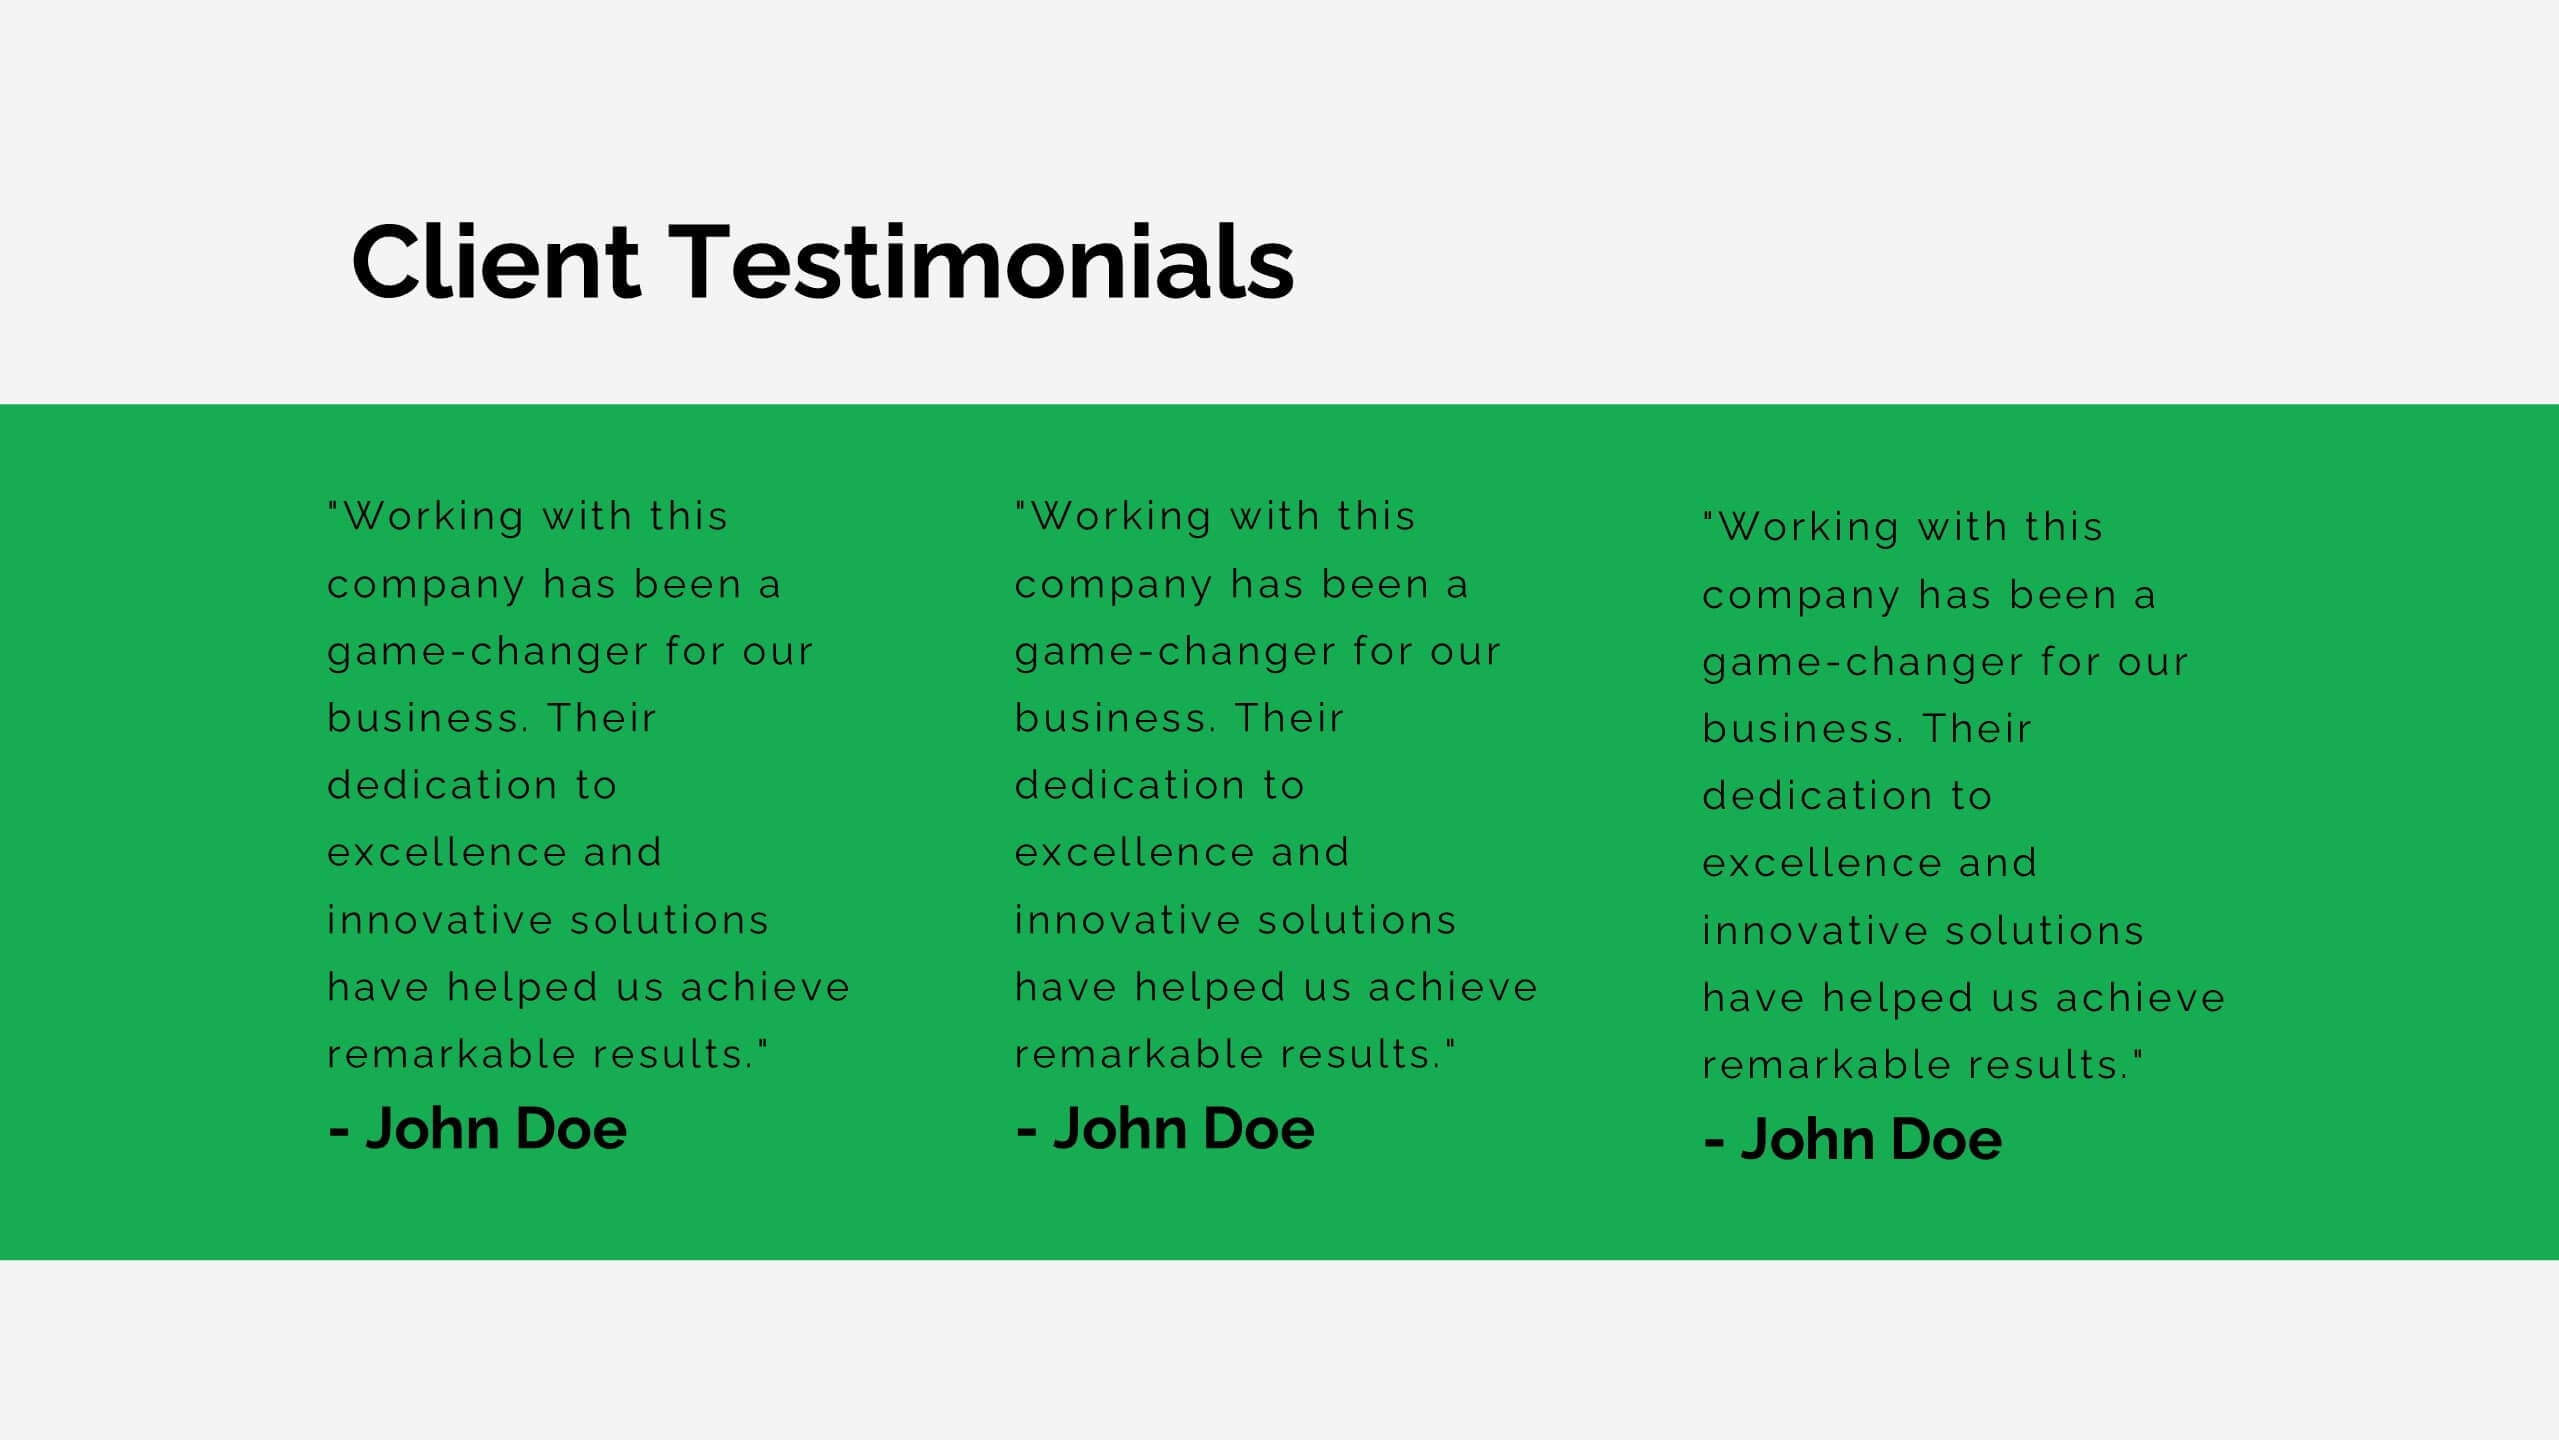
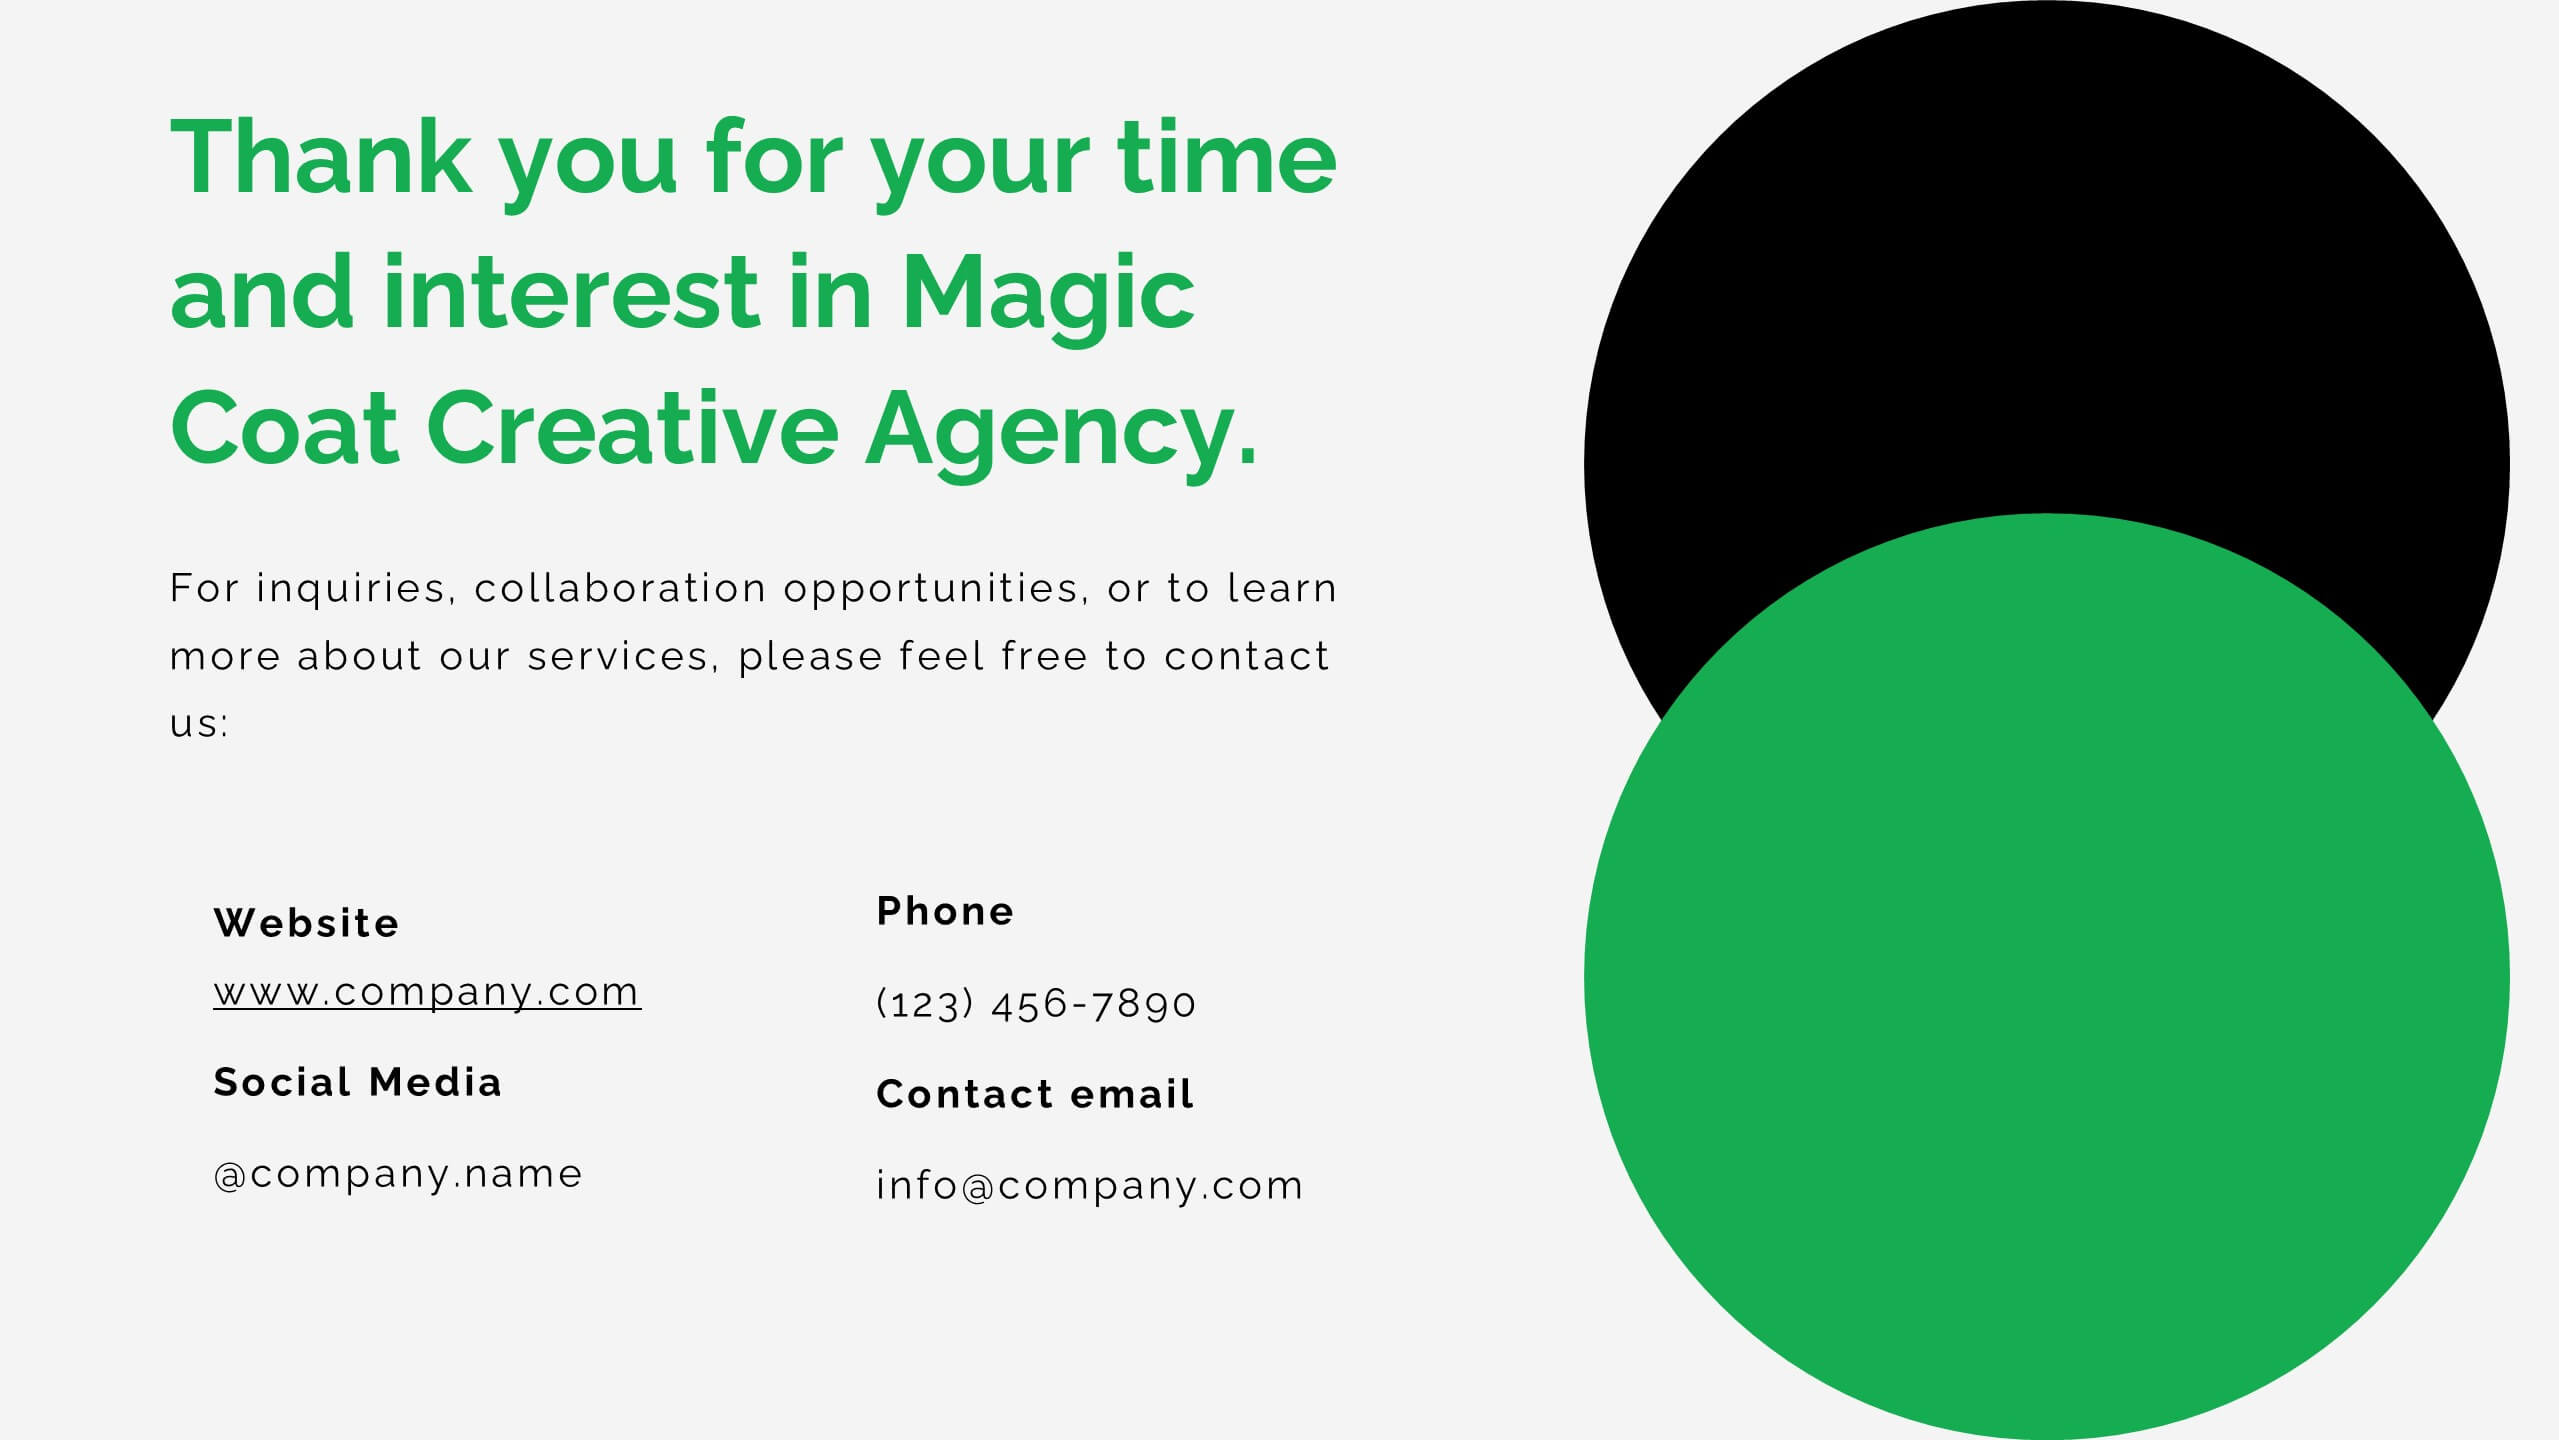
Lithium Advertising Agency Proposal Presentation
Elevate your advertising agency’s proposals with this sleek and modern template! It covers key areas like market analysis, case studies, client success stories, and campaign execution. Fully customizable, this template is perfect for presenting your agency’s services and strategies. Compatible with PowerPoint, Keynote, and Google Slides, it’s designed for impactful client presentations.


7 diapositivas
Objective Reasoning Infographic
Objective reasoning is pivotal in making informed decisions, and its importance cannot be overstated in today's fast-paced world. Our objective reasoning infographic, illuminated with shades of green, blue, and yellow, serves as a visual guide for systematically breaking down complex issues. Tailored for educators, business professionals, and decision-makers, this template outlines the core components and steps of objective reasoning. Its compatibility with PowerPoint, Keynote, and Google Slides ensures a seamless integration into your presentations, empowering your audience with a clear understanding of reasoned decision-making.


6 diapositivas
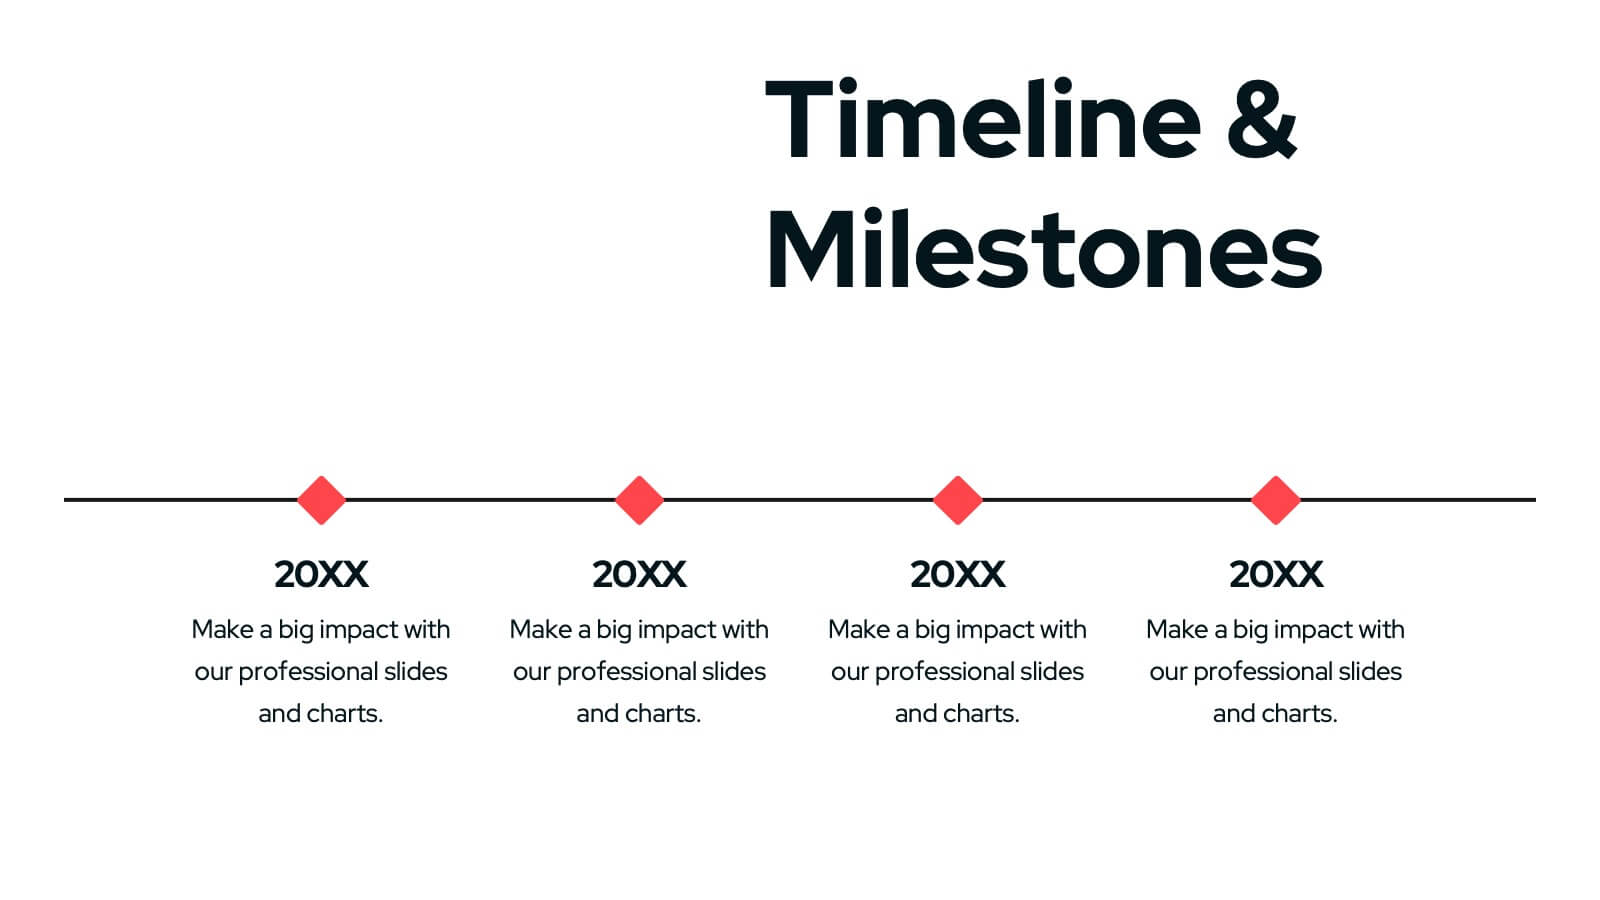
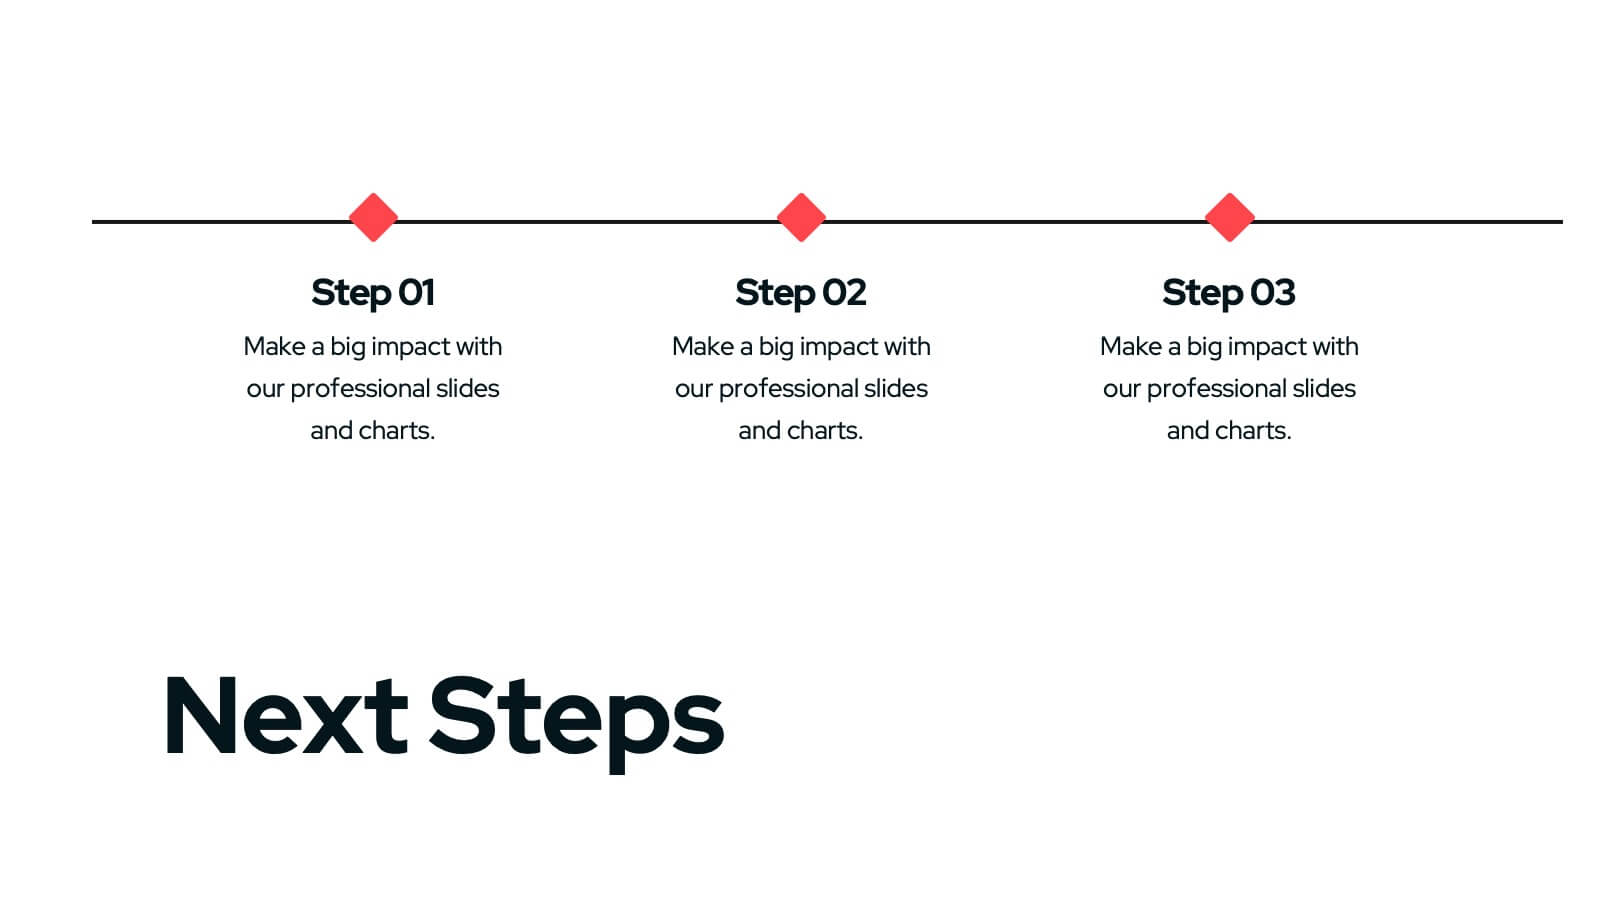
Results & Milestones Shown with Numbers
Track progress and showcase success with the Results & Milestones Shown with Numbers Presentation. This visual timeline highlights five key steps using numbered markers connected by a path—perfect for reporting achievements, product phases, or strategic milestones. Fully editable in PowerPoint, Keynote, and Google Slides.


21 diapositivas
Versa Product Development Plan Presentation
Bring your product ideas to life with this sleek and professional presentation template. It covers every stage of the development process: from product overviews, features, and competitive analysis to pricing strategies, marketing plans, and technical specifications. Visually striking sections like distribution channels and production processes ensure a clear and structured roadmap for your team and stakeholders. Fully customizable and compatible with PowerPoint, Keynote, and Google Slides.


7 diapositivas
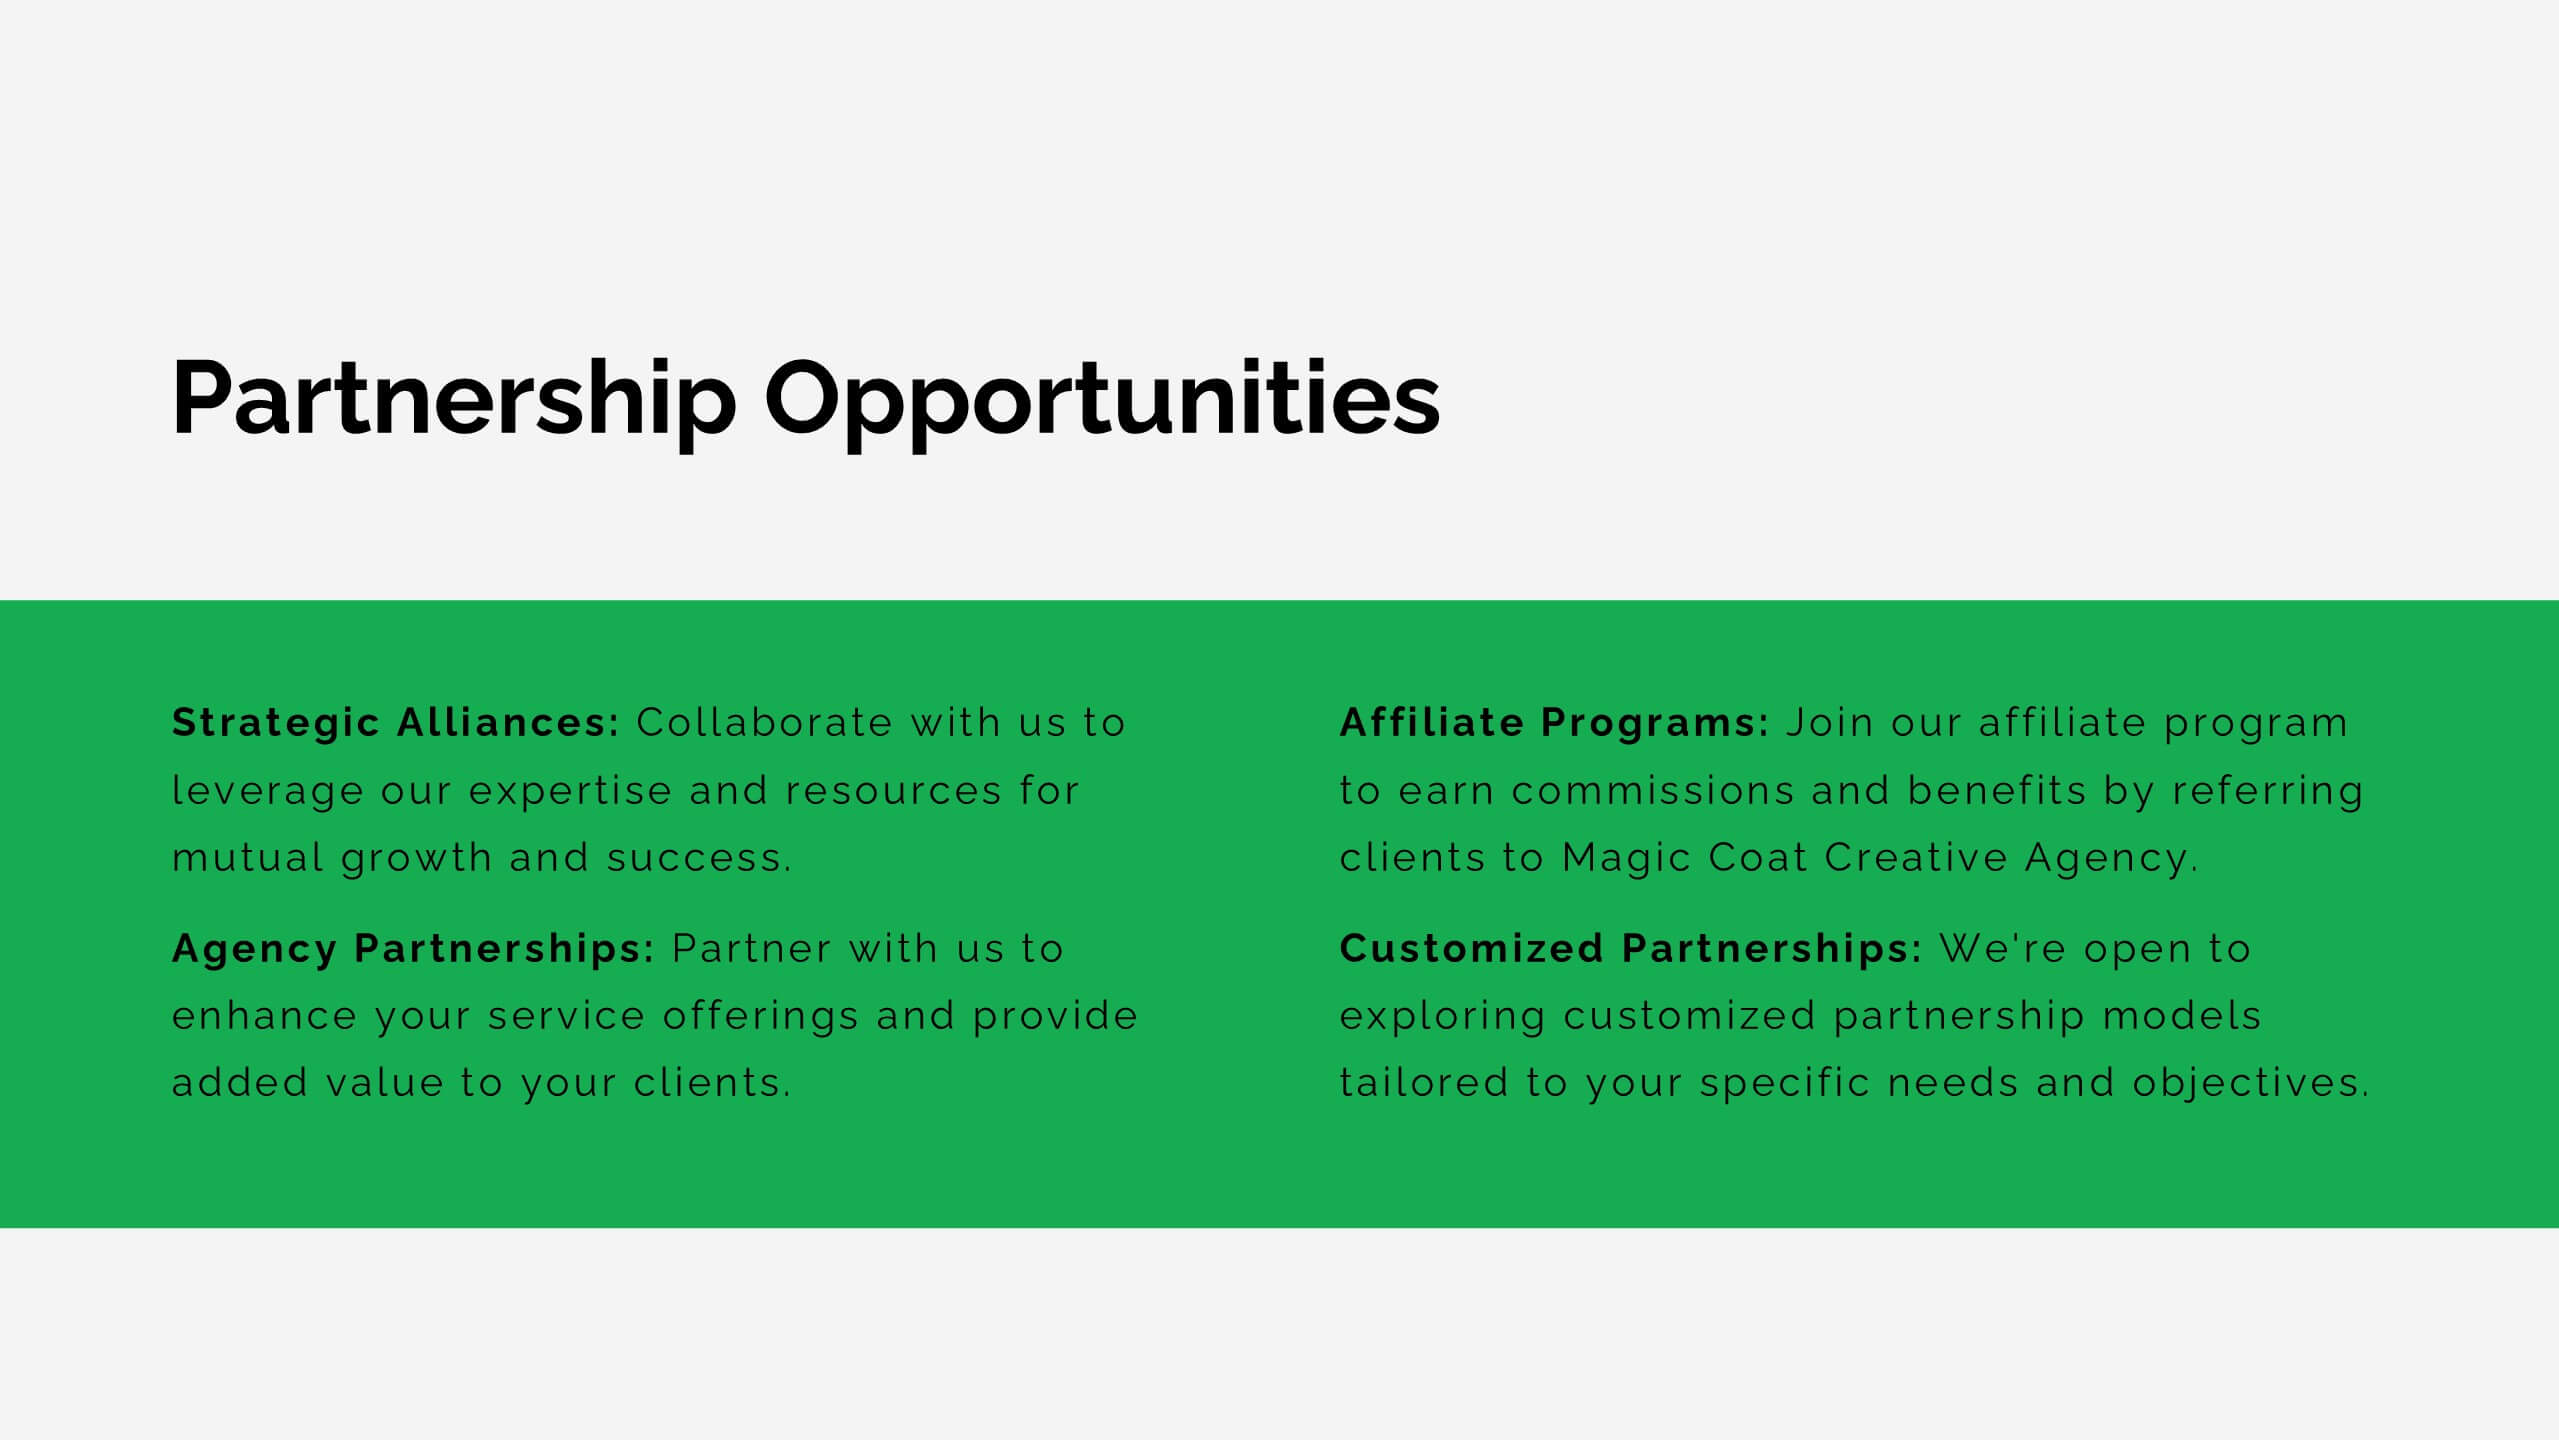
Project Proposal Infographic
Enhance your project presentations with our Project Proposal Templates, designed to outline your project comprehensively and engage stakeholders effectively. These templates provide a structured way to present every aspect of the project, from the scope and objectives to the resources and timelines, ensuring all key elements are covered. Each slide is crafted with a professional design, featuring a cohesive green color scheme that not only adds visual appeal but also aids in the organization of information. The templates include various sections such as project background, key objectives, project scope, implementation steps, and projected benefits, which are essential for outlining a clear and detailed project plan. Ideal for project managers, business analysts, and team leaders, these templates can be fully customized to match the specifics of your project, allowing for the addition of text, charts, and graphics as needed. Whether for internal reviews or external pitches, these slides will help you articulate your vision and strategy effectively, fostering clarity and facilitating decision-making.


6 diapositivas
Sustainability Assets Management Infographic
Sustainability management refers to the strategic planning, implementation, and monitoring of practices that promote environmental, social, and economic sustainability within organizations. This infographic template visually presents key elements and strategies for managing sustainability assets within an organization. Visualize the process of identifying sustainability assets within an organization. This template will allow you to explain how each sustainability asset contributes to the organization's overall value proposition. Incorporate icons or graphics that align with the organization's mission and goals.


5 diapositivas
Benefits of Yoga Infographics
Yoga offers a wide range of benefits for the mind, body, and overall well-being, these also tend to deepen with regular practice. These infographic templates highlight the numerous advantages of practicing yoga. Whether you're a yoga instructor, wellness coach, or health enthusiast, this template provides a comprehensive overview of the physical, mental, and emotional benefits of yoga. The infographics include text boxes, illustrations, and graphs that can be used to promote the advantages of incorporating yoga into one's lifestyle. Compatible with Powerpoint, Keynote, and Google Slides, these are easily customizable.


6 diapositivas
Process Cycle Wheel Slide Presentation
Give your workflow a visual rhythm with this clean, circular layout designed to highlight every stage of a process with clarity and style. Perfect for showcasing cycles, systems, or strategies, it keeps your message organized and engaging. Fully editable and compatible with PowerPoint, Keynote, and Google Slides.


8 diapositivas
Employee Onboarding 30-60-90 Day Plan Presentation
Set new hires up for success with this employee onboarding 30-60-90 day plan template! Designed to streamline the onboarding process, this structured layout helps HR teams and managers define clear goals, training steps, and performance milestones. Fully customizable and compatible with PowerPoint, Keynote, and Google Slides for seamless adaptation.
21 diapositivas
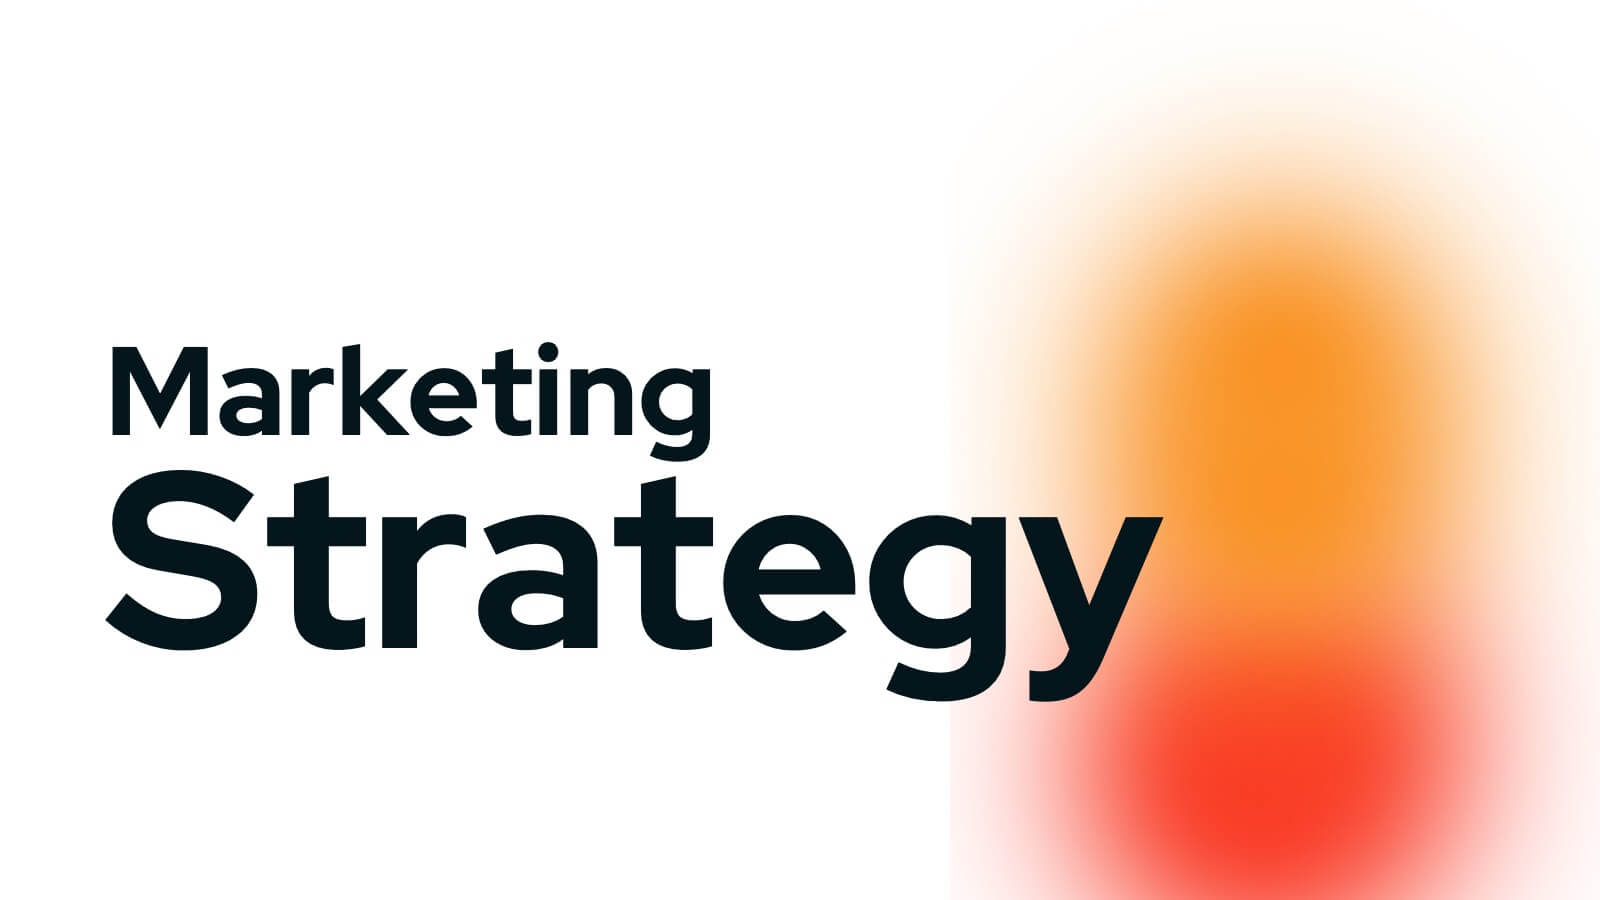
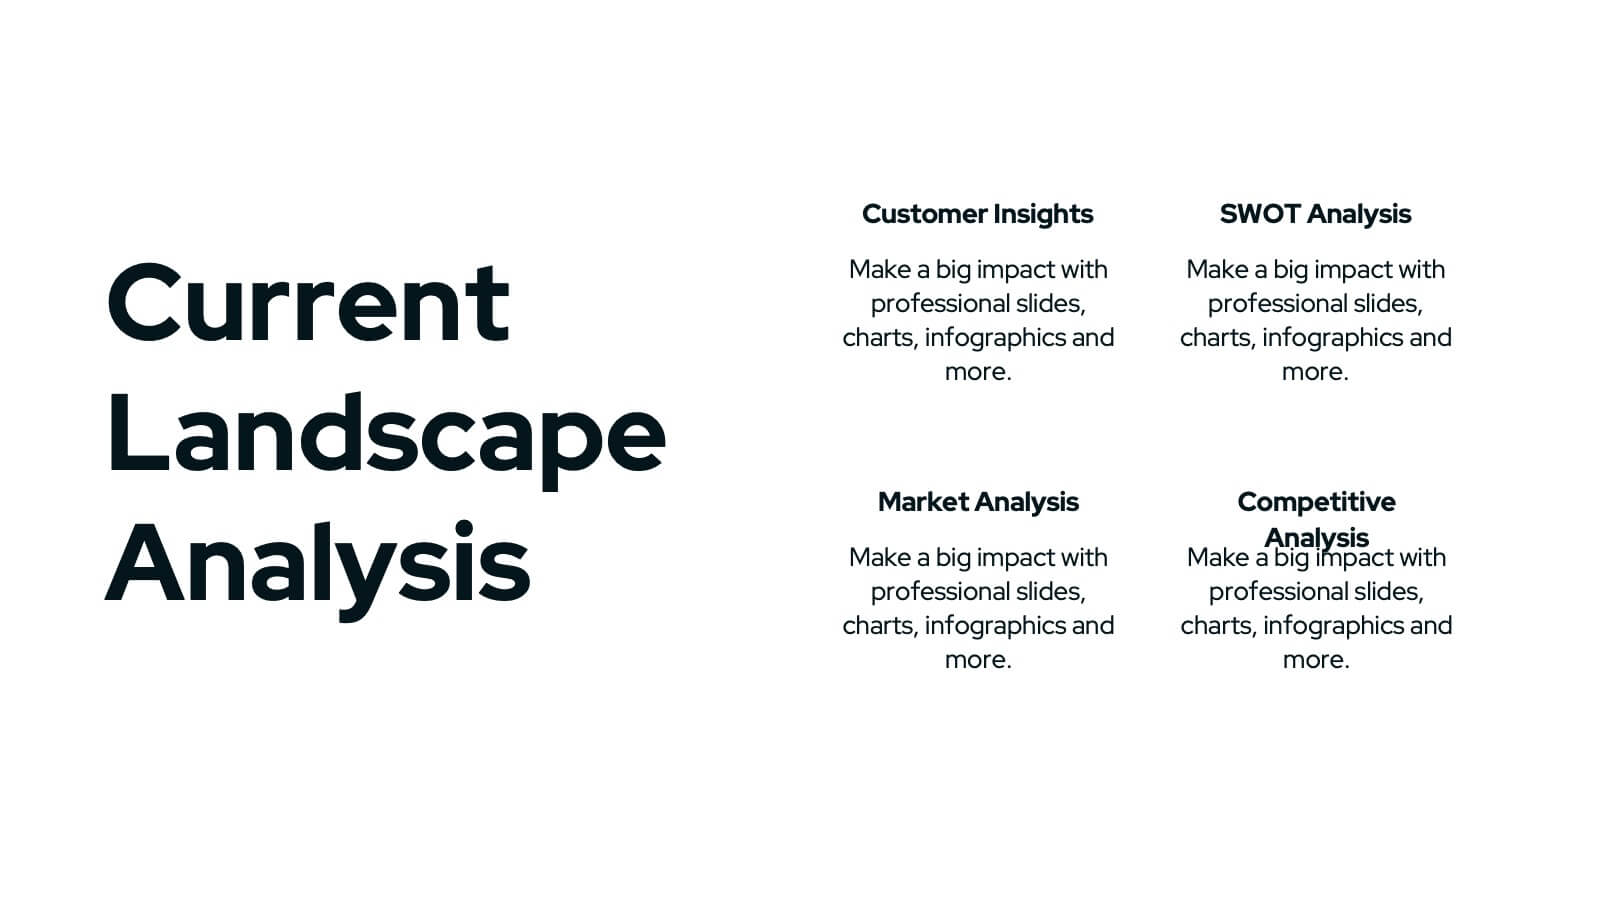
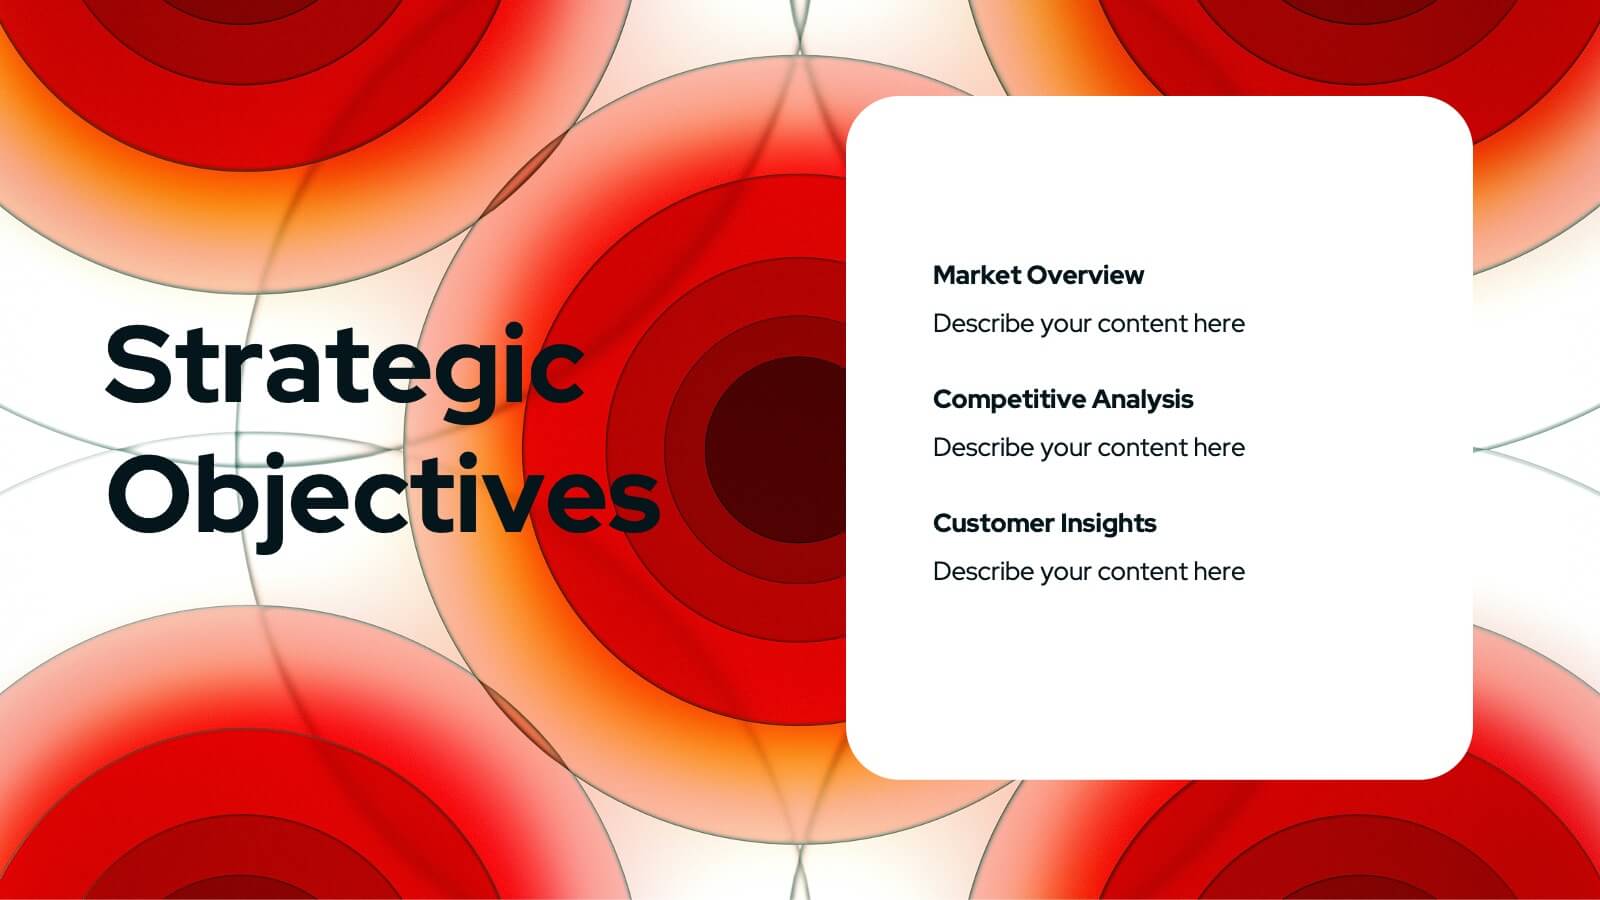
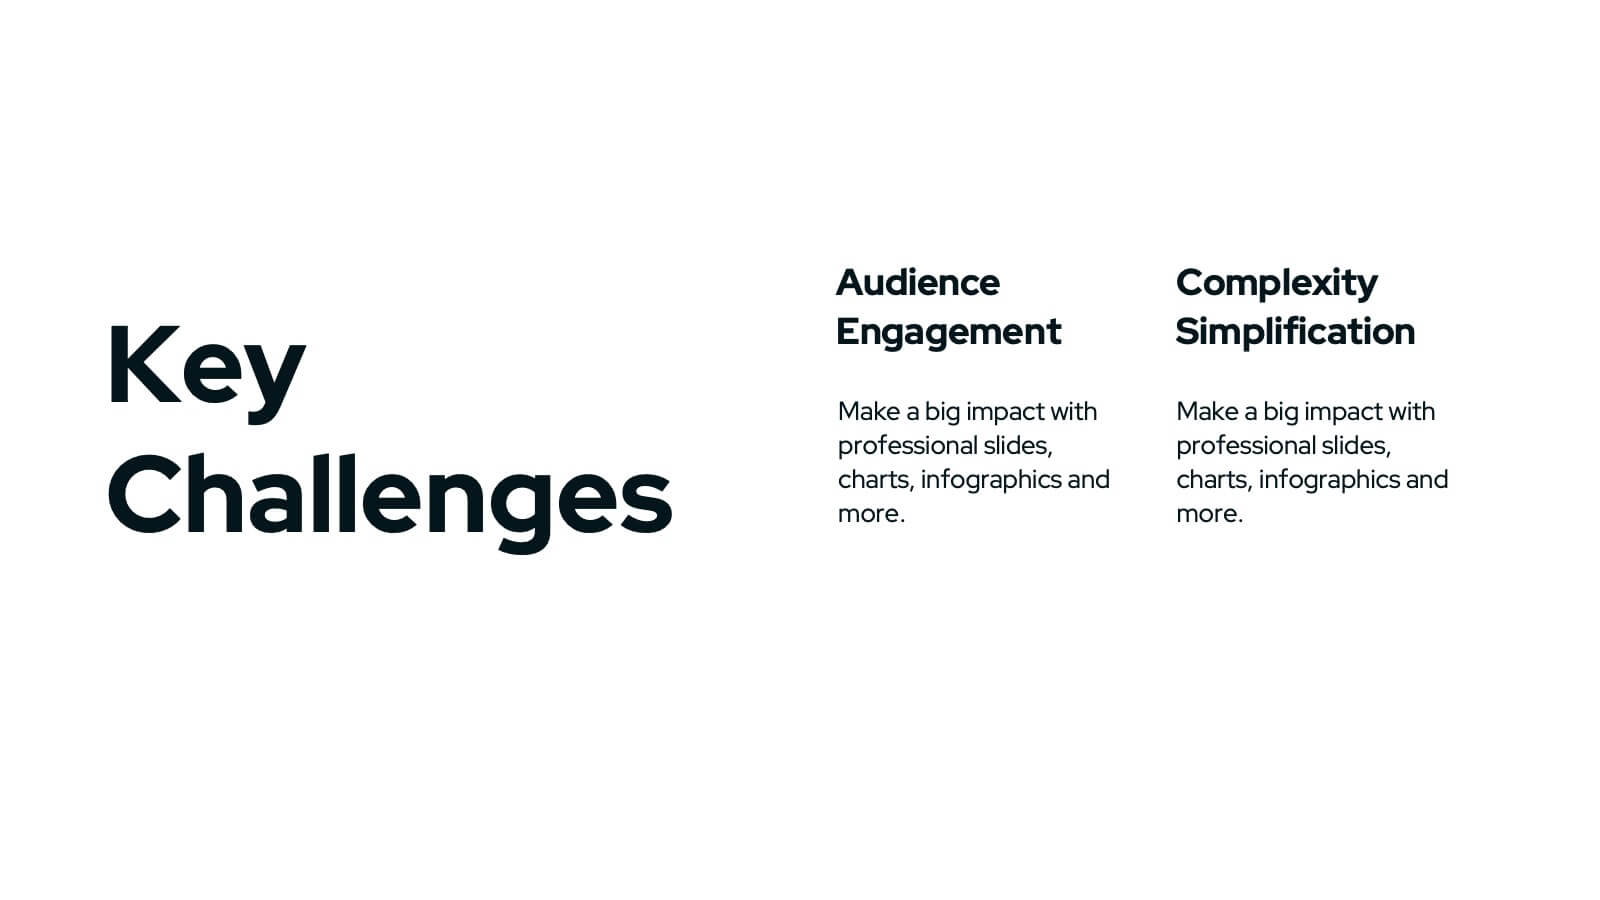
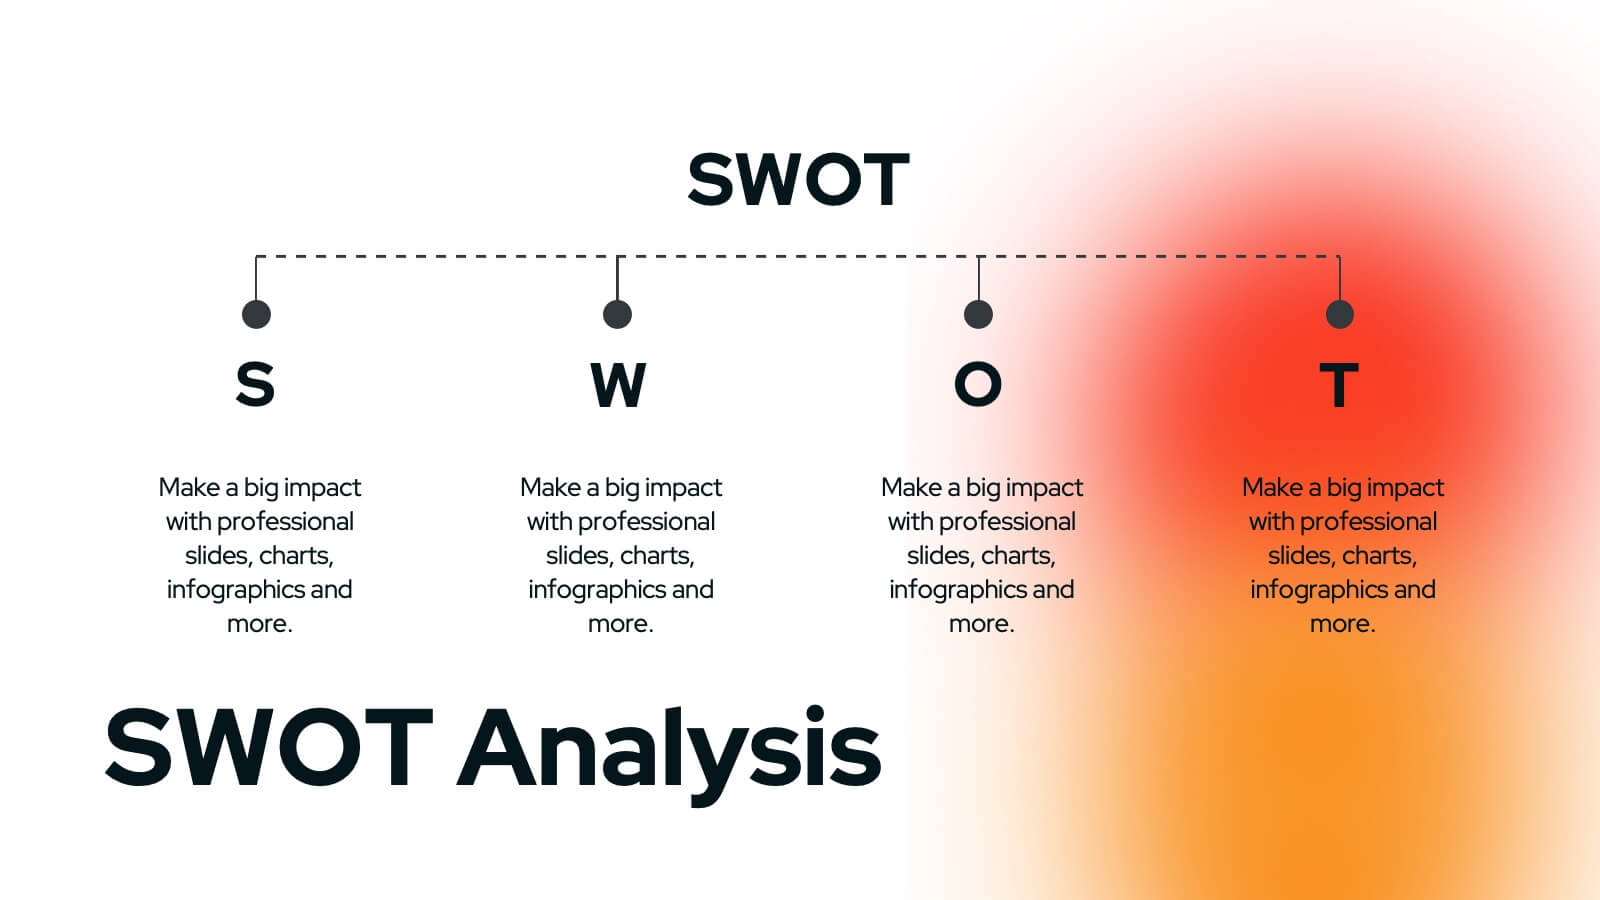
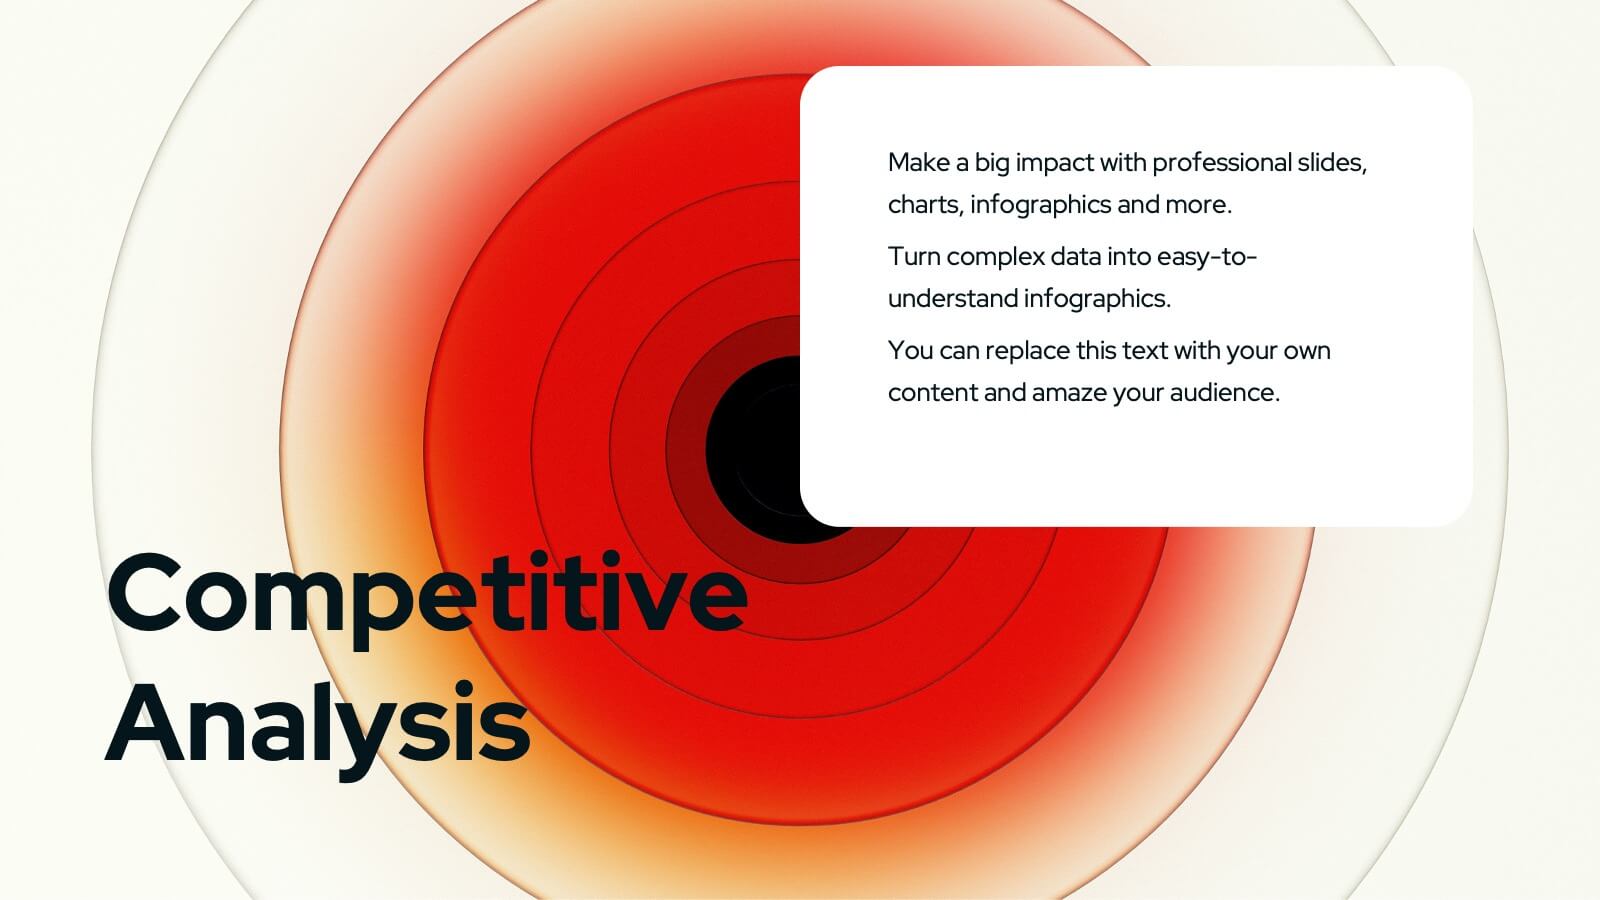
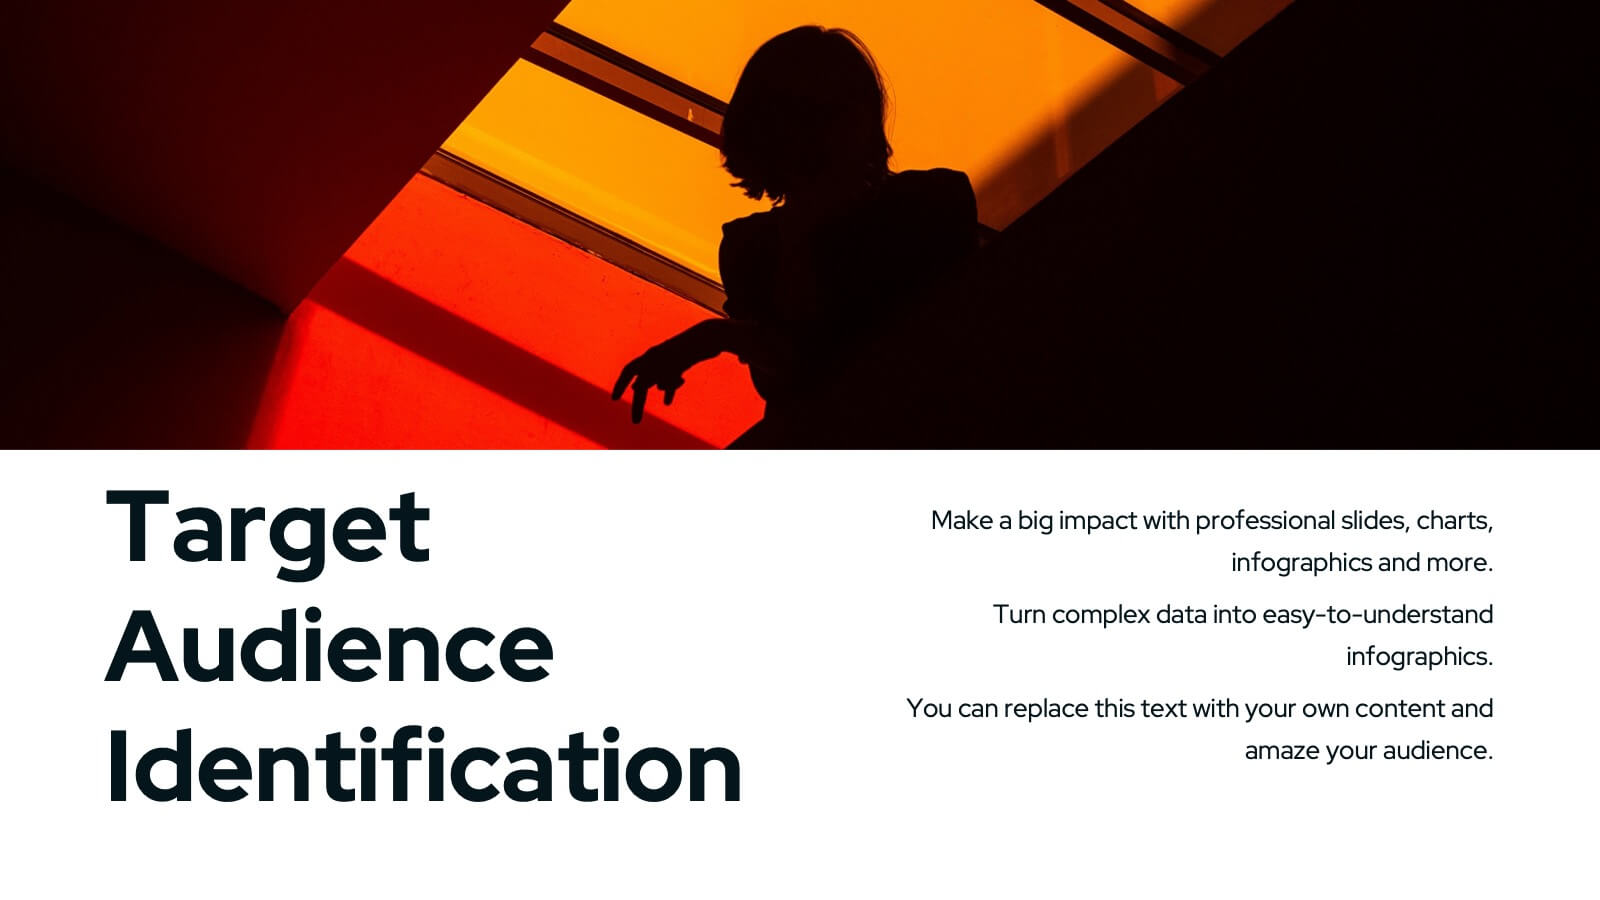
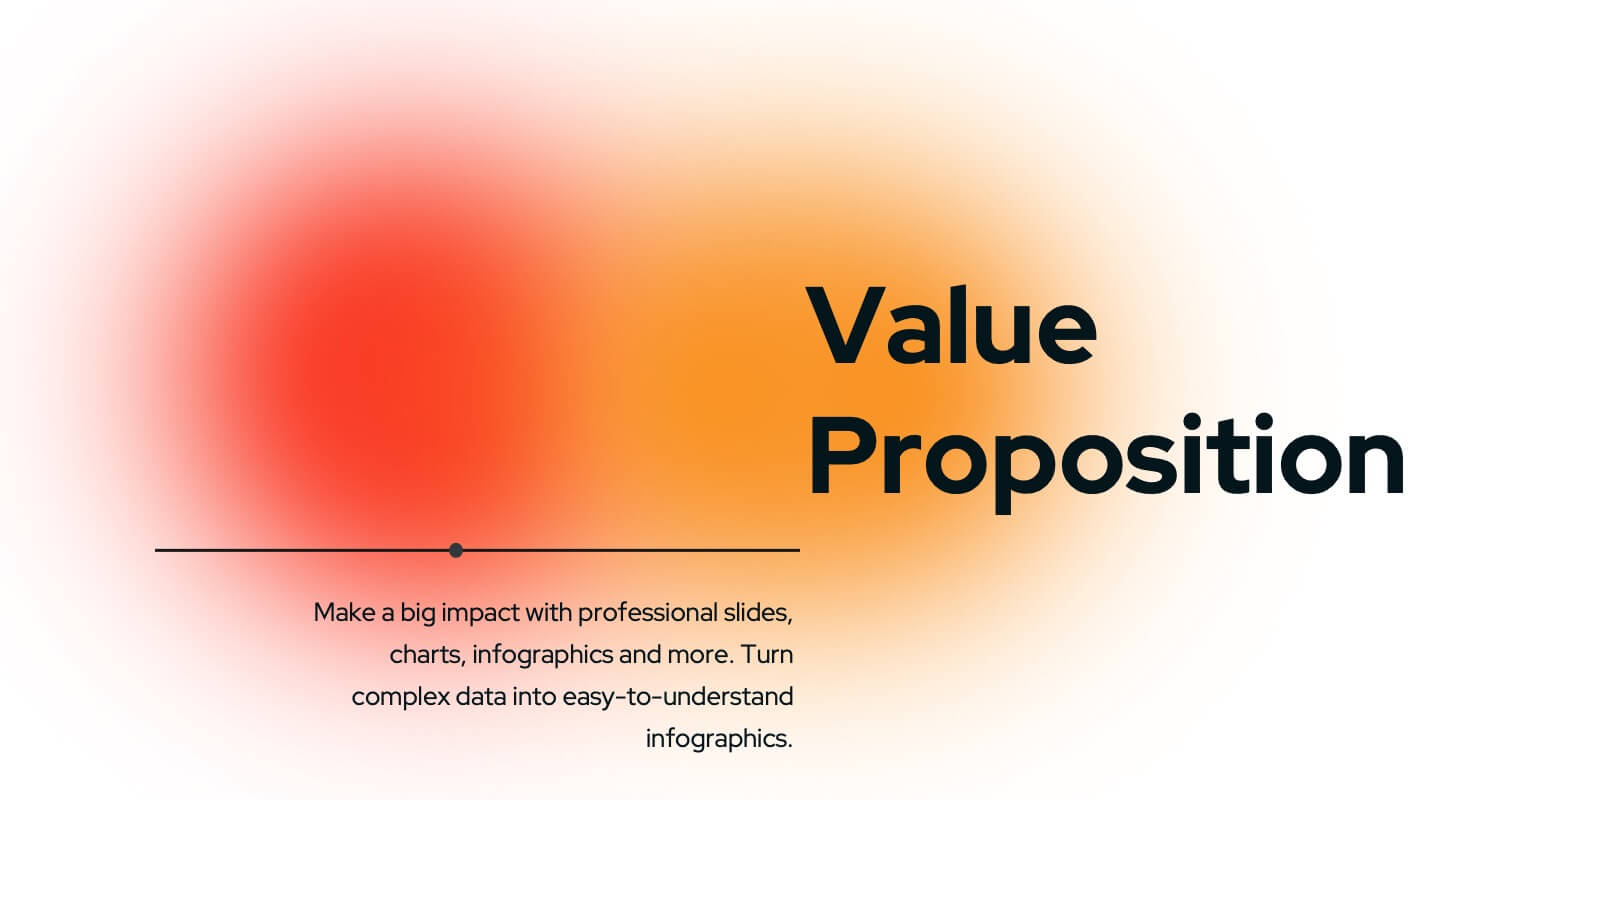
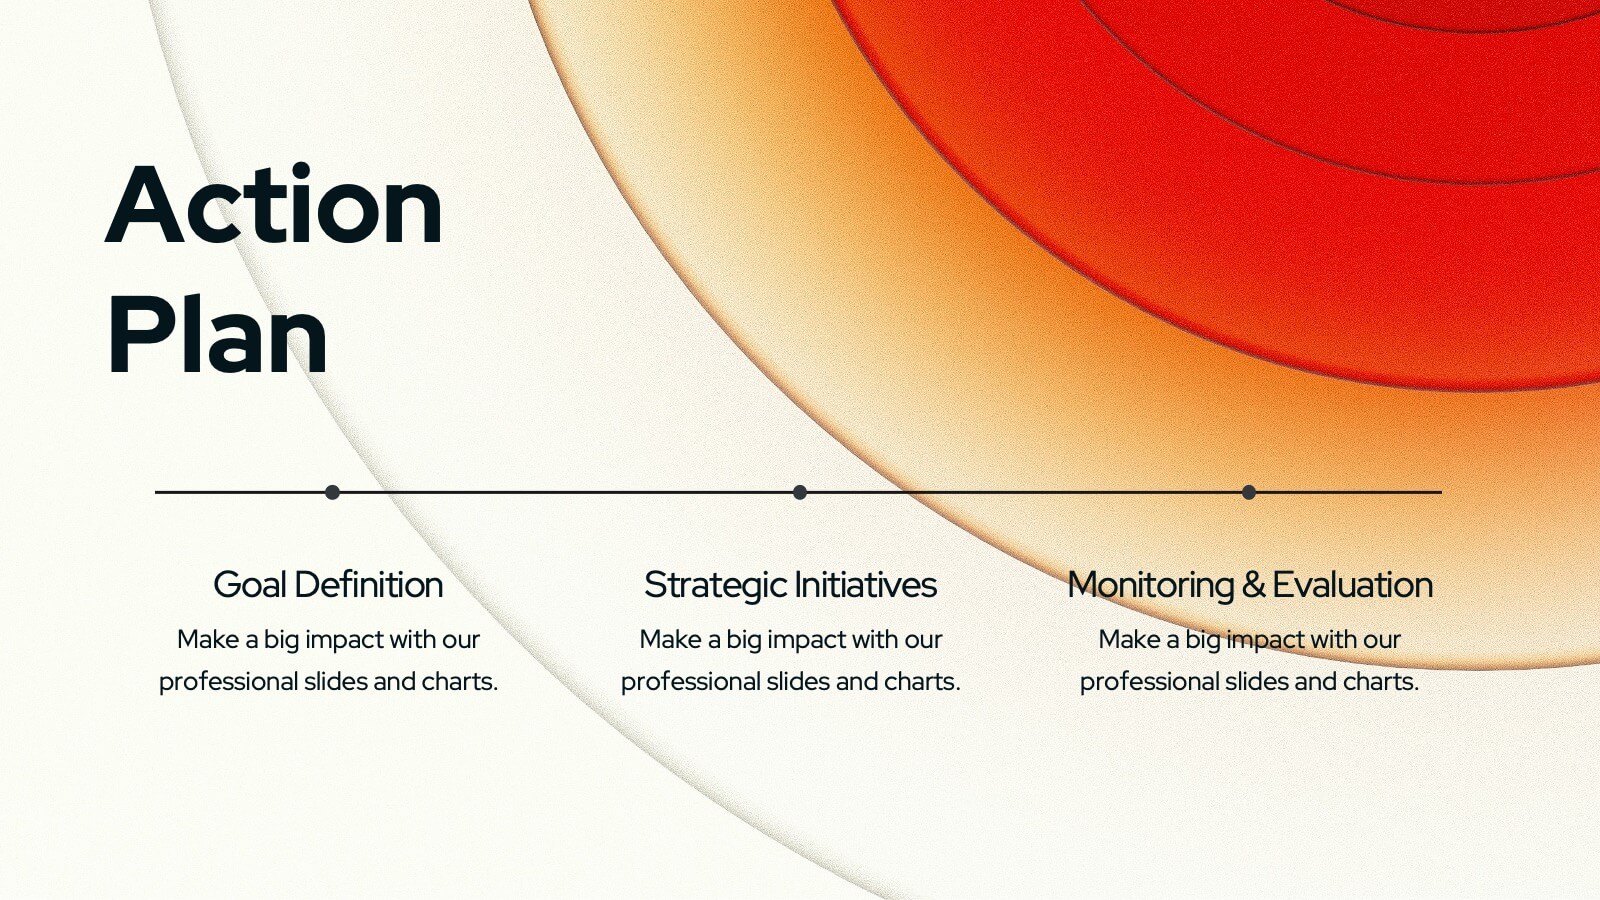
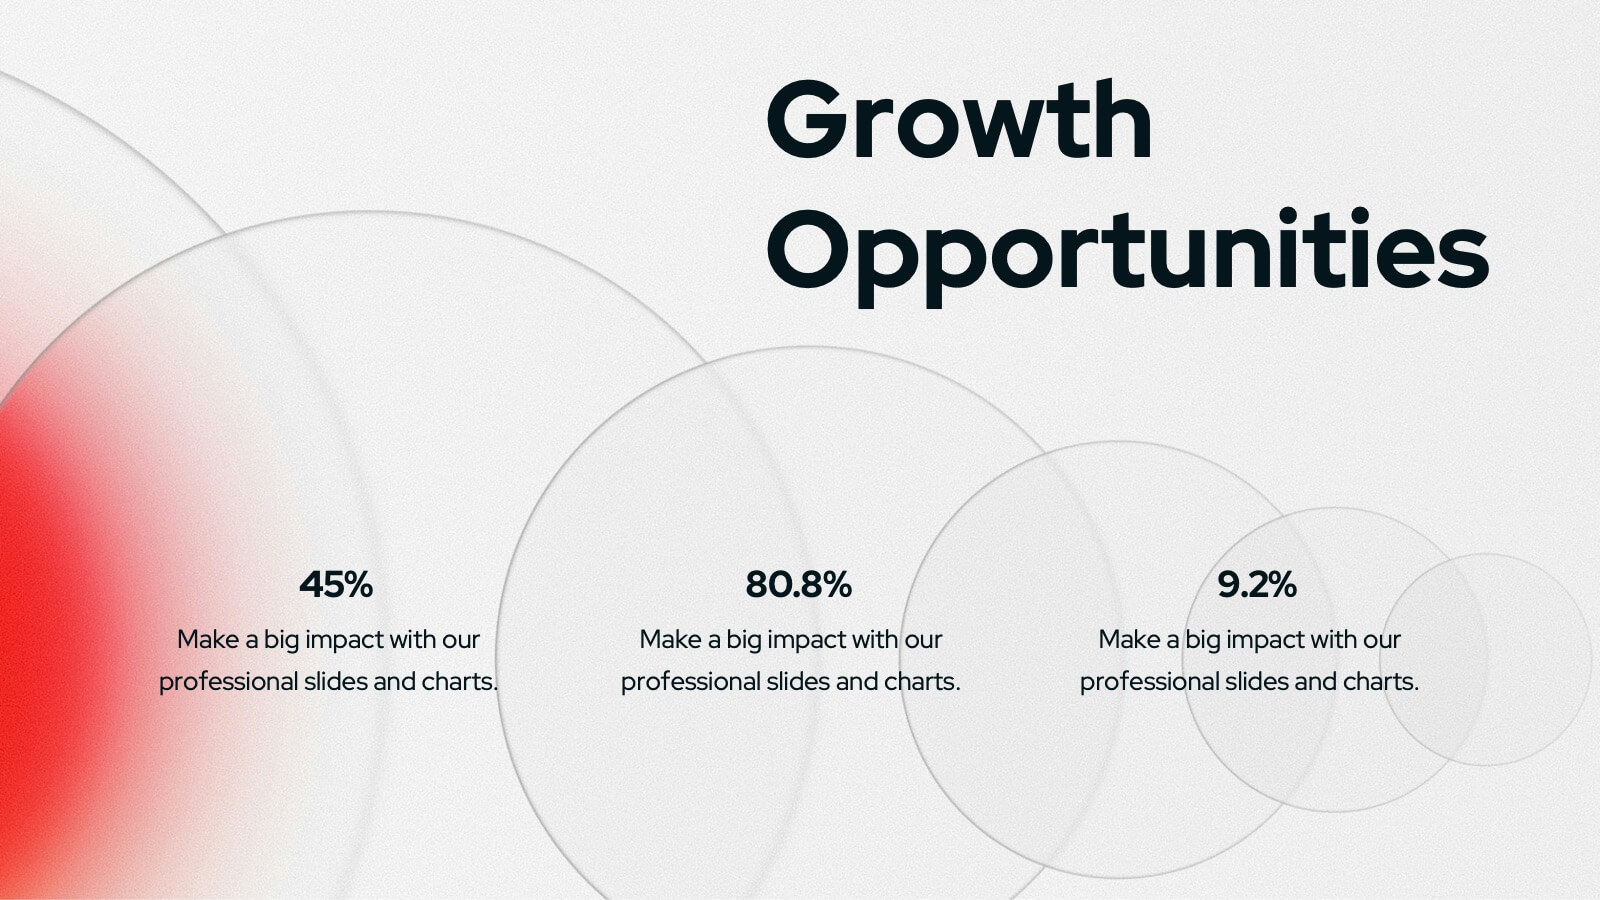
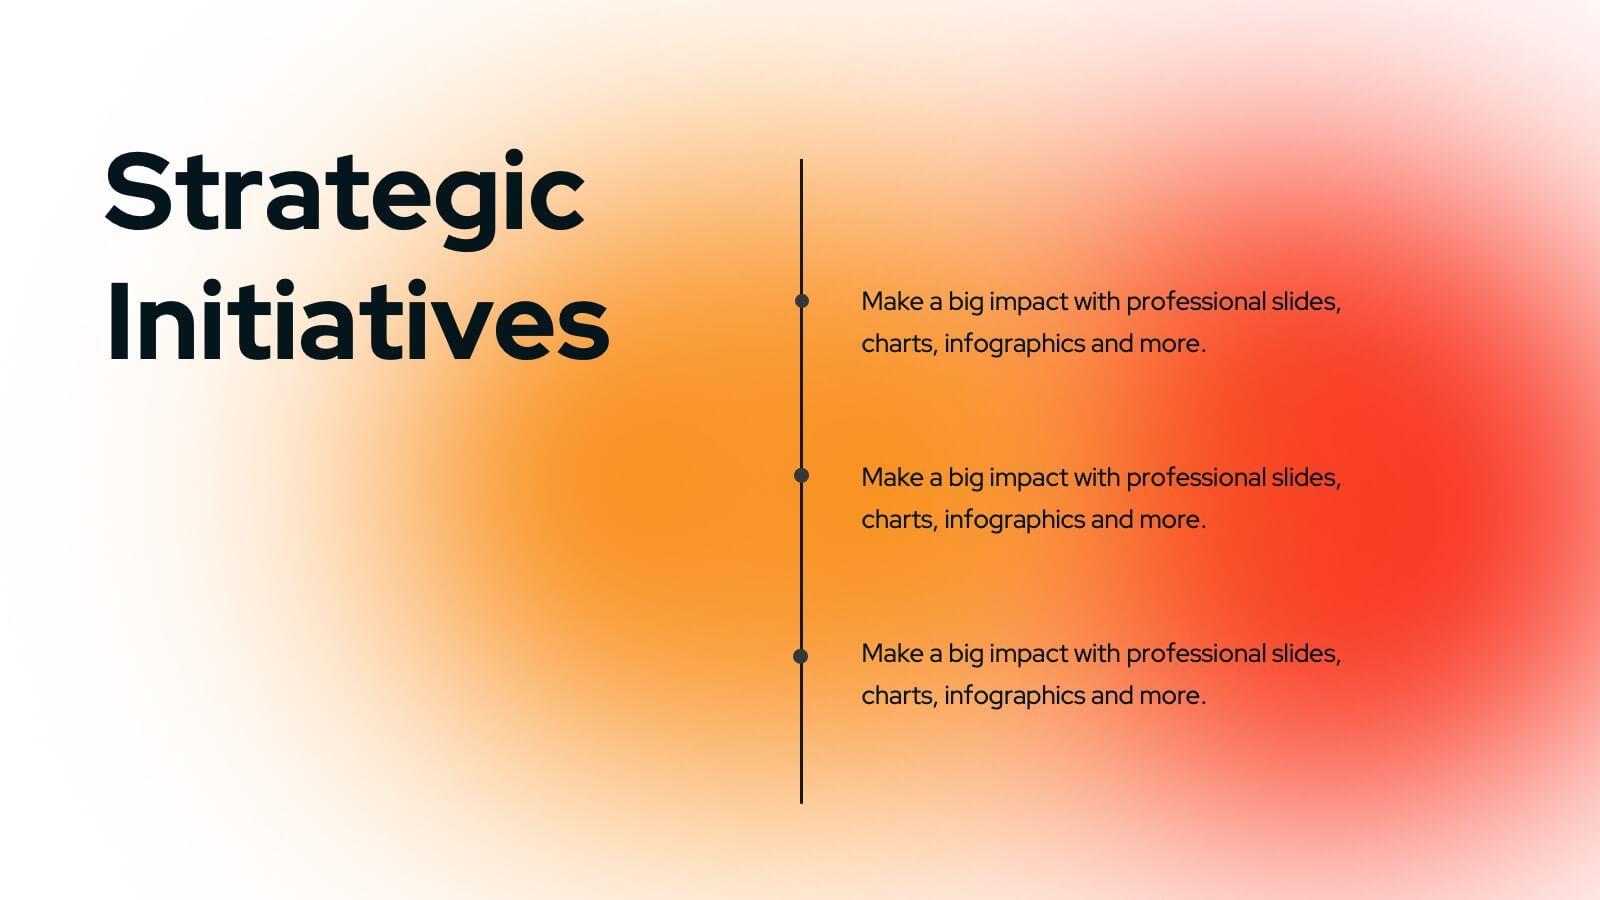
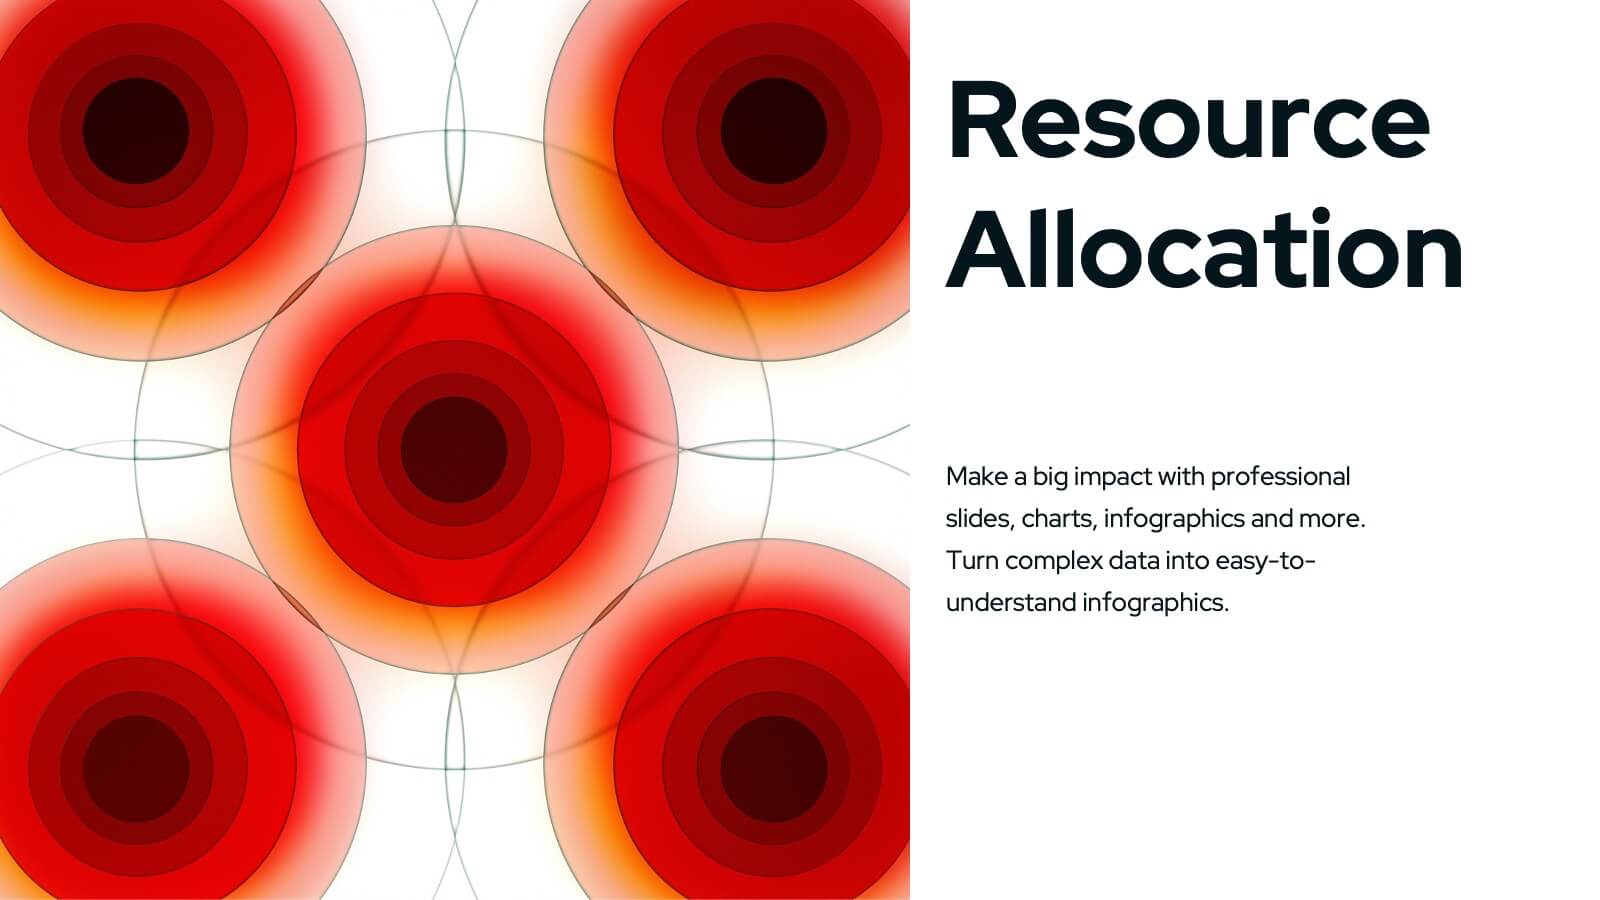
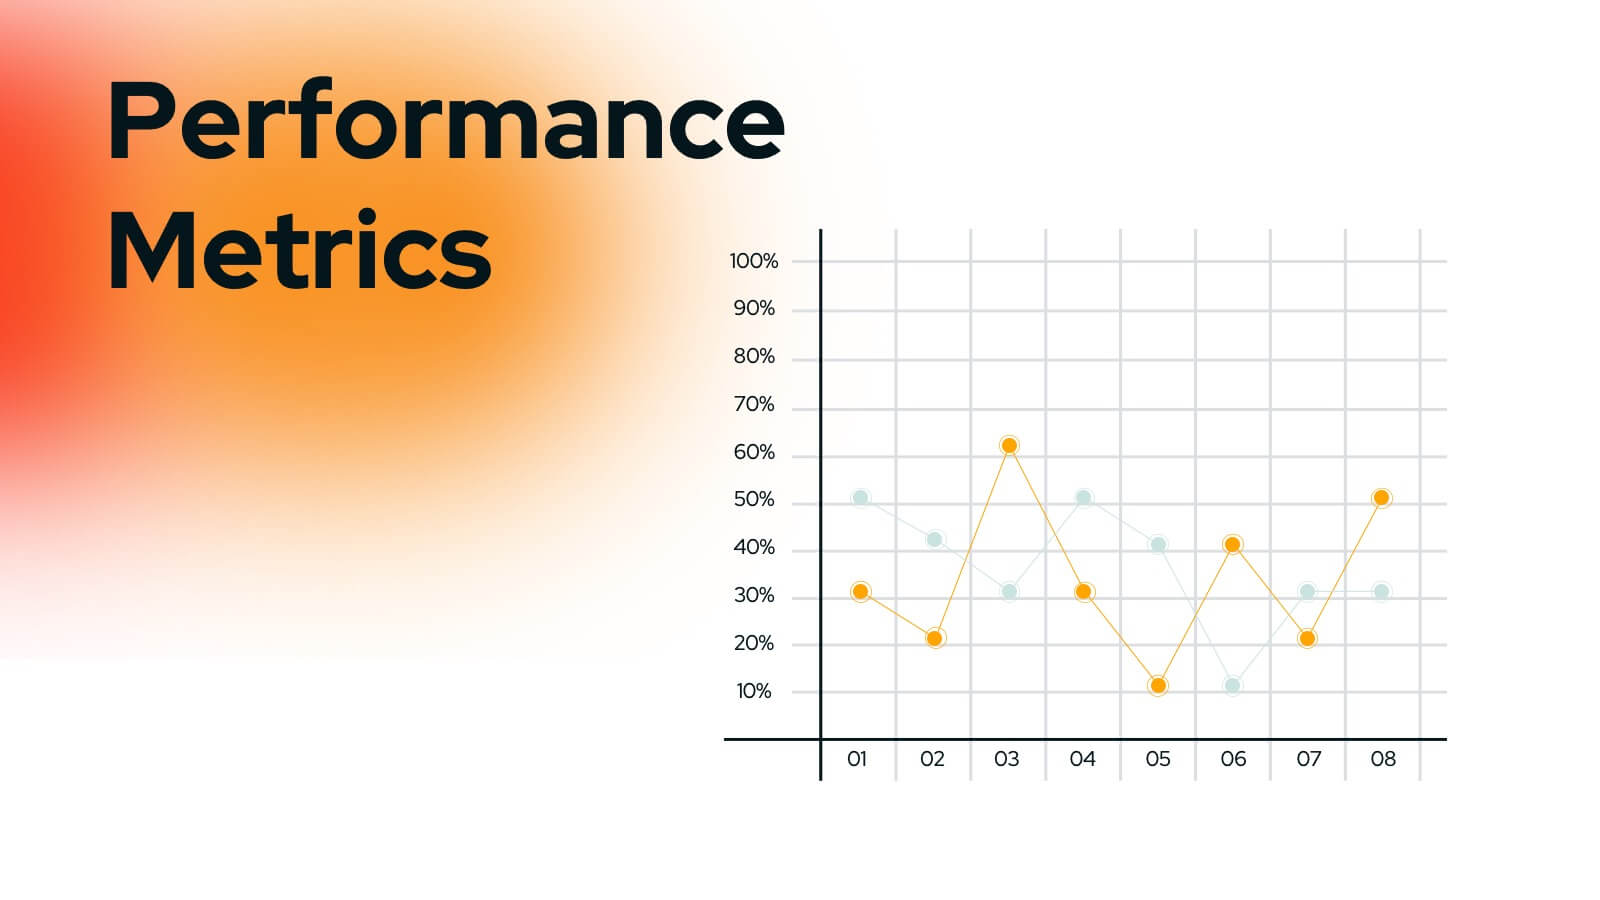
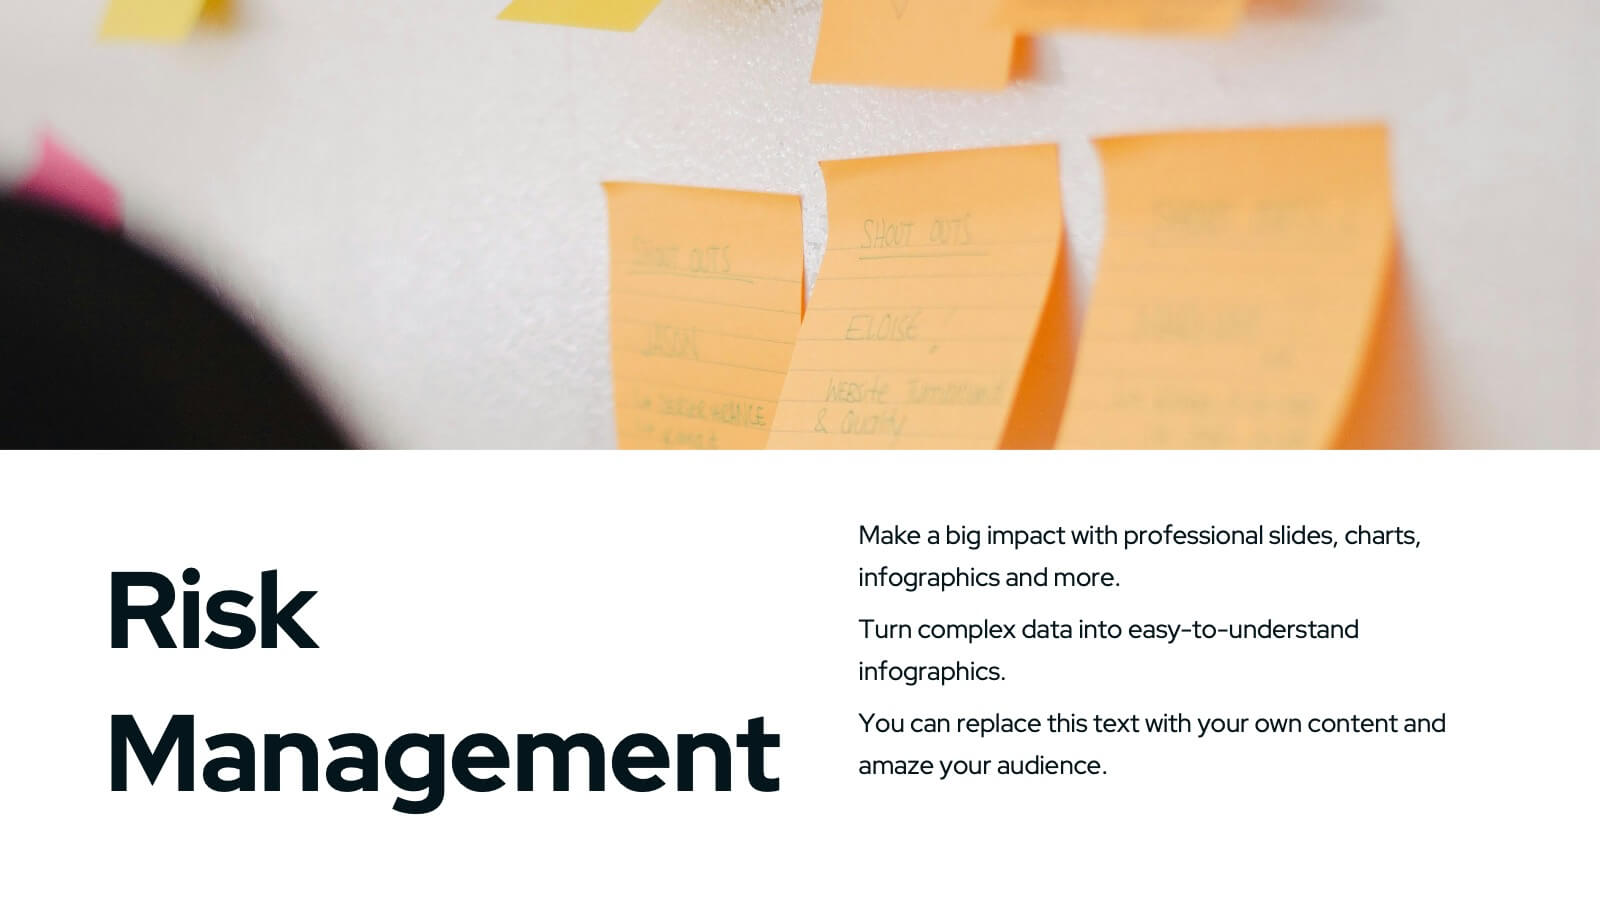
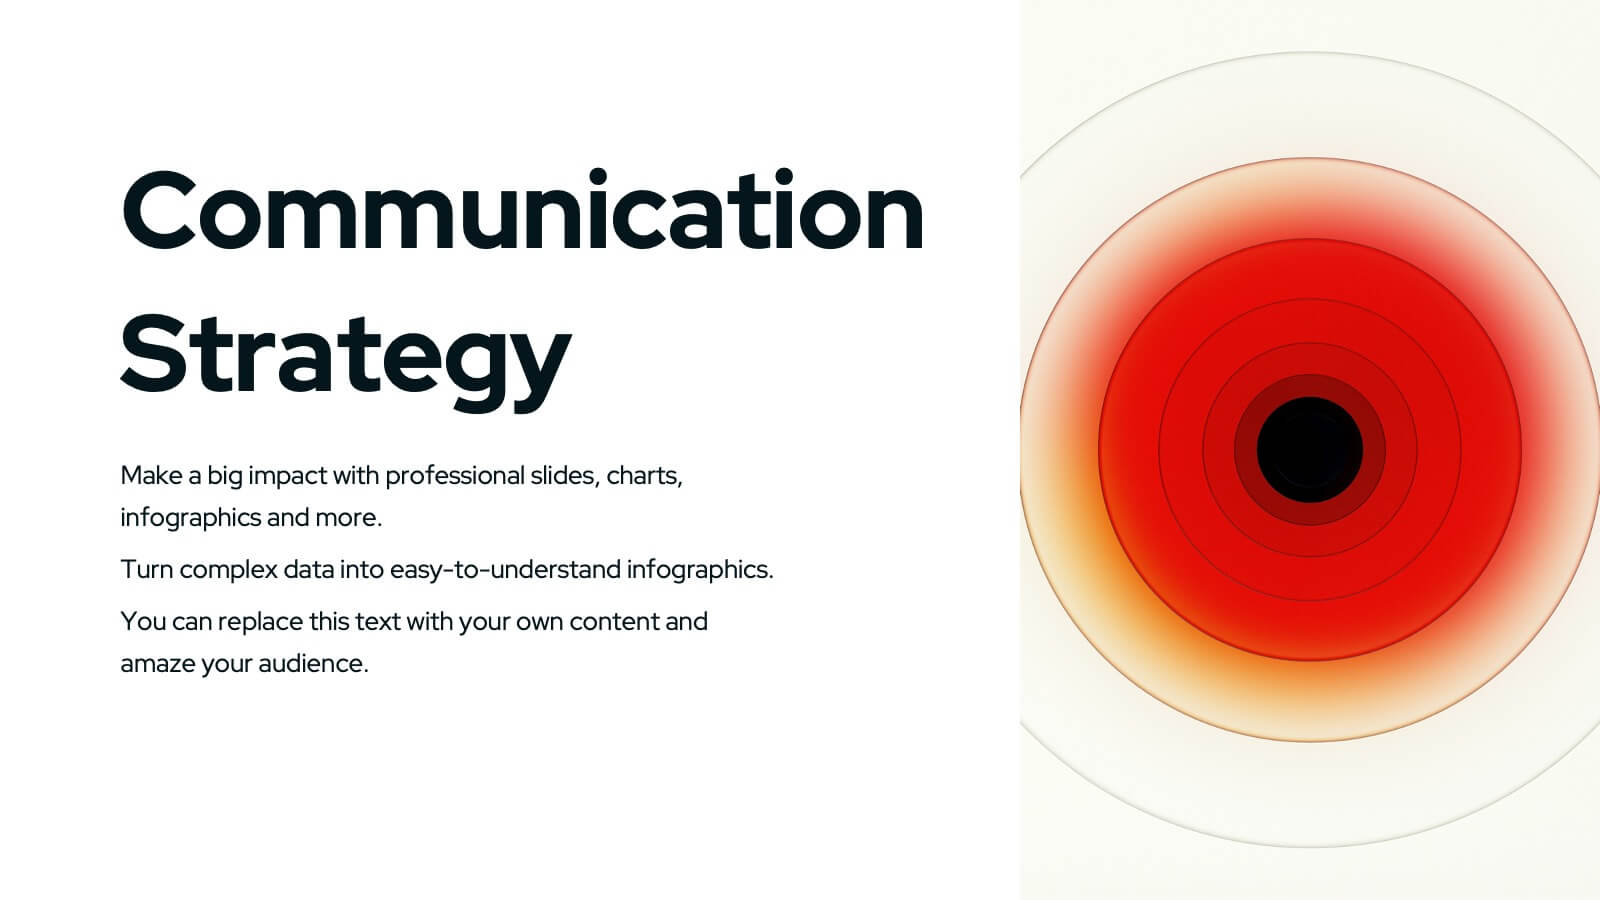
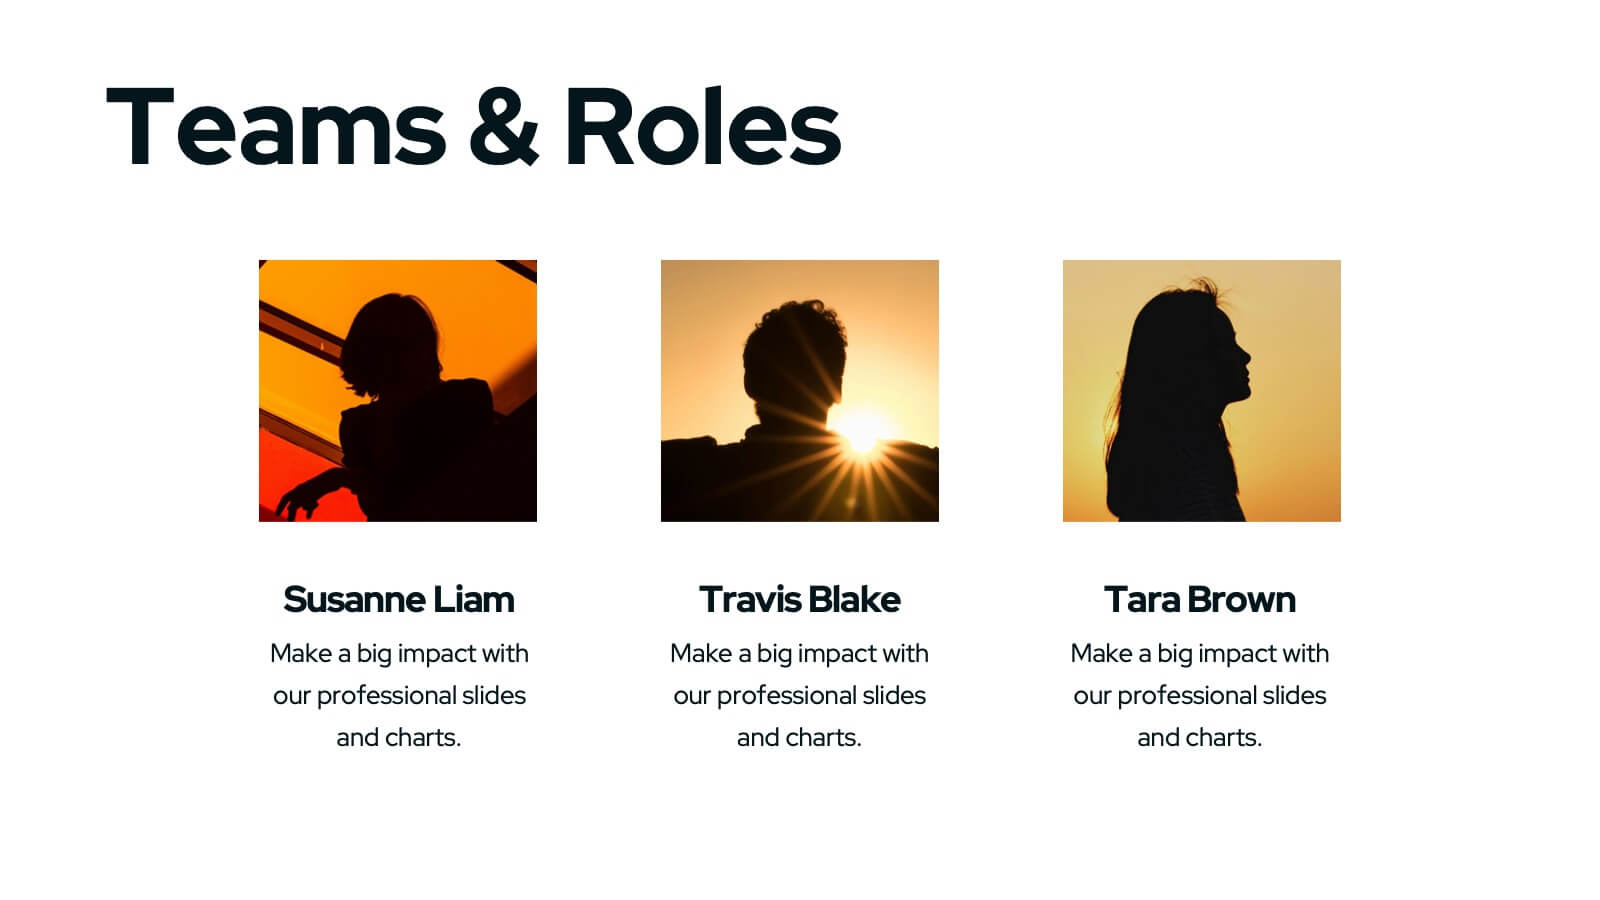
Wyrm Marketing Strategy Plan Presentation
Unleash the power of your marketing strategy with this bold and dynamic presentation template! Perfect for covering everything from landscape analysis and target audience identification to performance metrics and risk management. This template helps guide your audience through key challenges, SWOT analysis, and strategic initiatives with clarity and impact. Compatible with PowerPoint, Keynote, and Google Slides for effortless and engaging presentations.


5 diapositivas
Project Management Framework Presentation
Master the art of project management with our Project Management Framework template. This design is tailored to guide you through every phase of your project, ensuring a smooth and structured execution. The template is perfect for visually representing processes within PowerPoint, Keynote, and Google Slides, providing a clear pathway from project initiation to completion. Ideal for project managers looking to streamline their strategies and enhance project communication.


20 diapositivas
Mythion Business Idea Pitch Deck Presentation
Communicate your business vision with clarity and impact using this comprehensive pitch deck presentation template. Perfect for entrepreneurs, startups, and innovators, this template is designed to help you effectively present your idea to investors, stakeholders, or partners. Cover every essential aspect of your business journey with slides dedicated to the problem statement, solutions, market overview, and target audience. Showcase your business model, revenue projections, and unique selling proposition with visually appealing layouts. Highlight your marketing strategy, growth projections, and funding requirements to build a strong, persuasive case. Fully customizable and compatible with PowerPoint, Google Slides, and Keynote, this template allows you to tailor each slide to suit your business identity and goals. Whether you're pitching a new idea or seeking investment, this template ensures you present with professionalism and confidence.


20 diapositivas
Emerald Sales Forecast Presentation
Shine bright with this emerald-inspired presentation, perfect for sharing your sales forecast! Designed to showcase revenue projections, market trends, and sales strategies, this template keeps your data organized and visually impactful. Its vibrant, clean design ensures your forecast captures attention. Compatible with PowerPoint, Keynote, and Google Slides.


8 diapositivas
Interactive Digital Learning Experience Presentation
Make your content more engaging with the Interactive Digital Learning Experience Presentation. This layout blends quiz-style visuals and educational icons, helping you present learning modules, assessments, or training checkpoints in a fun and intuitive way. Use it to simplify information, boost audience interaction, or highlight multiple-choice content. Fully editable in Canva, PowerPoint, Keynote, and Google Slides.


5 diapositivas
Business Investment in Africa Map Presentation
Explore promising markets with the "Business Investment in Africa Map" template, designed to provide a visual overview of investment opportunities across the continent. It features a map with marked regions, each linked to specific data points about business prospects. Ideal for investors or companies looking at market penetration or expansion within Africa, this layout helps in making data-driven decisions by providing a clear, concise visual representation of key information.


7 diapositivas
Six Sigma Training Infographic
Six Sigma is a data-driven methodology and approach for eliminating defects and improving processes in any business. This is a bold, transformative tool designed to equip individuals and organizations with the prowess of Six Sigma methodology. This template is the roadmap to excellence, paving the way for achieving remarkable improvements and efficiency. Fully customizable and compatible with Powerpoint, Keynote, and Google Slides. Unleash the power of Six Sigma through our Six Sigma Training Infographic. Let this be your guide to mastering the art of perfection, driving transformative change, and marching boldly towards operational excellence.


4 diapositivas
Climate Change Impact Stages Presentation
The "Climate Change Impact Stages" presentation template is designed to effectively communicate the various aspects of climate change impacts on an organizational or global scale. It utilizes a straightforward tag design with letters A through D, where each tag can detail a specific area of impact or response strategy related to climate change. This visually appealing layout helps categorize information neatly, making it easier for the audience to follow along and understand the segmented data or proposals. Ideal for environmental seminars, corporate sustainability reports, or educational purposes, this template serves as a functional tool to highlight crucial information regarding climate change challenges and solutions.