


Características


¿Tienes alguna pregunta?
Recomendar


7 diapositivas
Customer Thank You Infographic
Elevate your expressions of gratitude with this sophisticated collection, designed to blend elegance with heartfelt thanks. Each piece in this set is crafted with meticulous attention to detail, featuring a mix of subtle color palettes, elegant typography, and beautifully arranged visual elements to enhance the sincerity of your message. Choose from a variety of designs, ranging from minimalist to more richly layered compositions, each providing a unique way to communicate appreciation. These designs can be customized to suit any occasion, making them perfect for expressing professional thanks to clients, customers, or partners. Ideal for use across both digital and physical mediums, this collection helps ensure that your messages not only convey thanks but also resonate deeply with recipients, strengthening relationships and leaving a memorable impression.


5 diapositivas
Office Collaboration Illustration Pack Presentation
Visualize modern teamwork with this sleek office collaboration layout. Ideal for showcasing brainstorming sessions, decision-making flows, or team communication, this illustration-driven template is perfect for business updates, internal strategy briefs, or workflow discussions. Fully editable and compatible with PowerPoint, Keynote, and Google Slides.


8 diapositivas
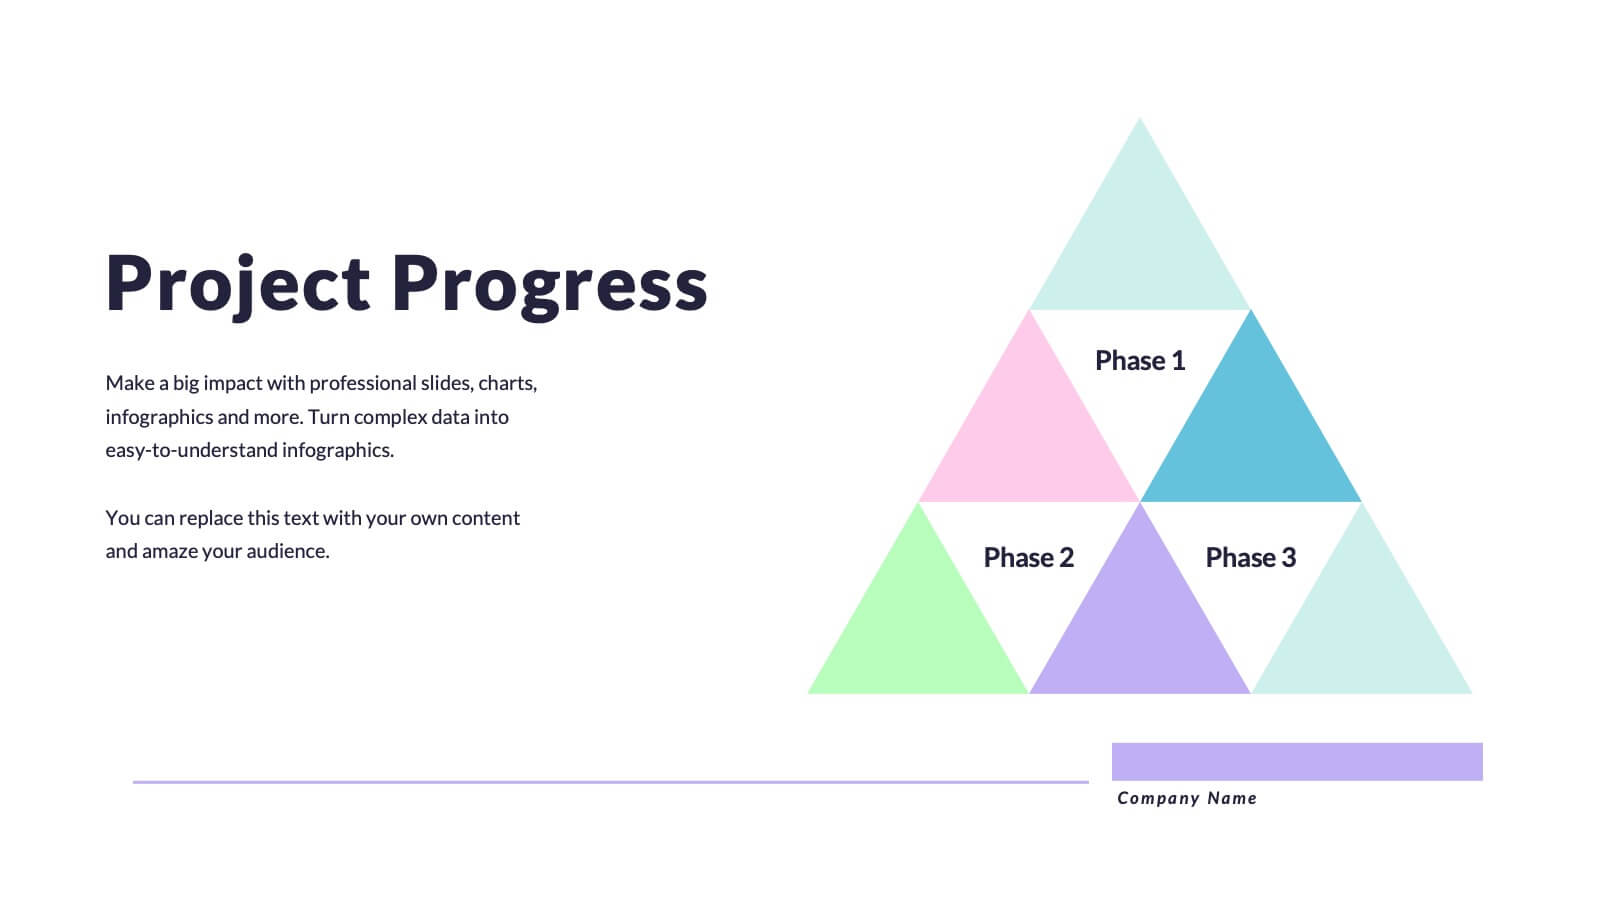
Governance and Compliance Framework
Streamline your compliance reporting with this triangle-based governance framework slide. Featuring three core pillars—Risk, Strategy, and Leadership—this layout visually connects your organizational roles, responsibilities, and regulatory measures. Each corner is paired with numbered titles and editable icons, perfect for illustrating audits, policies, or internal controls. Fully editable in PowerPoint, Keynote, and Google Slides.


5 diapositivas
Process Flow Infographics
Streamline your pathway to success with our process flow infographics template. Utilizing a professional gray palette accented with colorful highlights, this creative vertical design is tailored for clarity and impact. Ideal for business strategists and process engineers, this template assists in illustrating step-by-step progressions or workflows in an engaging manner. It's perfect for those who need to communicate processes effectively, ensuring every phase is visually represented and easy to understand. This template comes equipped with innovative graphics, diverse icons, and dedicated spaces for images, making your data presentation a smooth, navigable experience.


4 diapositivas
Cost Analysis and Budget Overview Presentation
Break down financial details with clarity using the Cost Analysis and Budget Overview Presentation. This slide helps you present cost structures, budget allocations, and key financial metrics side by side using icons and visual data blocks. Perfect for reports, planning, or investment decks. Fully editable in PowerPoint, Google Slides, Keynote, and Canva.


5 diapositivas
Poaching Facts Infographics
Poaching refers to the illegal hunting, capturing, or killing of wildlife, typically for profit or personal gain. These compelling and informative infographic templates are designed to shed light on the issue of poaching and its impact on wildlife and ecosystems. They present key facts, statistics, and illustrations to raise awareness about the seriousness of poaching and the need for conservation efforts. By increasing awareness and understanding of the poaching crisis, these templates contribute to the collective efforts in protecting our precious wildlife and preserving the natural world.


6 diapositivas
Tactical Planning for Clear Objectives Presentation
Break down your action plan with this Tactical Planning for Clear Objectives slide. Using a simple A–E step structure paired with a lightbulb visual, this layout helps present business goals or strategy stages clearly and engagingly. Easily customize it in PowerPoint, Google Slides, or Canva to fit your content.


6 diapositivas
Future Trends in Tech Presentation
Forecast innovation with clarity using this Future Trends in Tech Presentation. Designed with a modern silhouette head and brain visualization, this slide emphasizes key trend comparisons using icon-labeled callouts and bold percentage highlights. Ideal for tech forecasting, AI adoption, or market prediction topics. Fully editable in PowerPoint, Keynote, and Google Slides—available in both light and dark modes.


5 diapositivas
Big Data Analytics Slide Presentation
Bring your insights to life with a clean, modern slide that transforms complex information into a simple visual journey. This layout helps you explain key data points, trends, and analytical steps with clarity and ease, making your message instantly understandable. Compatible with PowerPoint, Keynote, and Google Slides.


26 diapositivas
Business Ethics and Compliance Presentation
Navigate the crucial topics of business ethics and compliance with this professionally designed presentation template. The clean, corporate aesthetic, dominated by a palette of cool blues and grays, underscores the importance of transparency and integrity in the business world. Ideal for corporate trainers, compliance officers, or business consultants, the template offers a structured approach to discussing ethical practices and regulatory standards. With a mix of charts, diagrams, and bullet points, it allows for detailed explanations of policies, case studies of ethical dilemmas, and the benefits of compliance. Each slide is a step towards building a culture of trust and accountability within an organization, making it a key resource for any business-focused presentation. Adapted for use across PowerPoint, Keynote, and Google Slides, it's crafted to facilitate a clear and impactful delivery of essential business principles.


6 diapositivas
Economic Trends in Africa Map Presentation
The Economic Trends in Africa Map template visually presents economic data across Africa. It displays regional economic shifts and trends, using an interactive map and related graphs. Ideal for analysts and investors, it offers clear insights for strategic decisions. Compatible with PowerPoint, Keynote, and Google Slides.


22 diapositivas
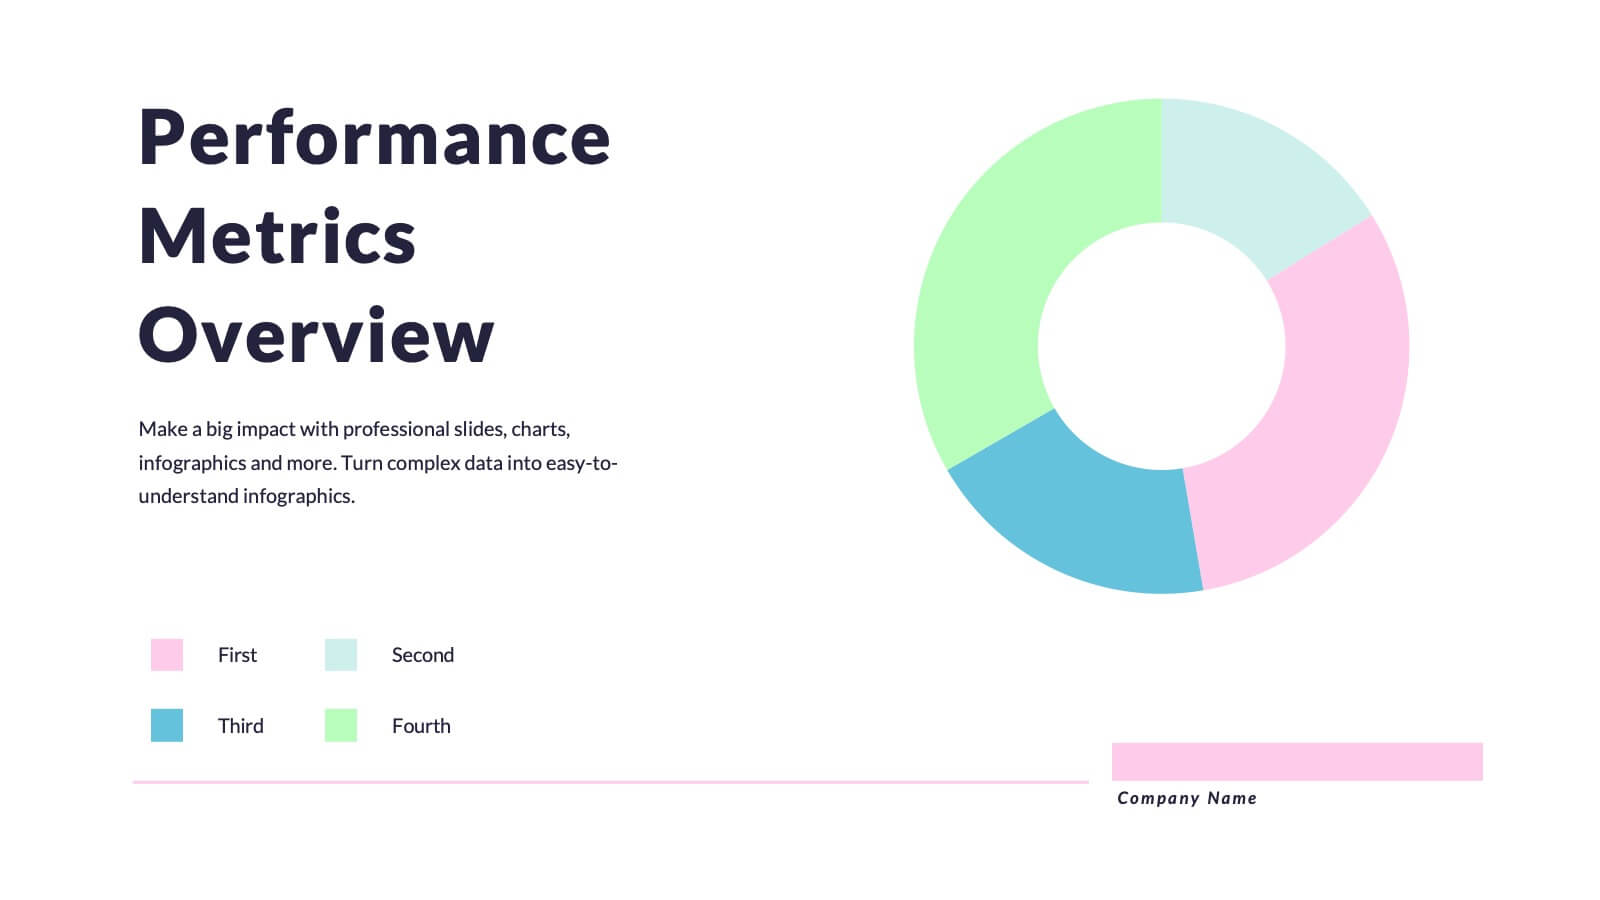
Quantum Research Findings Report Presentation
Discover insights like never before with this vibrant presentation template! Perfect for showcasing research findings, it includes slides for key findings, performance metrics, and market trends. Clearly present data and engage your audience with visually appealing graphics. Compatible with PowerPoint, Keynote, and Google Slides, making it easy to use on any platform.


7 diapositivas
Alphabet Letters Infographic
An alphabet infographic is a visual representation or graphic that presents information related to the alphabet, often used for educational purposes or to convey information in a creative and engaging manner. Get ready to embark on a joyful journey through the wonderland of letters and words with our alphabet letters infographic. This infographic template includes various elements like letters, words, examples, pronunciation guides, or related images. This is more than just an infographic—it's a vibrant celebration of language, learning, and pure happiness. Dive into the kaleidoscope of alphabets and spread the cheer!


7 diapositivas
Subsistence Agriculture Infographic
Bring the essence of sustainability to your presentations with our Subsistence Agriculture infographic, designed for seamless integration with Powerpoint, Keynote, and Google Slides. This infographic is perfect for educators, agricultural professionals, and sustainability advocates who need to convey the importance of self-sufficient farming practices and their impact on local communities. Our Subsistence Agriculture infographic illustrates the fundamentals of agriculture that relies on the self-production of food by individuals and small communities. It highlights how this method supports sustainability, food security, and ecological balance. The visually engaging elements emphasize traditional farming techniques, crop diversity, and the role of agriculture in rural livelihoods. By incorporating this infographic into your presentations, you present a compelling narrative on the significance of subsistence farming in today's world. It not only educates your audience on the basics but also inspires discussions on the broader implications for global food systems. Use this infographic to effectively communicate the value of subsistence agriculture in maintaining community resilience and environmental stewardship.


26 diapositivas
Warm Tones Real Estate Presentation
Create an engaging and inviting Warm Tone Real Estate presentation with this easy to use template. The color scheme of this welcoming template features warm tones to set the mood for a peaceful, natural environment. The cover slide features emerald green and brown, while the next two slides use warmer brown, tan shades, keeping the same theme going. Fully customizable, this template is ready to help you sell and promote properties quickly and easily. This layout is perfect for showcasing properties with a premium feel that’ll inspire confidence in both buyers and sellers alike.


5 diapositivas
Movie Ages and Eras Infographics
Movies can be categorized into different ages and eras based on various factors such as technological advancements, storytelling techniques, cultural influences, and industry trends. This infographic template explores the different ages and eras in the history of cinema. It provides an overview of significant periods and movements in filmmaking, allowing viewers to understand the evolution and impact of movies over time. This template is perfect for film enthusiasts, students of film studies, or anyone interested in exploring the history and evolution of cinema. Compatible with Powerpoint, Keynote, and Google Slides.


5 diapositivas
Customer Behavior Pathway Visualization Presentation
Illustrate each step in the decision-making journey with this Customer Behavior Pathway Visualization presentation. Designed with directional arrows and dotted flow markers, this slide helps you map behavioral patterns across key stages—from awareness to loyalty. Ideal for sales, marketing, or UX teams. Fully editable in PowerPoint, Canva, and Google Slides.