


Características


¿Tienes alguna pregunta?
Recomendar


5 diapositivas
5-Level Smile Rating Presentation
Give your audience a fun, visual way to understand sentiment with this colorful rating slide. Perfect for feedback summaries, project reviews, or performance insights, it displays five clear emotion levels in a simple, engaging format. Easy to customize and fully compatible with PowerPoint, Keynote, and Google Slides.


4 diapositivas
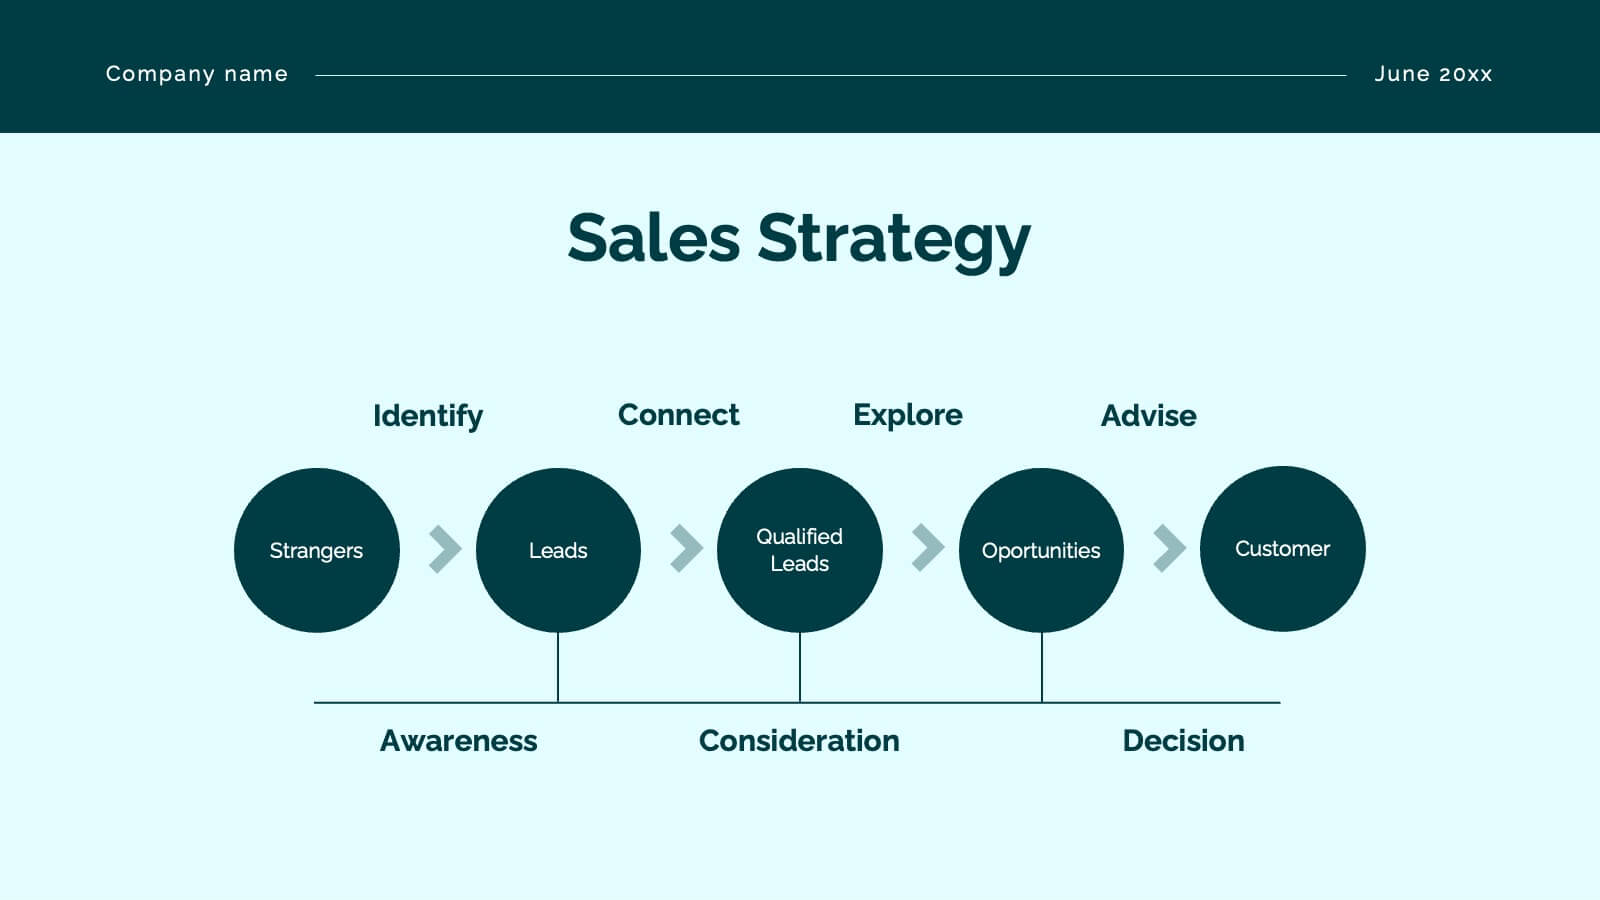
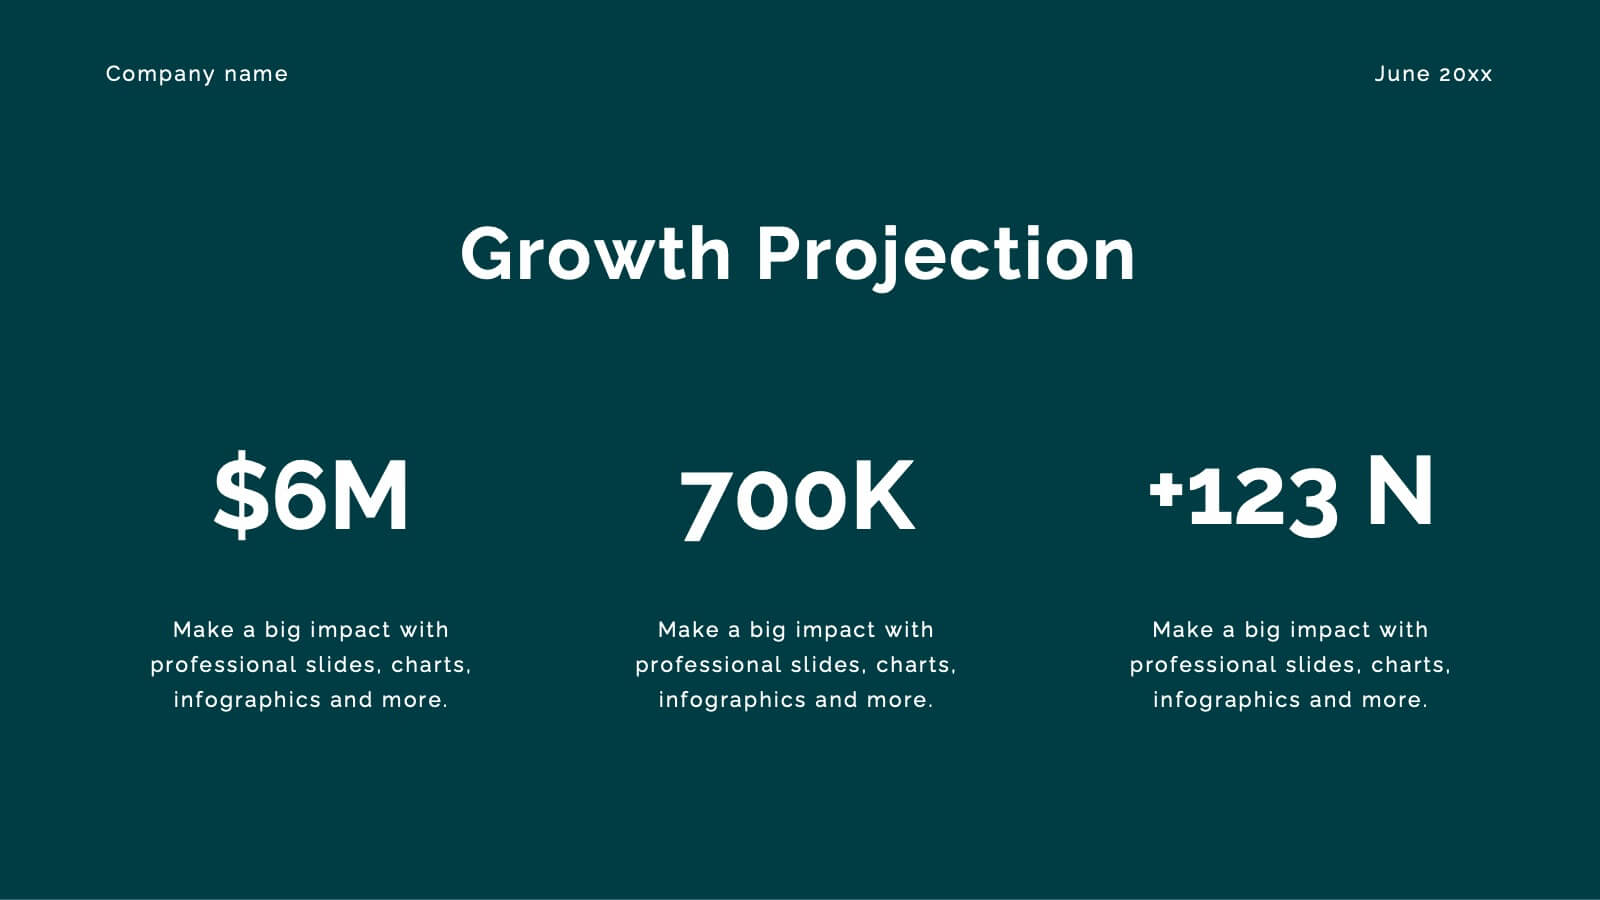
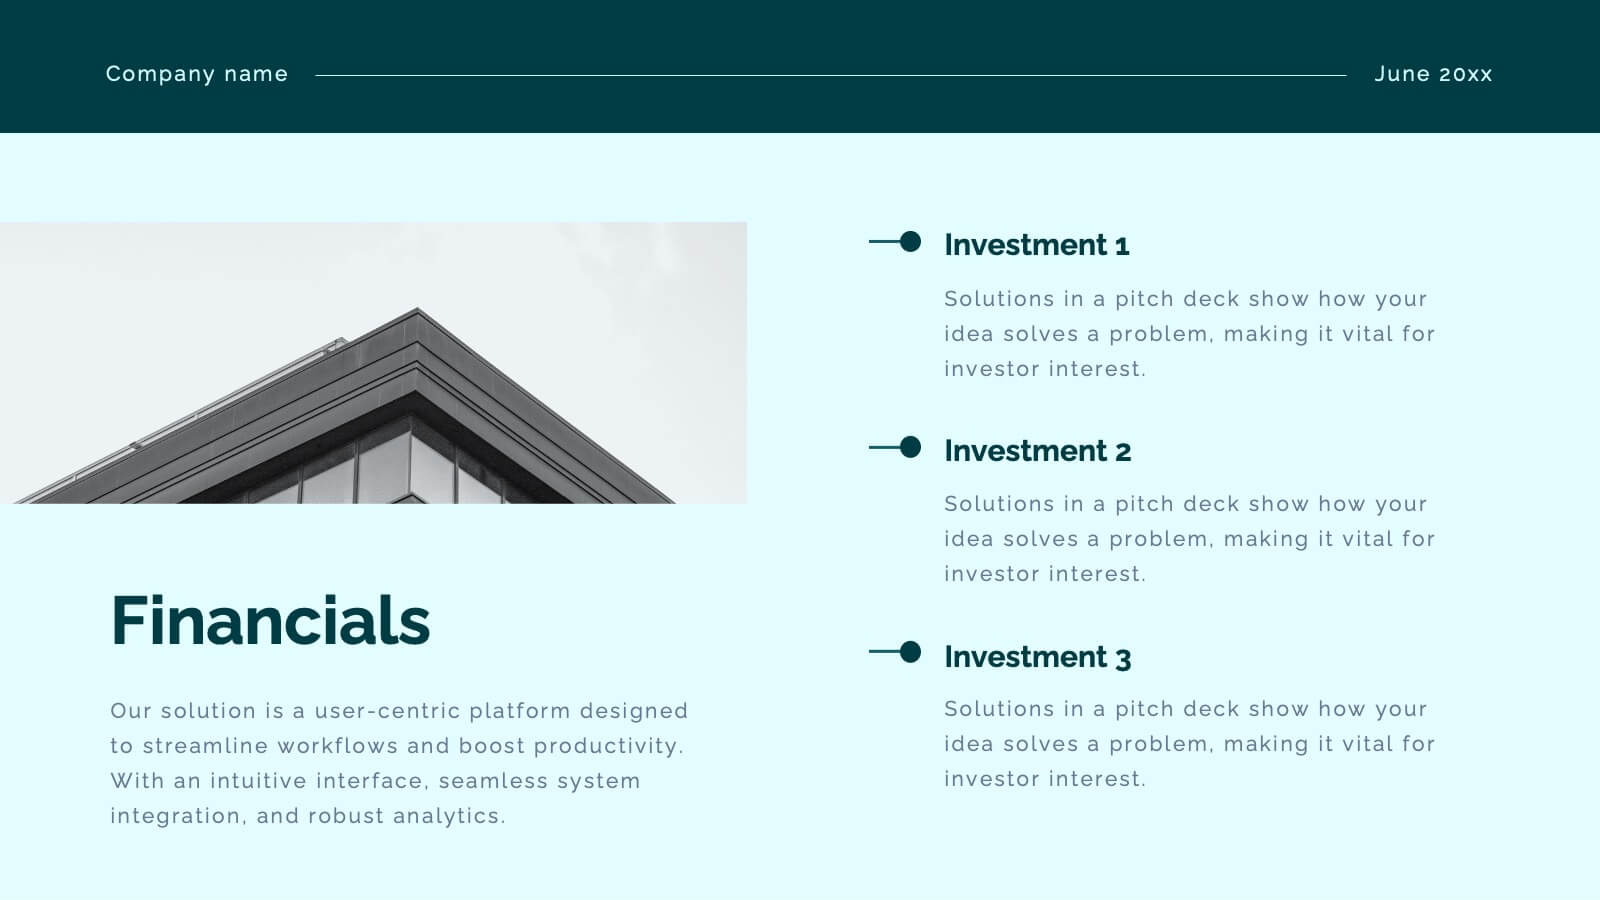
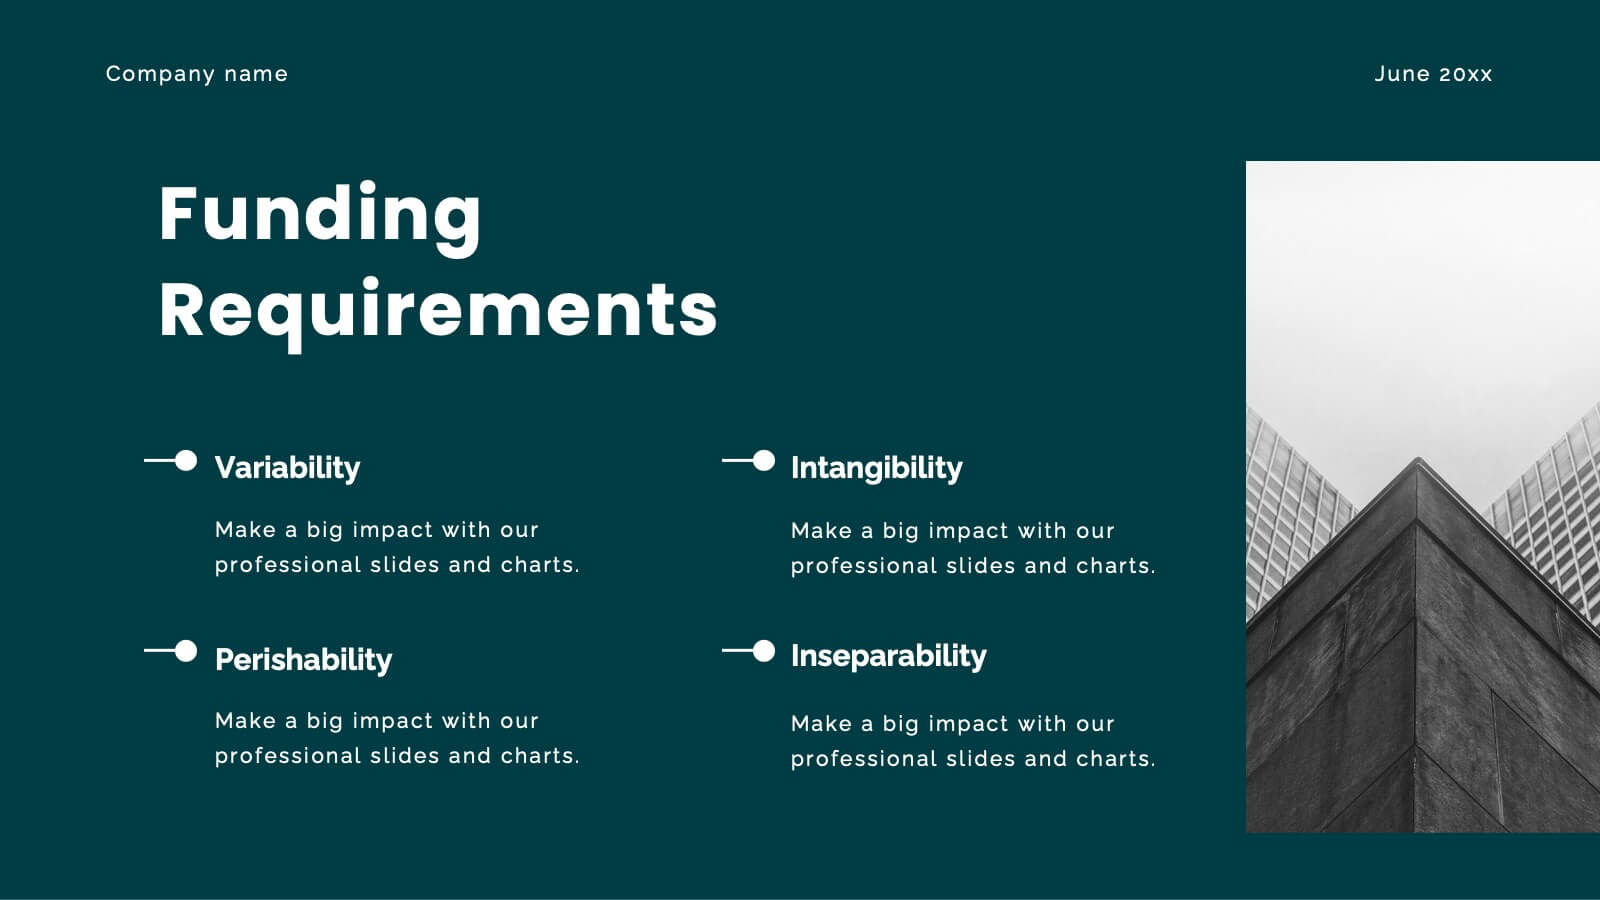
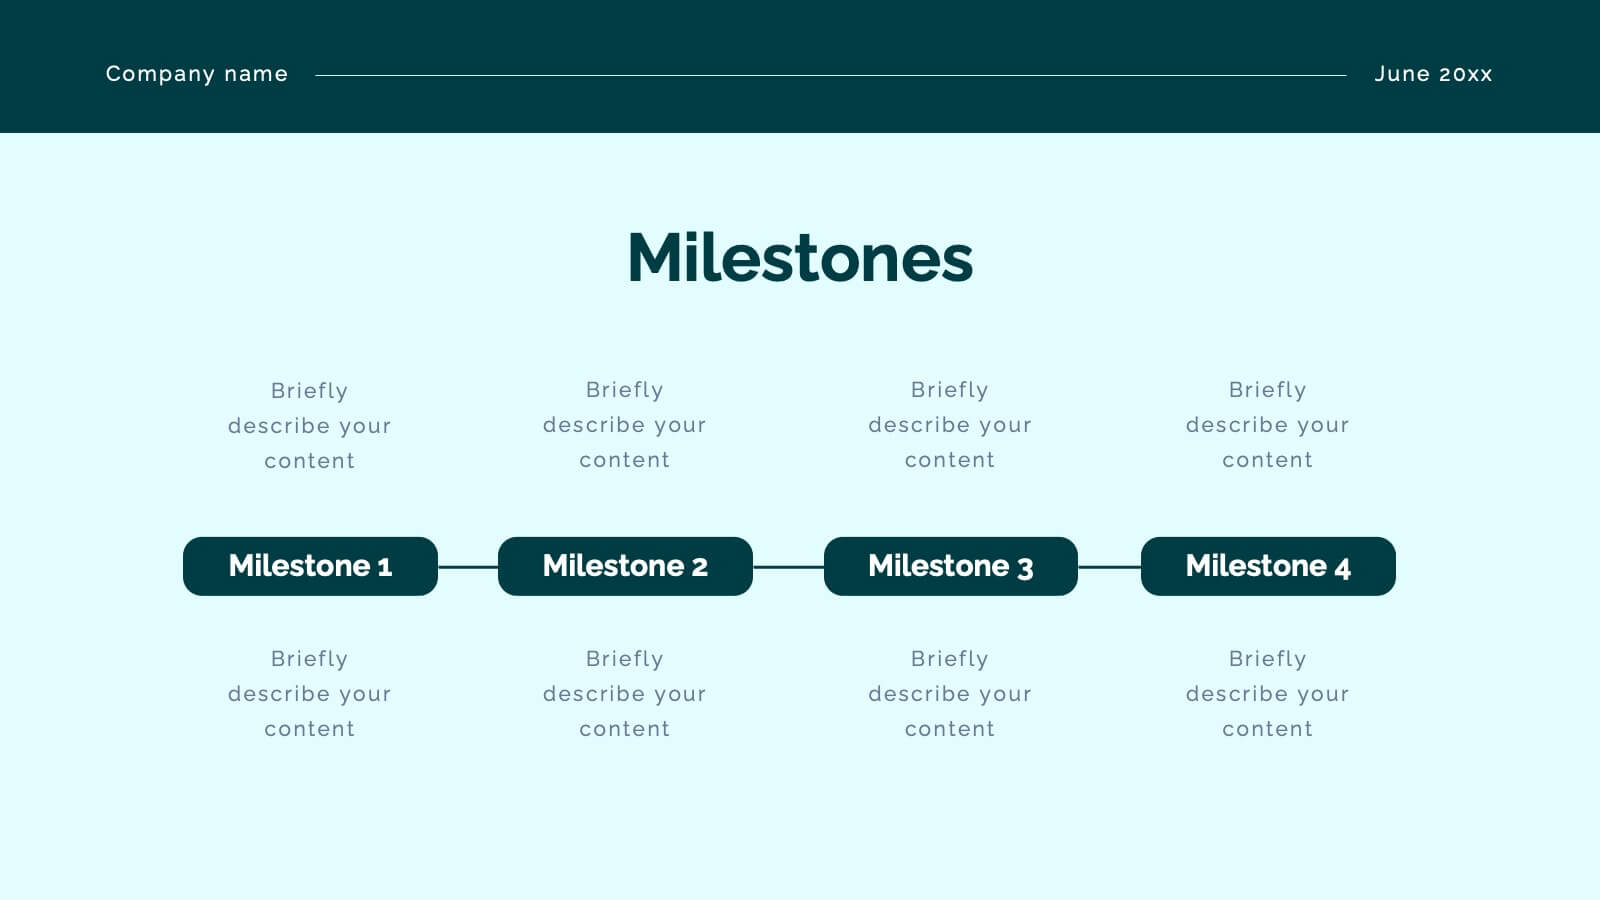
Funding and Investment Project Proposal Presentation
Unlock the potential of your next big venture with this vibrant and organized infographic presentation template! Perfect for outlining key stages from research to returns, this template makes complex investment strategies accessible and engaging. Tailor each segment to fit your project's unique needs. Compatible with PowerPoint, Keynote, and Google Slides, it's ideal for professionals looking to impress stakeholders and secure funding.


26 diapositivas
Aedele Presentation Template
We all know how important food is, it's the center of life. We plan our days around food, we travel to eat food and our emotions are often tied up in food. This template was designed for people who love food and know how important it is to stand out from the crowd when it comes to the culinary world. Whether you're an investor, a food critique, a restaurant owner or simply a foodie we have all the classy modern slides you need to really make an impact on your audience and make sure your message doesn't get lost amongst all the other exciting talks and presentations at your next pitch meeting.


2 diapositivas
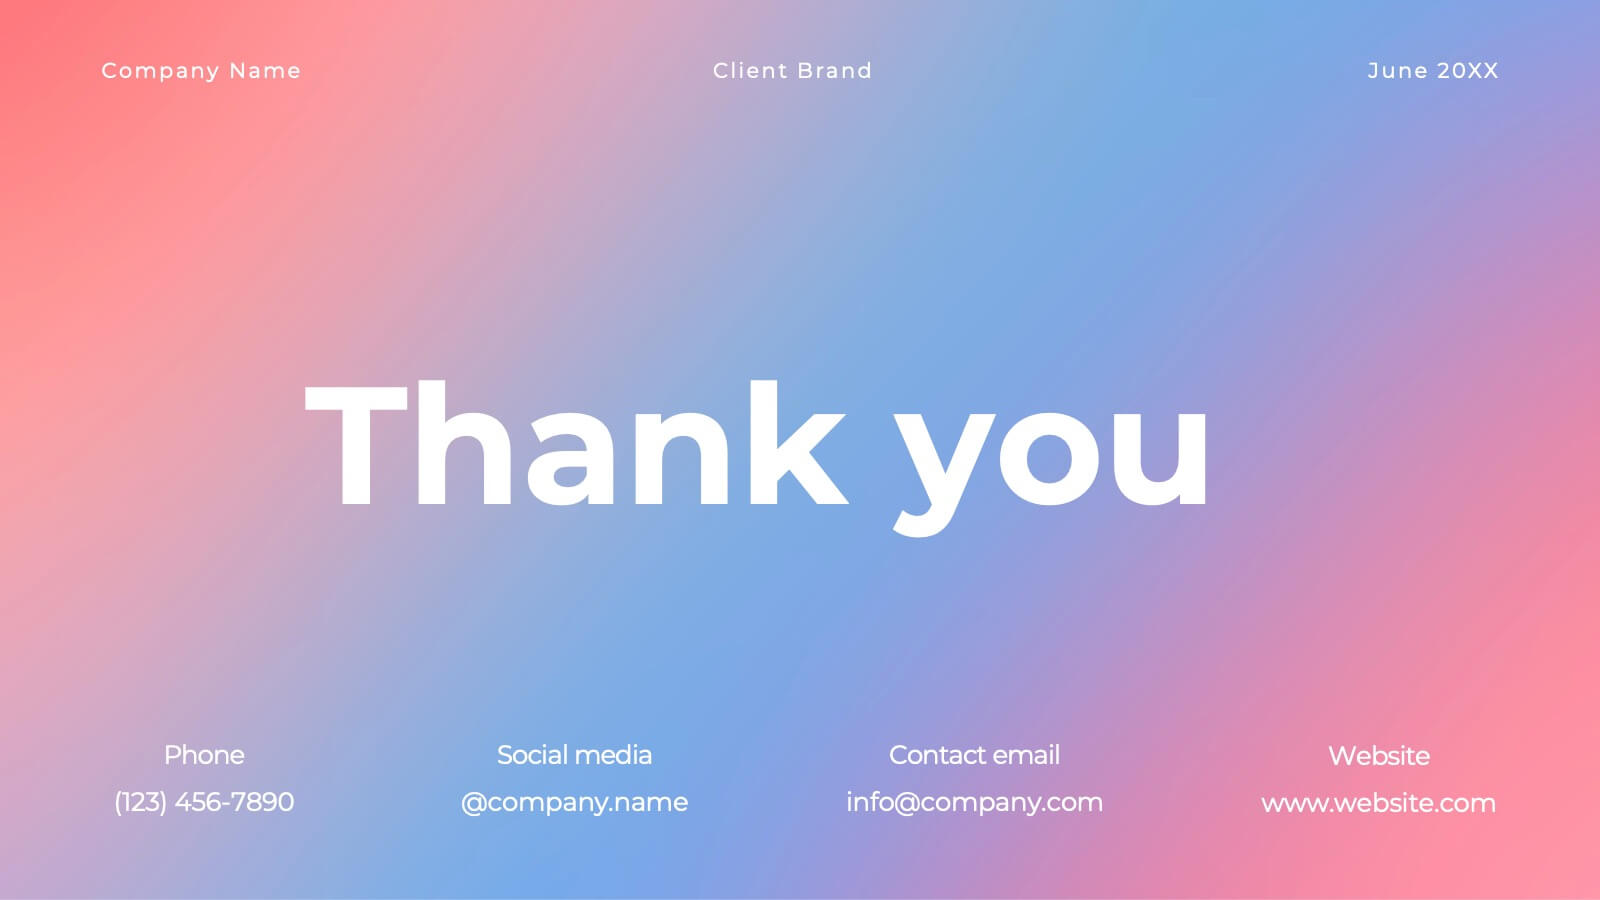
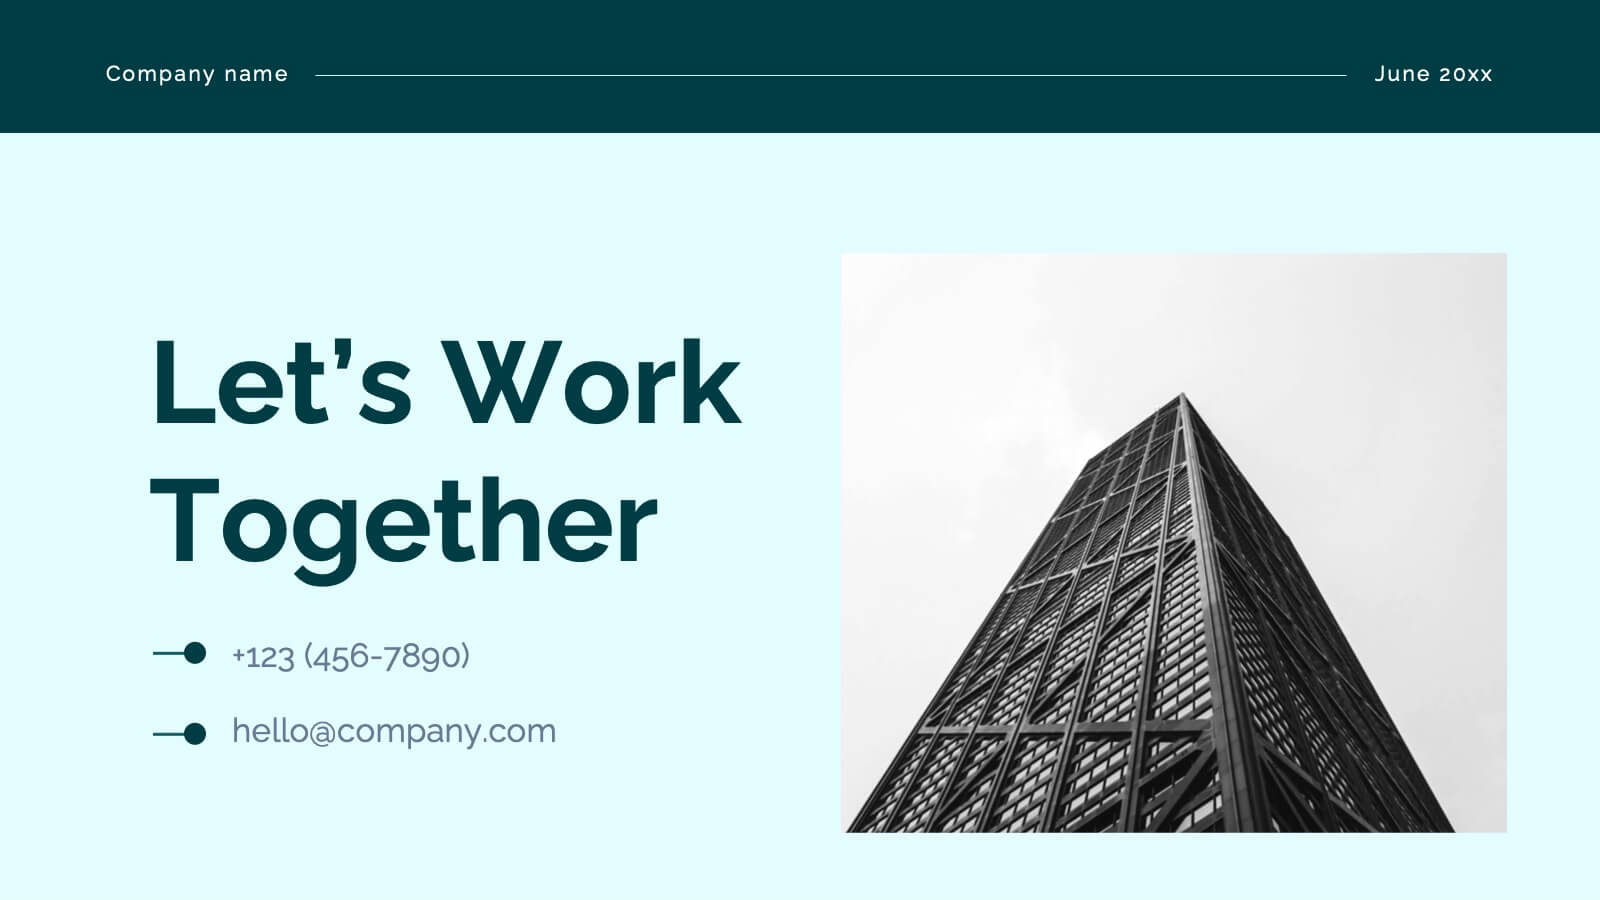
Creative Gratitude Slide
Wrap up your presentation with impact using this clean, modern “Thank You” slide. Featuring space for a photo, contact details, and playful design elements, it's perfect for leaving a lasting impression. Ideal for business proposals, pitch decks, and educational slide decks. Fully editable in PowerPoint, Keynote, and Google Slides.


6 diapositivas
Real Estate Housing Solutions Presentation
Present property features and real estate plans with this creative multi-level housing diagram. Designed for agents, developers, or housing consultants, this layout clearly segments space usage or service offerings. Fully customizable in PowerPoint, Keynote, and Google Slides—perfect for showcasing floor plans, room functions, or housing solutions with vibrant clarity.


6 diapositivas
Pillar Foundation Infographics
Gain insights into Pillar Foundation construction with our customizable infographic template. This template is fully compatible with popular presentation software like PowerPoint, Keynote, and Google Slides, allowing you to easily customize it to illustrate and communicate the key aspects and principles of pillar foundation construction. The Pillar Foundation infographic template offers a visually engaging platform to explore and explain the construction process, types of pillars, materials used, and the significance of pillars in building stability. Whether you're a construction professional, architect, engineer, or simply interested in construction techniques, this template provides a user-friendly canvas to create informative presentations and educational materials. Deepen your knowledge of Pillar Foundation construction with this SEO-optimized infographic template, thoughtfully designed for clarity and ease of use. Customize it to showcase foundation types, construction steps, reinforcement methods, and the role of pillars in supporting structures, ensuring that your audience gains valuable insights into this crucial aspect of construction. Start crafting your personalized infographic today to delve into the world of Pillar Foundation construction.


10 diapositivas
Healthcare Innovations in Medicine Presentation
Showcase groundbreaking advancements with the Healthcare Innovations in Medicine Presentation template. Designed to highlight medical breakthroughs, research developments, and technological advancements, this visually appealing layout is ideal for healthcare professionals, researchers, and medical institutions. Fully customizable and compatible with PowerPoint, Keynote, and Google Slides, this template ensures your presentation is clear, engaging, and impactful.


10 diapositivas
Brainstorming and Creative Idea Generation Presentation
Unlock Brainstorming and Creative Idea Generation with this visually engaging template designed to help teams capture, refine, and present ideas effectively. Featuring gear-themed graphics, color-coded sections, and structured placeholders, this template is ideal for workshops, innovation meetings, and design thinking sessions. Fully customizable and compatible with PowerPoint, Keynote, and Google Slides, ensuring seamless integration into your workflow.


5 diapositivas
Digital Marketing Strategy Infographics
A digital marketing strategy refers to a plan of action that businesses or organizations develop to achieve their marketing goals using digital channels and technologies. These vertical infographics outline the key elements of a successful digital marketing strategy. They are designed for marketers, business owners, and individuals seeking to understand and implement effective digital marketing practices. Guide your audience through the process of defining specific objectives, such as increasing website traffic, improving lead generation, or enhancing brand awareness. These can cover strategies and leverage social media analytics.


8 diapositivas
Construction Project Planning Presentation
Streamline project timelines with the Construction Project Planning template. This visually structured design helps organize key phases, tasks, and milestones for efficient workflow management. Ideal for project managers and construction professionals, it enhances clarity in presentations. Fully customizable and compatible with PowerPoint, Keynote, and Google Slides for seamless integration.


7 diapositivas
Credit Card Infographic Presentation Template
A Credit card Infographic is a stacked chart showing data visualization of credit card types and associated information, including the number of cards owned by different age groups and gender, as well as overall debt. This infographic allows you to cover the ins and outs of credit cards, from rewards to fees and interest rates. This template will help you understand how credit cards work, while comparing cards based on price and other important factors. This Infographic is the perfect way to visualize data, trends and facts in an engaging way that grabs attention and keeps people reading.


6 diapositivas
Effective Communication Infographics
Master the art of Effective Communication with our customizable infographic template. This template is fully compatible with popular presentation software like PowerPoint, Keynote, and Google Slides, allowing you to easily customize it to illustrate and communicate various aspects of effective communication. The Effective Communication infographic template offers a visually engaging platform to outline the principles, strategies, and skills needed to communicate effectively in various contexts, whether it's in business, personal relationships, or public speaking. Whether you're a professional communicator, leader, or someone looking to improve their communication skills, this template provides a user-friendly canvas to create informative presentations and educational materials. Optimize your communication skills with this SEO-optimized Effective Communication infographic template, thoughtfully designed for clarity and ease of use. Customize it to showcase the importance of active listening, nonverbal communication, effective messaging, and overcoming communication barriers, ensuring that your audience gains valuable insights into this essential skill. Start crafting your personalized infographic today to become a more proficient and confident communicator.
23 diapositivas
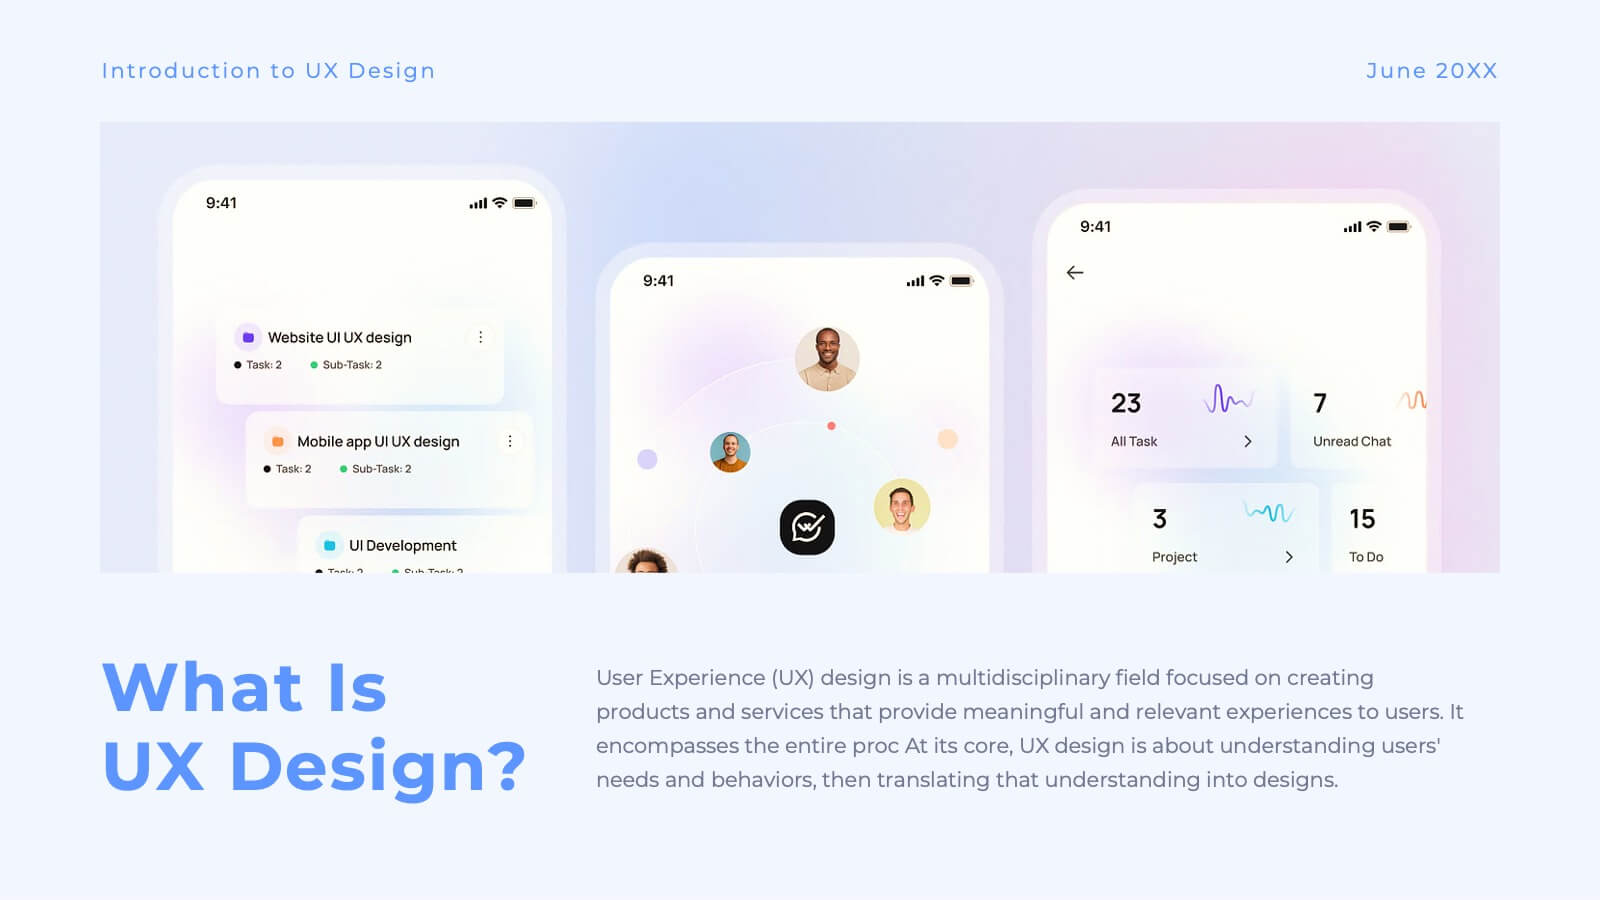
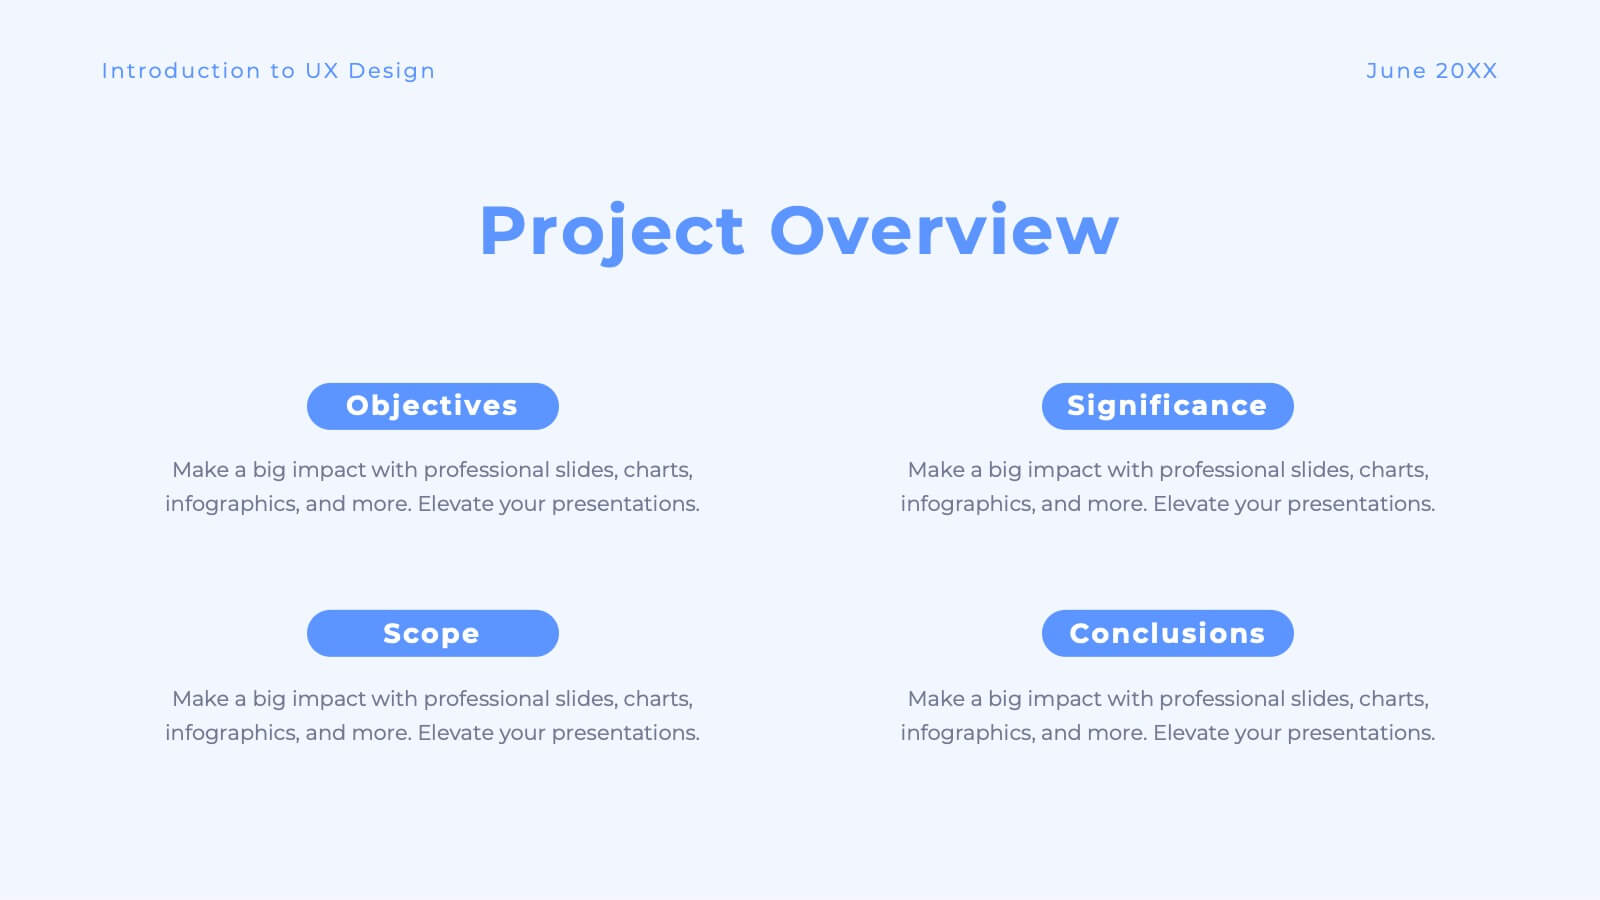
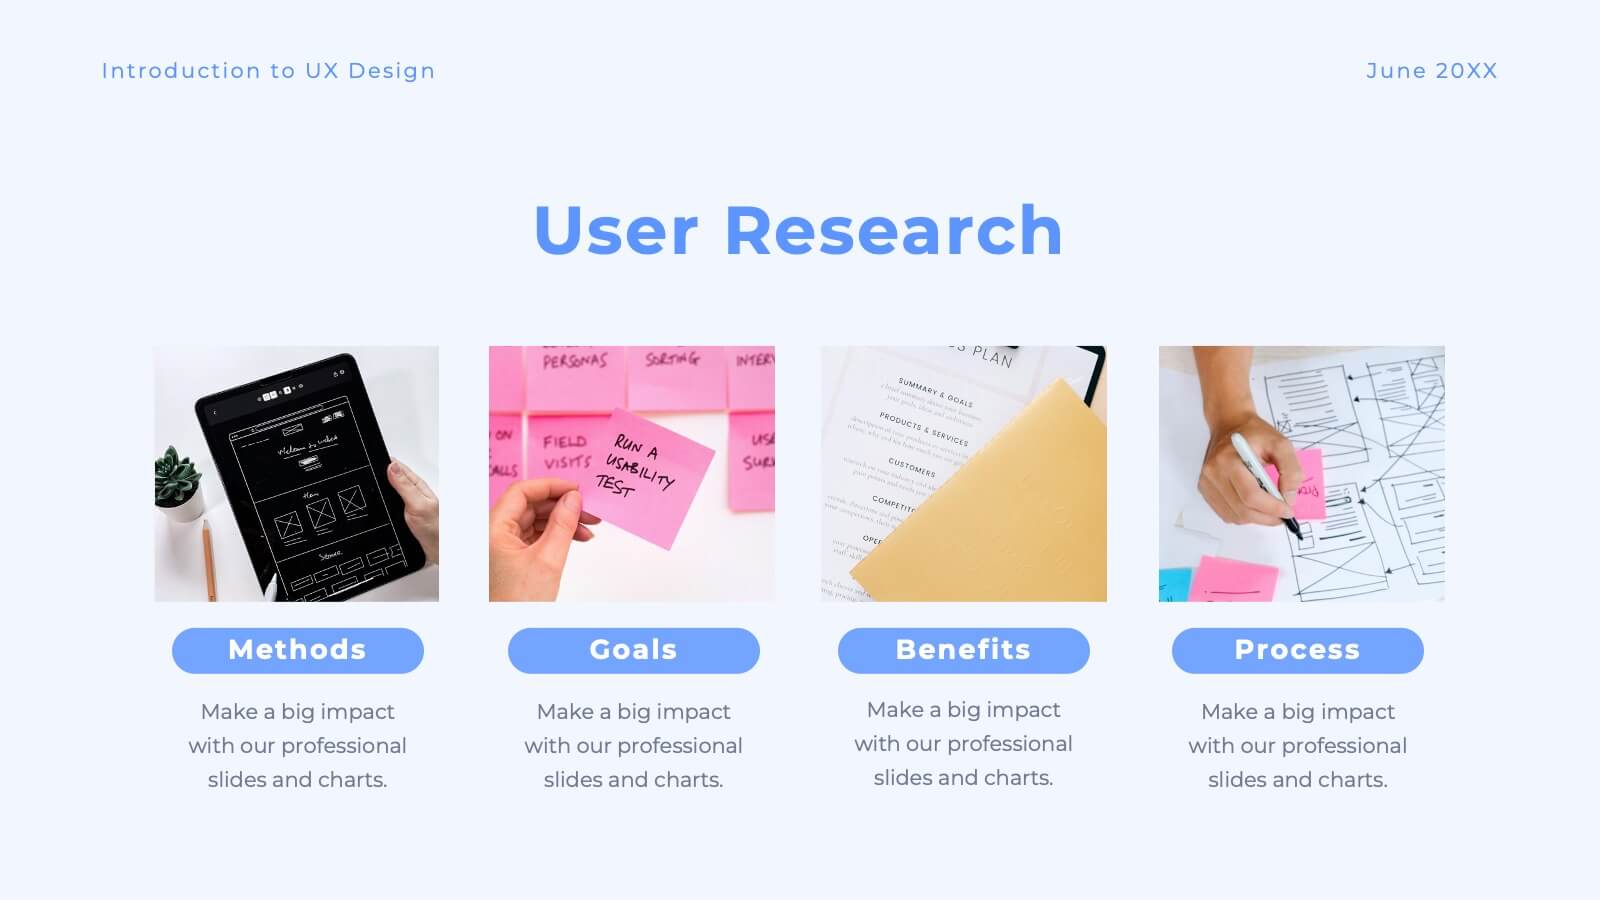
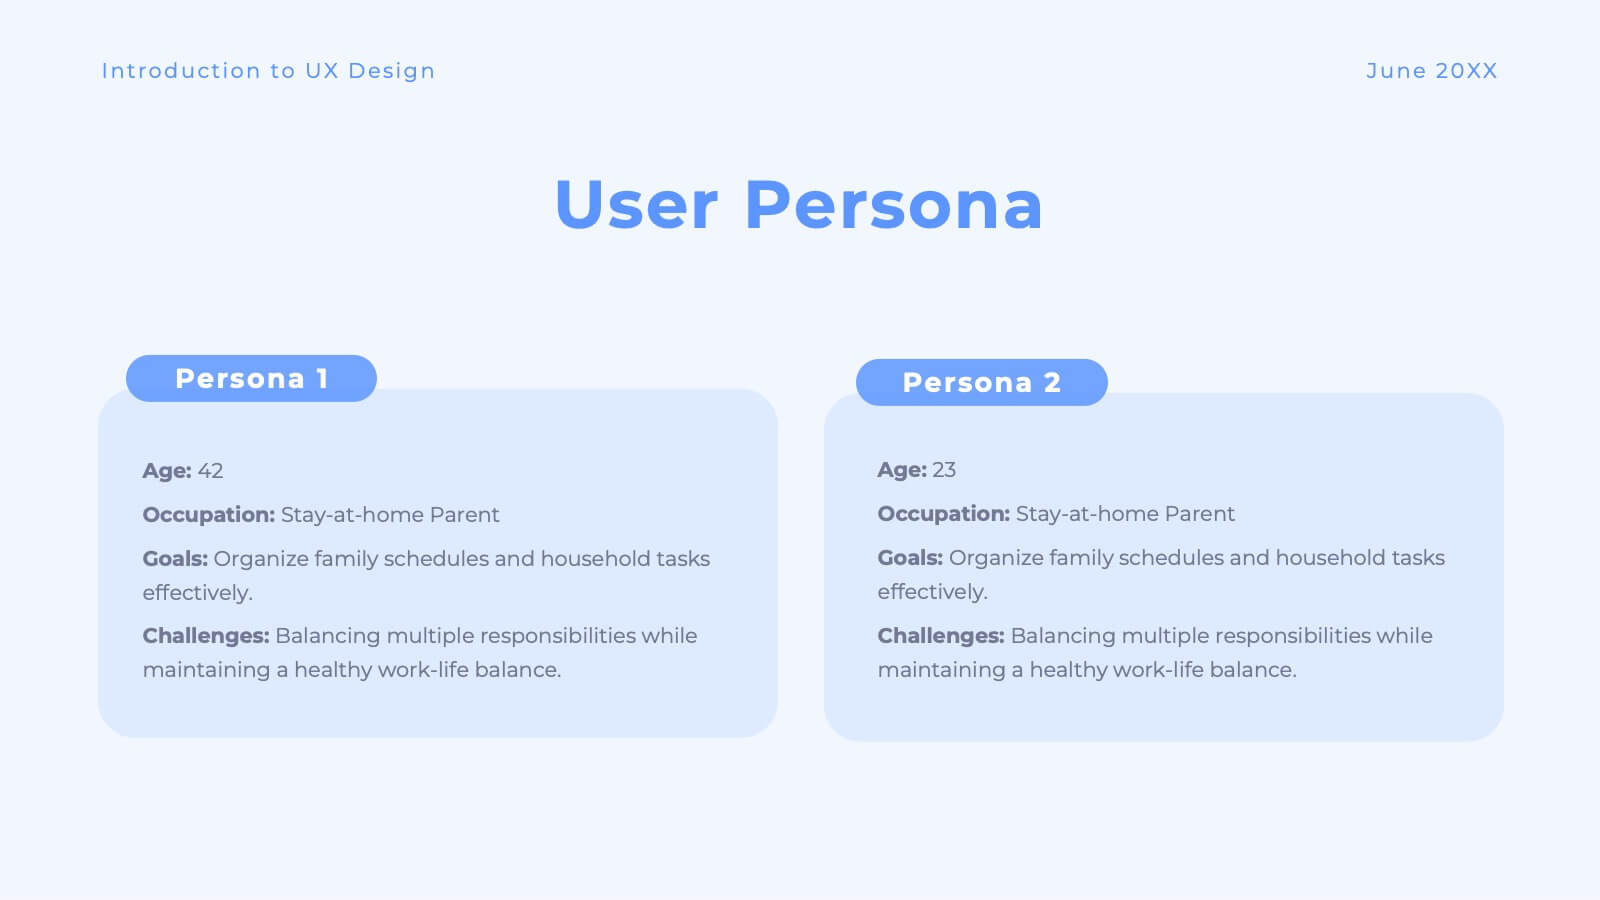
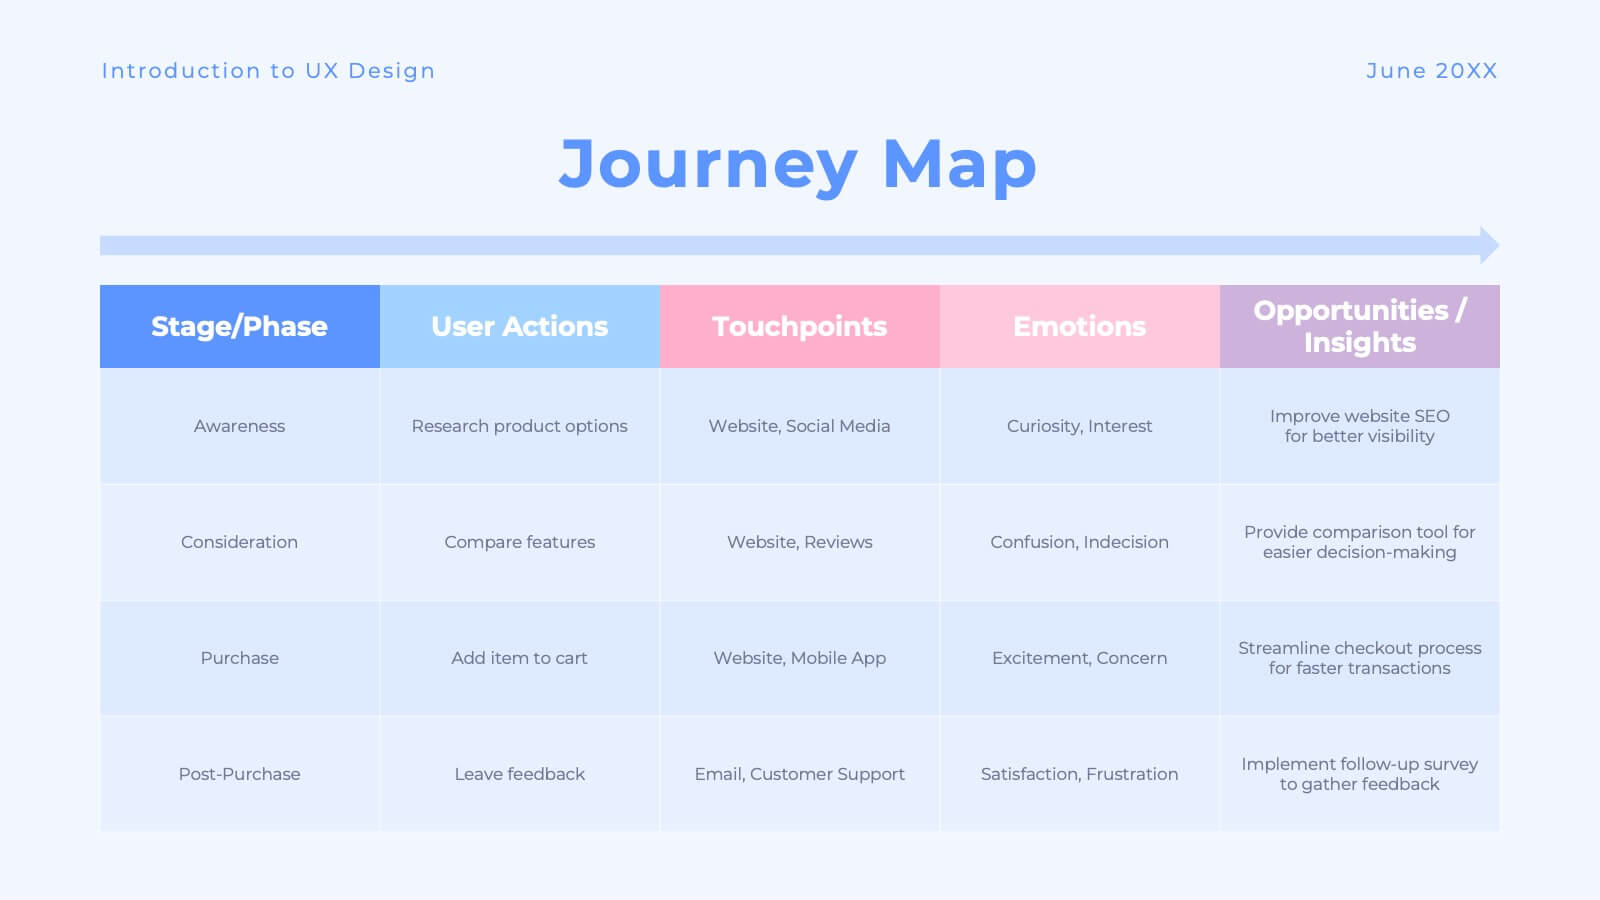
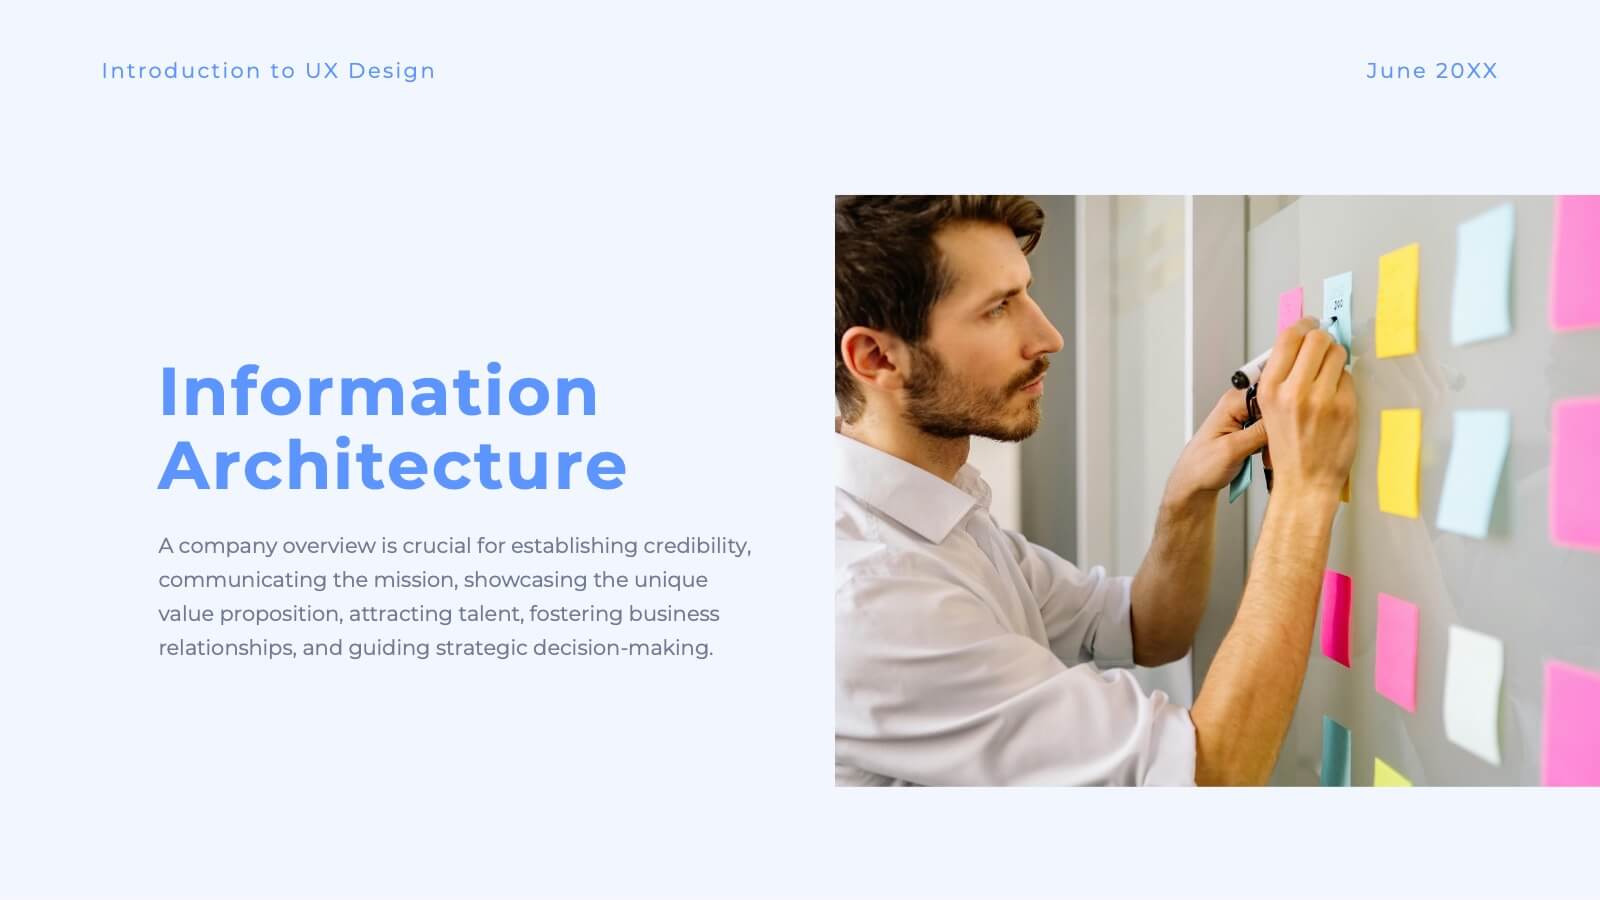
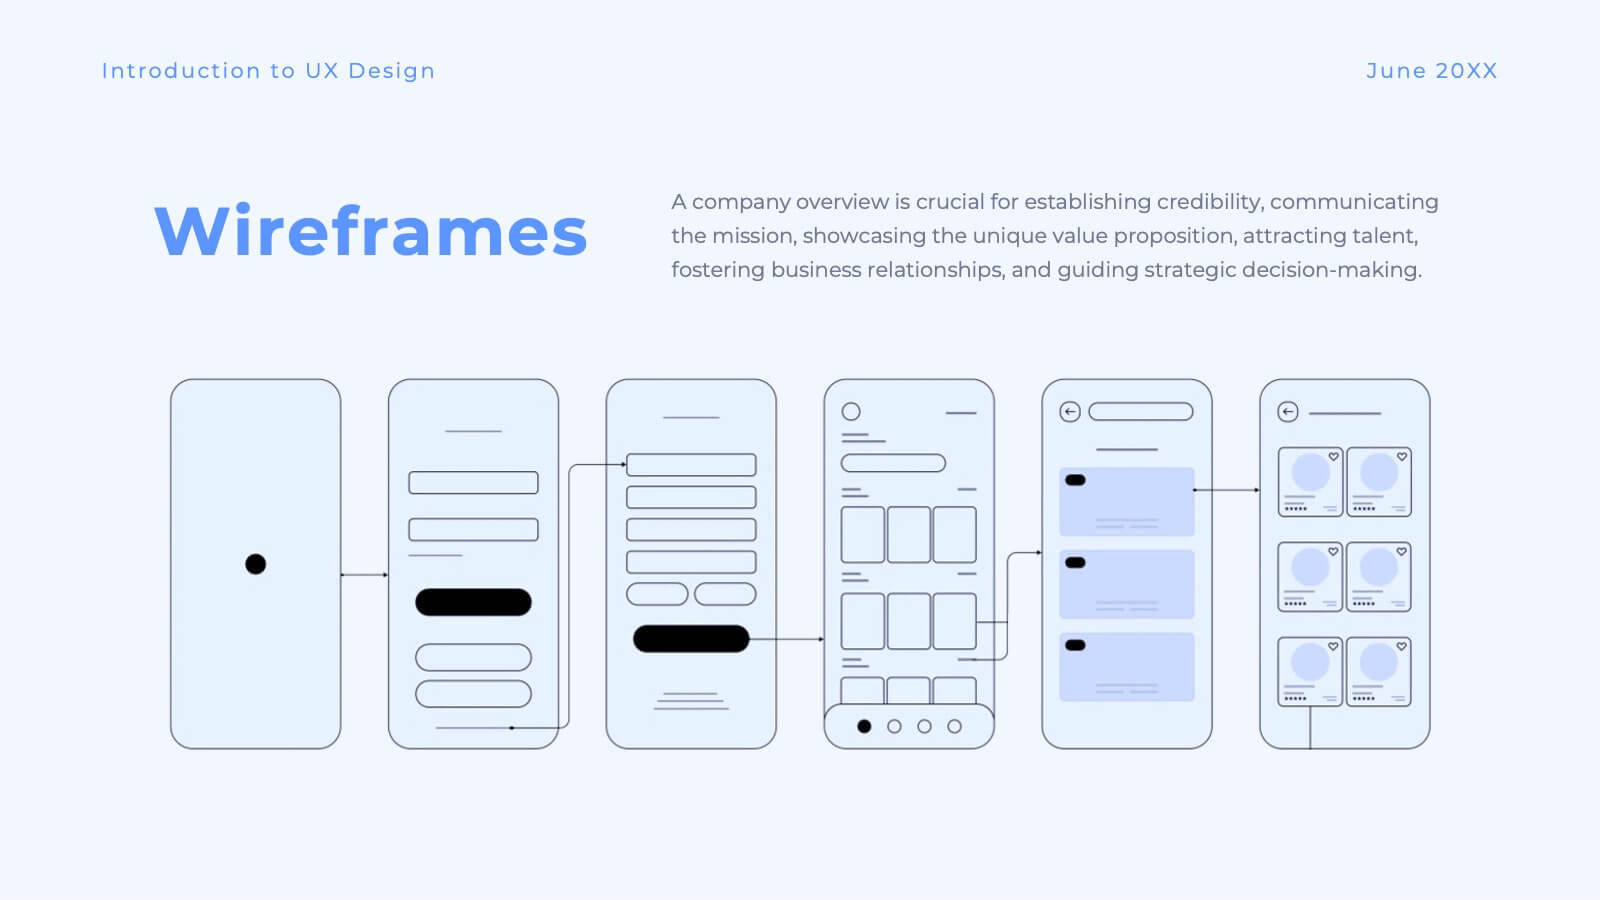
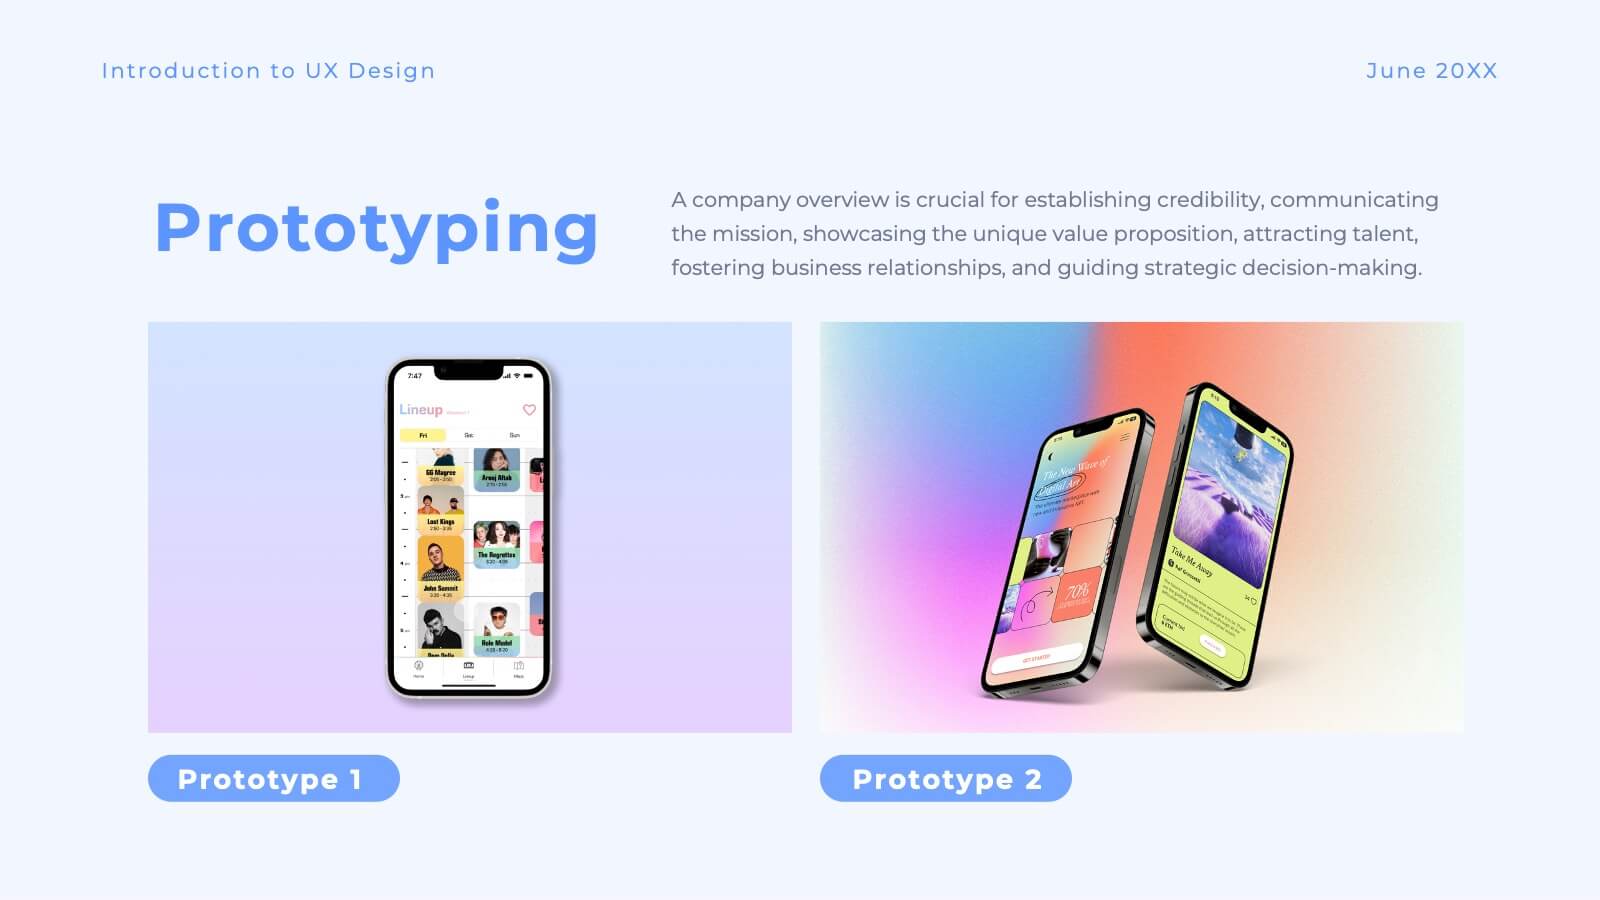
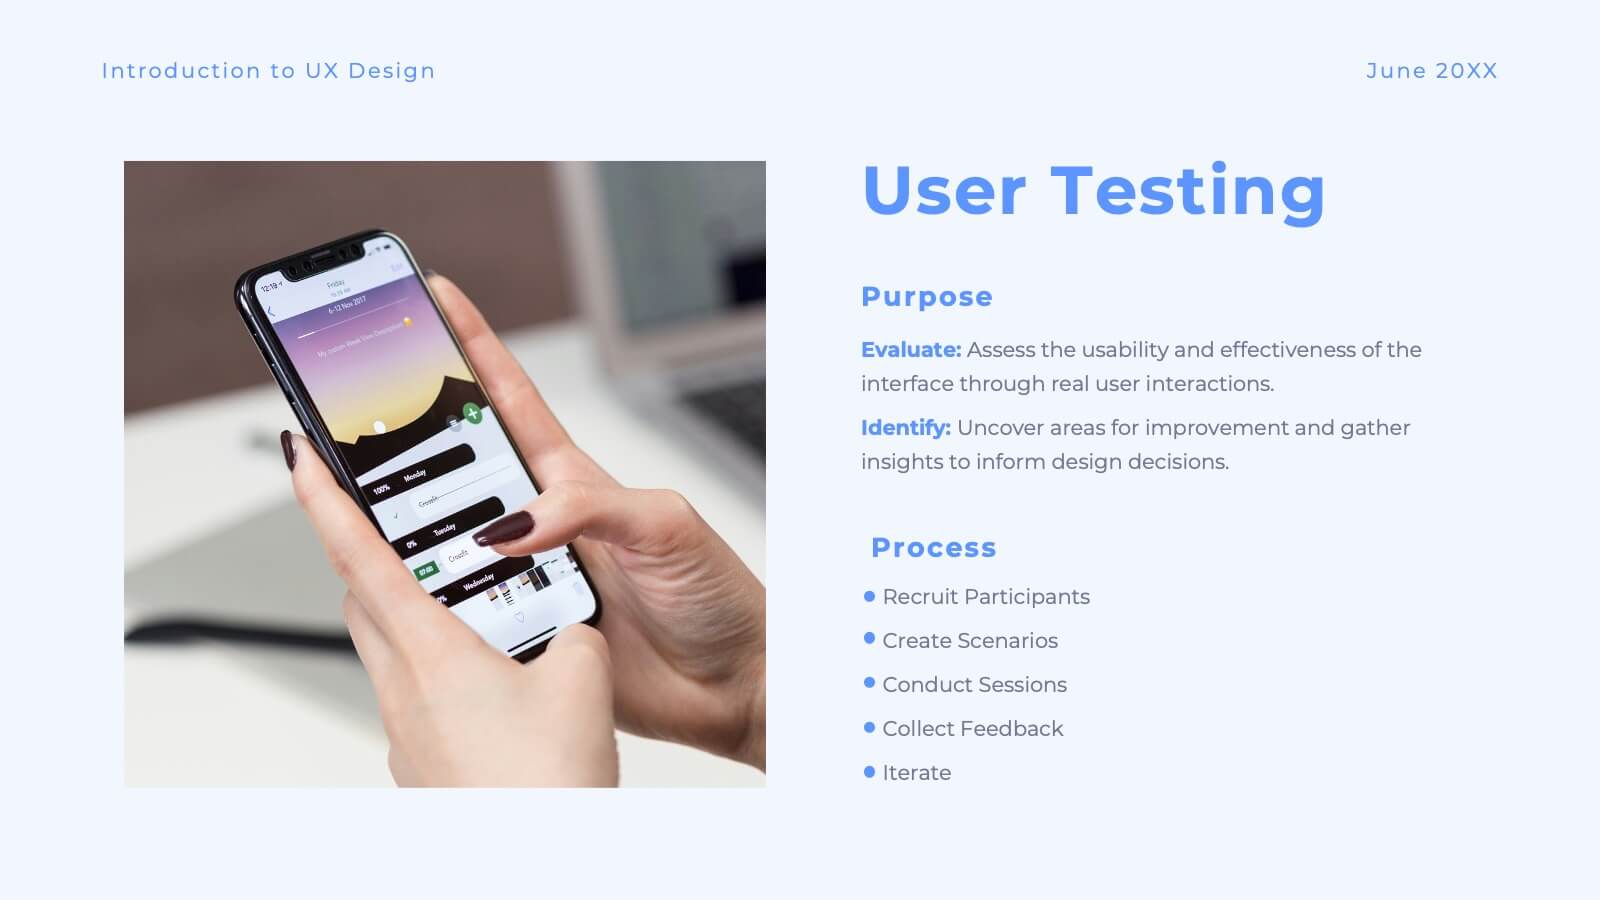
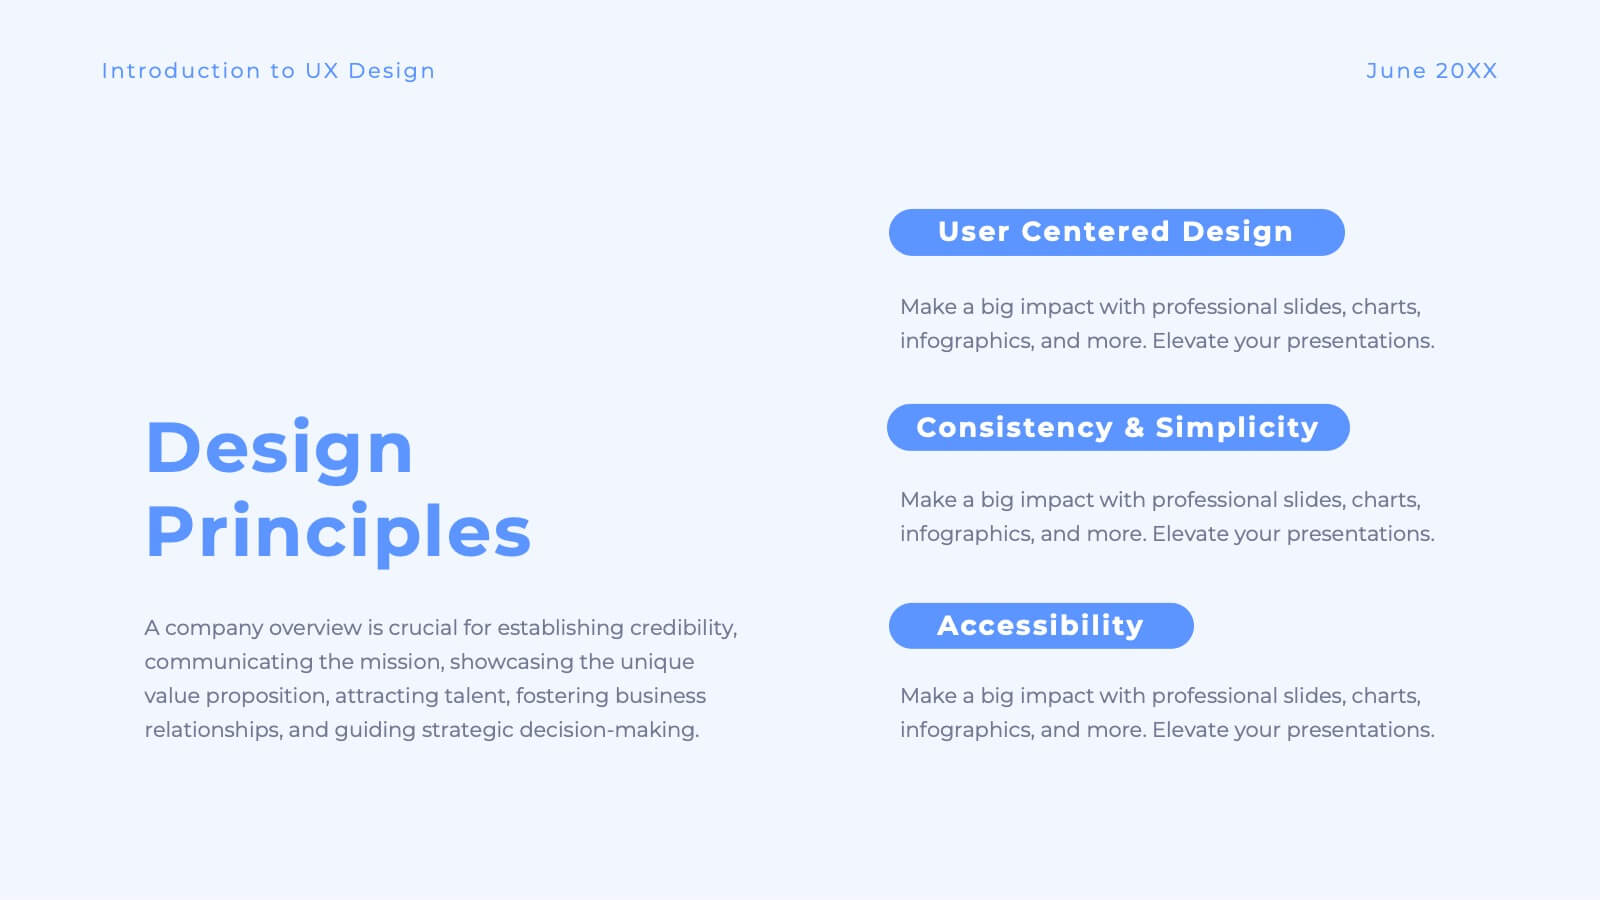
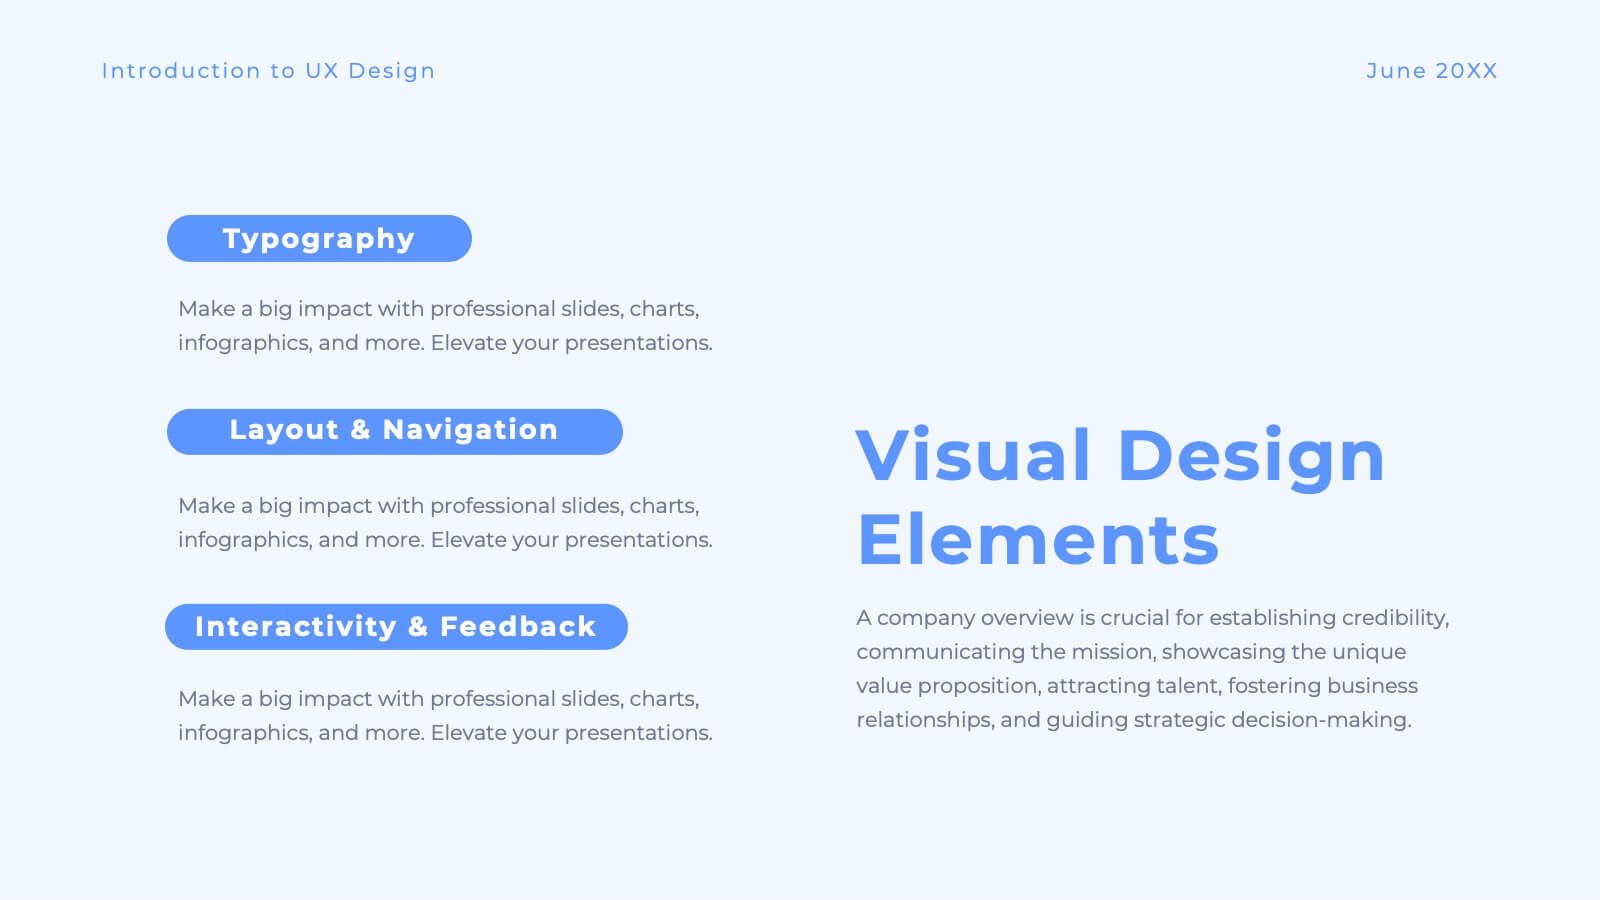
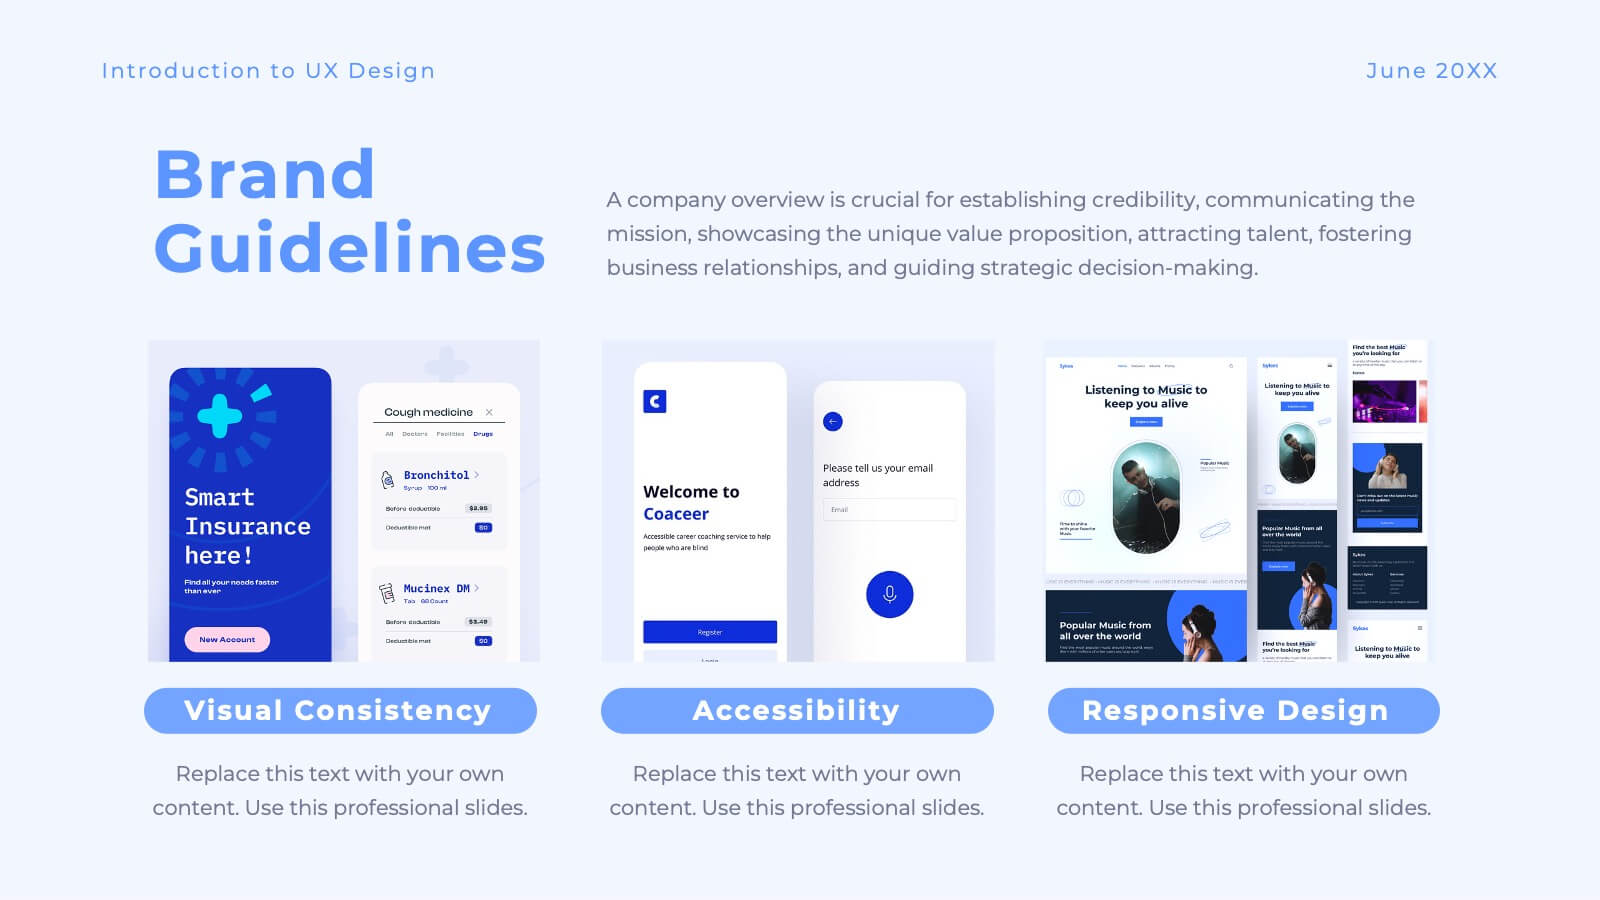
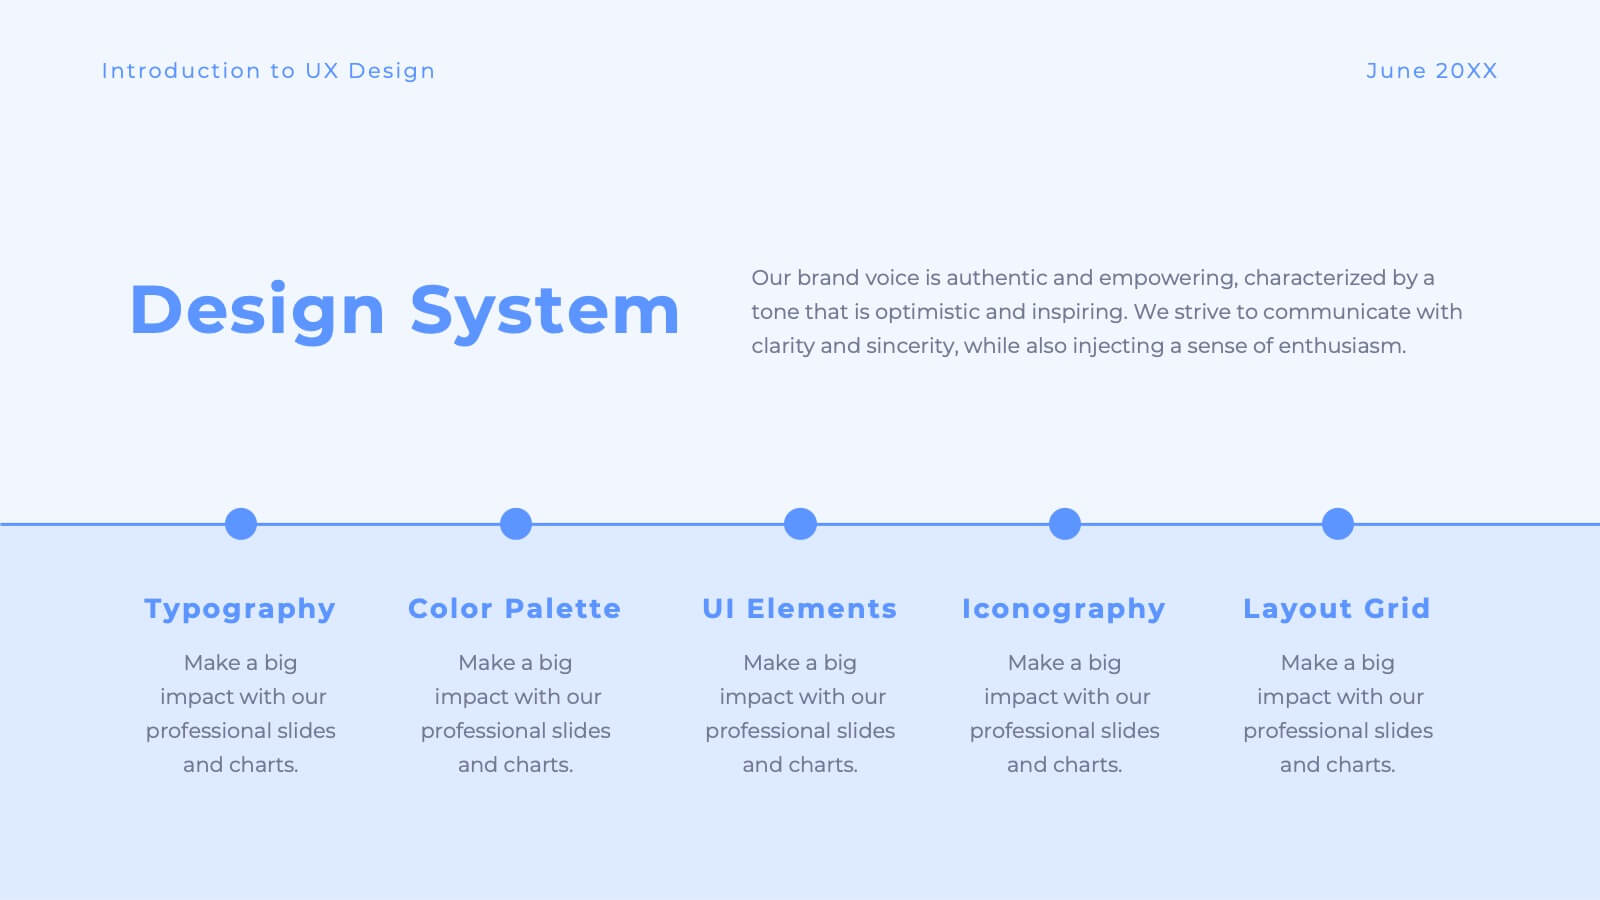
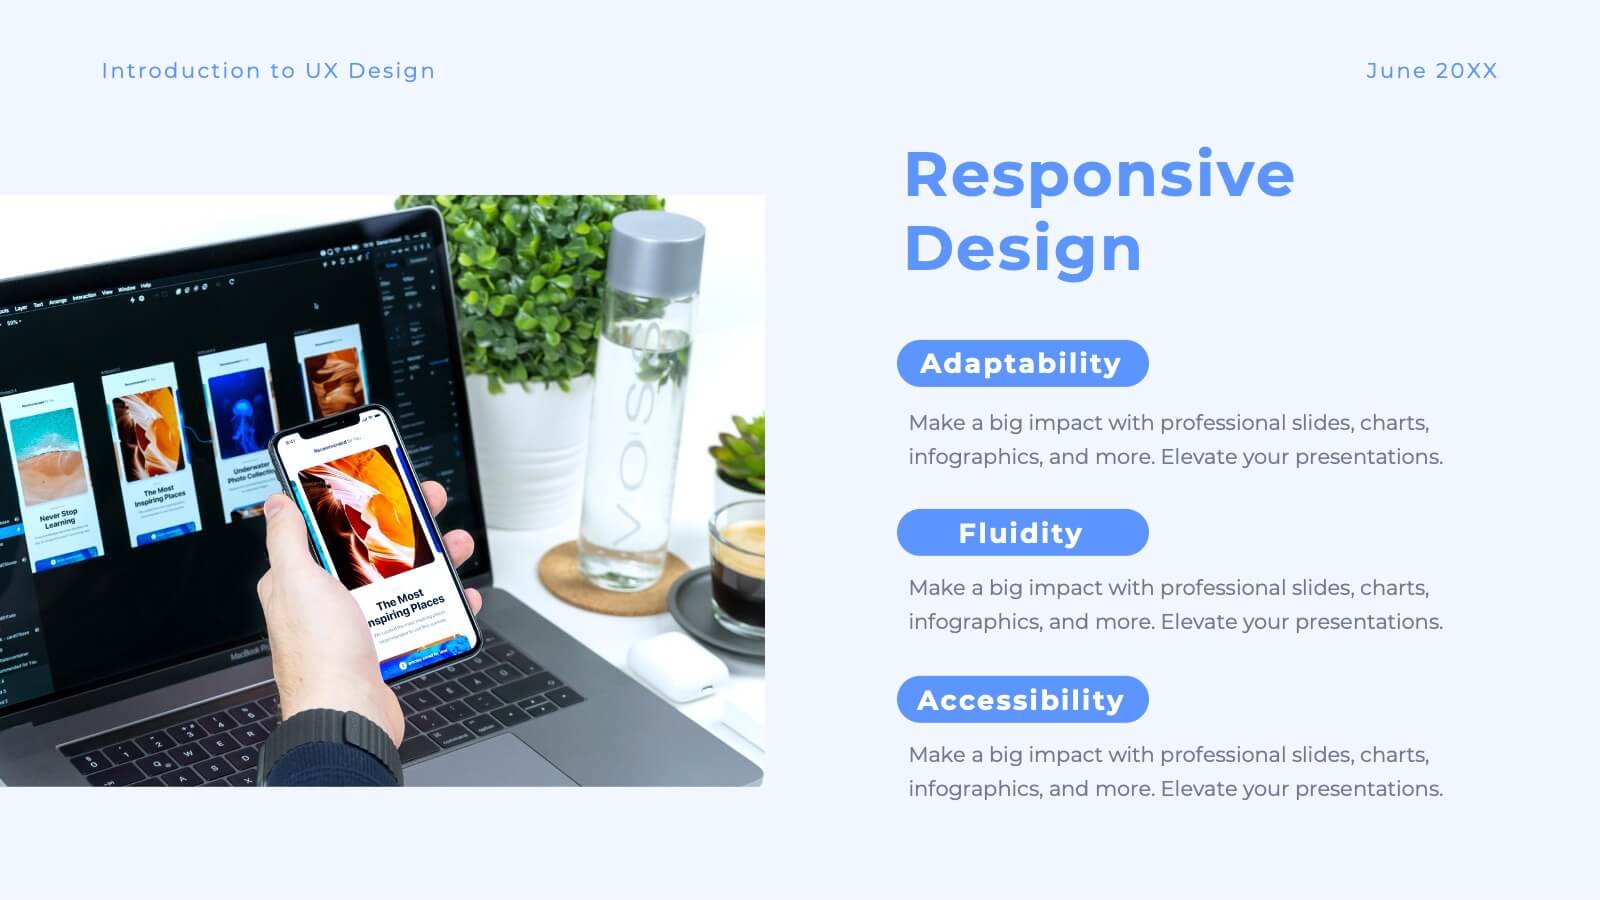
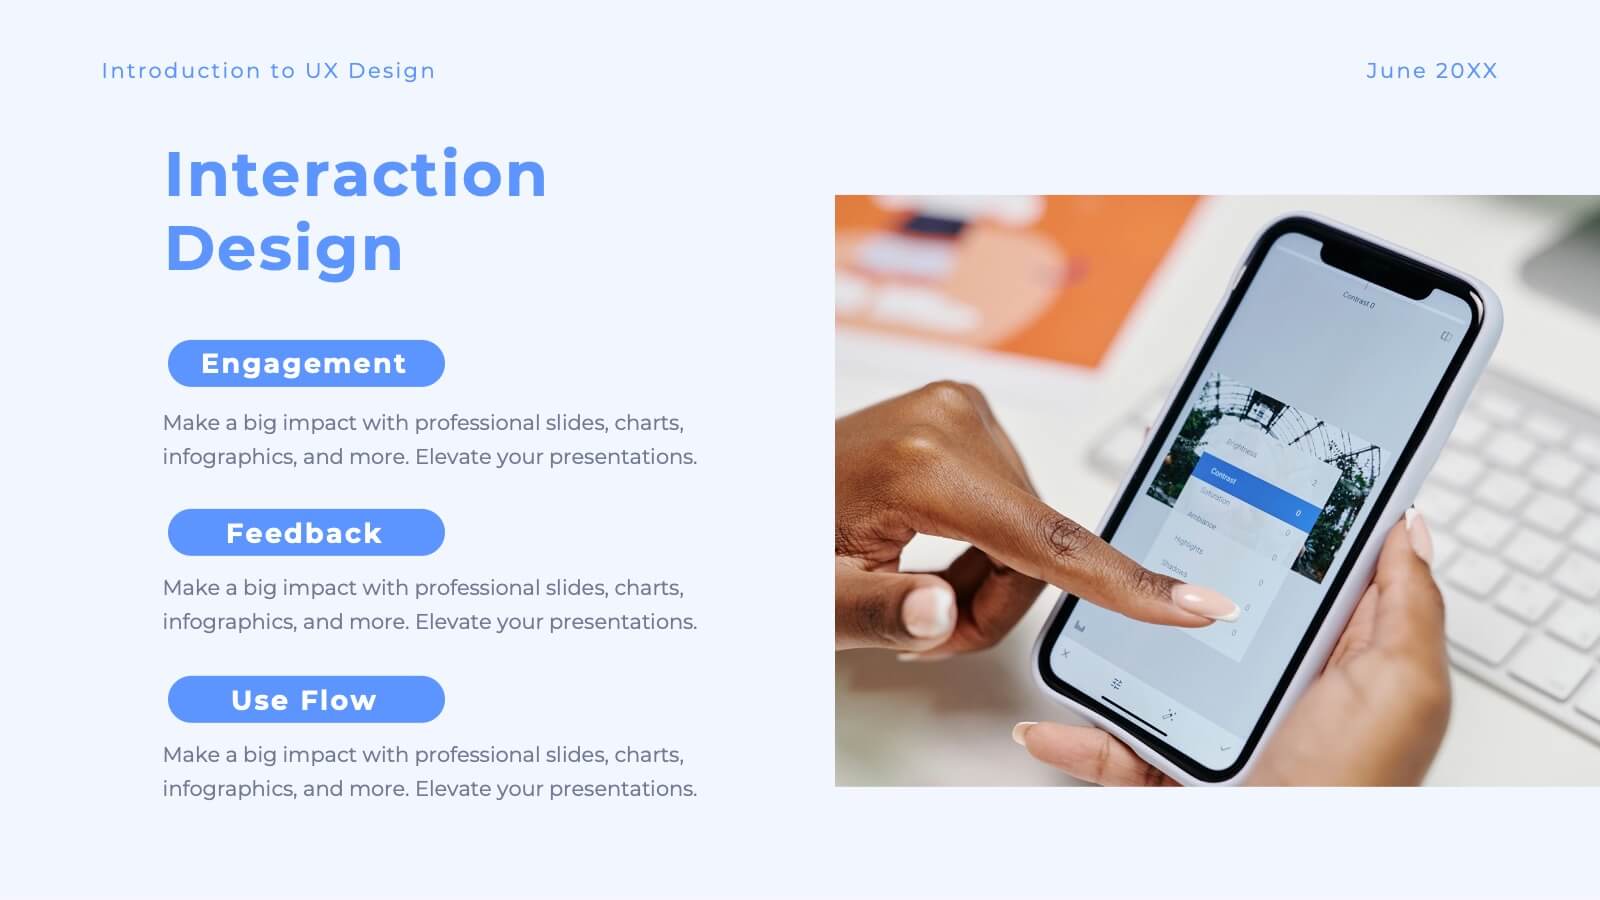
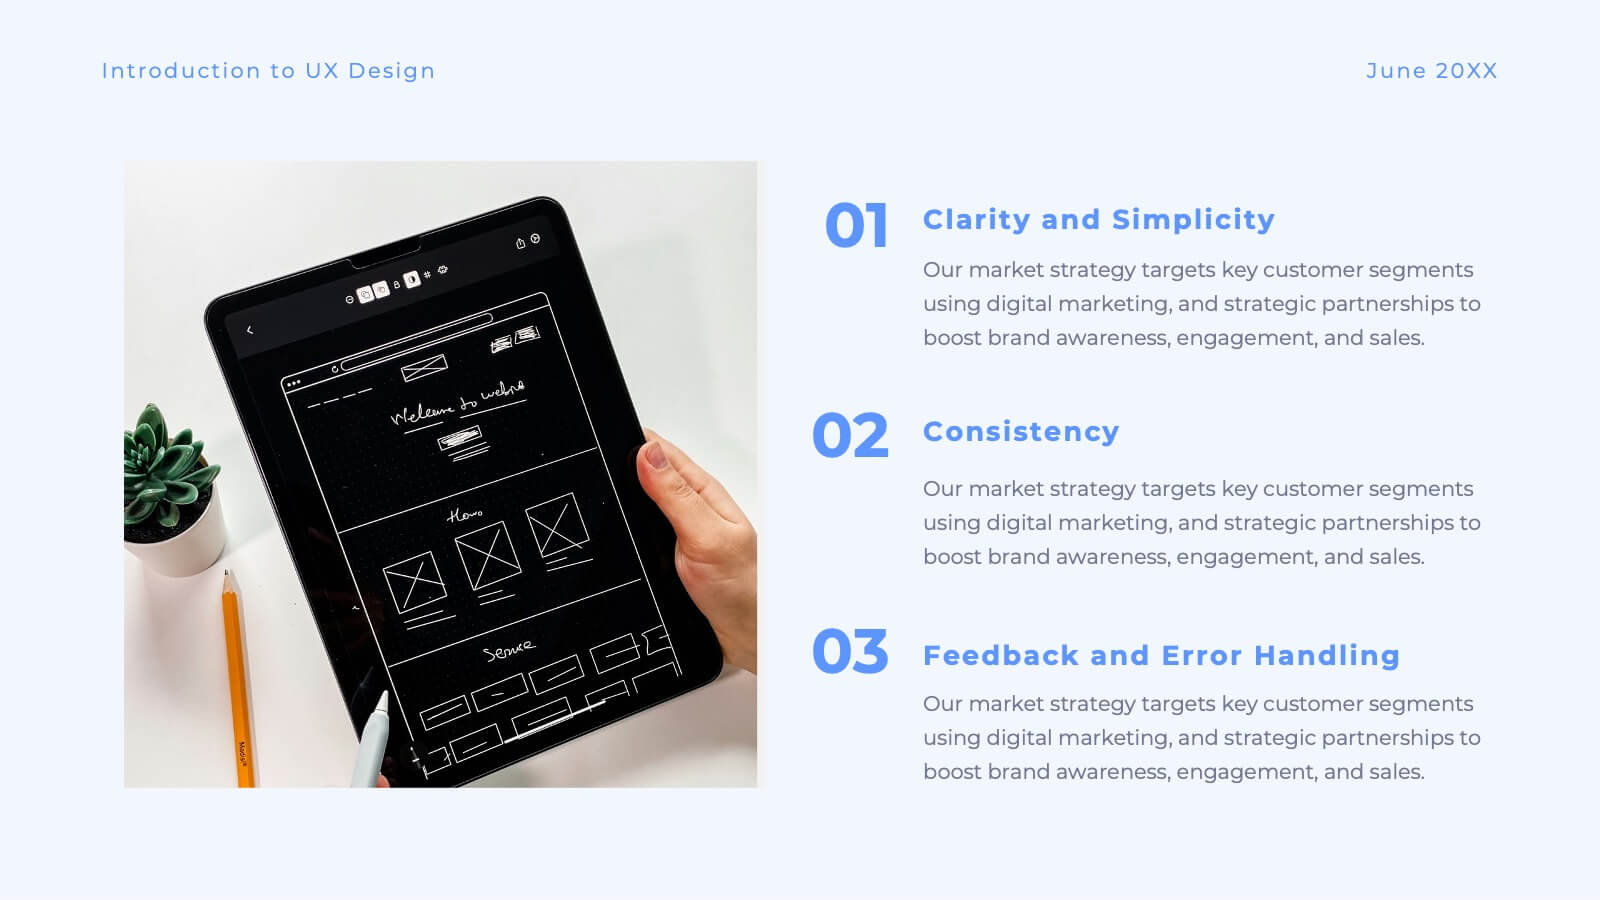
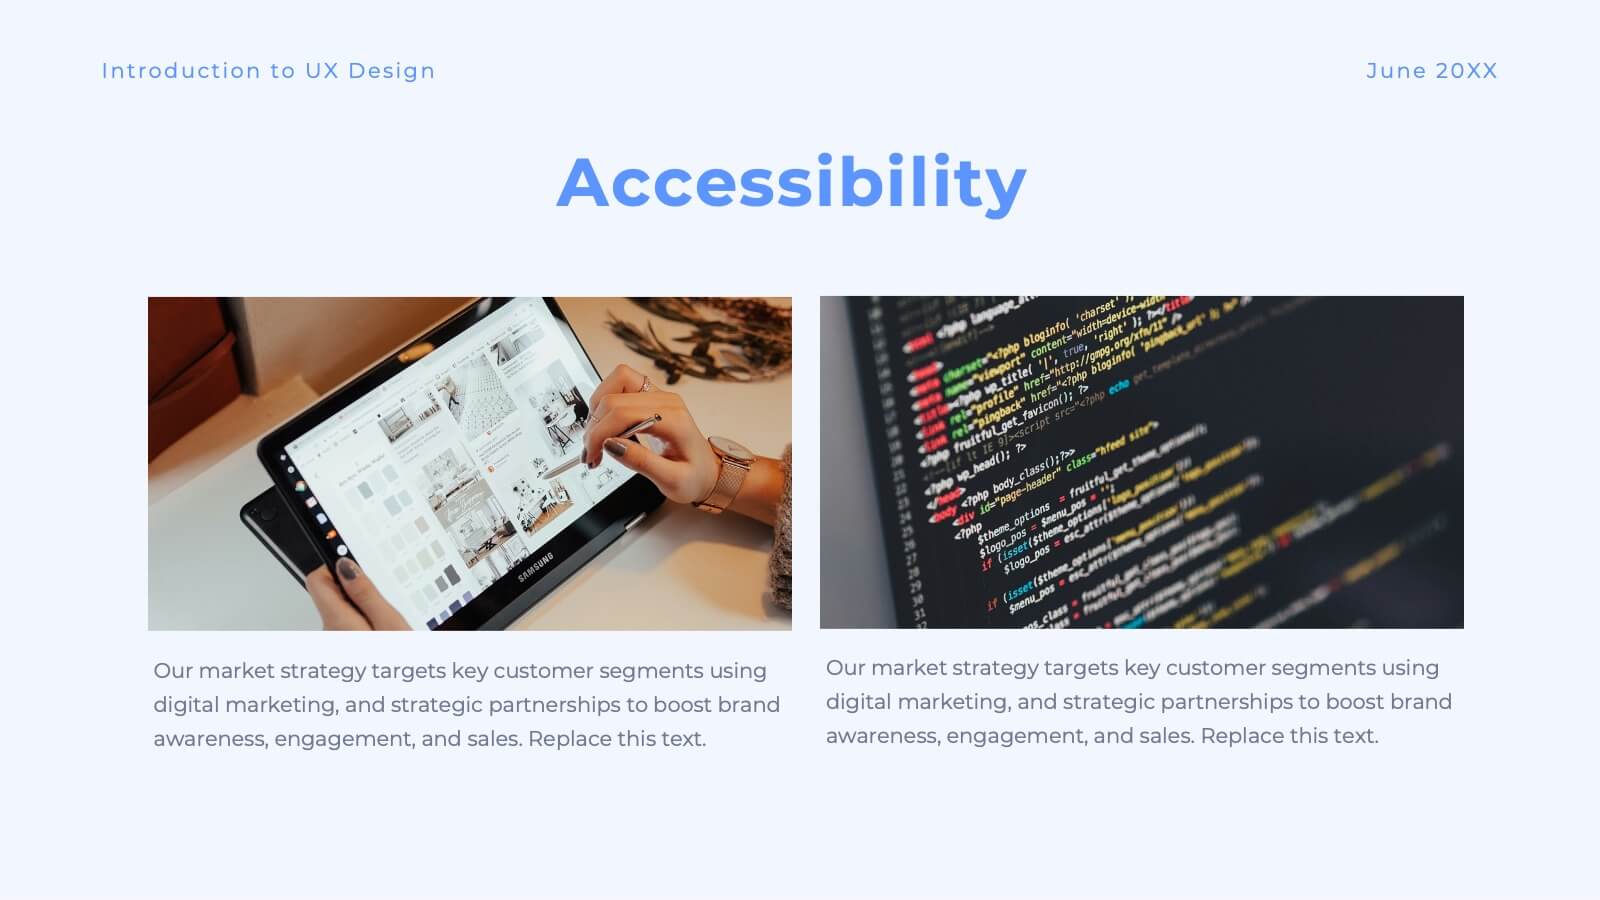
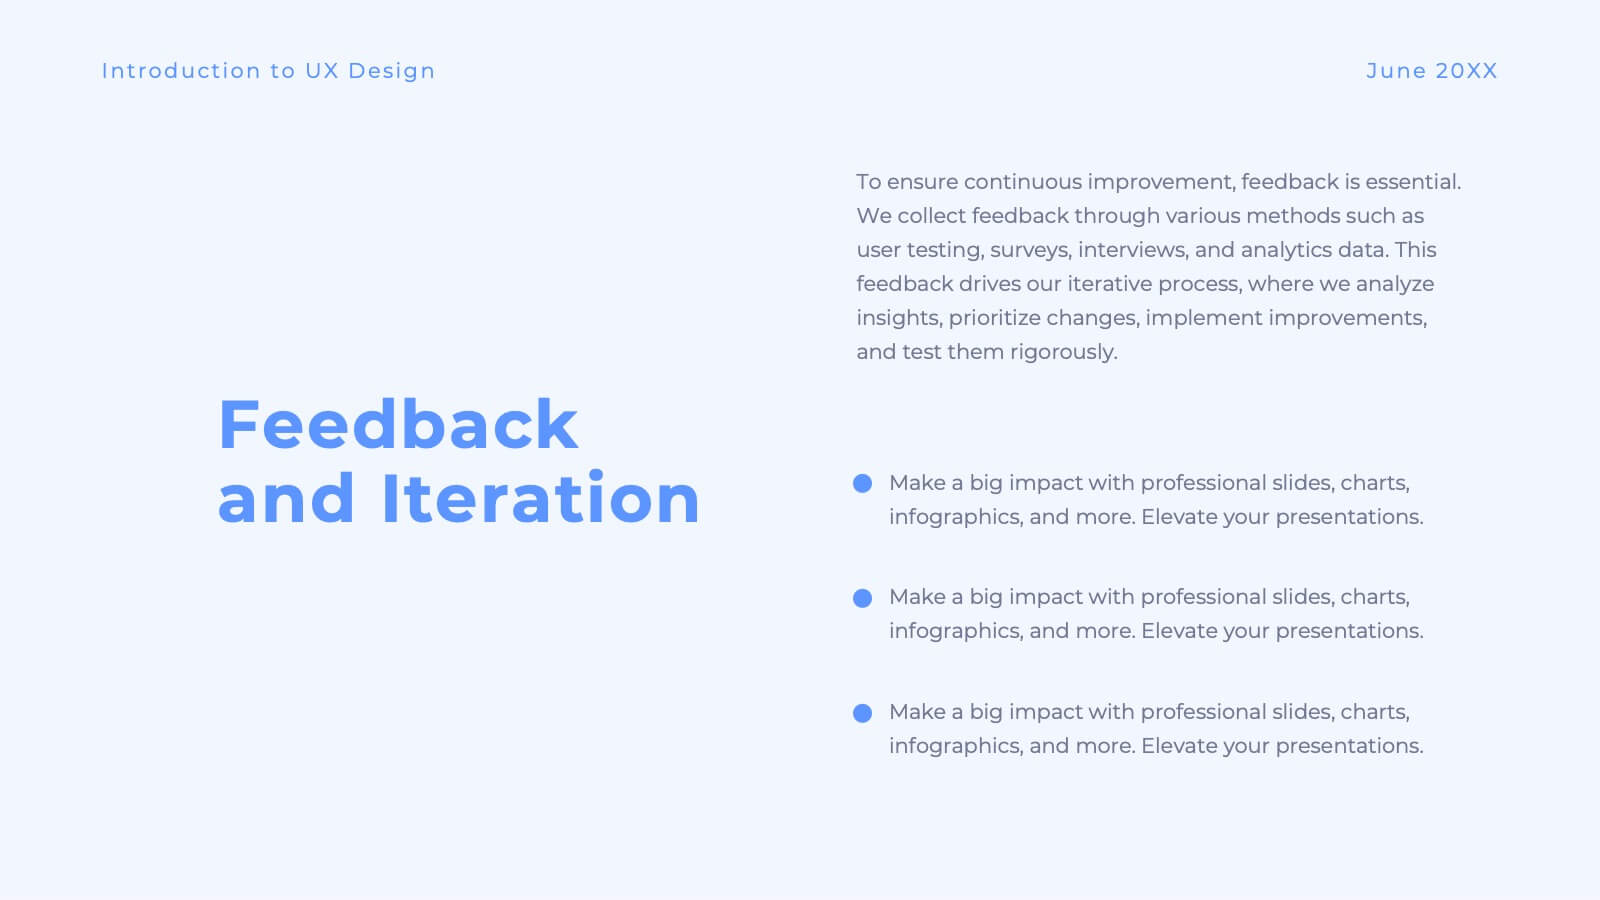
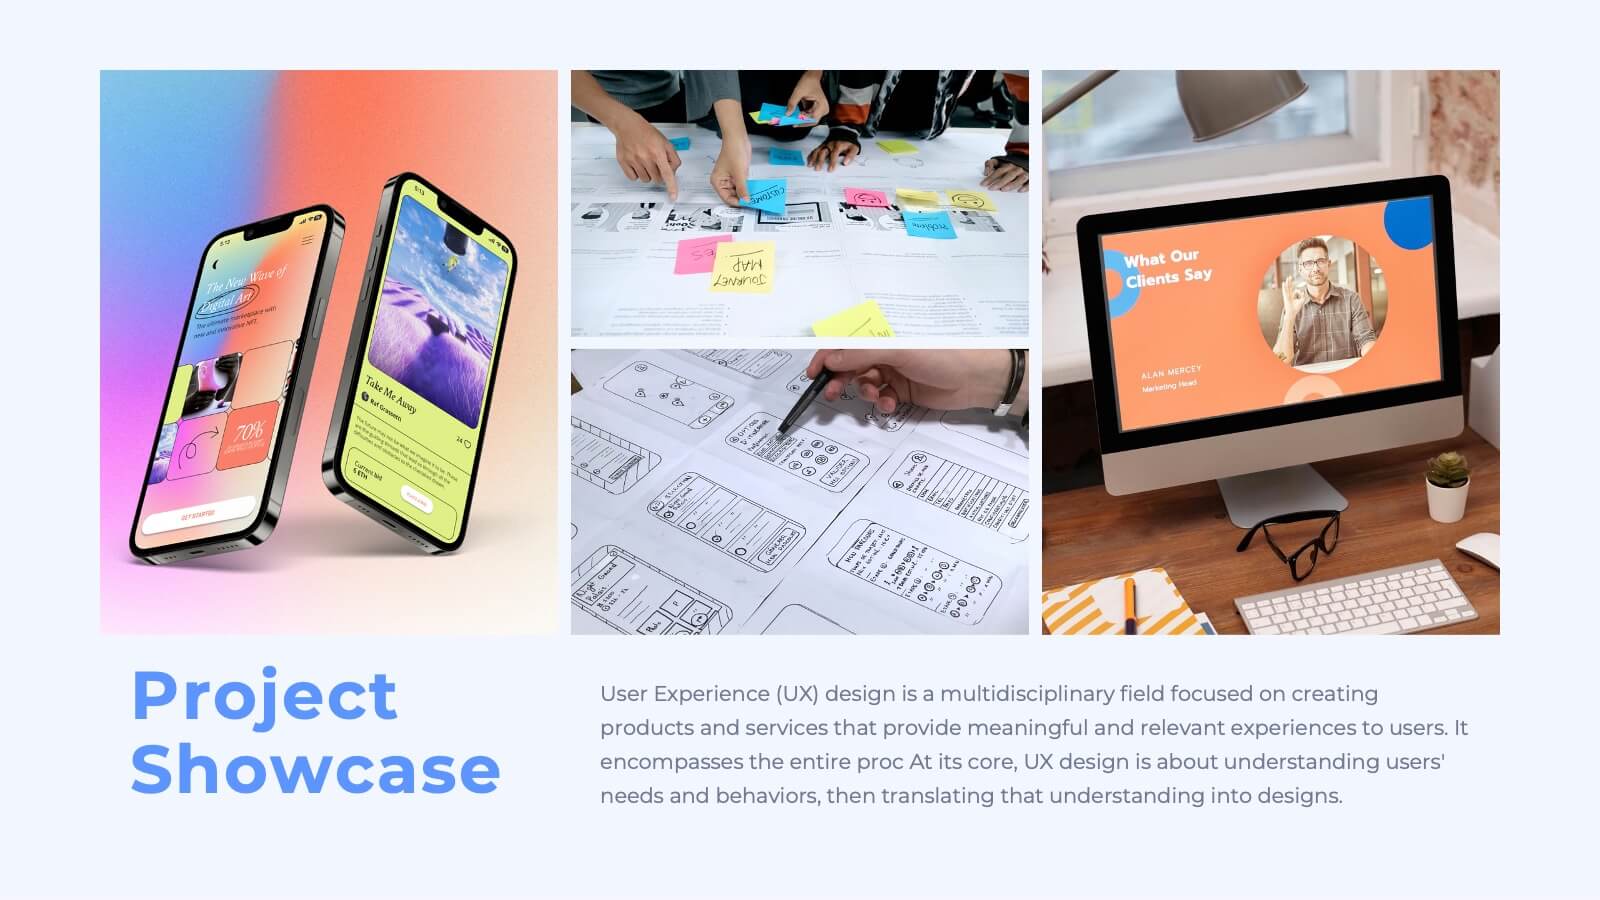
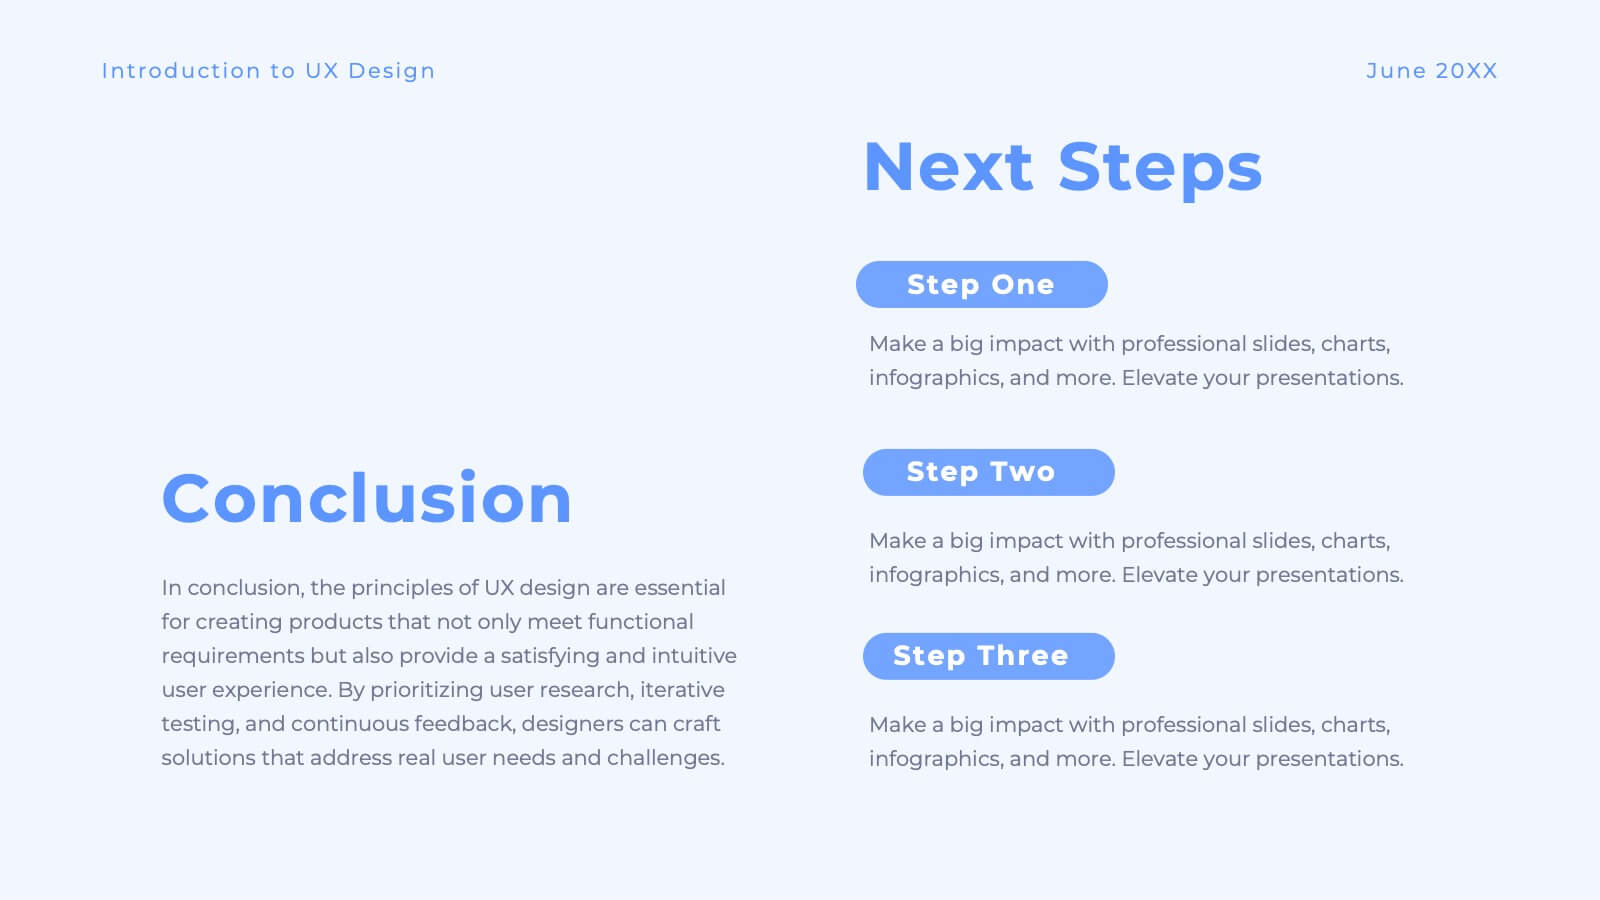
Luster UX Strategy Plan Presentation
Enhance user experience with this comprehensive UX strategy template! Perfect for outlining user research, personas, and design principles. Ideal for UX/UI designers aiming to present their strategies effectively. Compatible with PowerPoint, Keynote, and Google Slides, this template ensures your UX presentations are clear, professional, and impactful. Create exceptional user experiences today!


4 diapositivas
Conversion Funnel Stages Presentation
Bring clarity to every step of your customer journey with this clean, visually aligned funnel layout designed for quick understanding. This presentation breaks your process into clear stages, helping you explain performance, drop-offs, and opportunities with ease. Fully compatible with PowerPoint, Keynote, and Google Slides.


4 diapositivas
Customer-Focused Benefit Breakdown Presentation
Put your audience at the center with the Customer-Focused Benefit Breakdown Presentation. This slide design features a spotlight-style layout that emphasizes user-centric advantages and clearly communicates your value propositions. Ideal for marketing plans, sales strategies, or user journey analysis. Fully customizable and compatible with PowerPoint, Keynote, and Google Slides.


6 diapositivas
Multiple Business Solutions Options Slide Presentation
Explore diverse strategies with the Multiple Business Solutions Options Slide Presentation. Featuring a vertical stack of labeled briefcases (A–F), this slide is designed to compare and communicate multiple business ideas, solutions, or pathways in a clear, structured layout. Ideal for pitching product variations, workflow choices, or market entry tactics. Each option is paired with customizable text fields for added clarity. Compatible with PowerPoint, Keynote, and Google Slides for easy editing and integration into your existing decks.
23 diapositivas
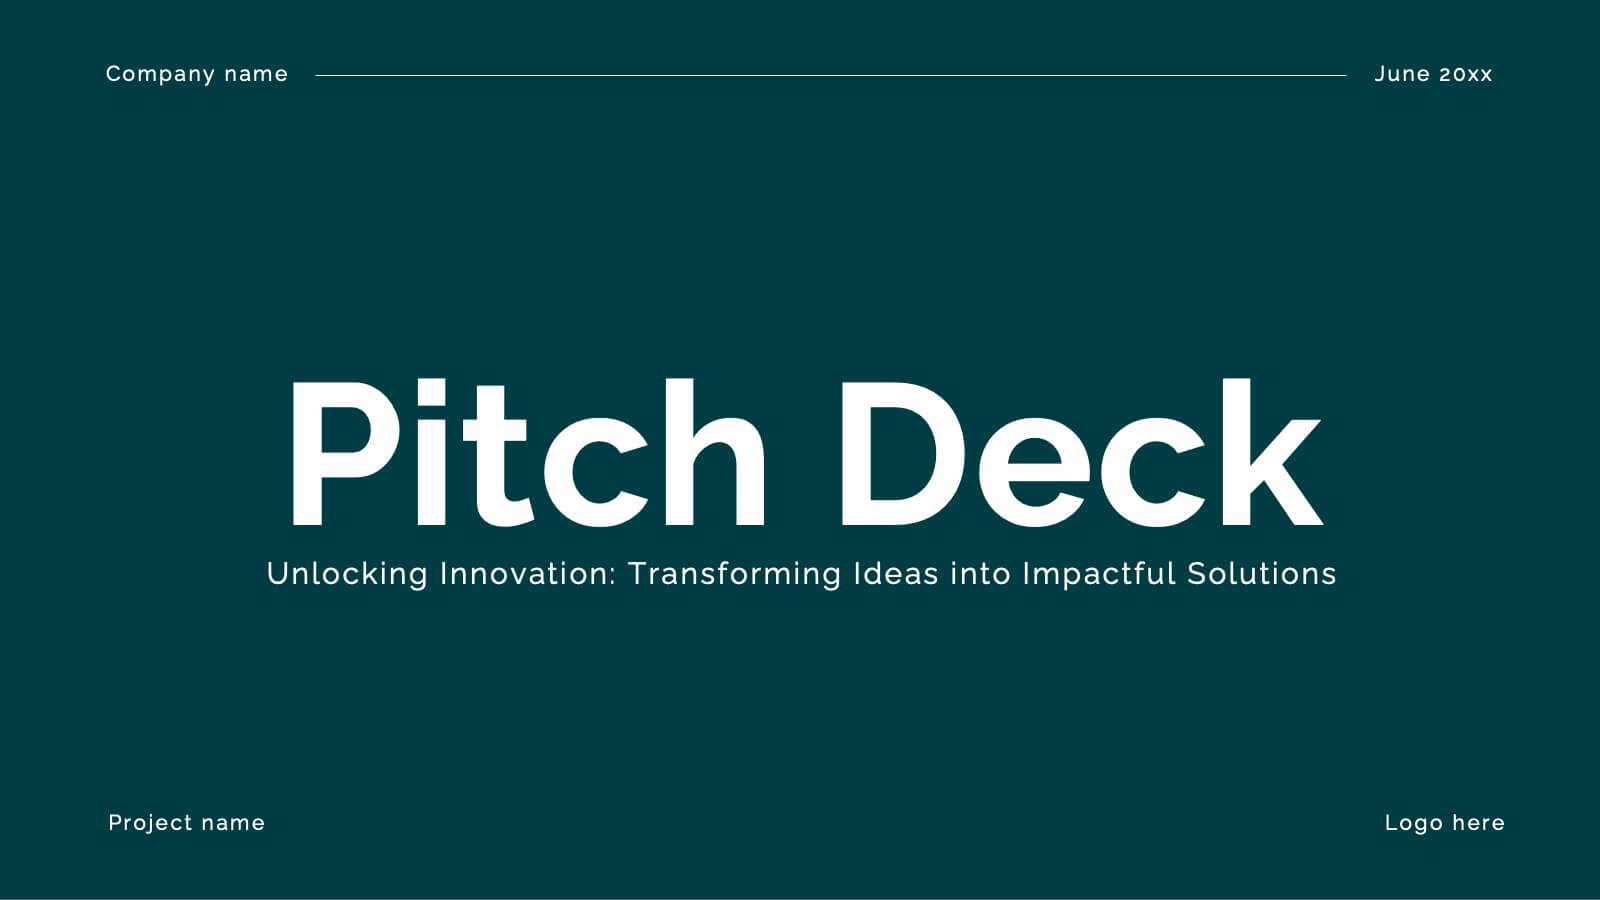
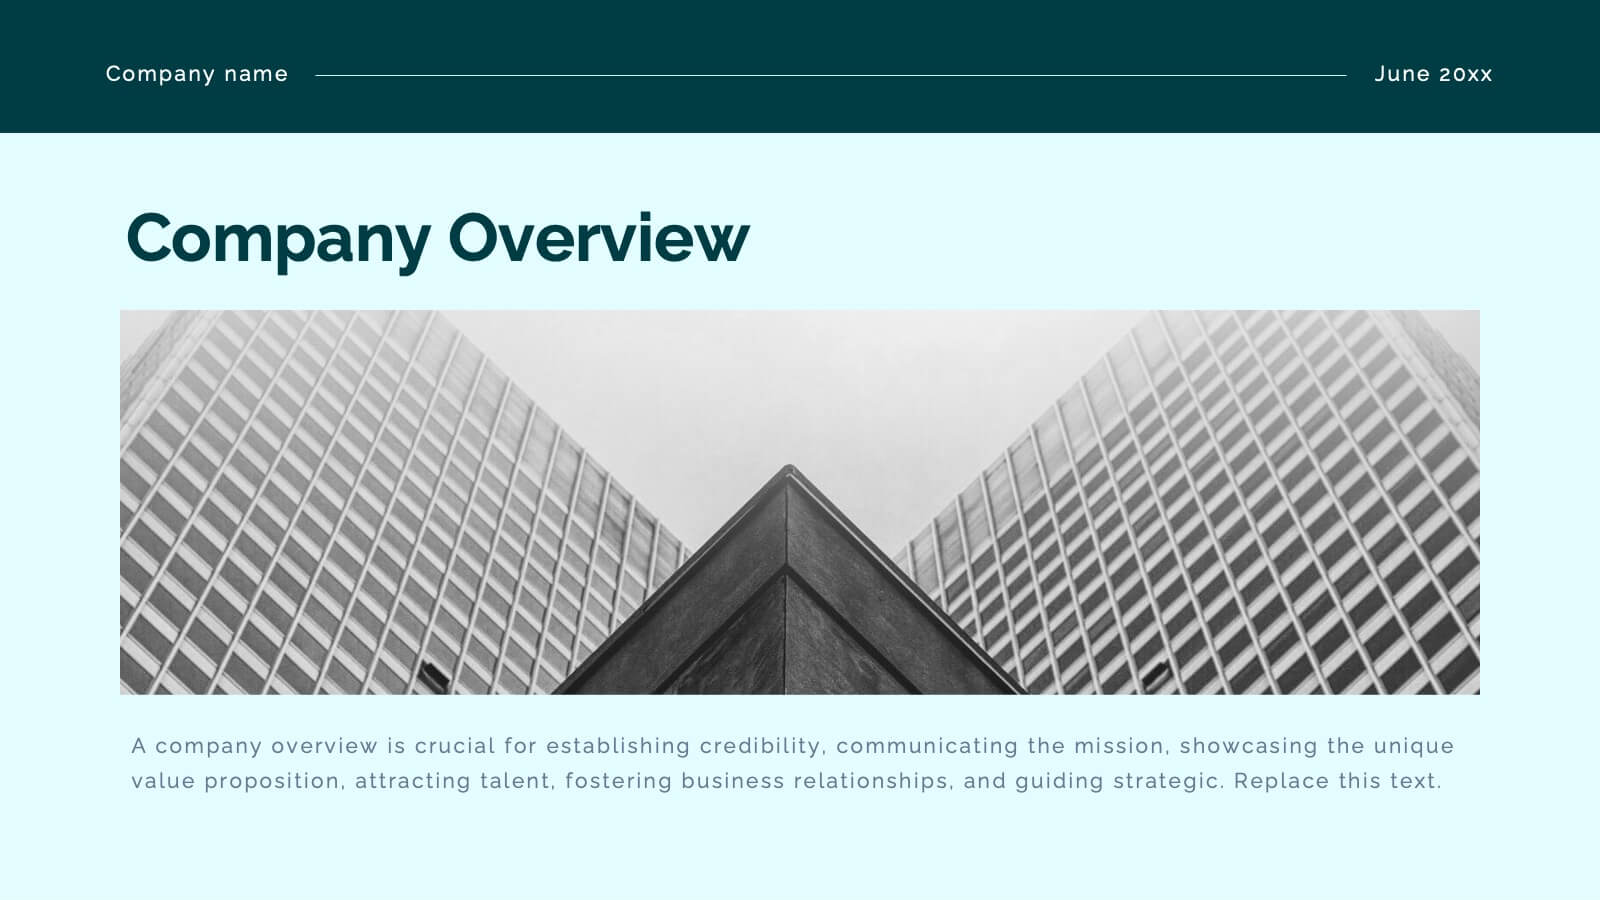
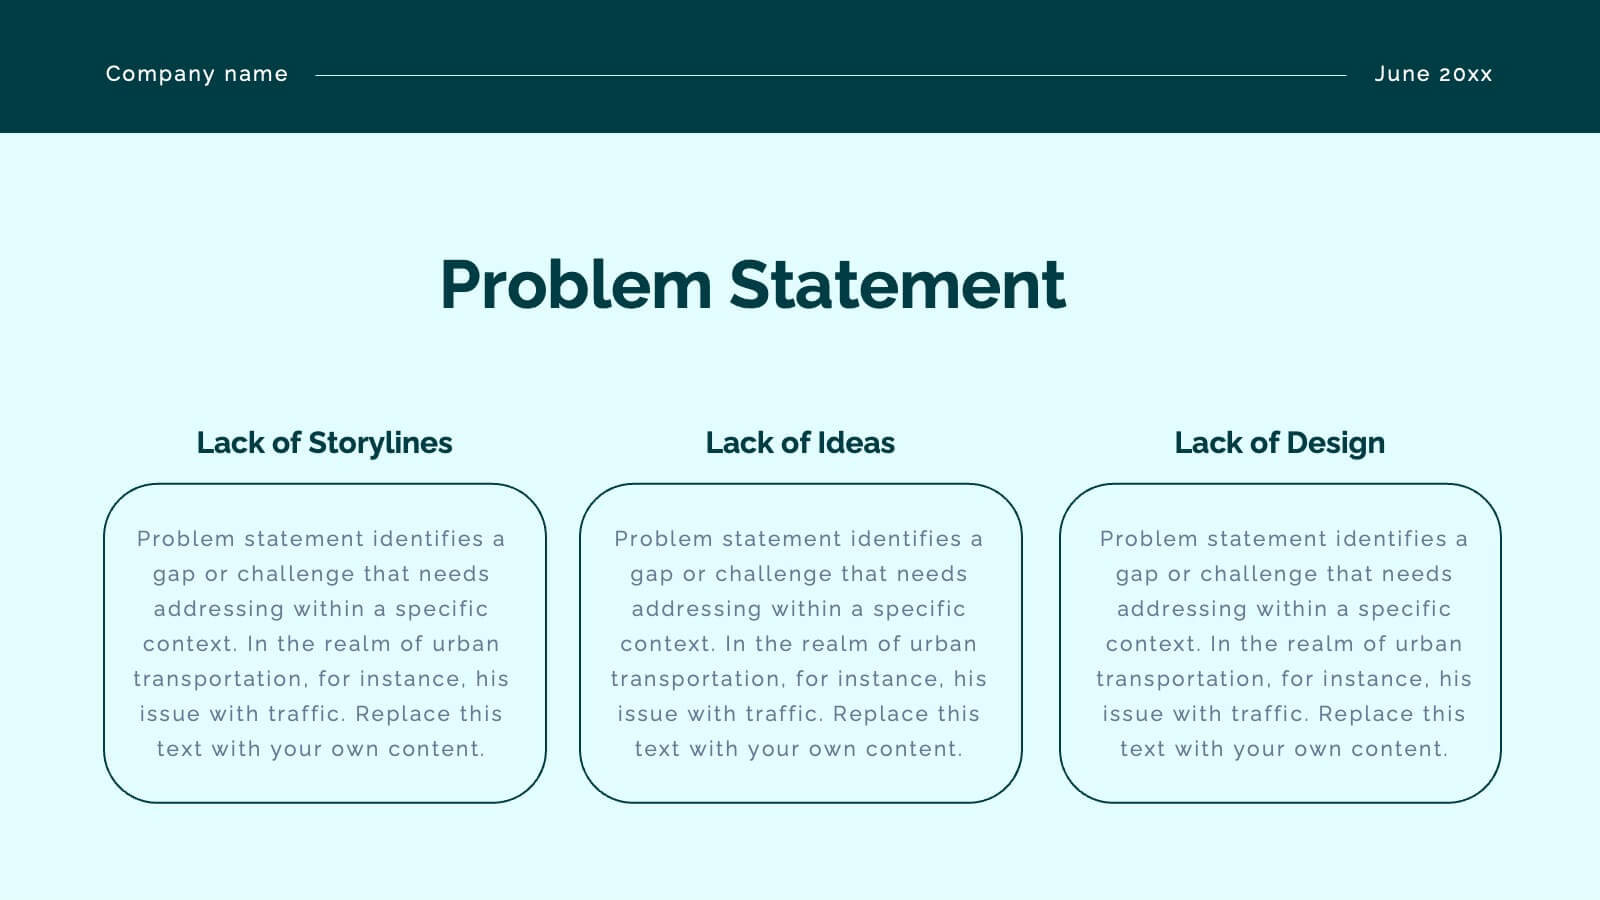
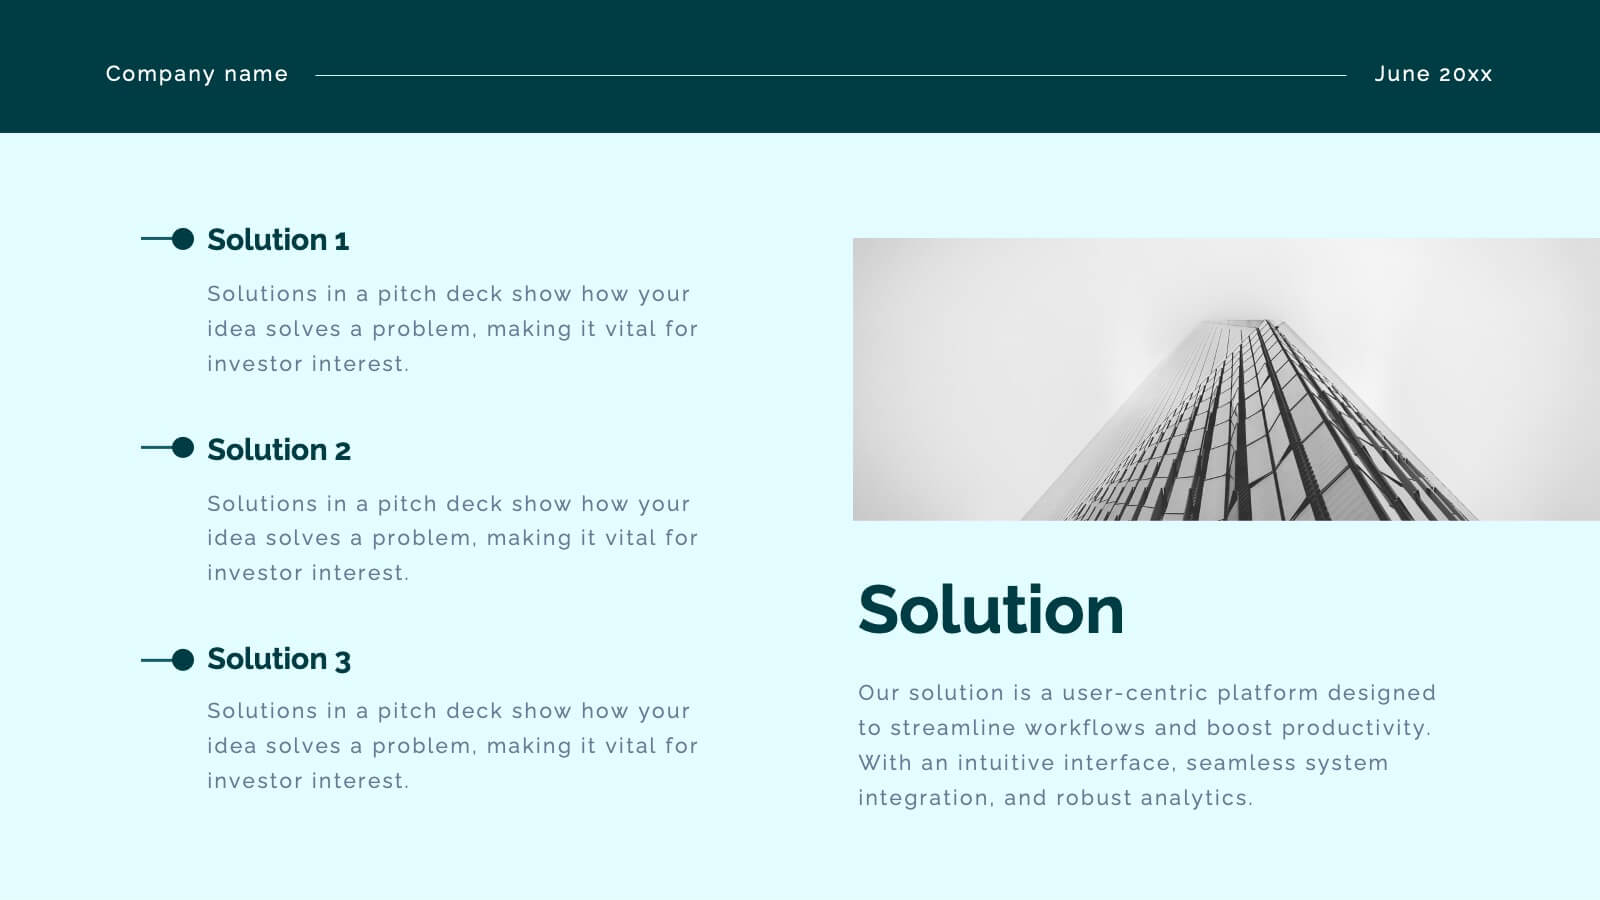
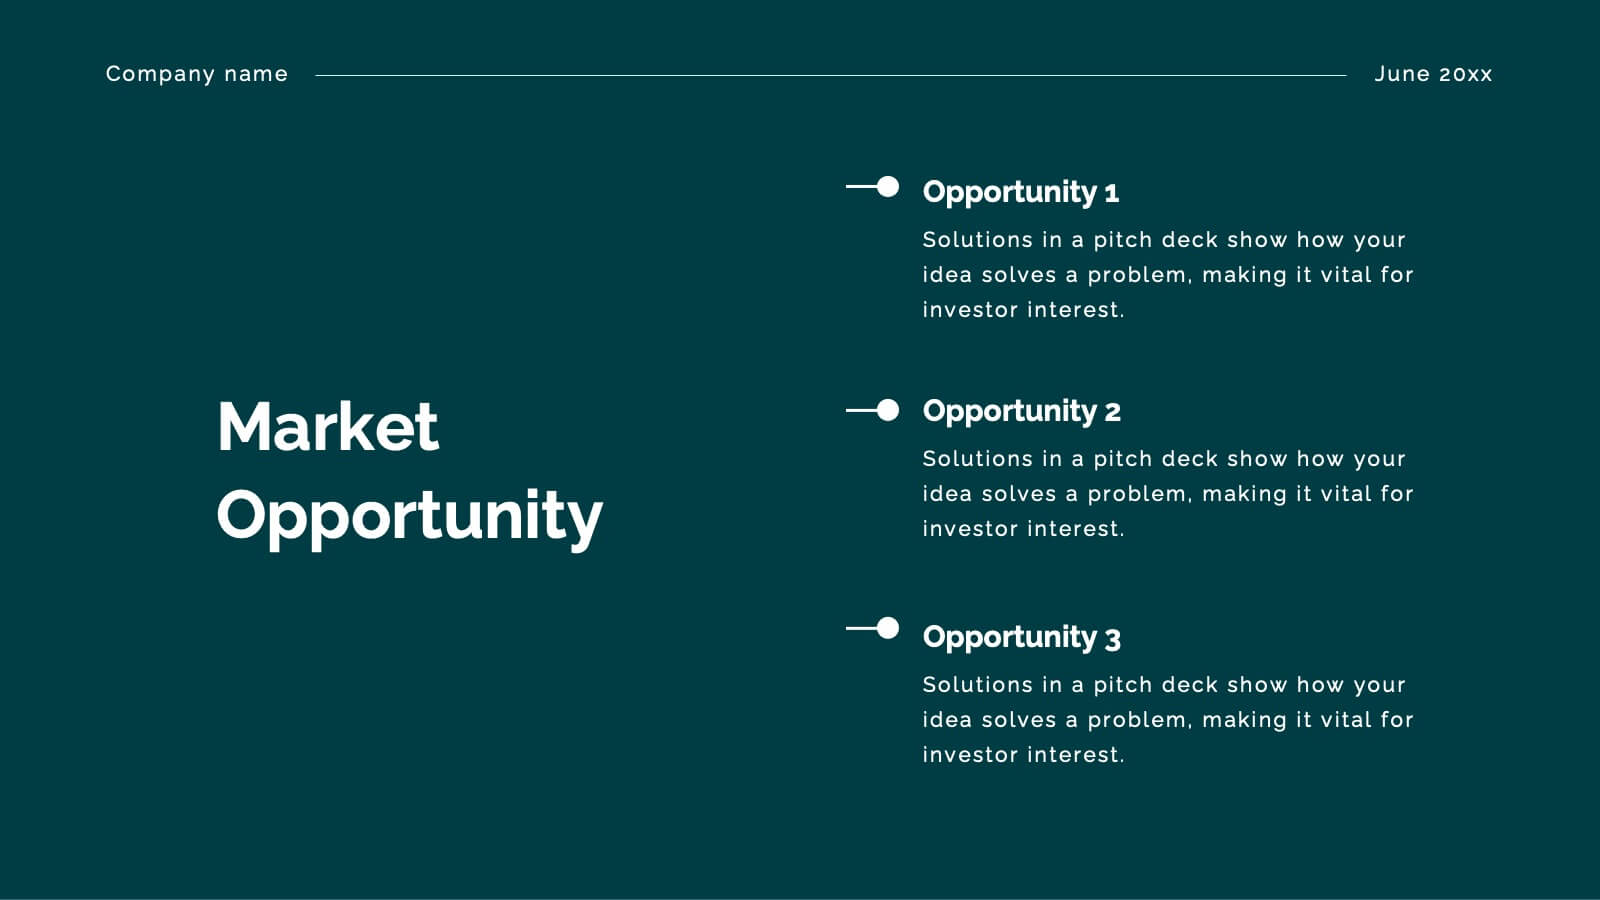
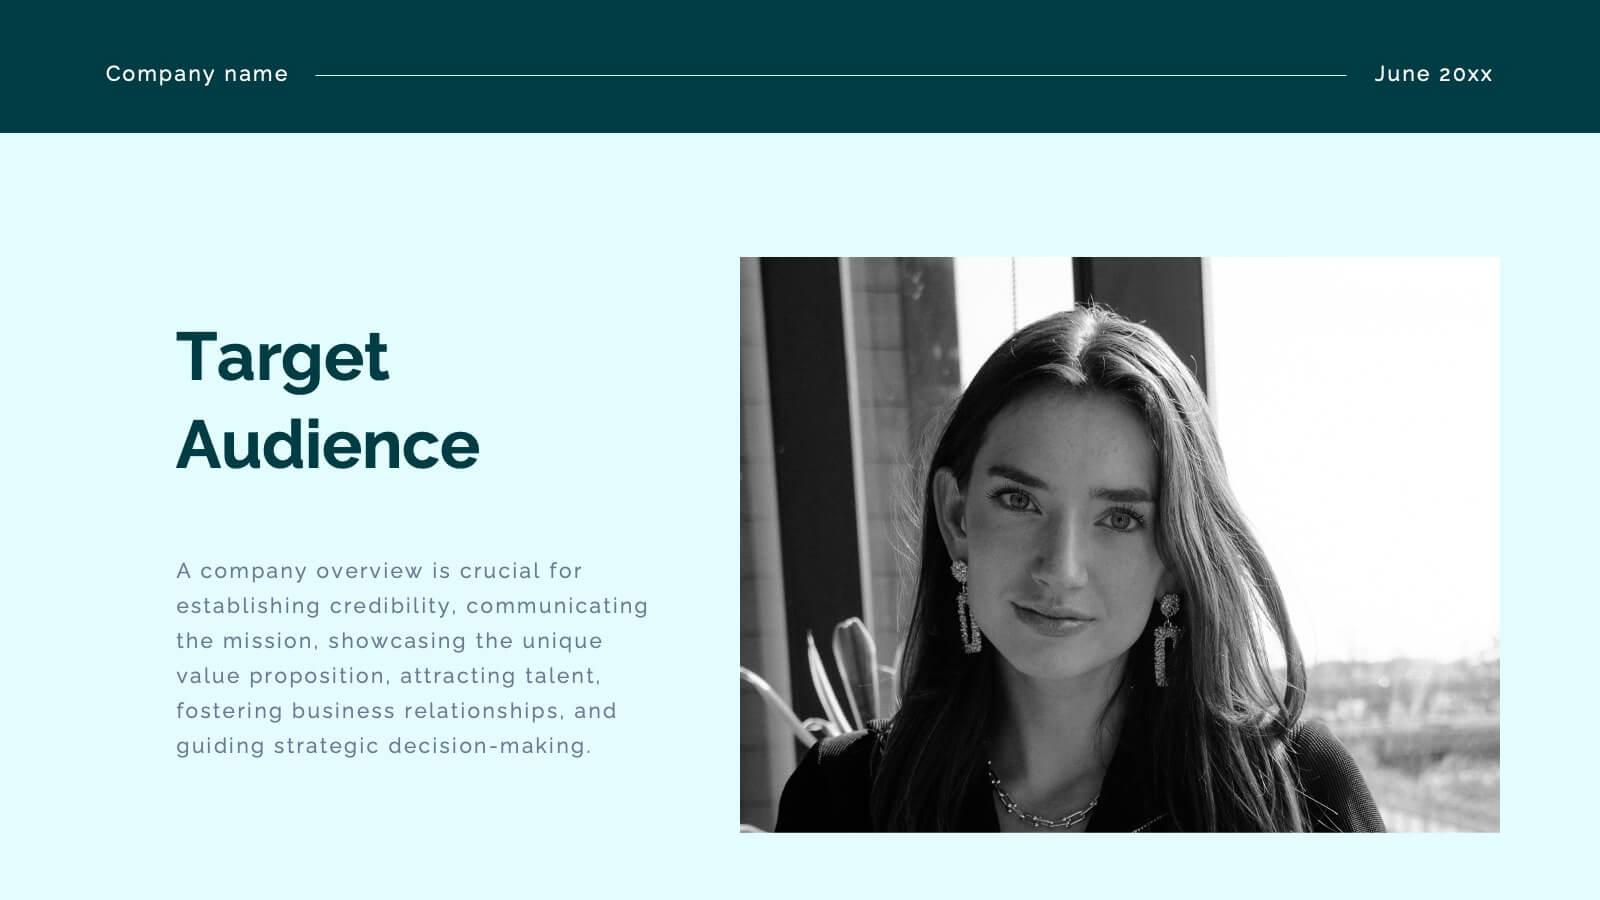
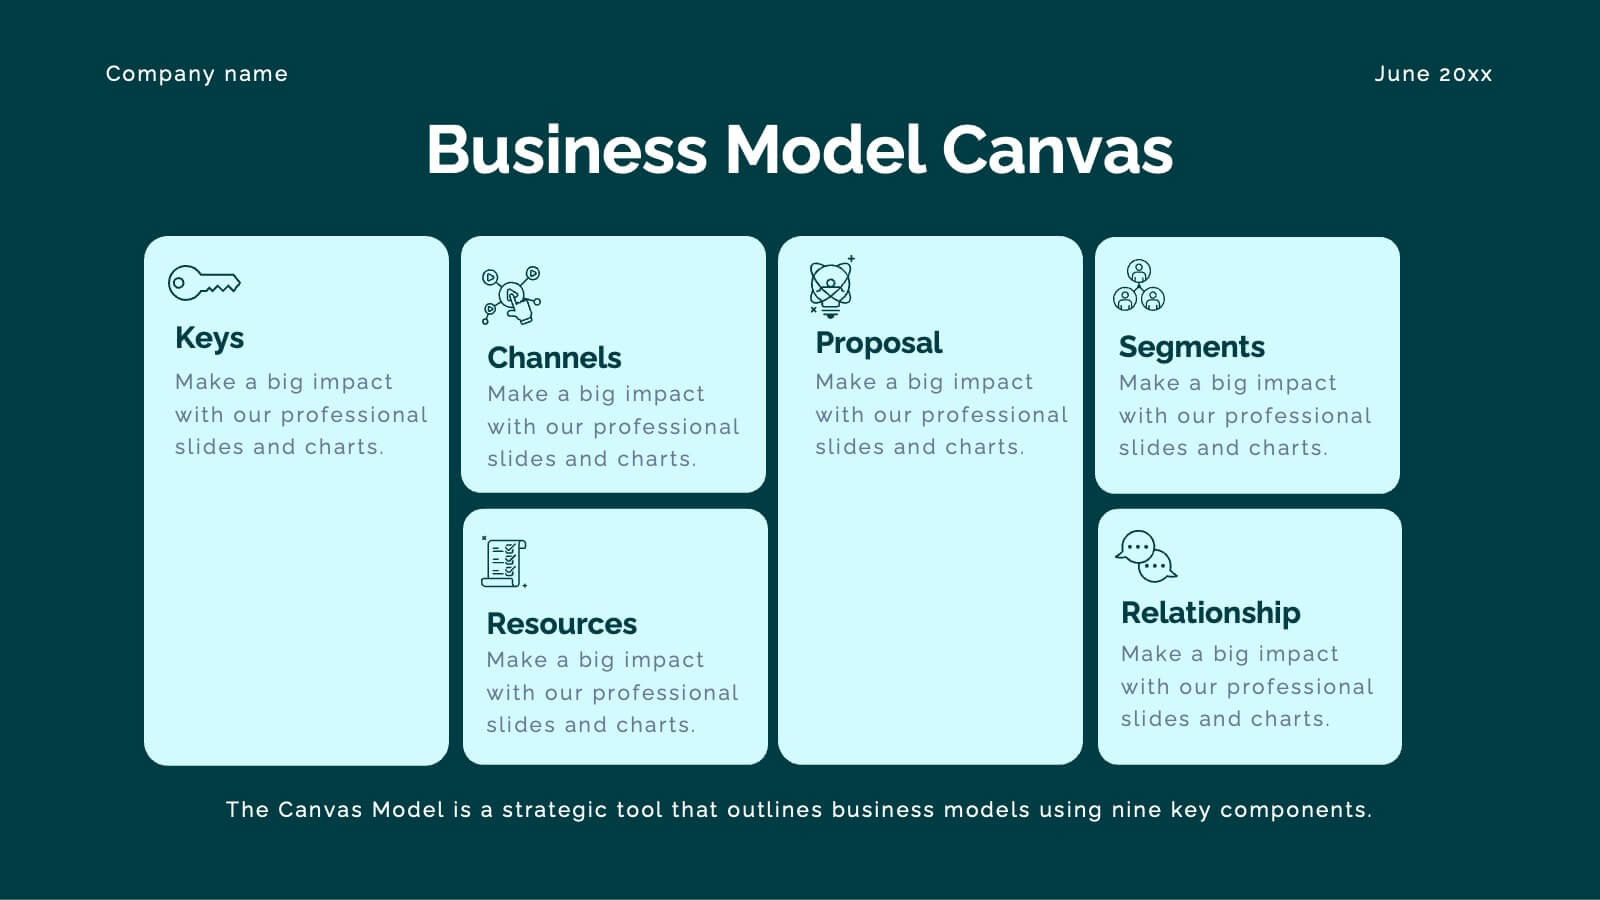
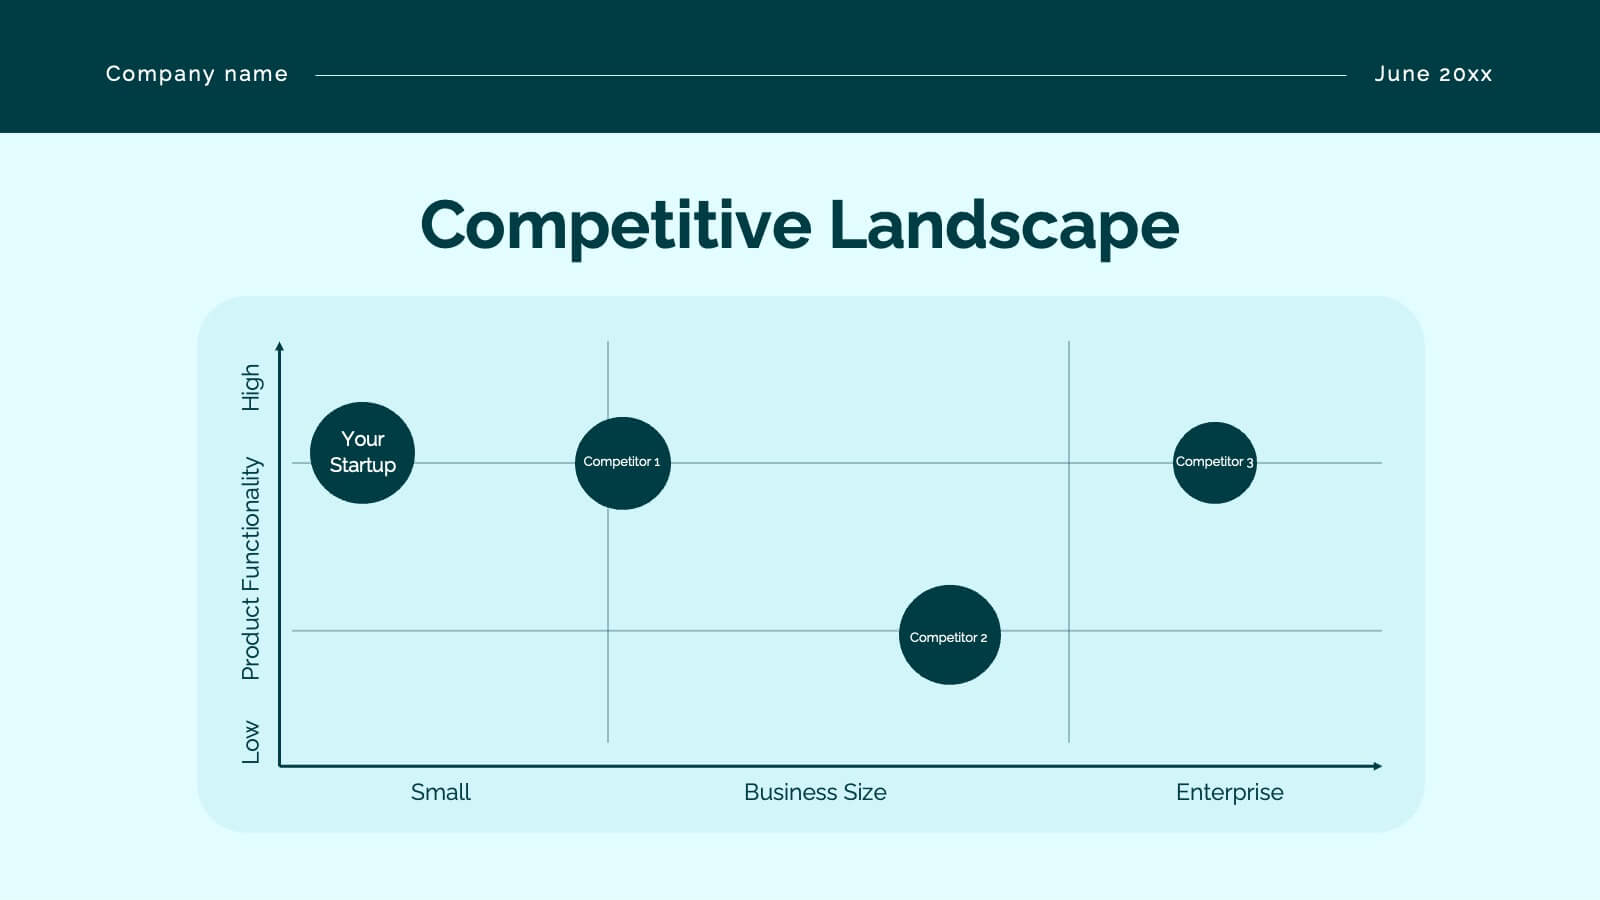
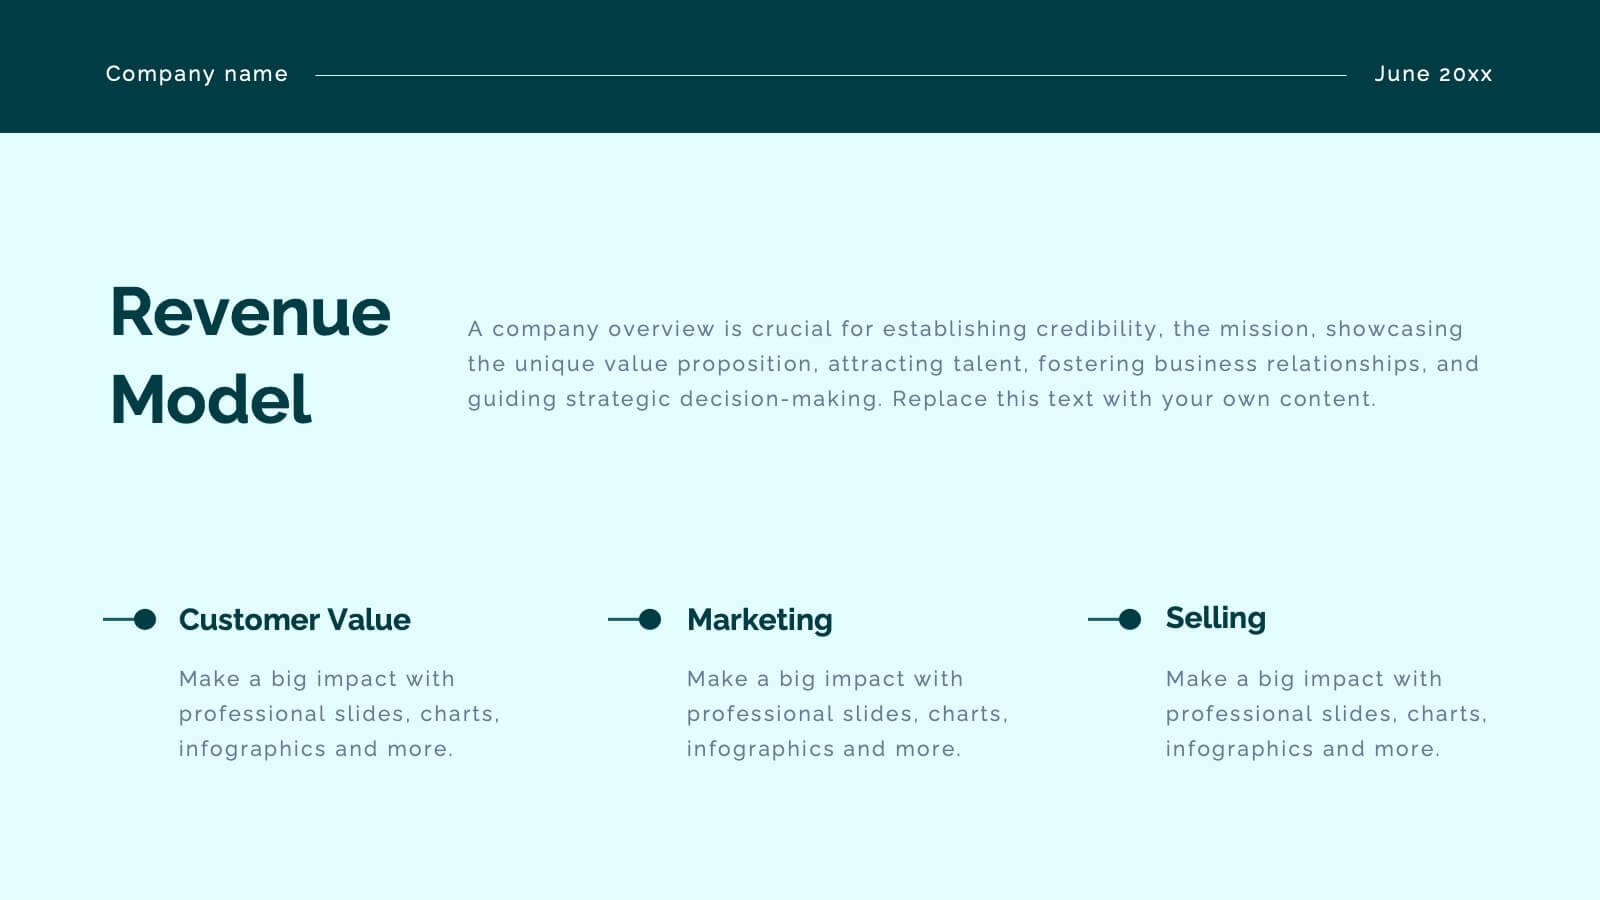
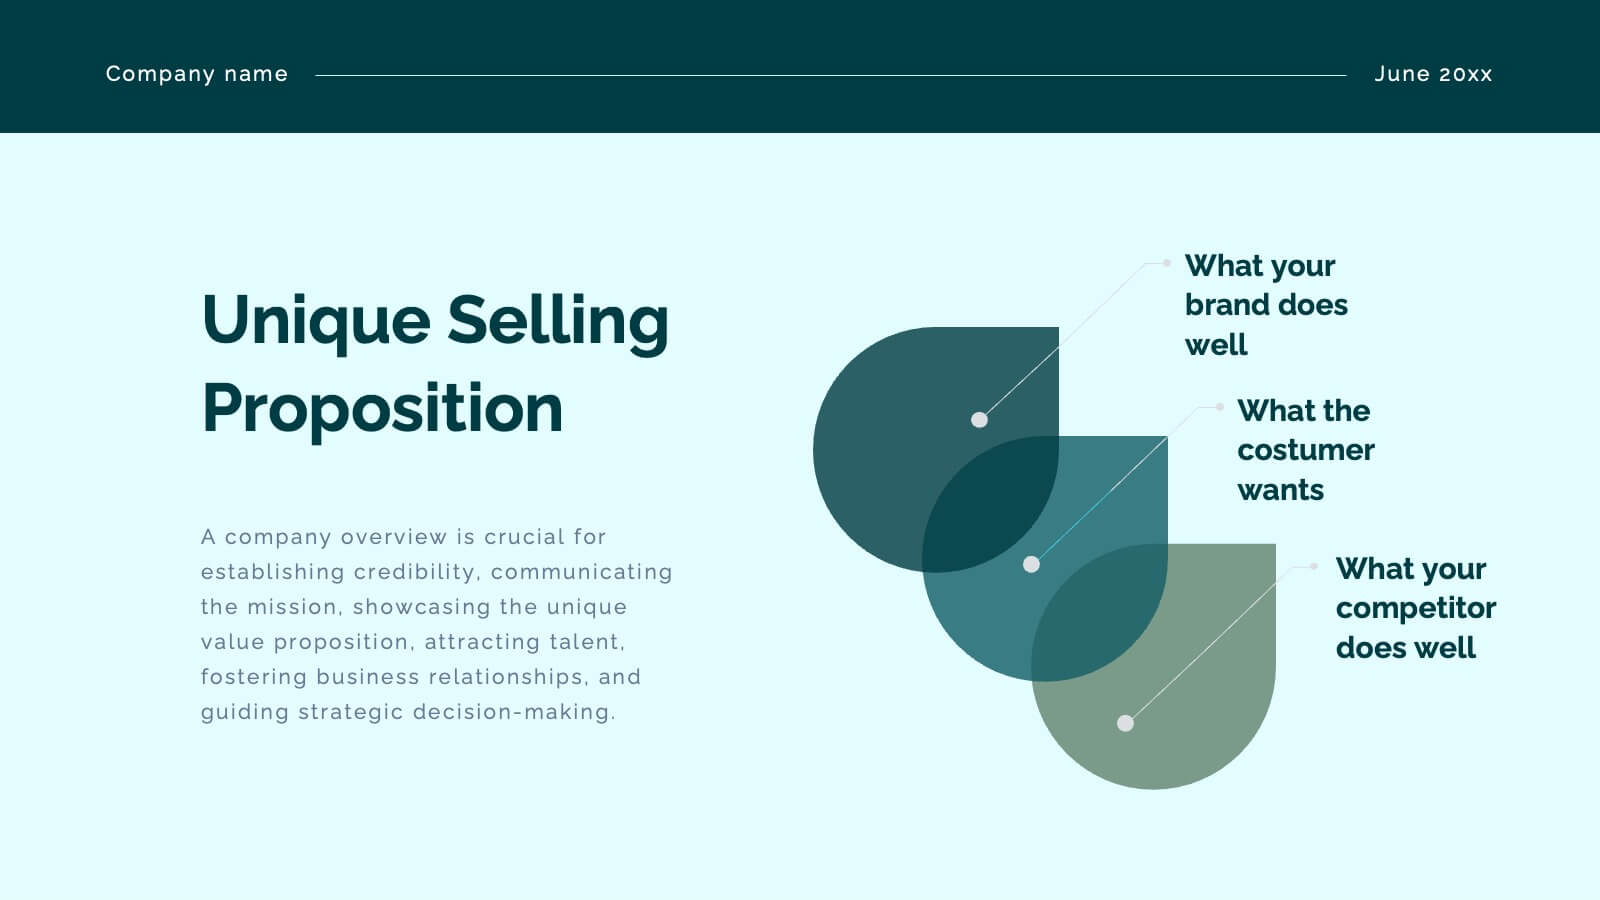
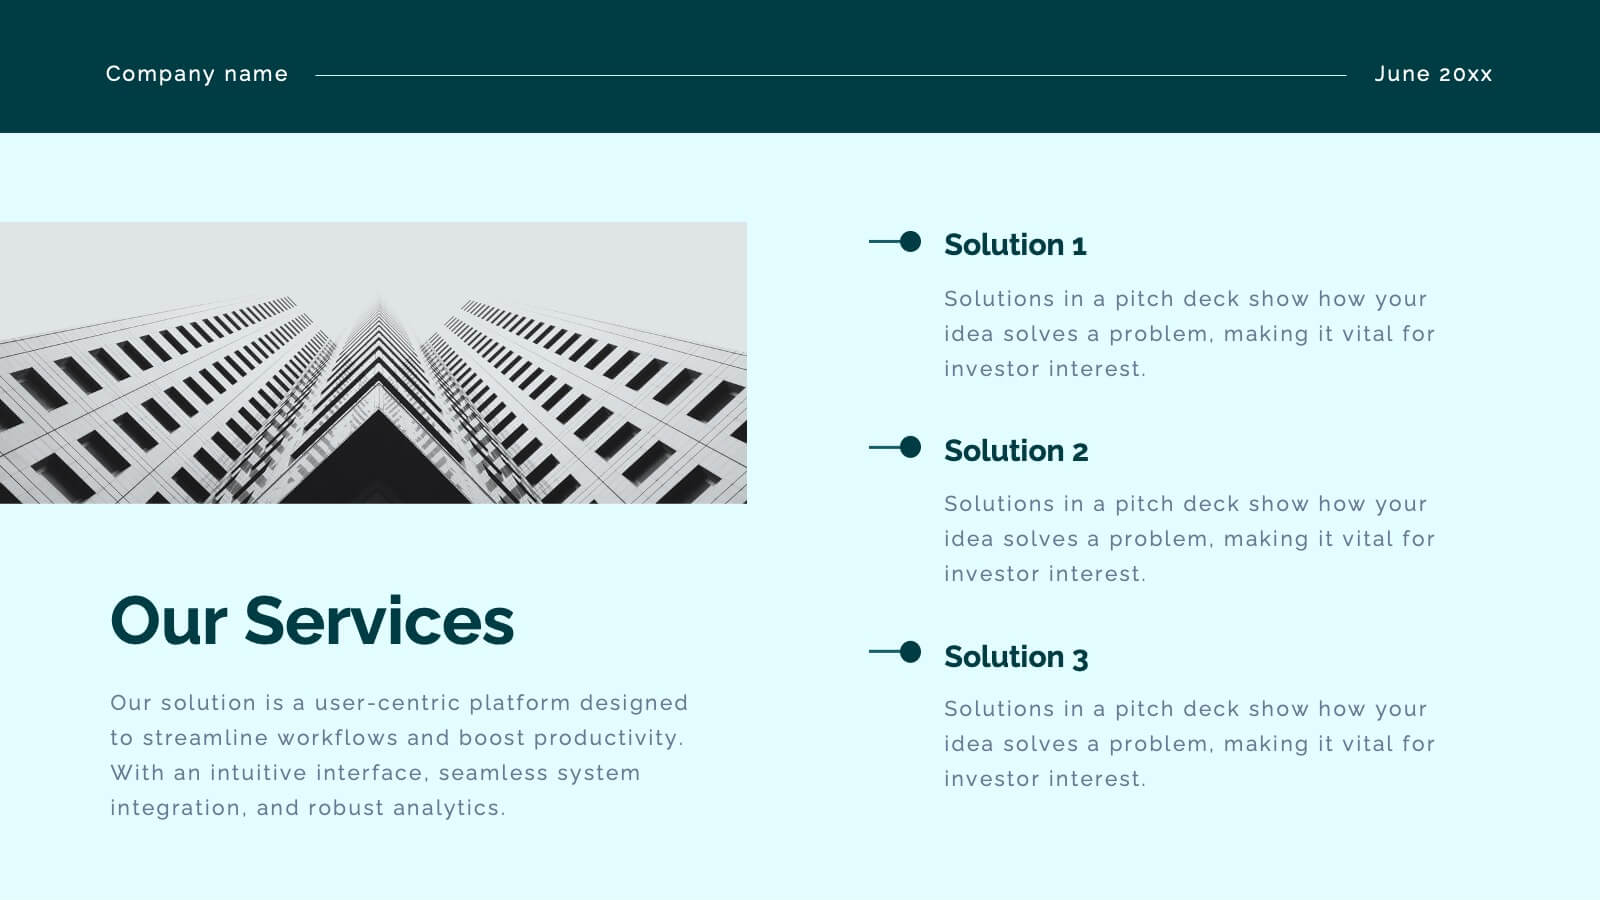
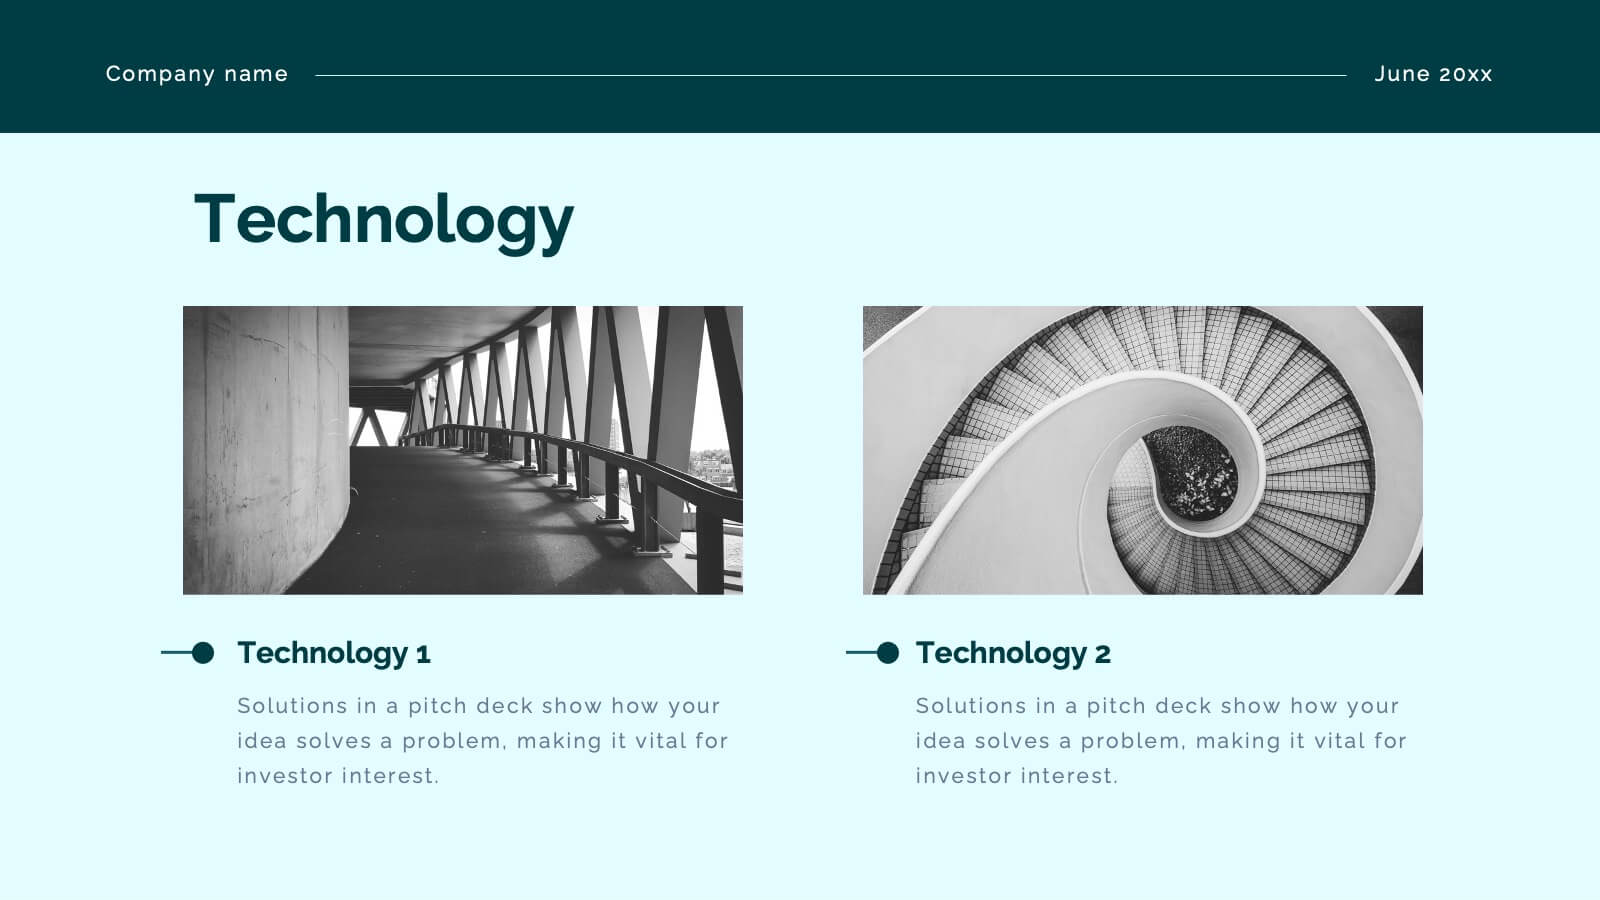
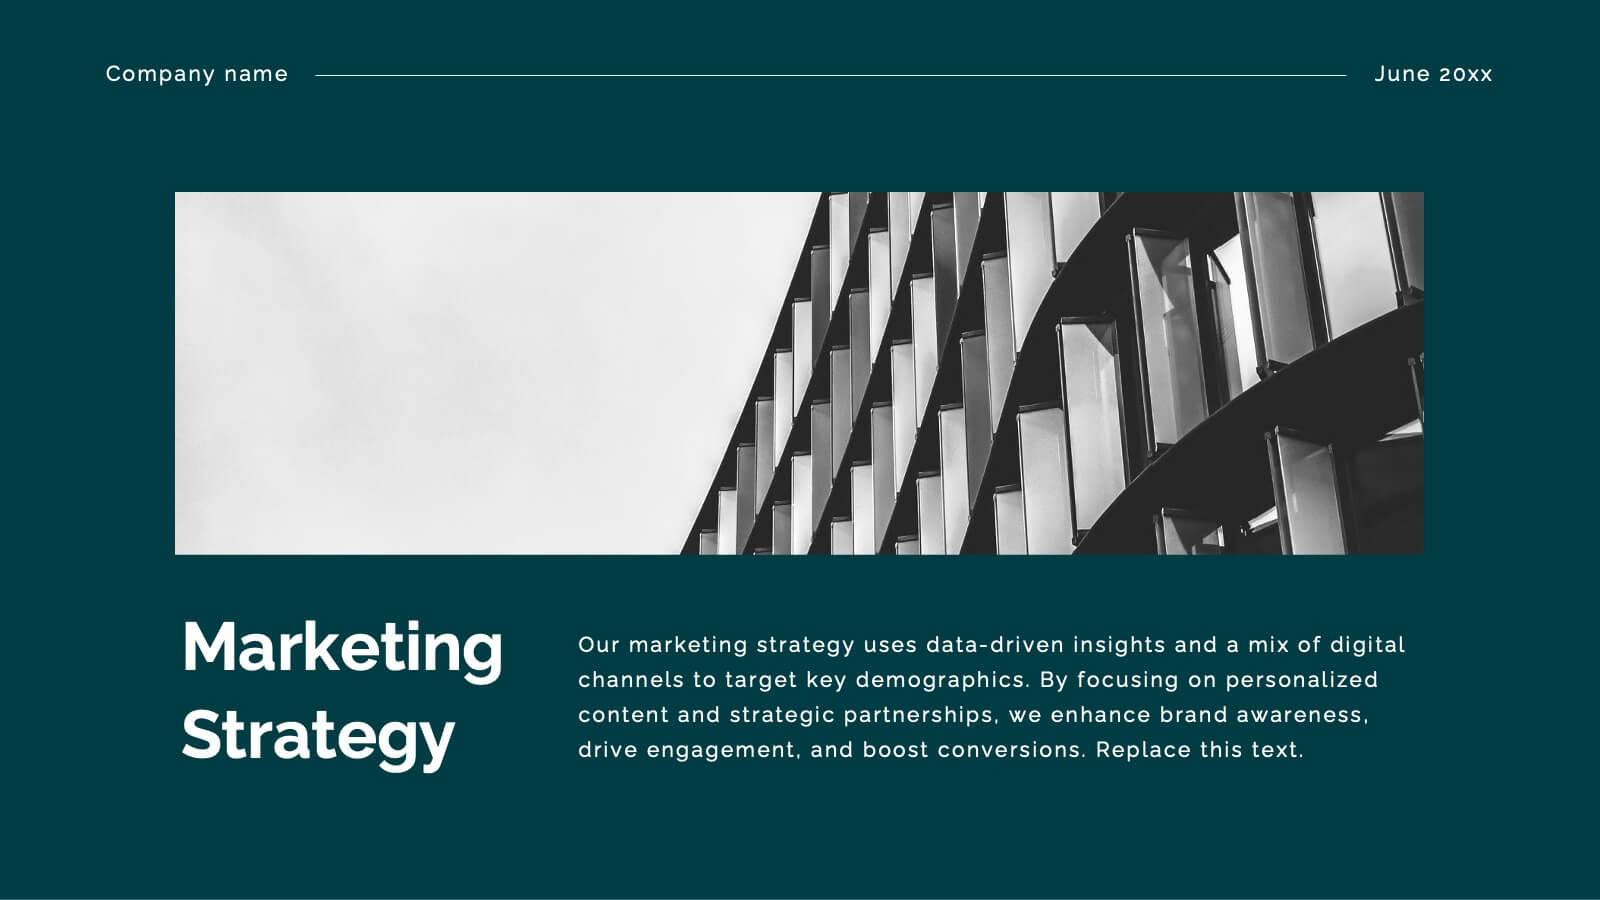
Crest Investor Pitch Presentation Presentation
Unleash your potential with this powerful pitch deck template! Tailored for presenting innovative business ideas, it features slides for company overview, market opportunity, competitive landscape, and financial projections. Clearly communicate your value proposition and impress investors with professional design and concise content. Compatible with PowerPoint, Keynote, and Google Slides for seamless presentations on any platform.