


Características


¿Tienes alguna pregunta?
Recomendar


6 diapositivas
Agile Development Methodology Infographic
Discover a visually engaging way to present the Agile Development Methodology with our versatile infographic template. Perfect for Powerpoint, Google Slides, and Keynote users, this template breaks down complex Agile concepts into easy-to-understand visuals. Whether you're illustrating the cycle of sprints, the importance of daily scrums, or the process of backlog refinement and reviews, our infographic makes it simple. It’s ideal for project managers, agile coaches, scrum masters, and team members looking to communicate the flexibility and dynamics of Agile workflows. Adopt a clear, concise approach to explaining iterative development and foster a better understanding in your audience with this user-friendly template.


14 diapositivas
Business Expense and Cost Control Presentation
Optimize your financial strategy with the Business Expense and Cost Control Presentation template. This slide helps visualize cost management, spending efficiency, and budgeting strategies with a clear, data-driven layout. Ideal for financial planners, business analysts, and executives aiming to streamline operational expenses. Fully customizable in PowerPoint, Keynote, and Google Slides.


6 diapositivas
Prioritized Business List Format
Streamline your priorities with this clean and structured list layout, perfect for project steps, goals, or ranking business initiatives. Featuring five connected stages with icons, this editable design highlights key information in an easy-to-follow format. Fully customizable in PowerPoint, Keynote, and Google Slides.


21 diapositivas
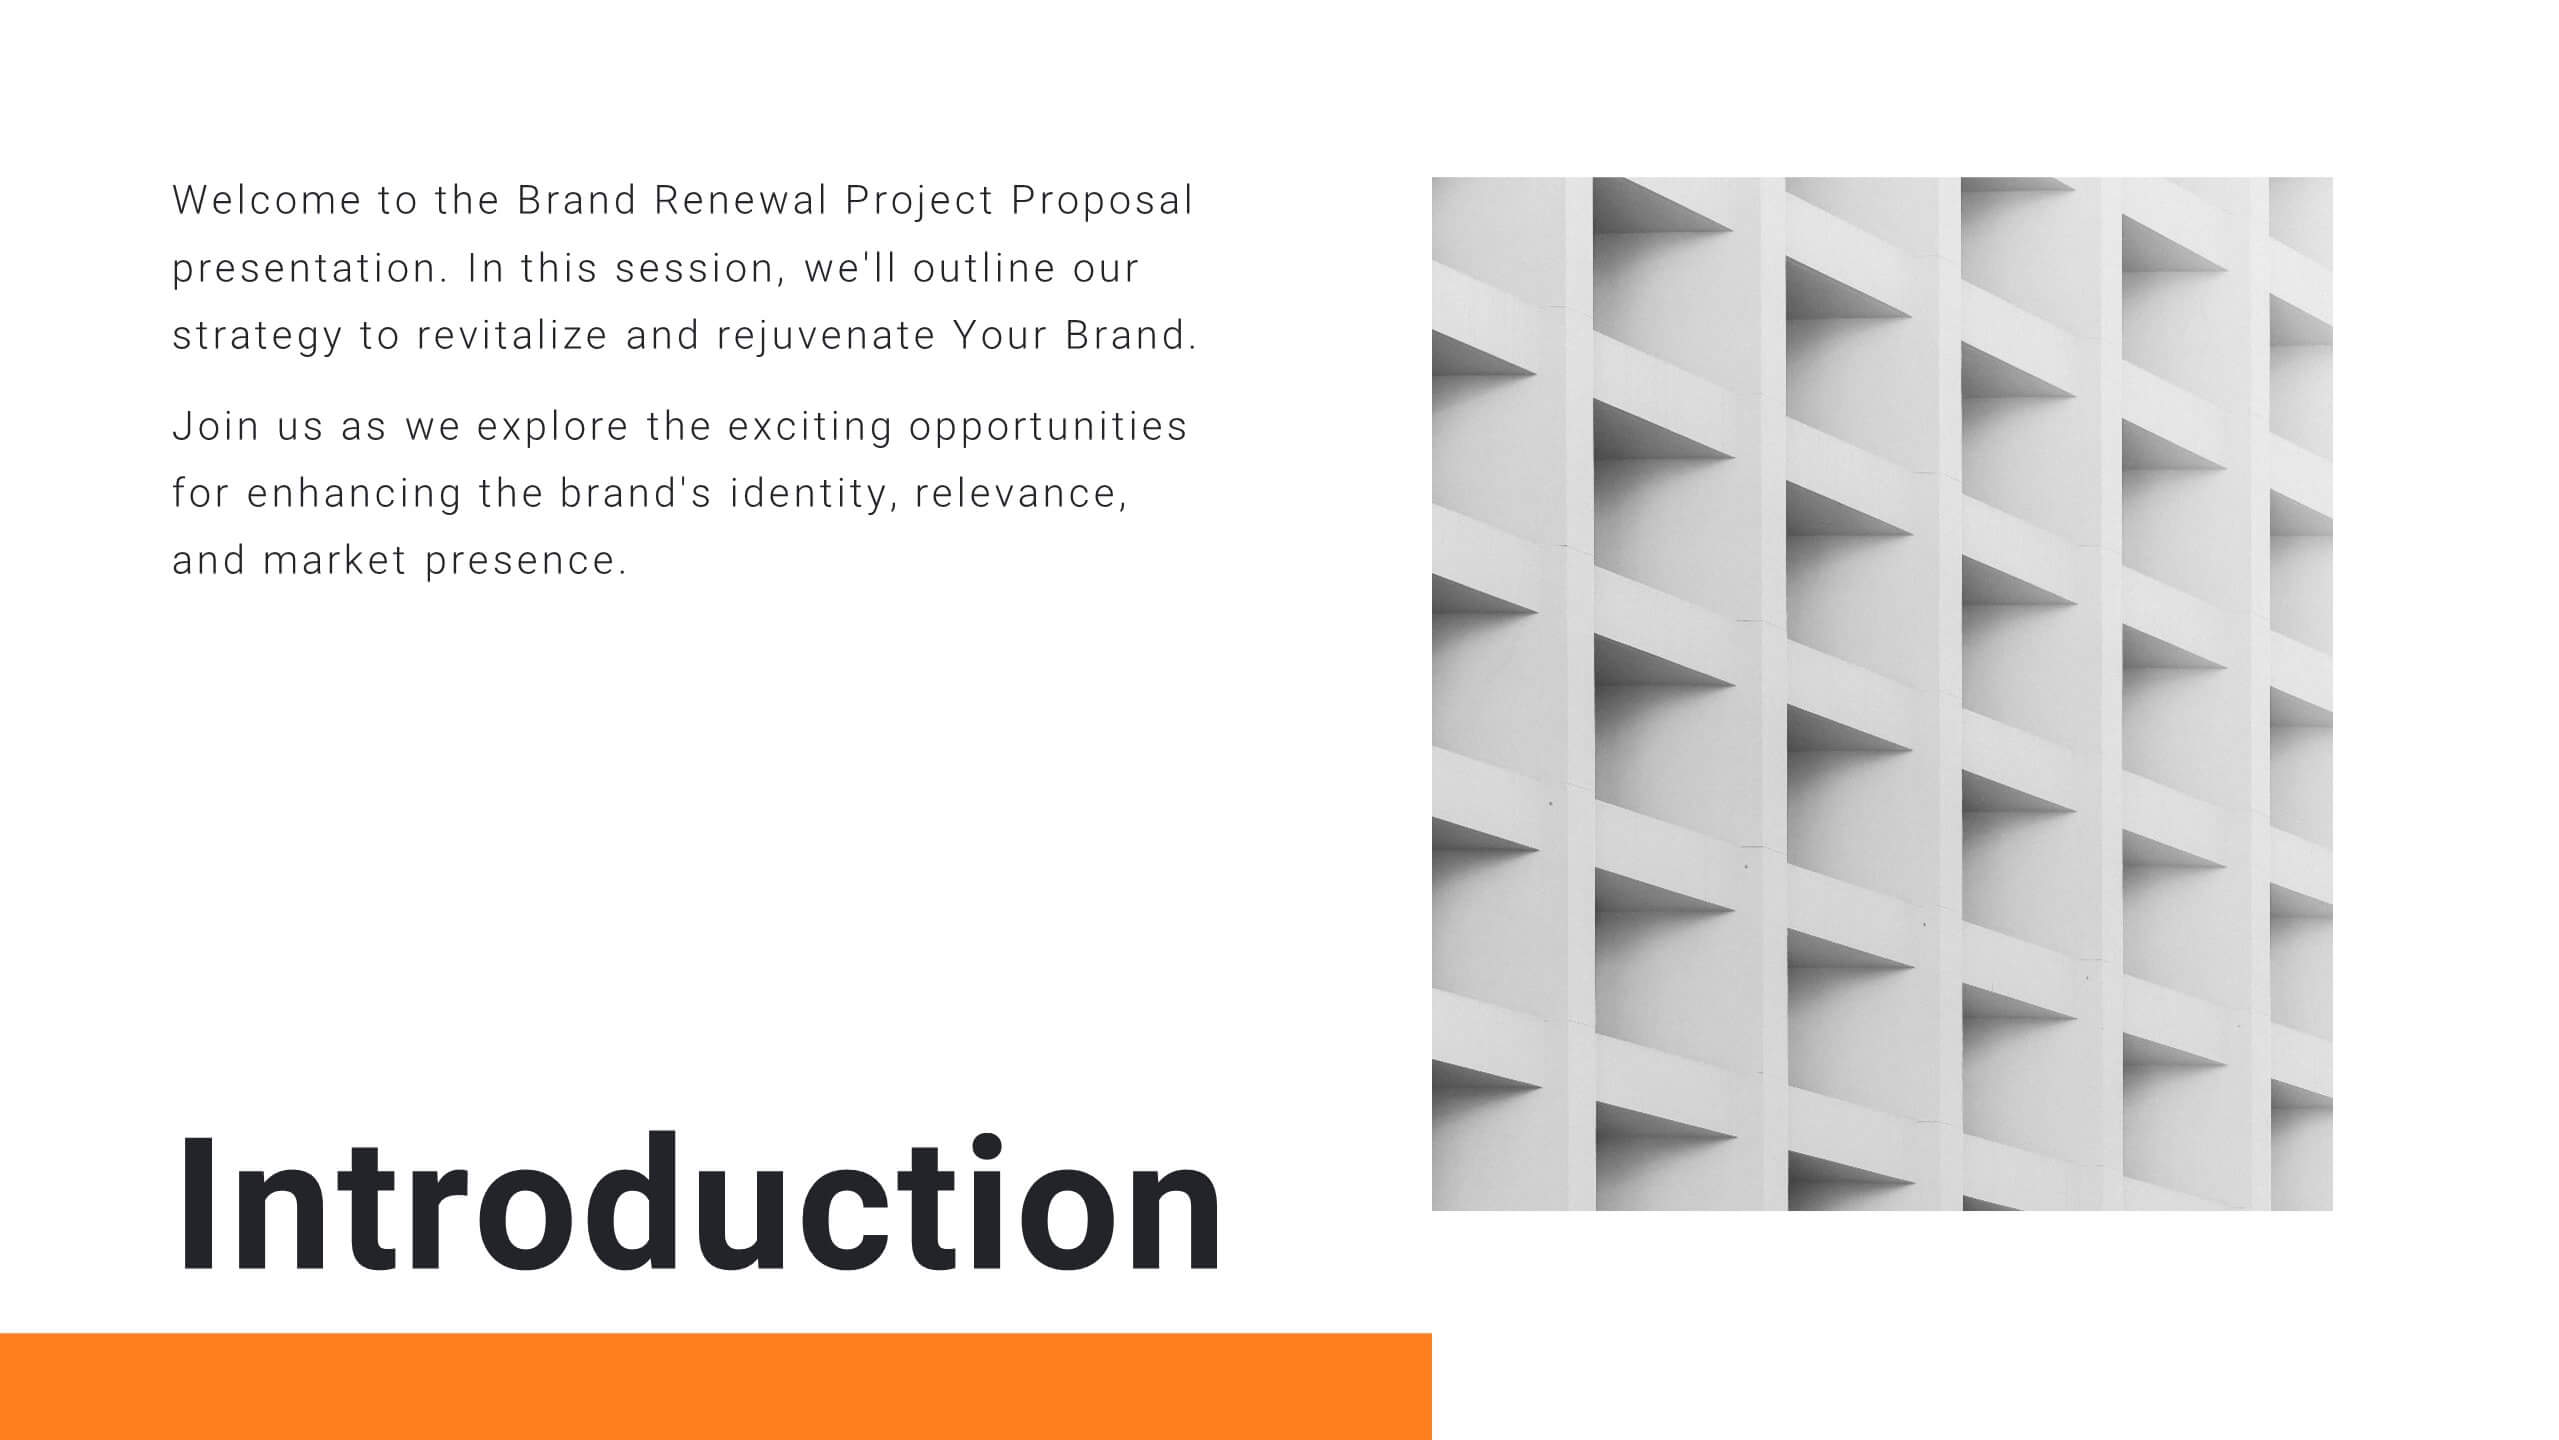
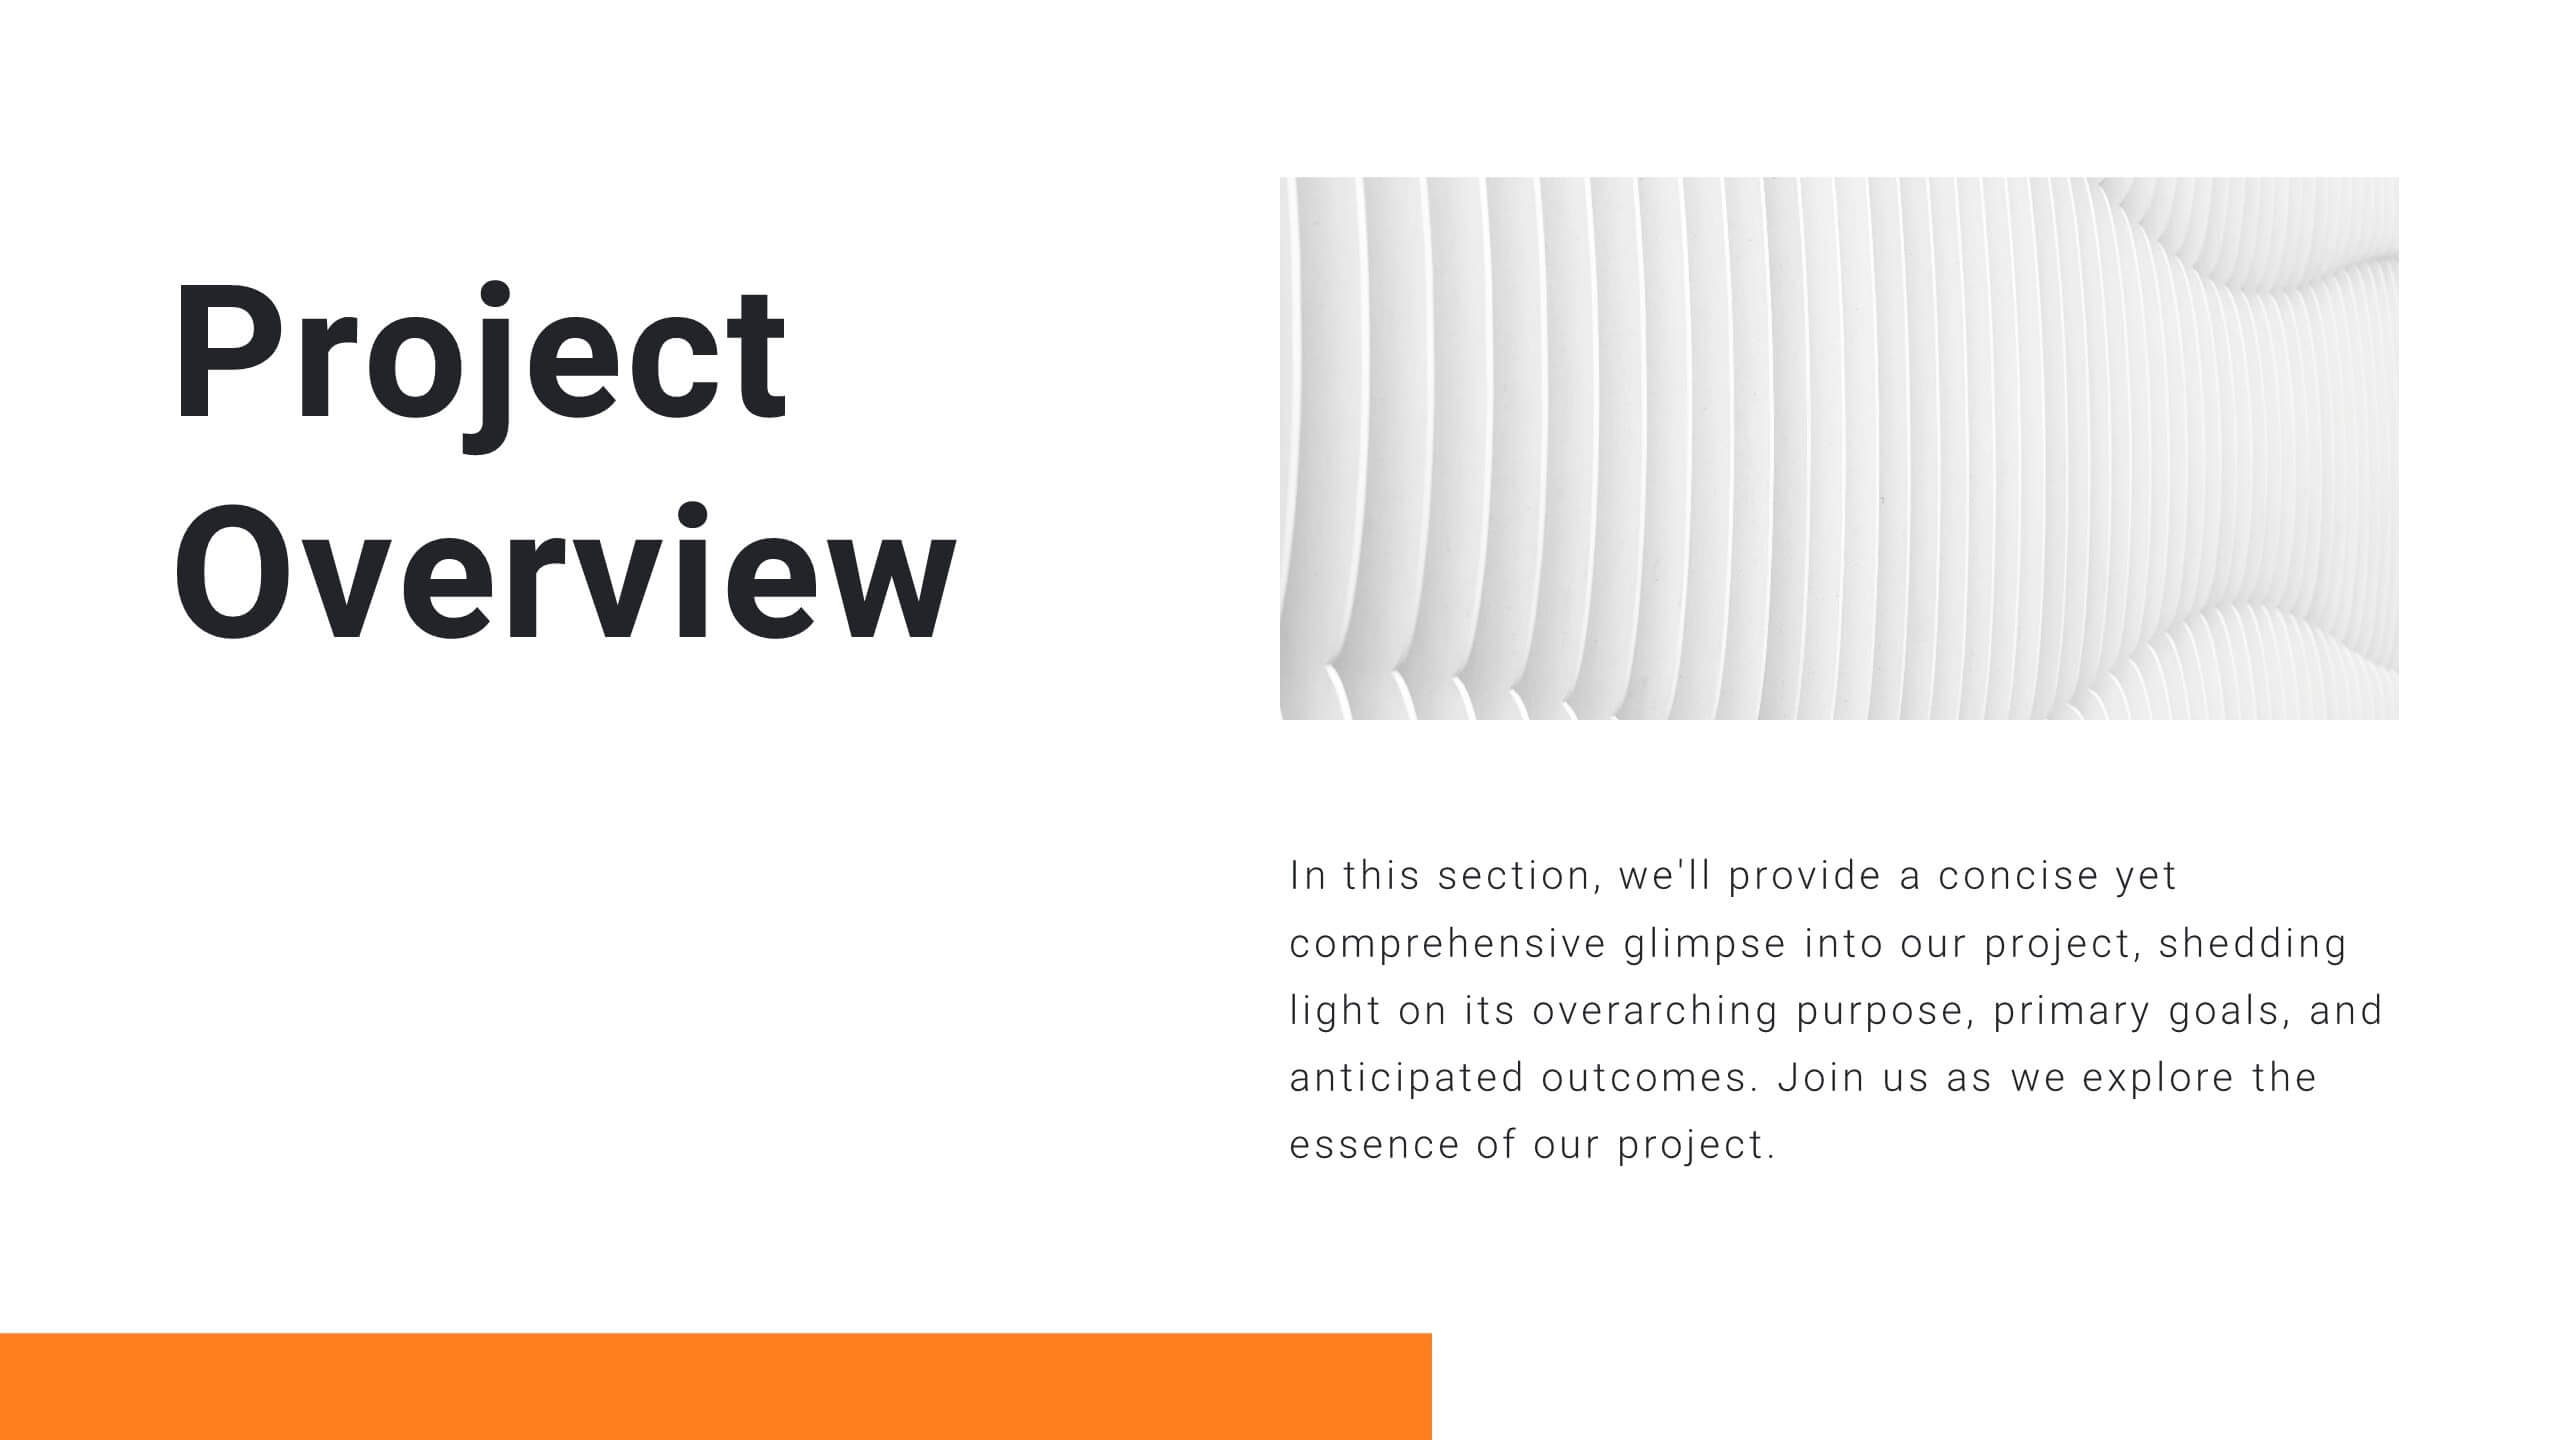
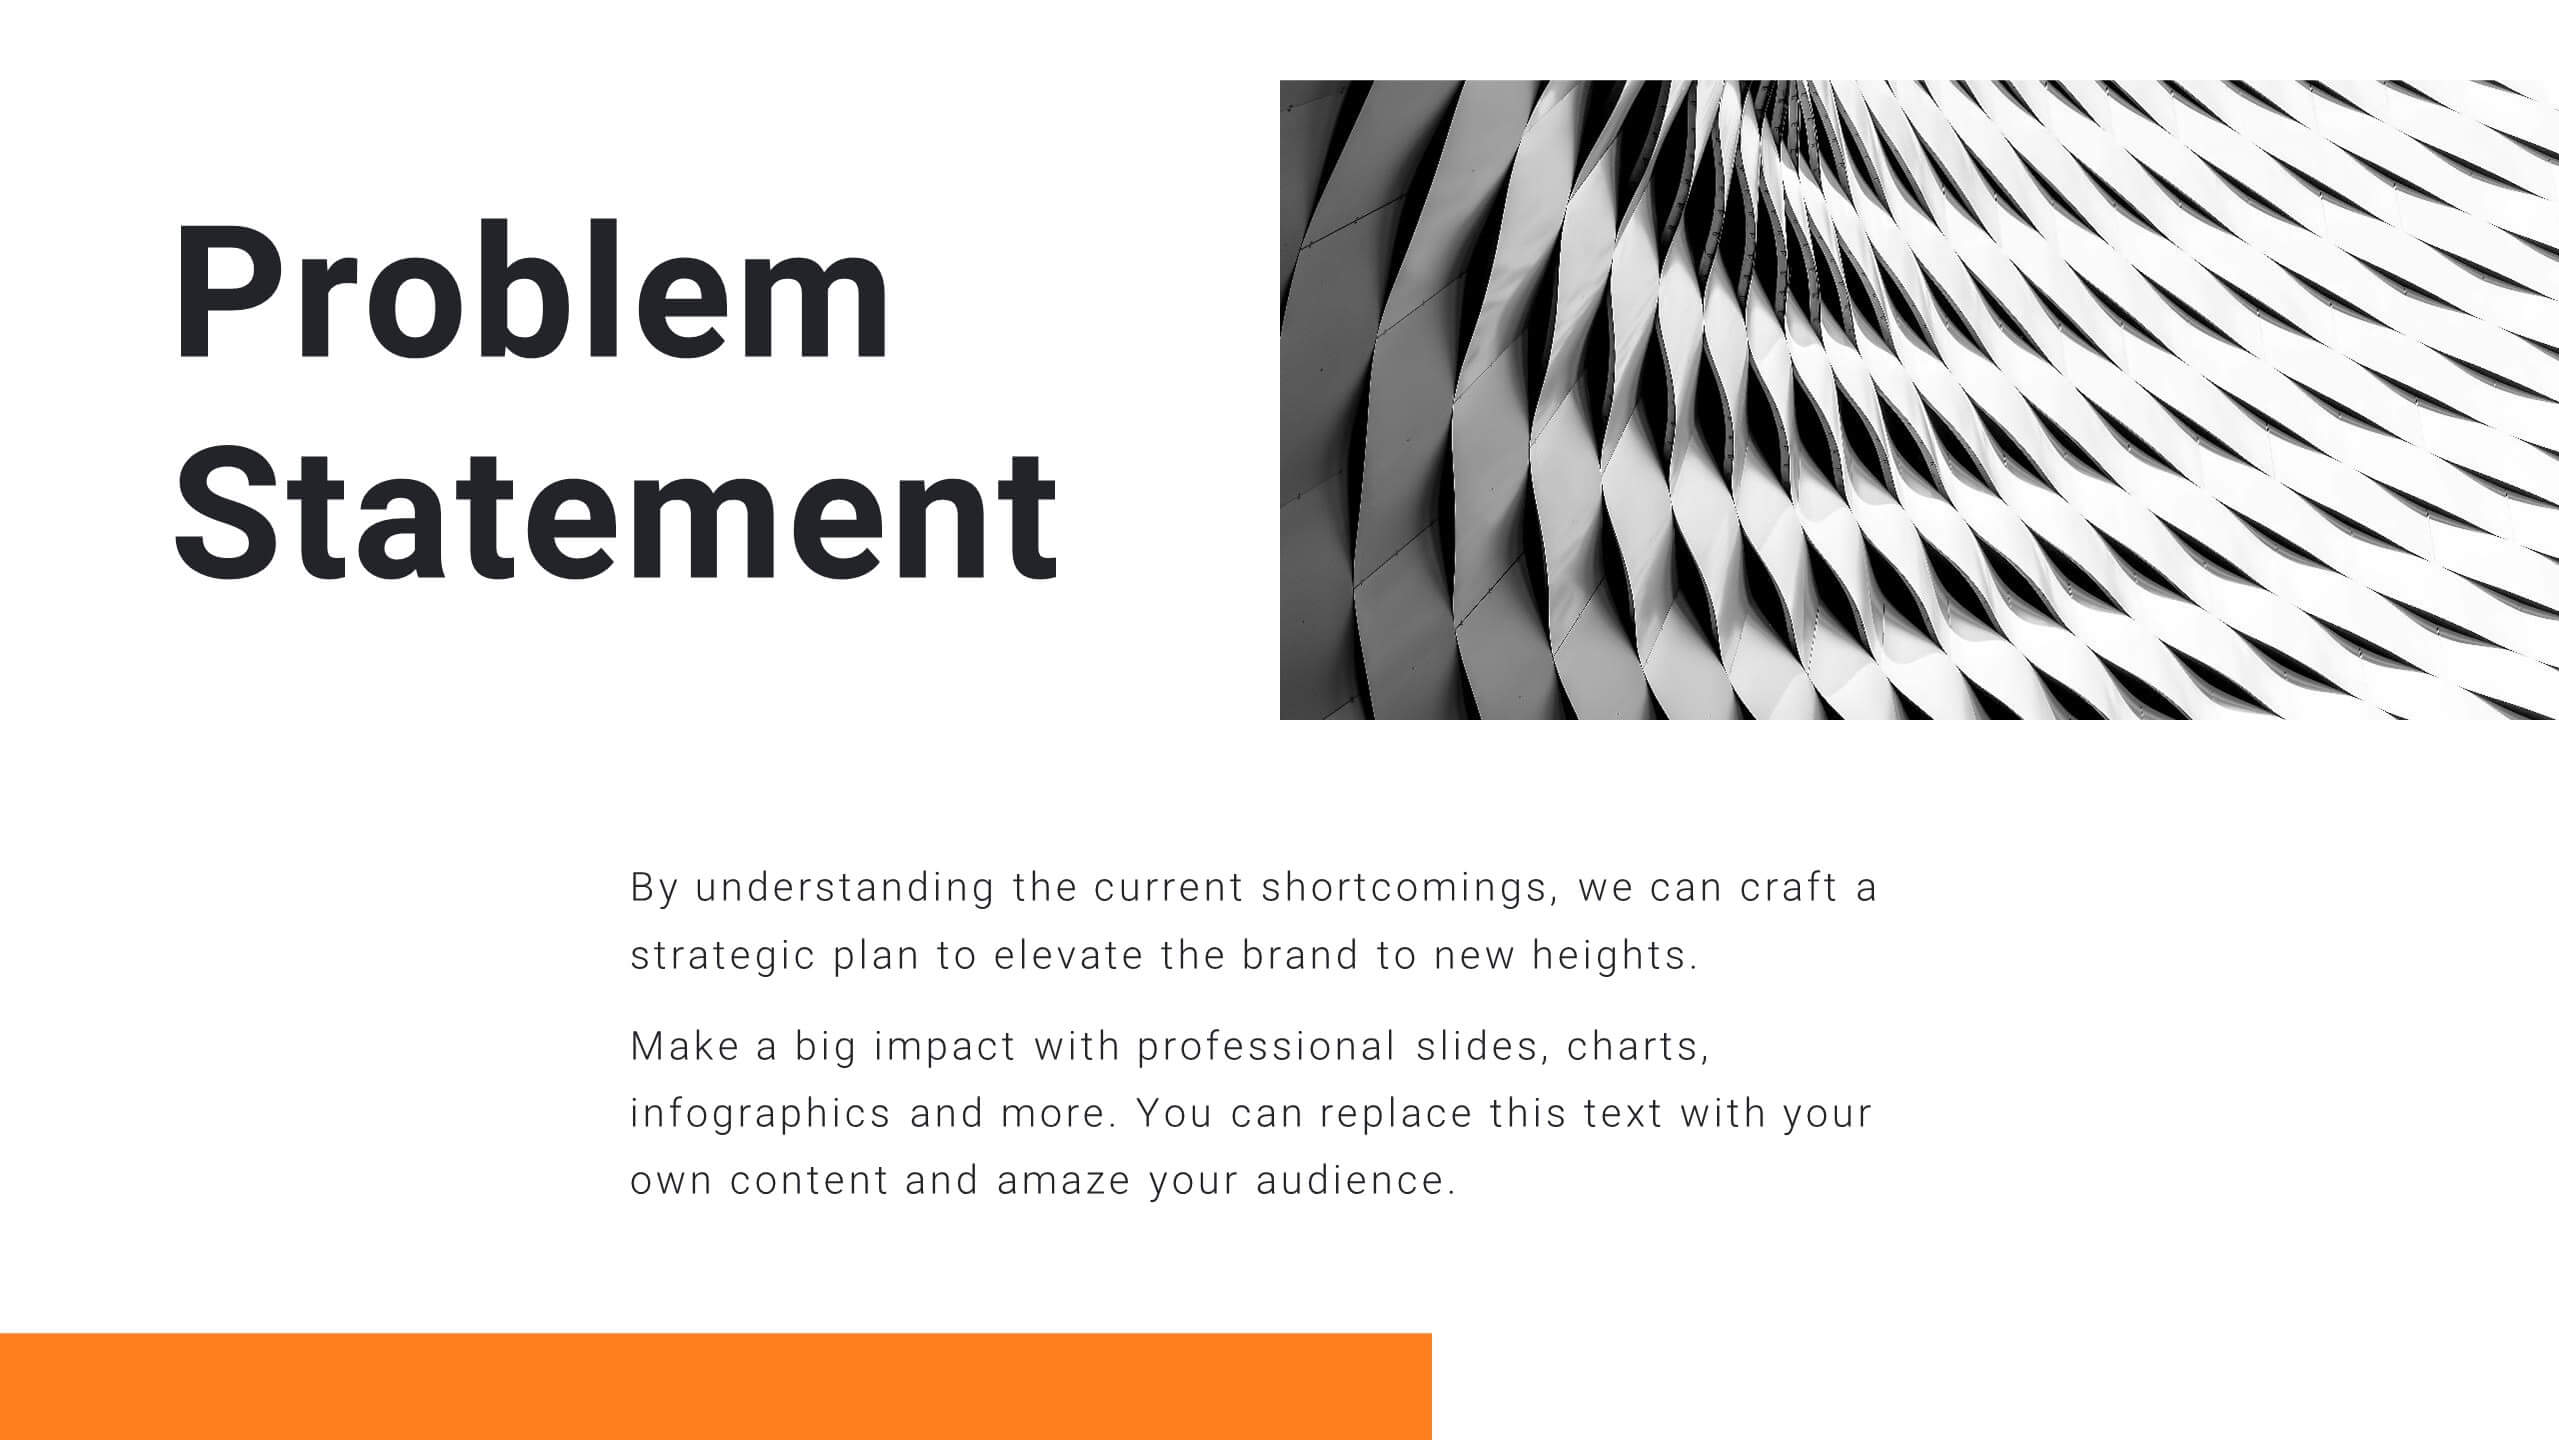
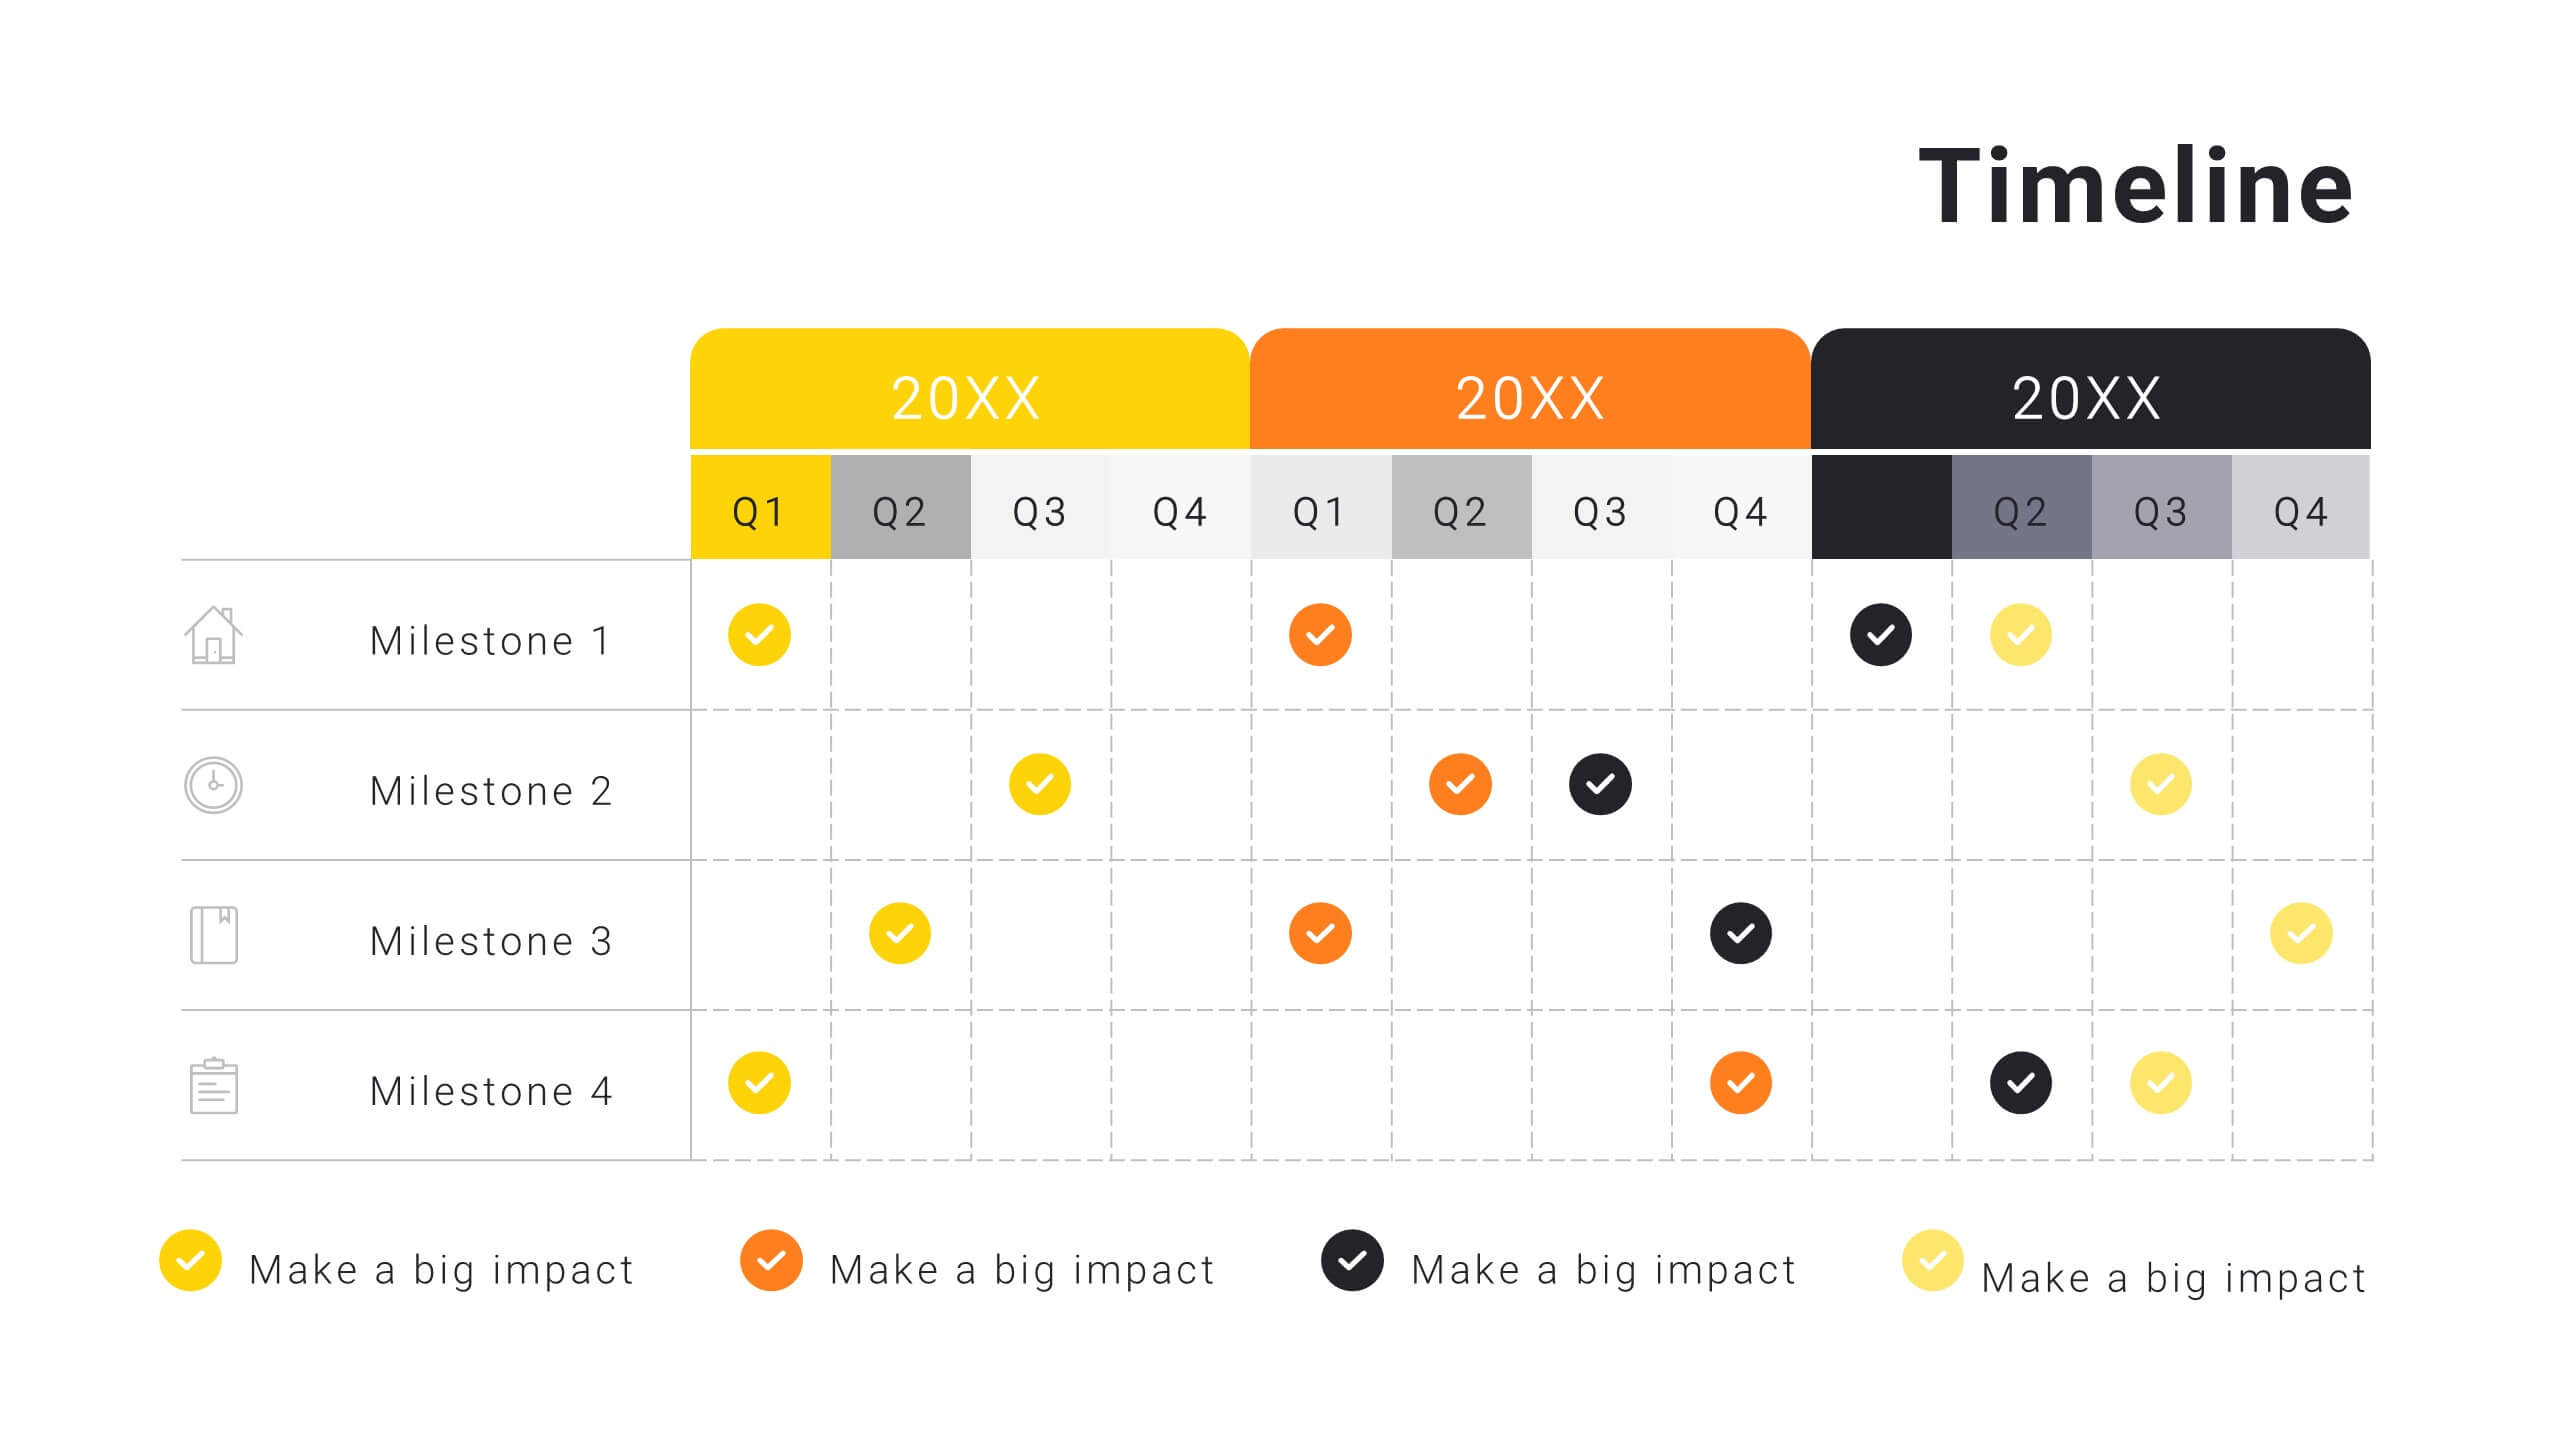
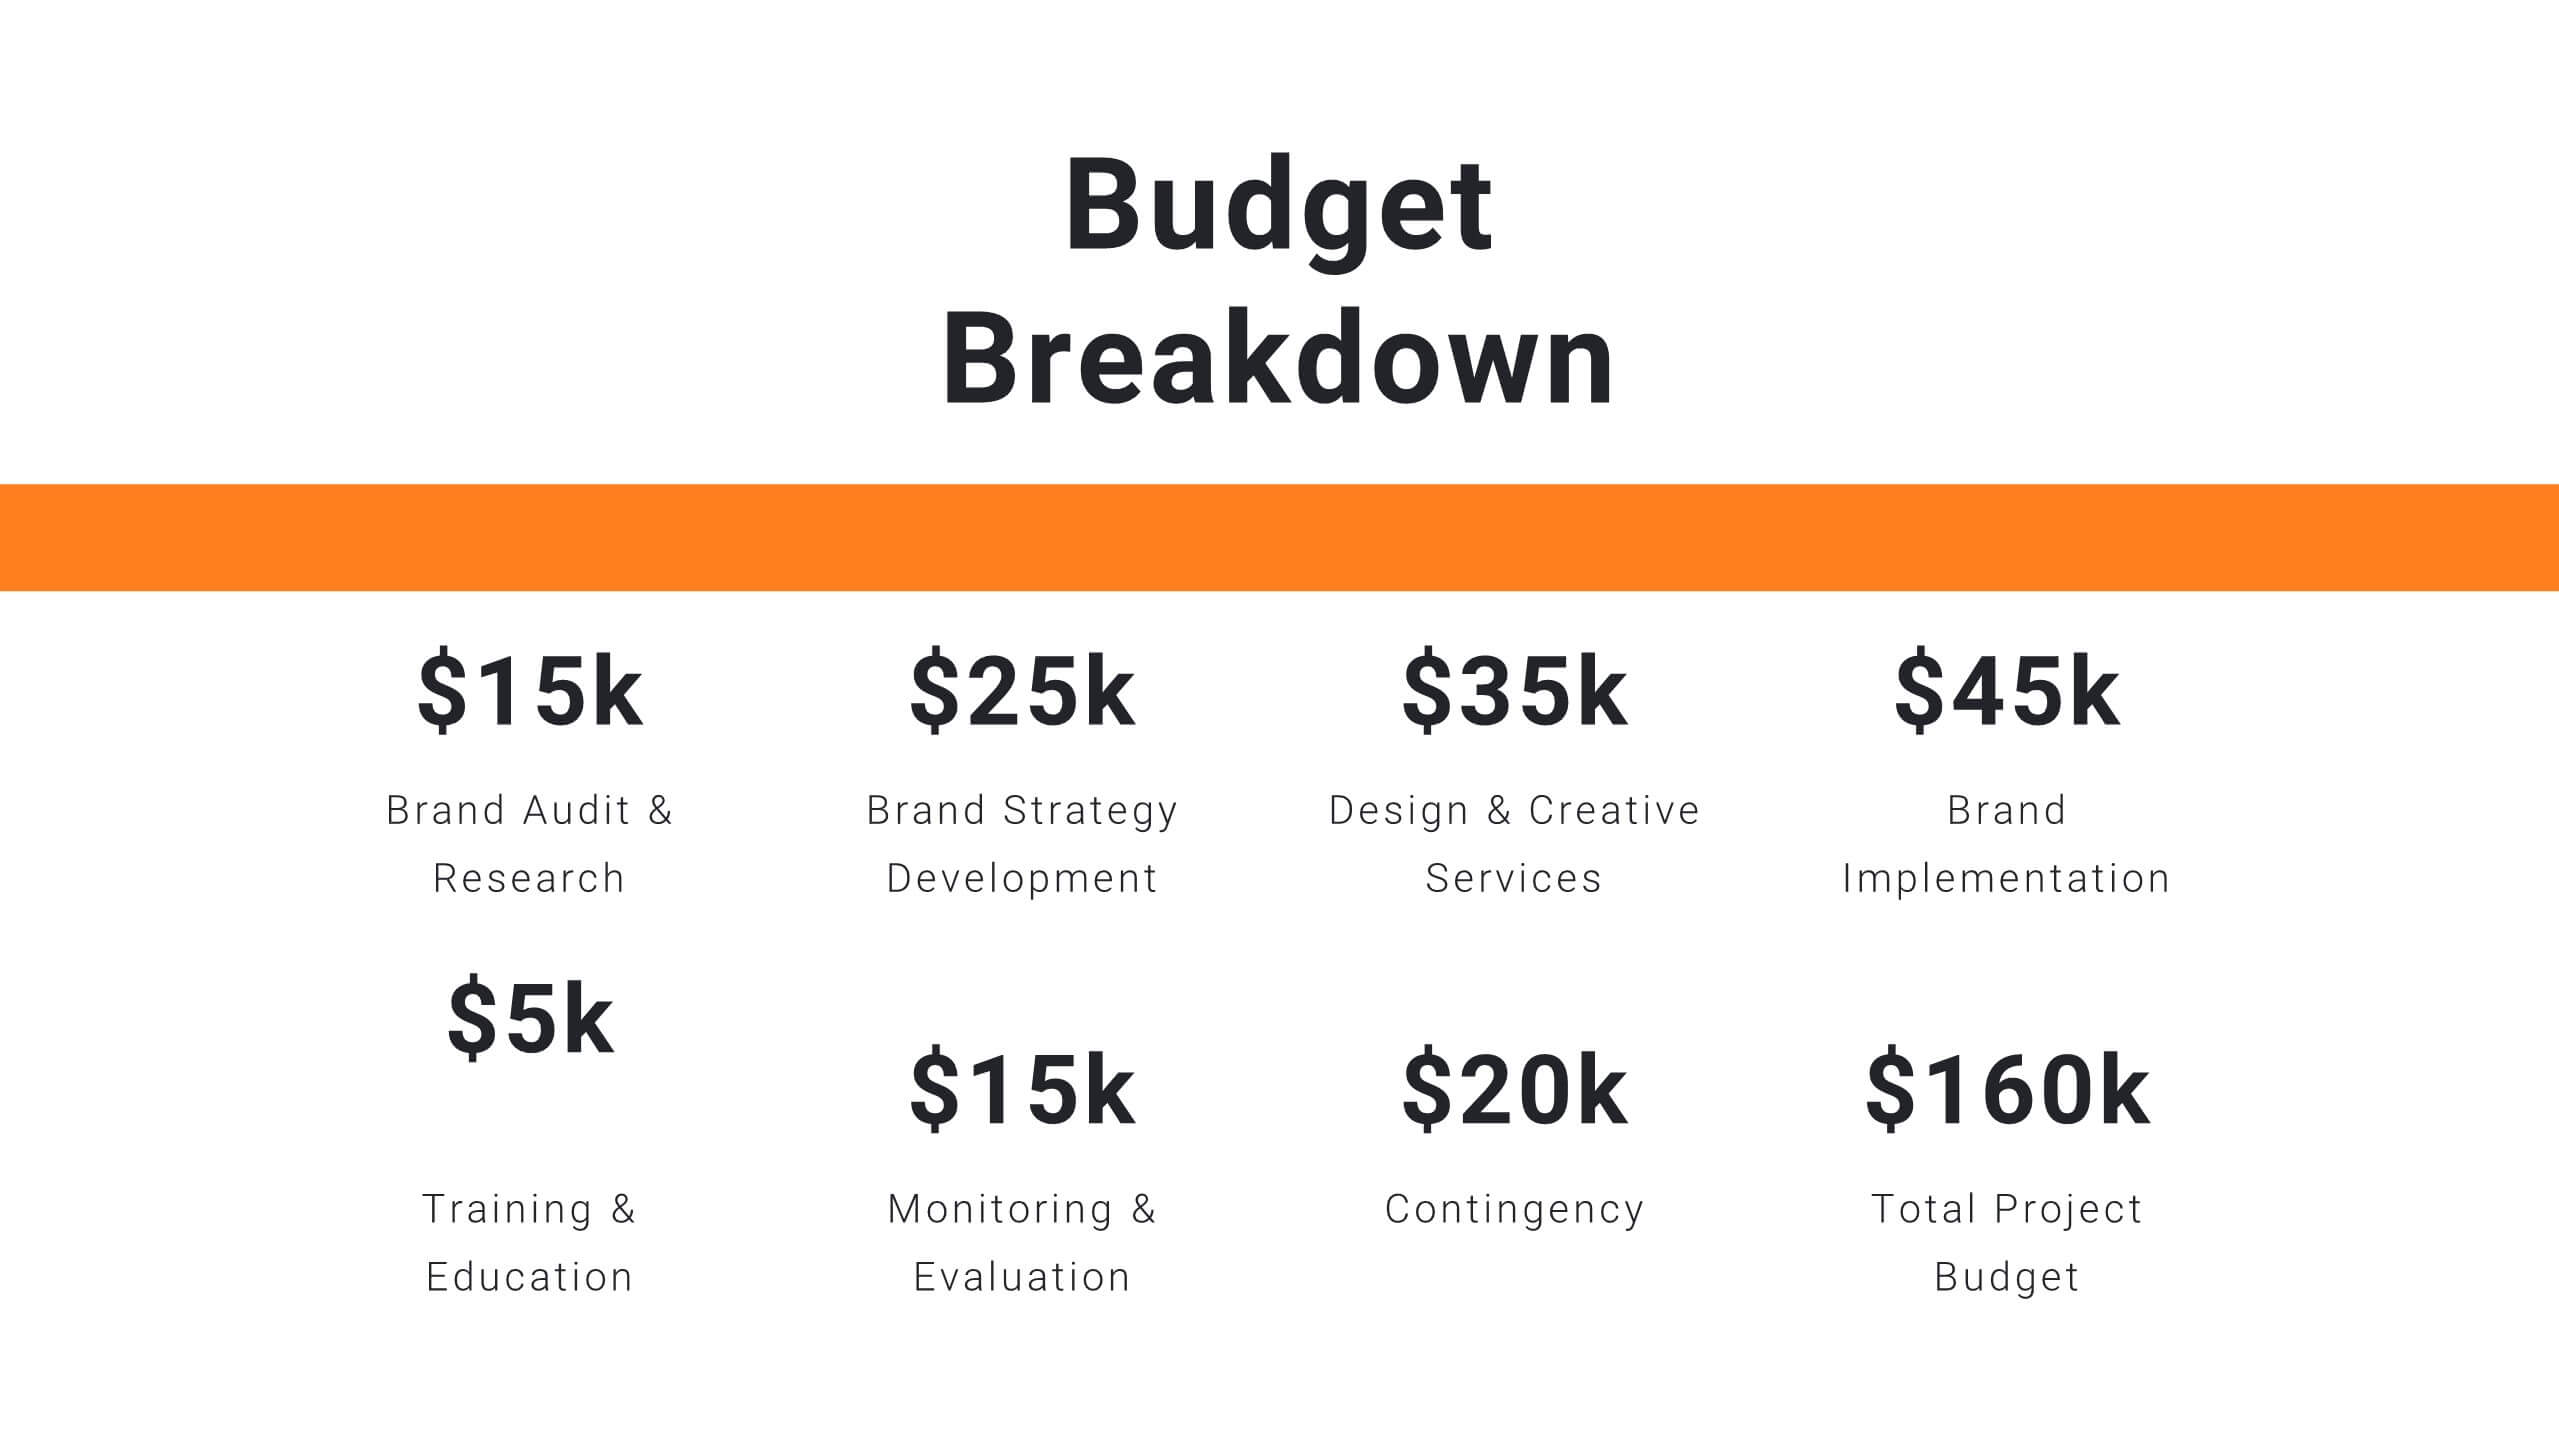
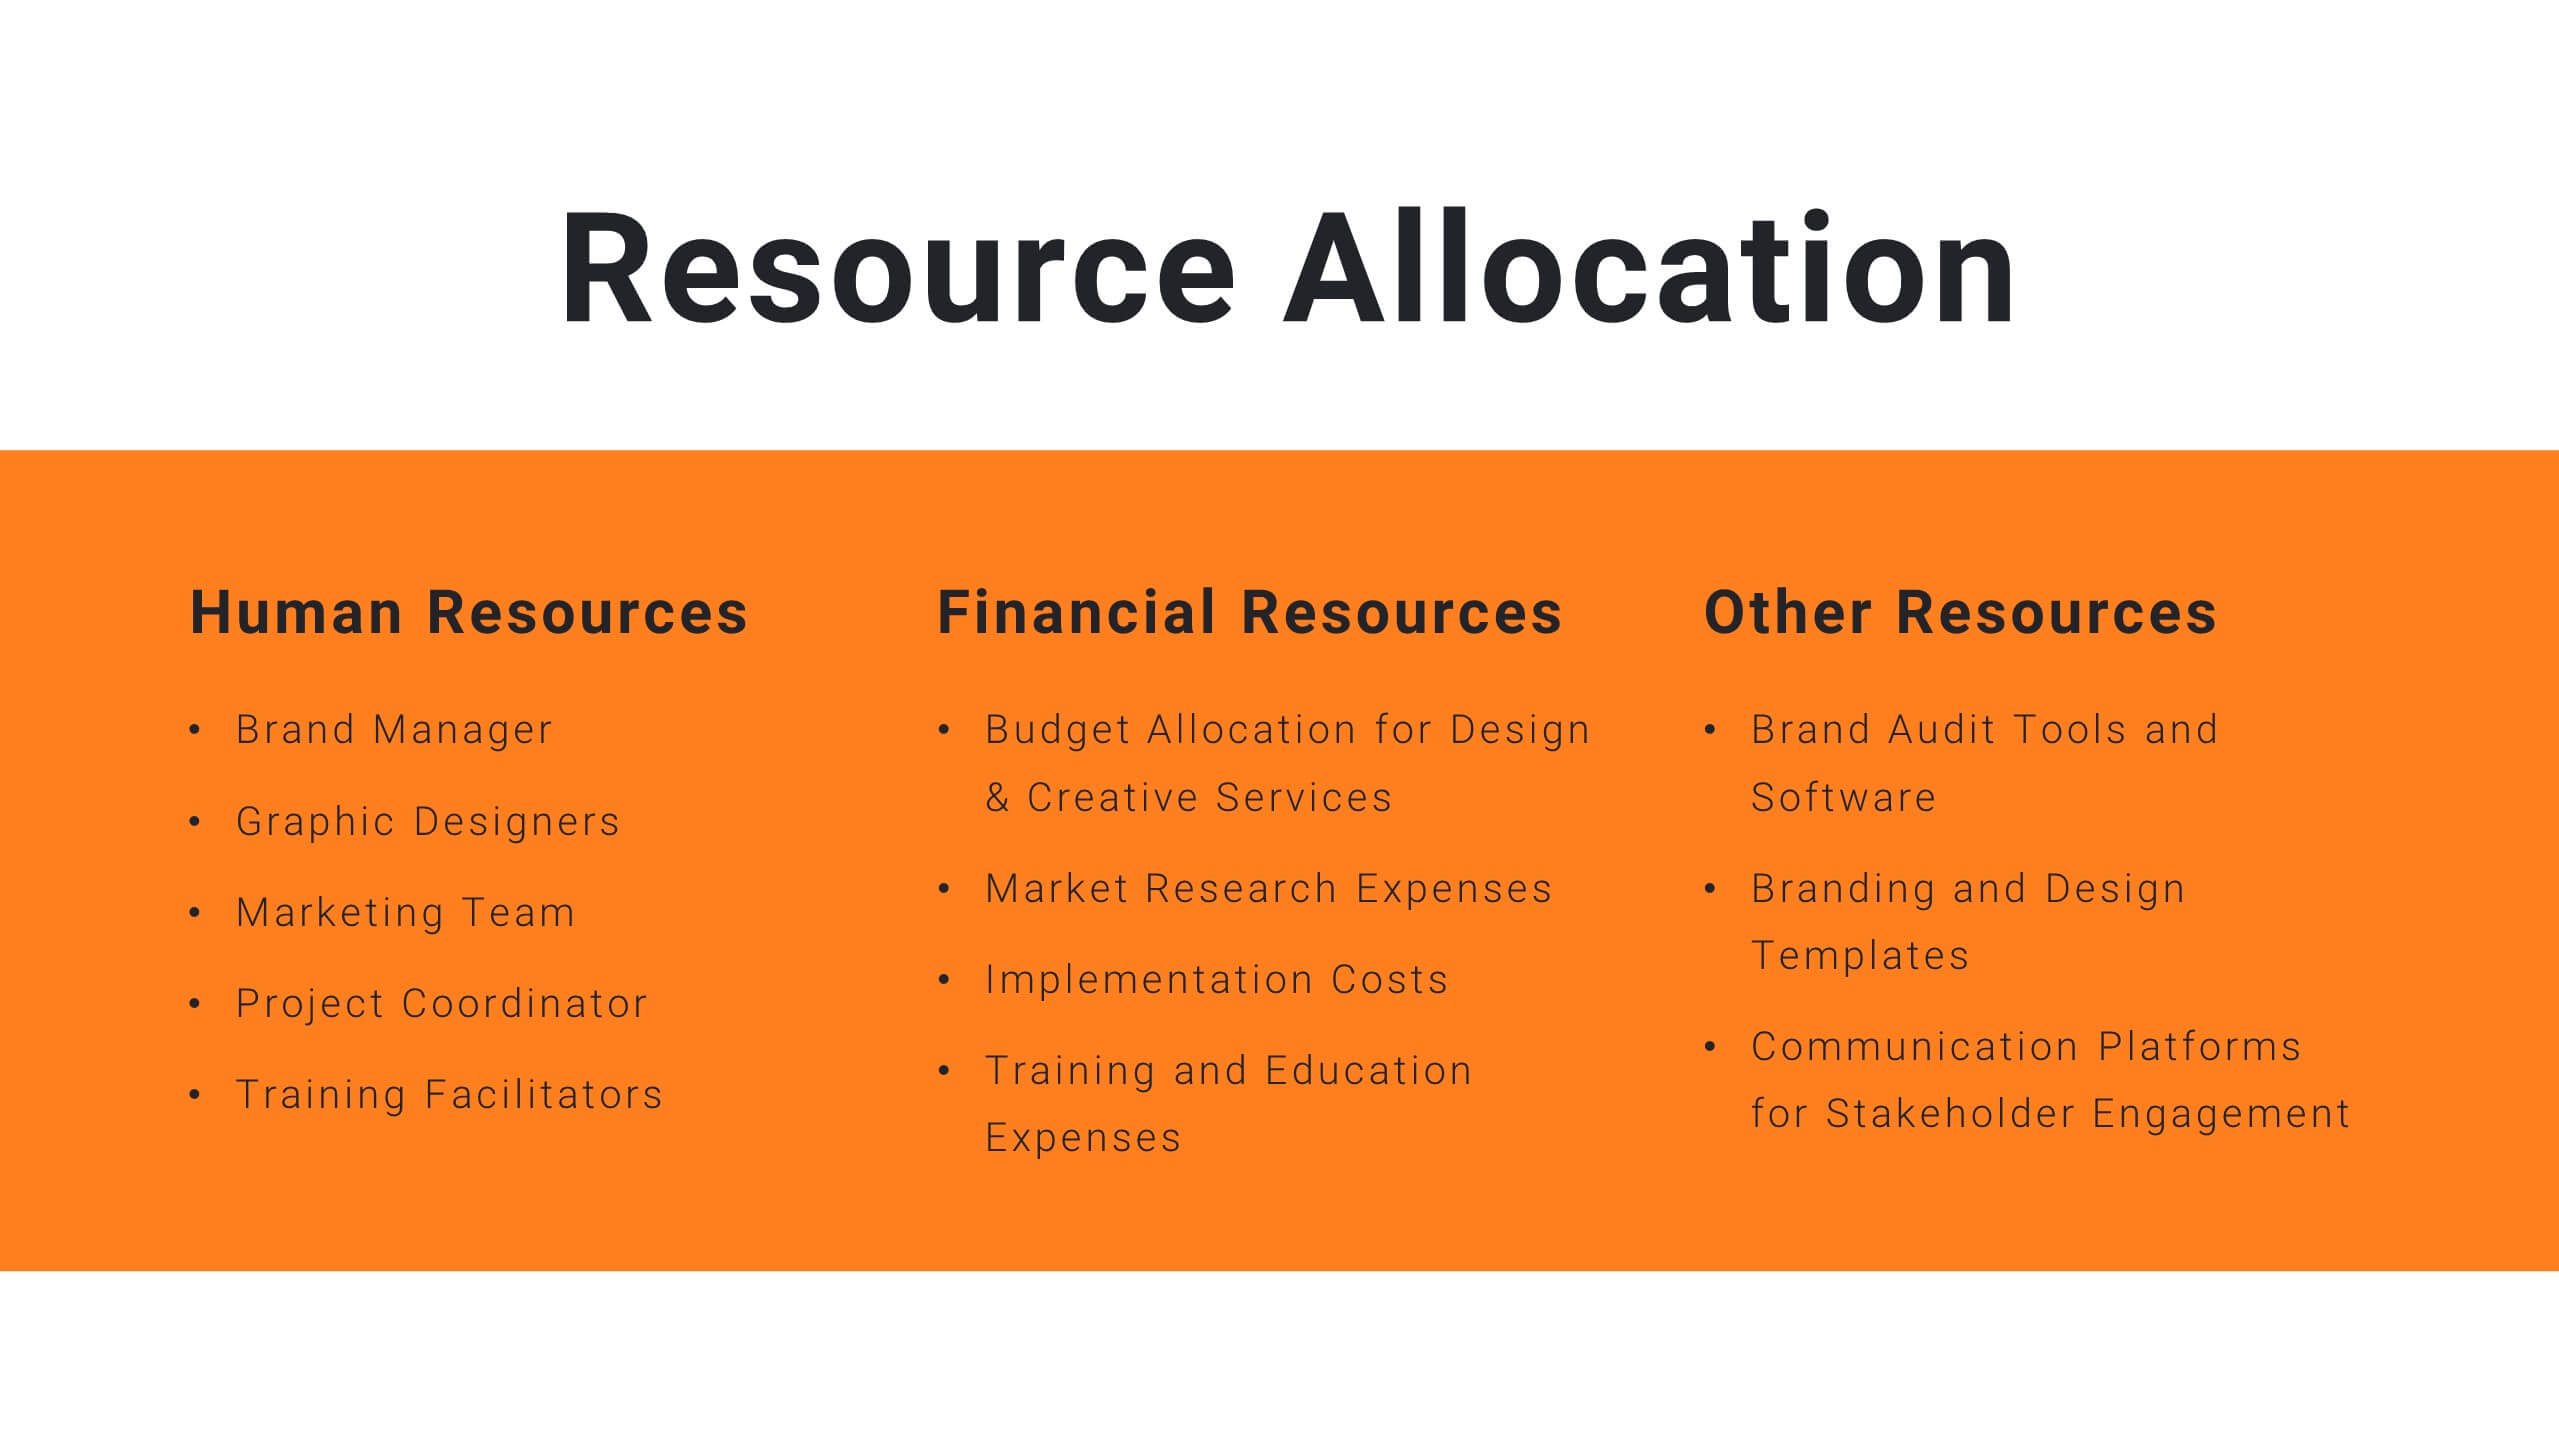
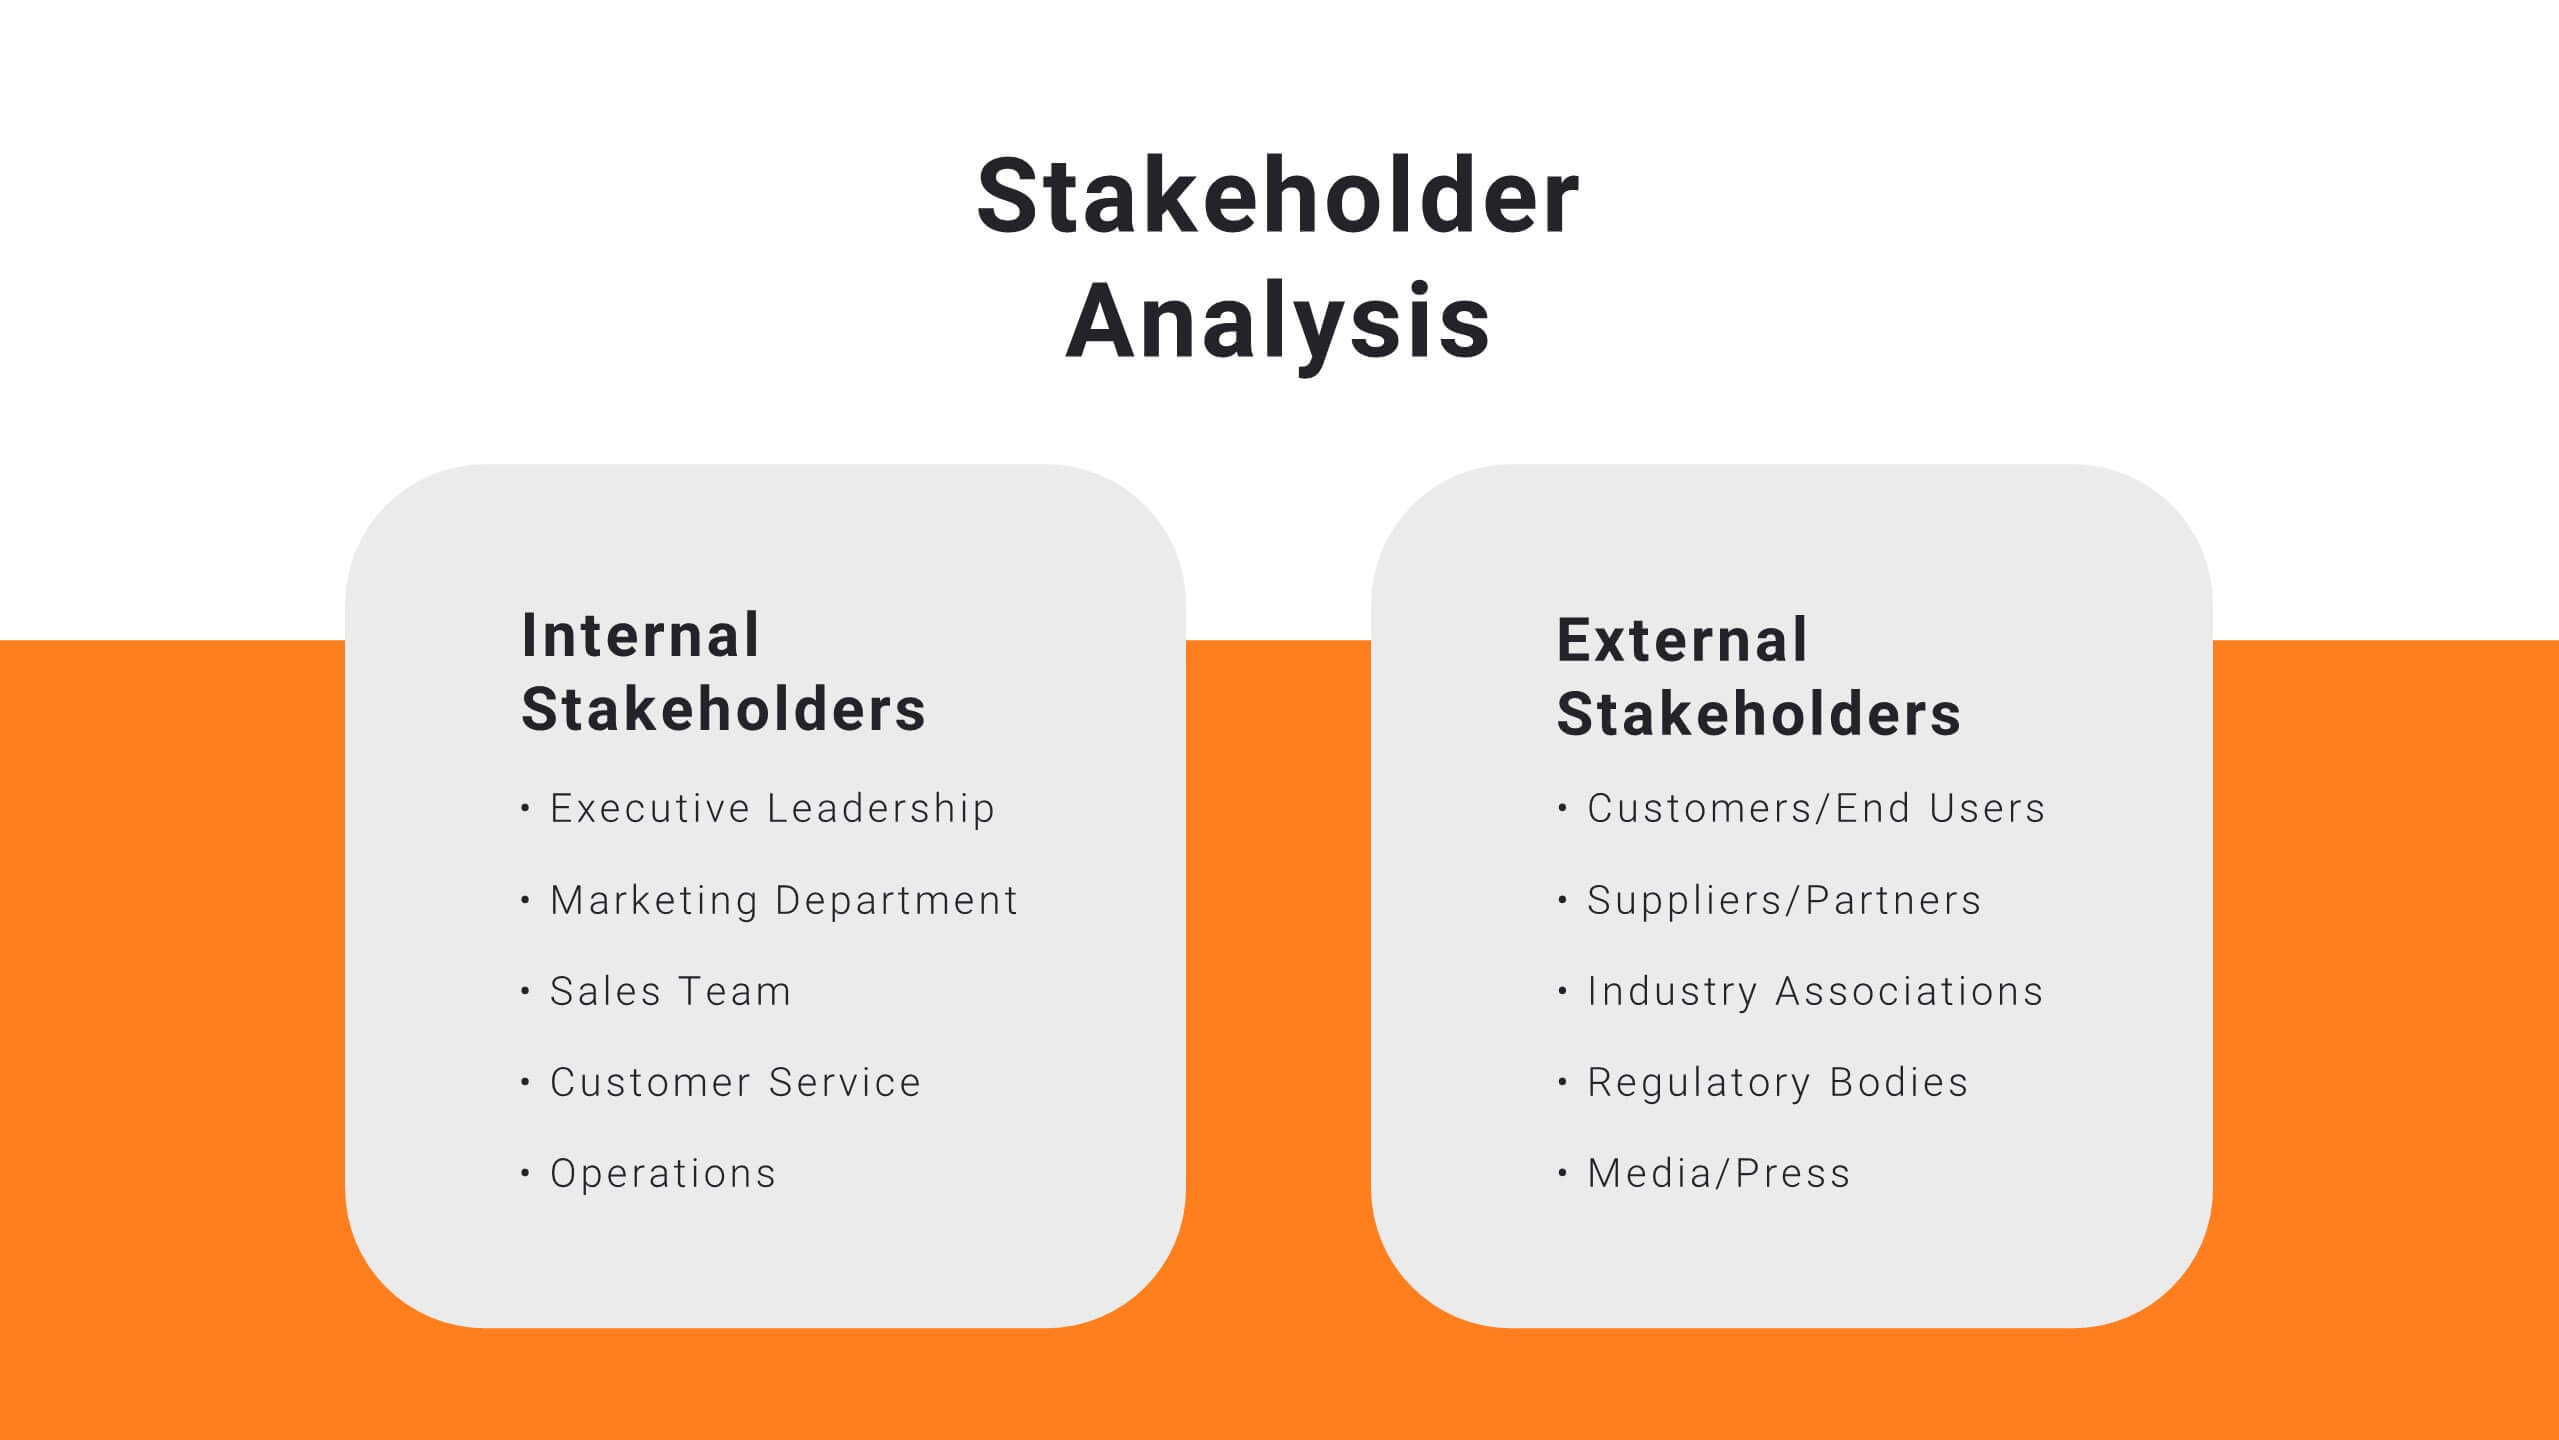
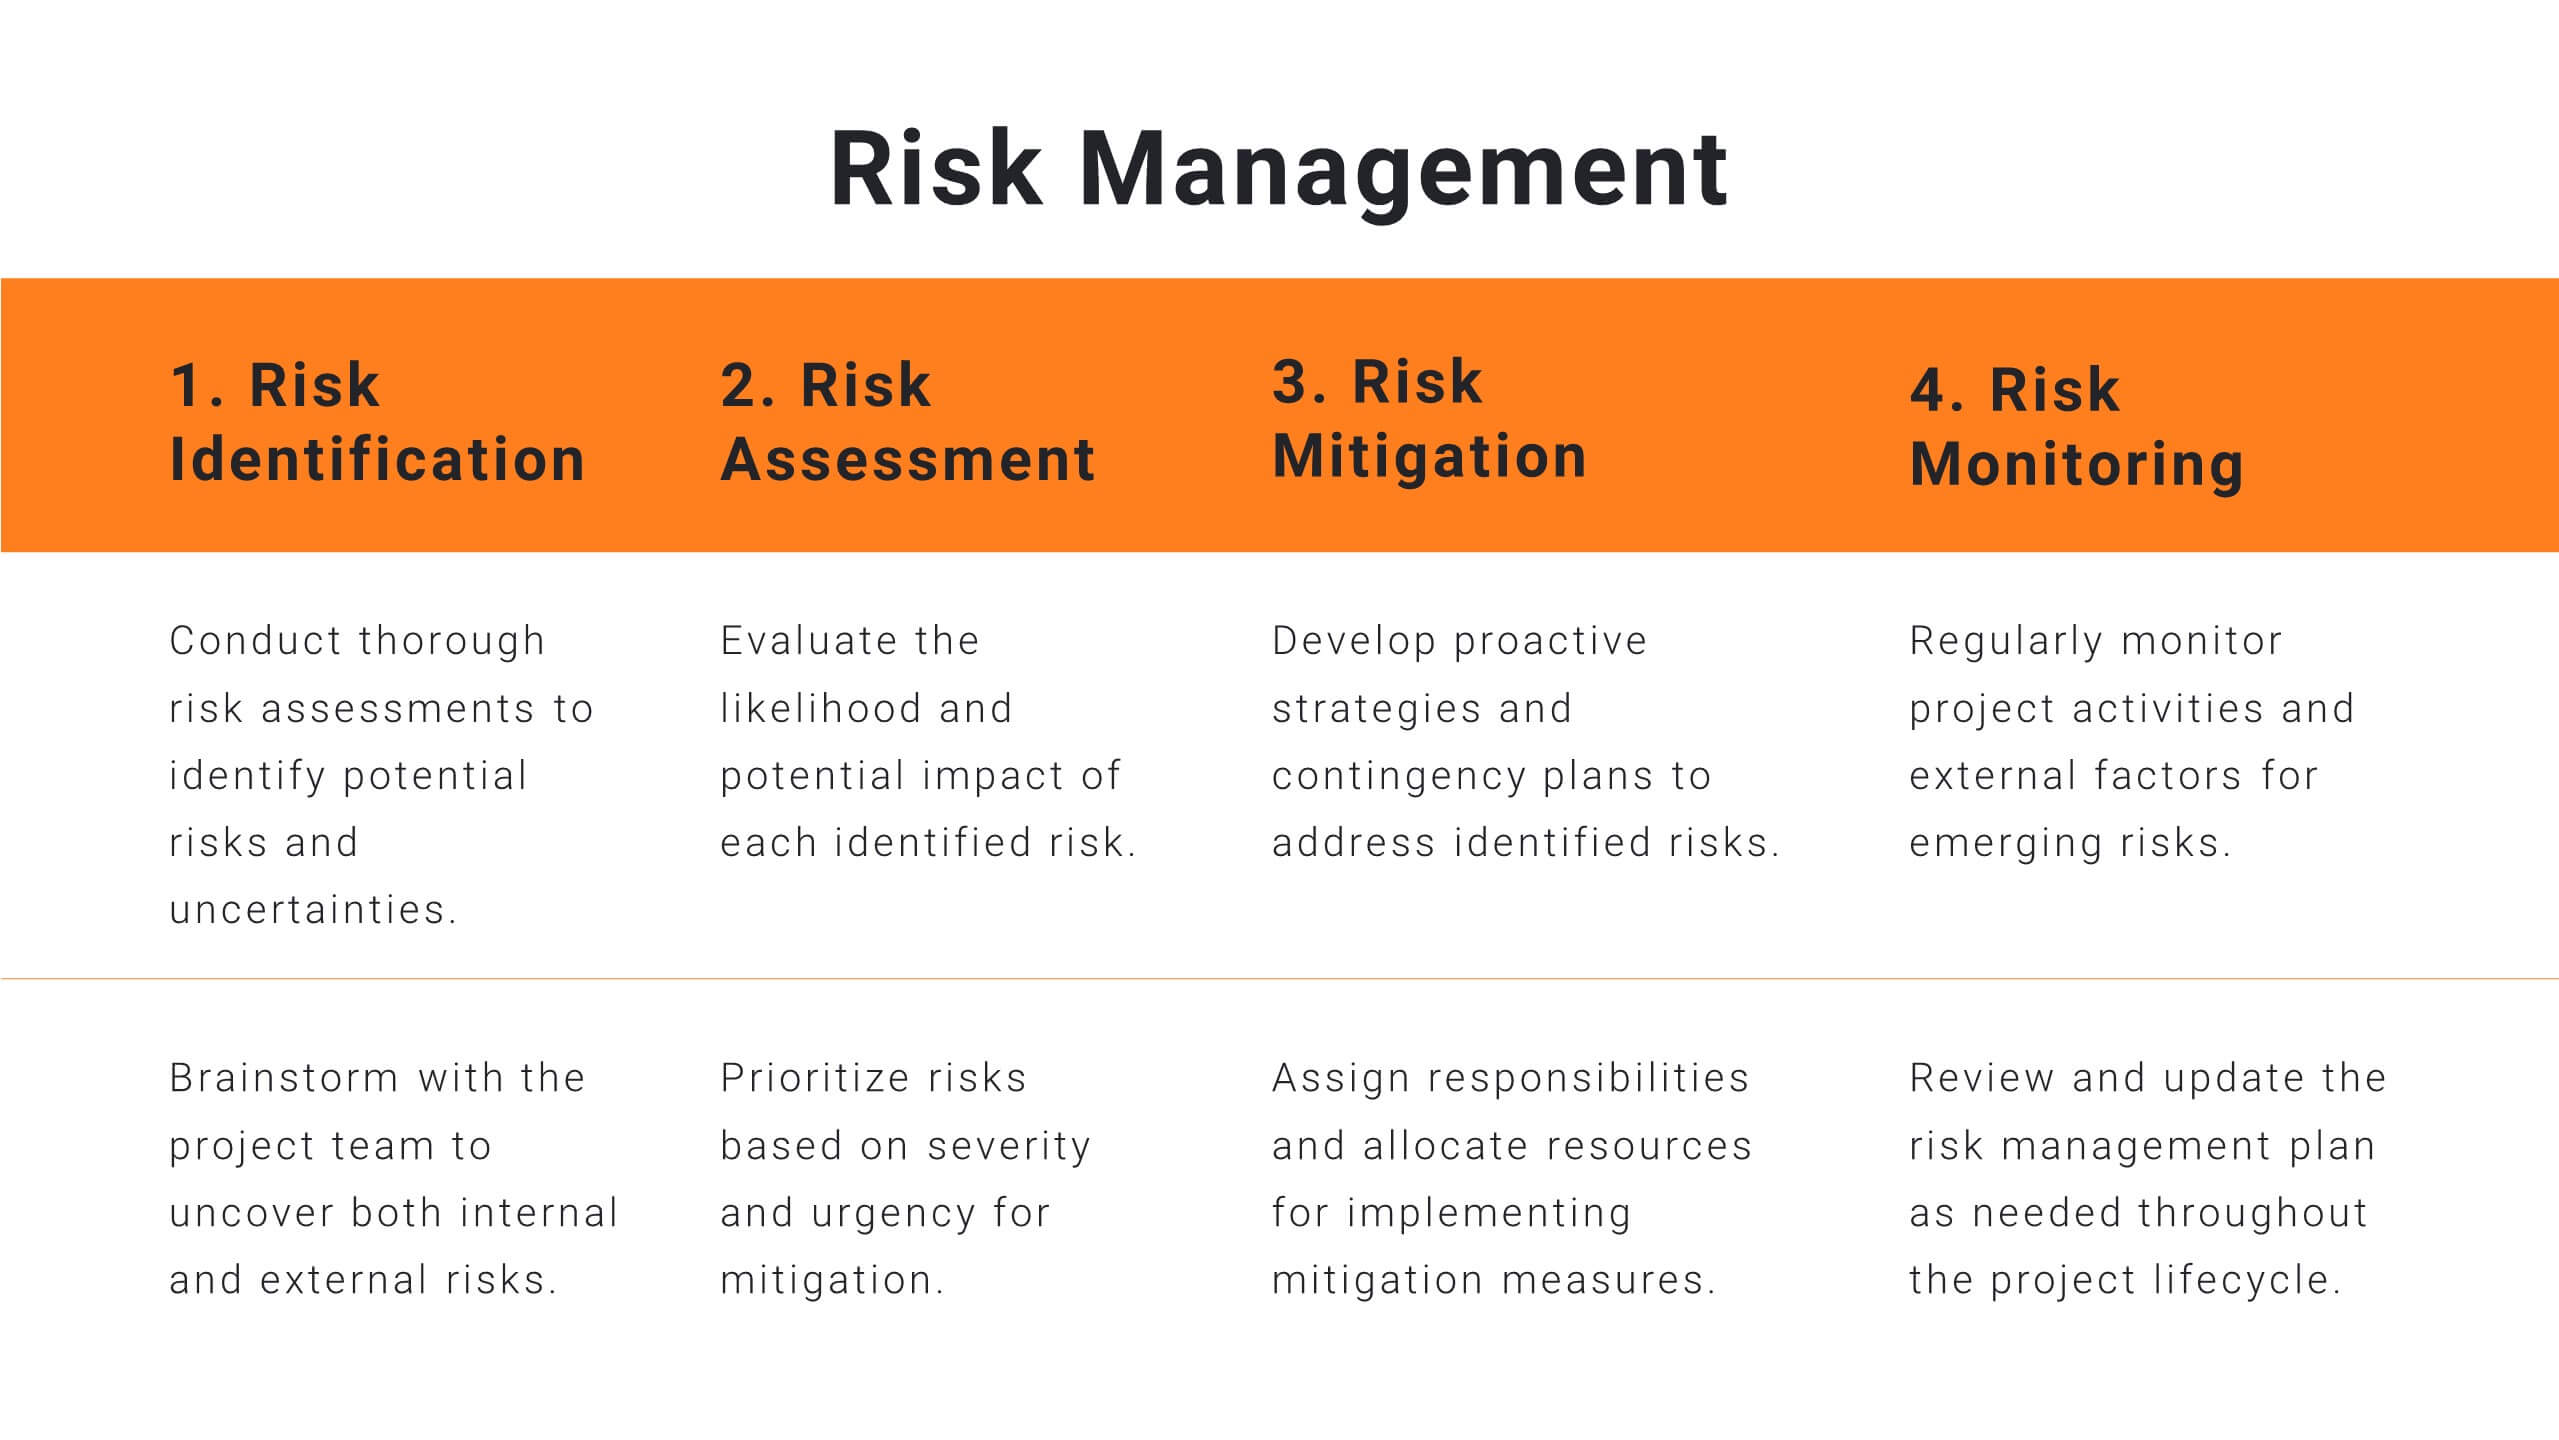
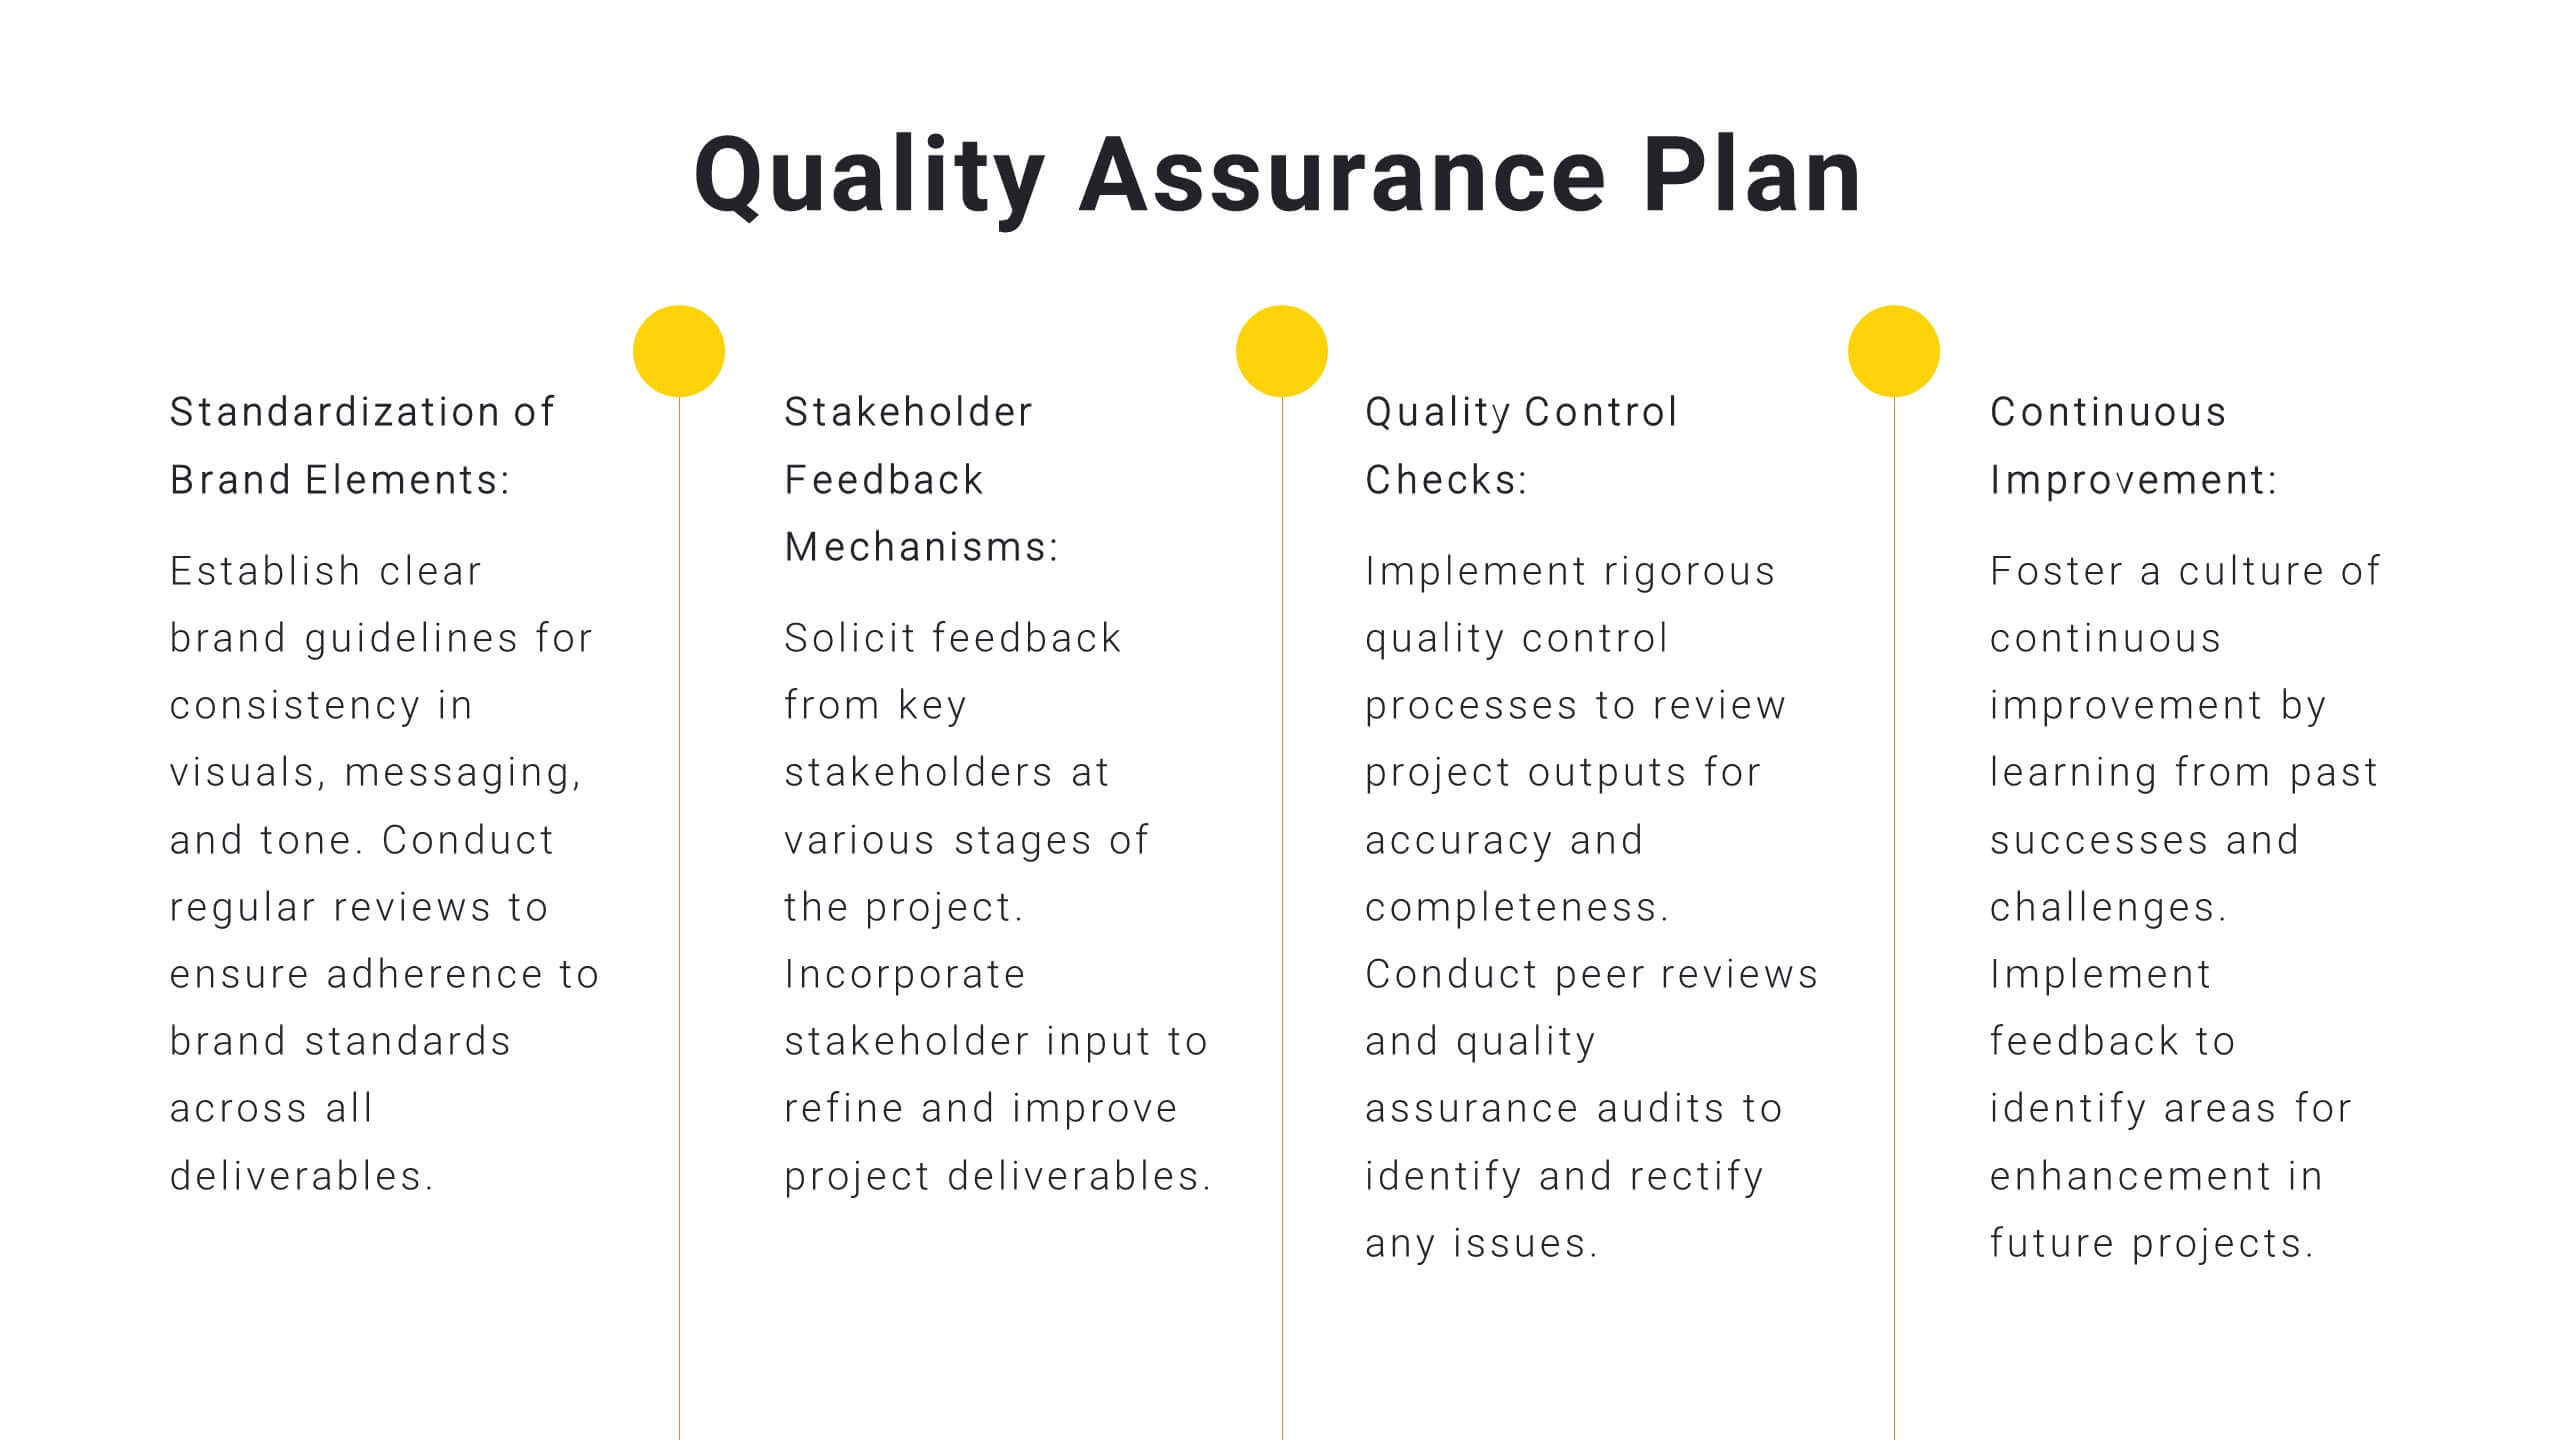
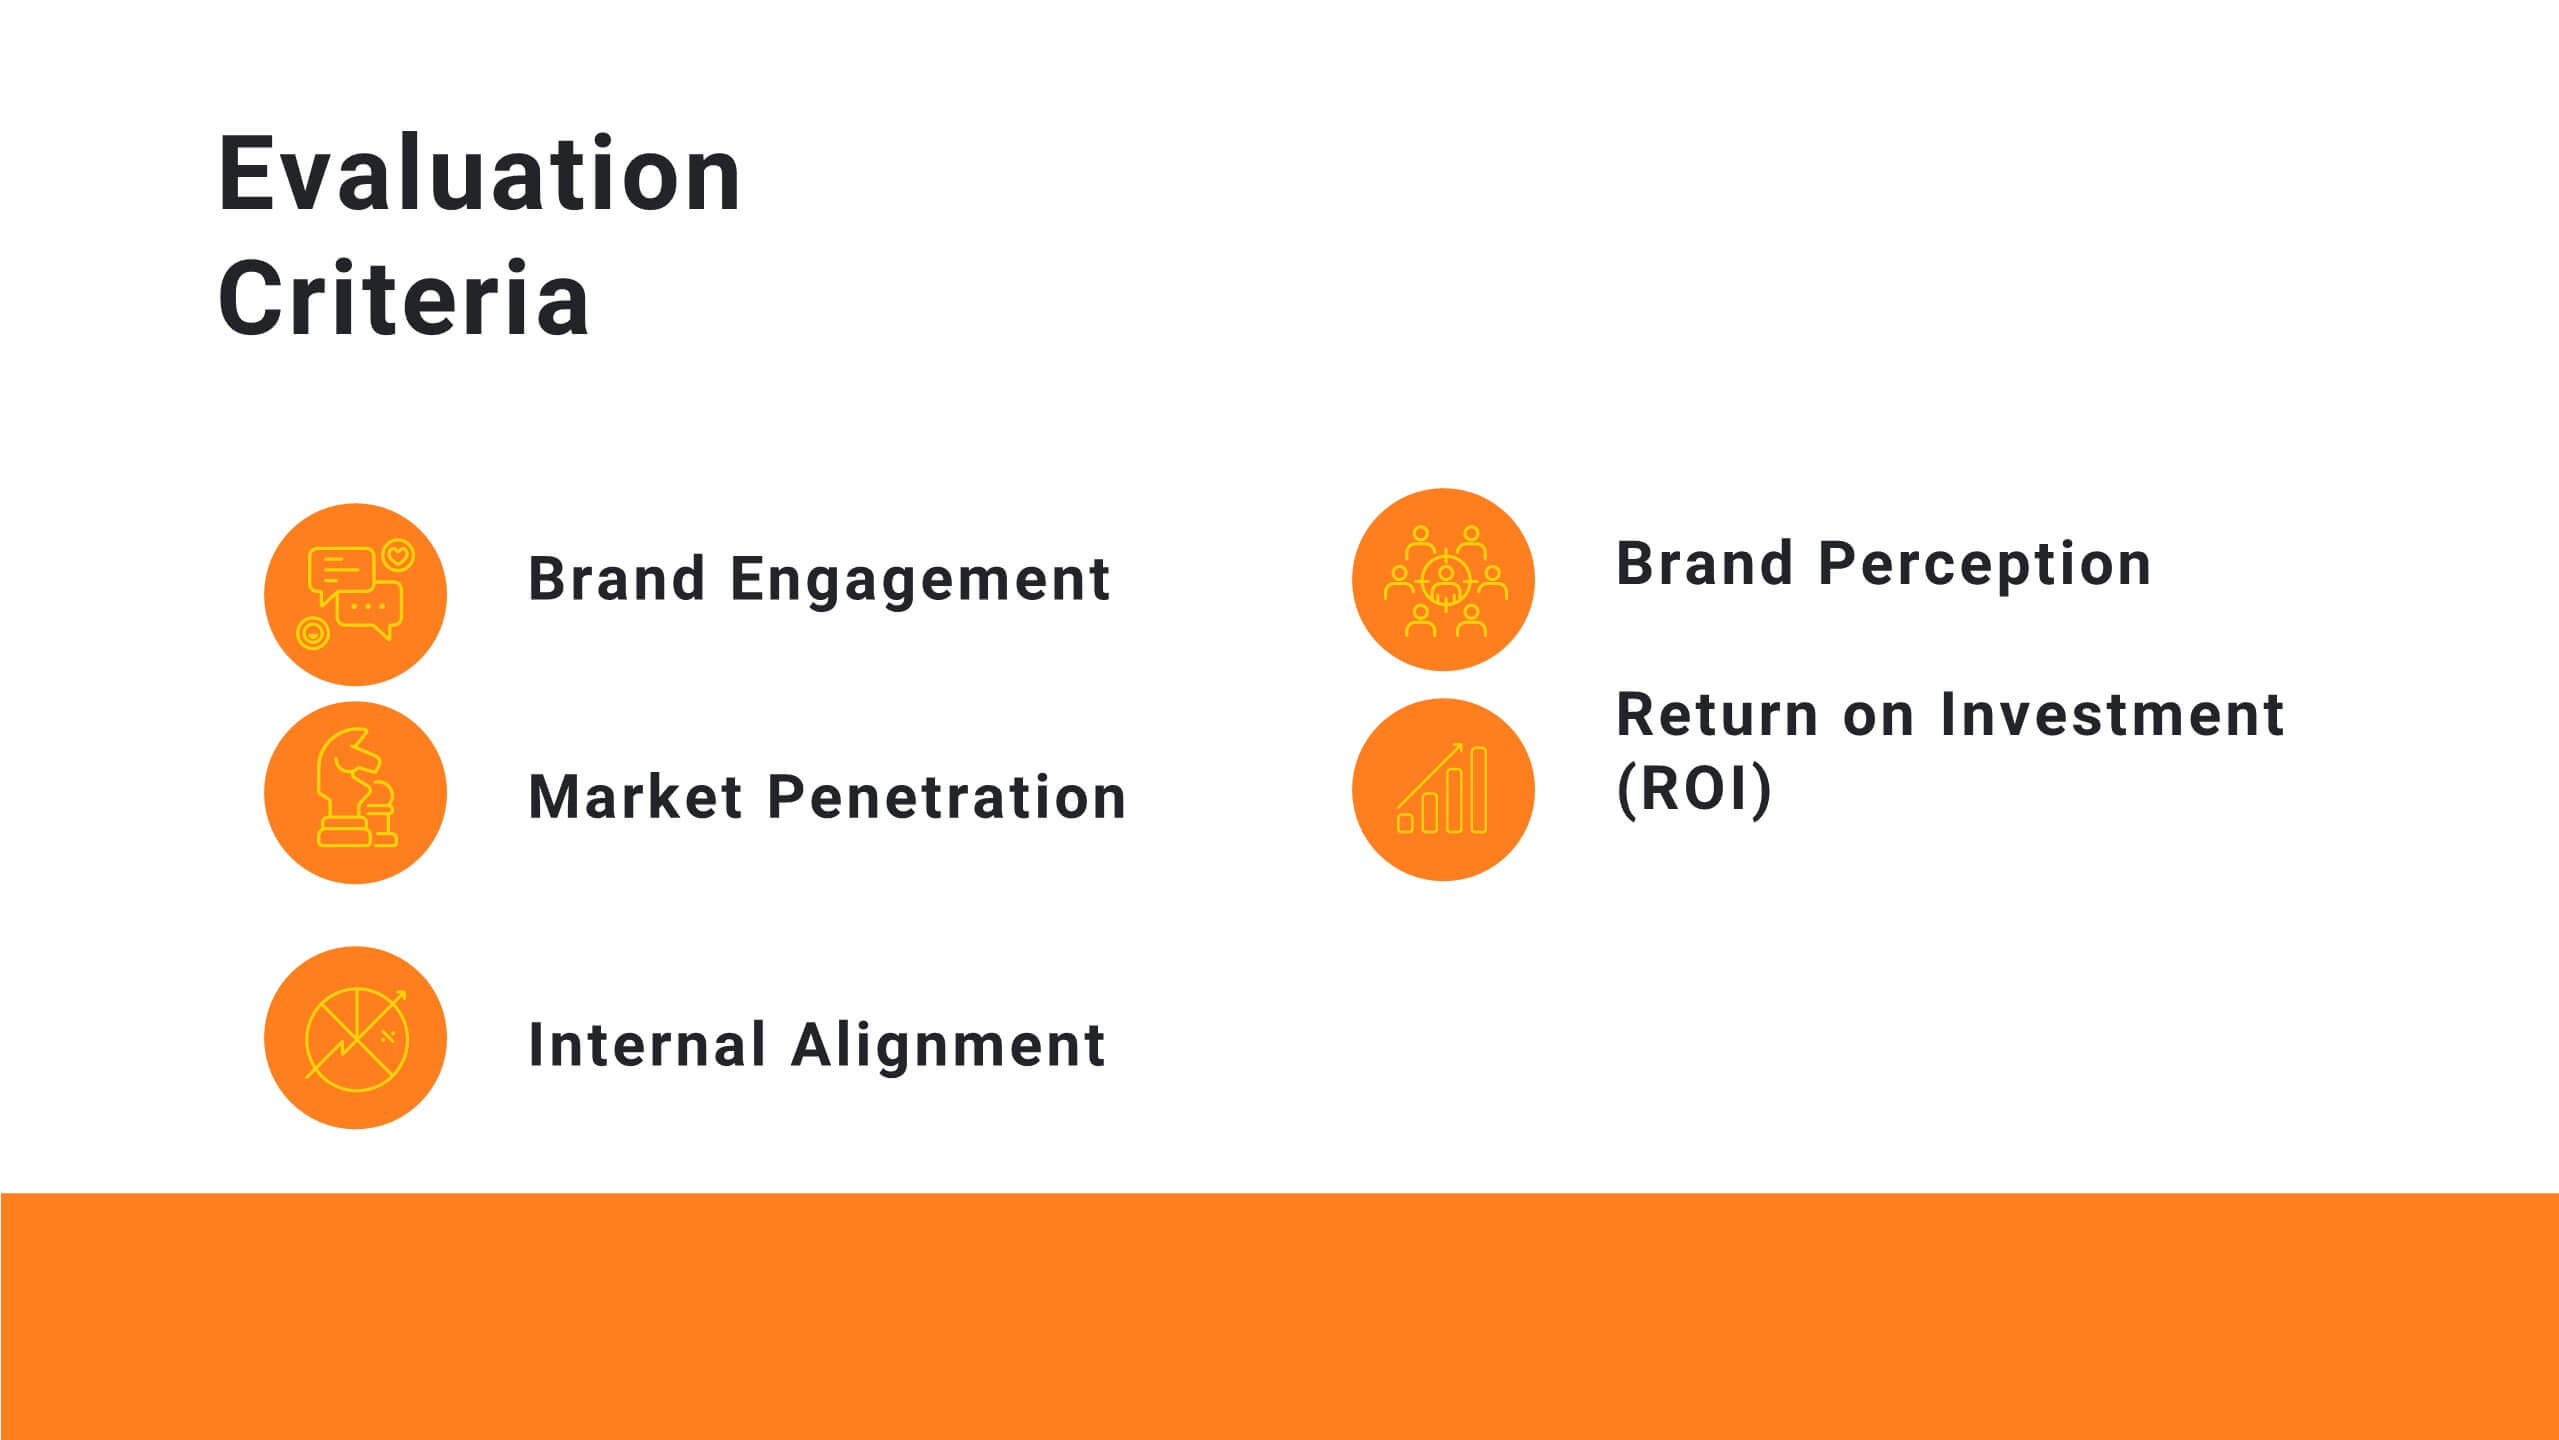
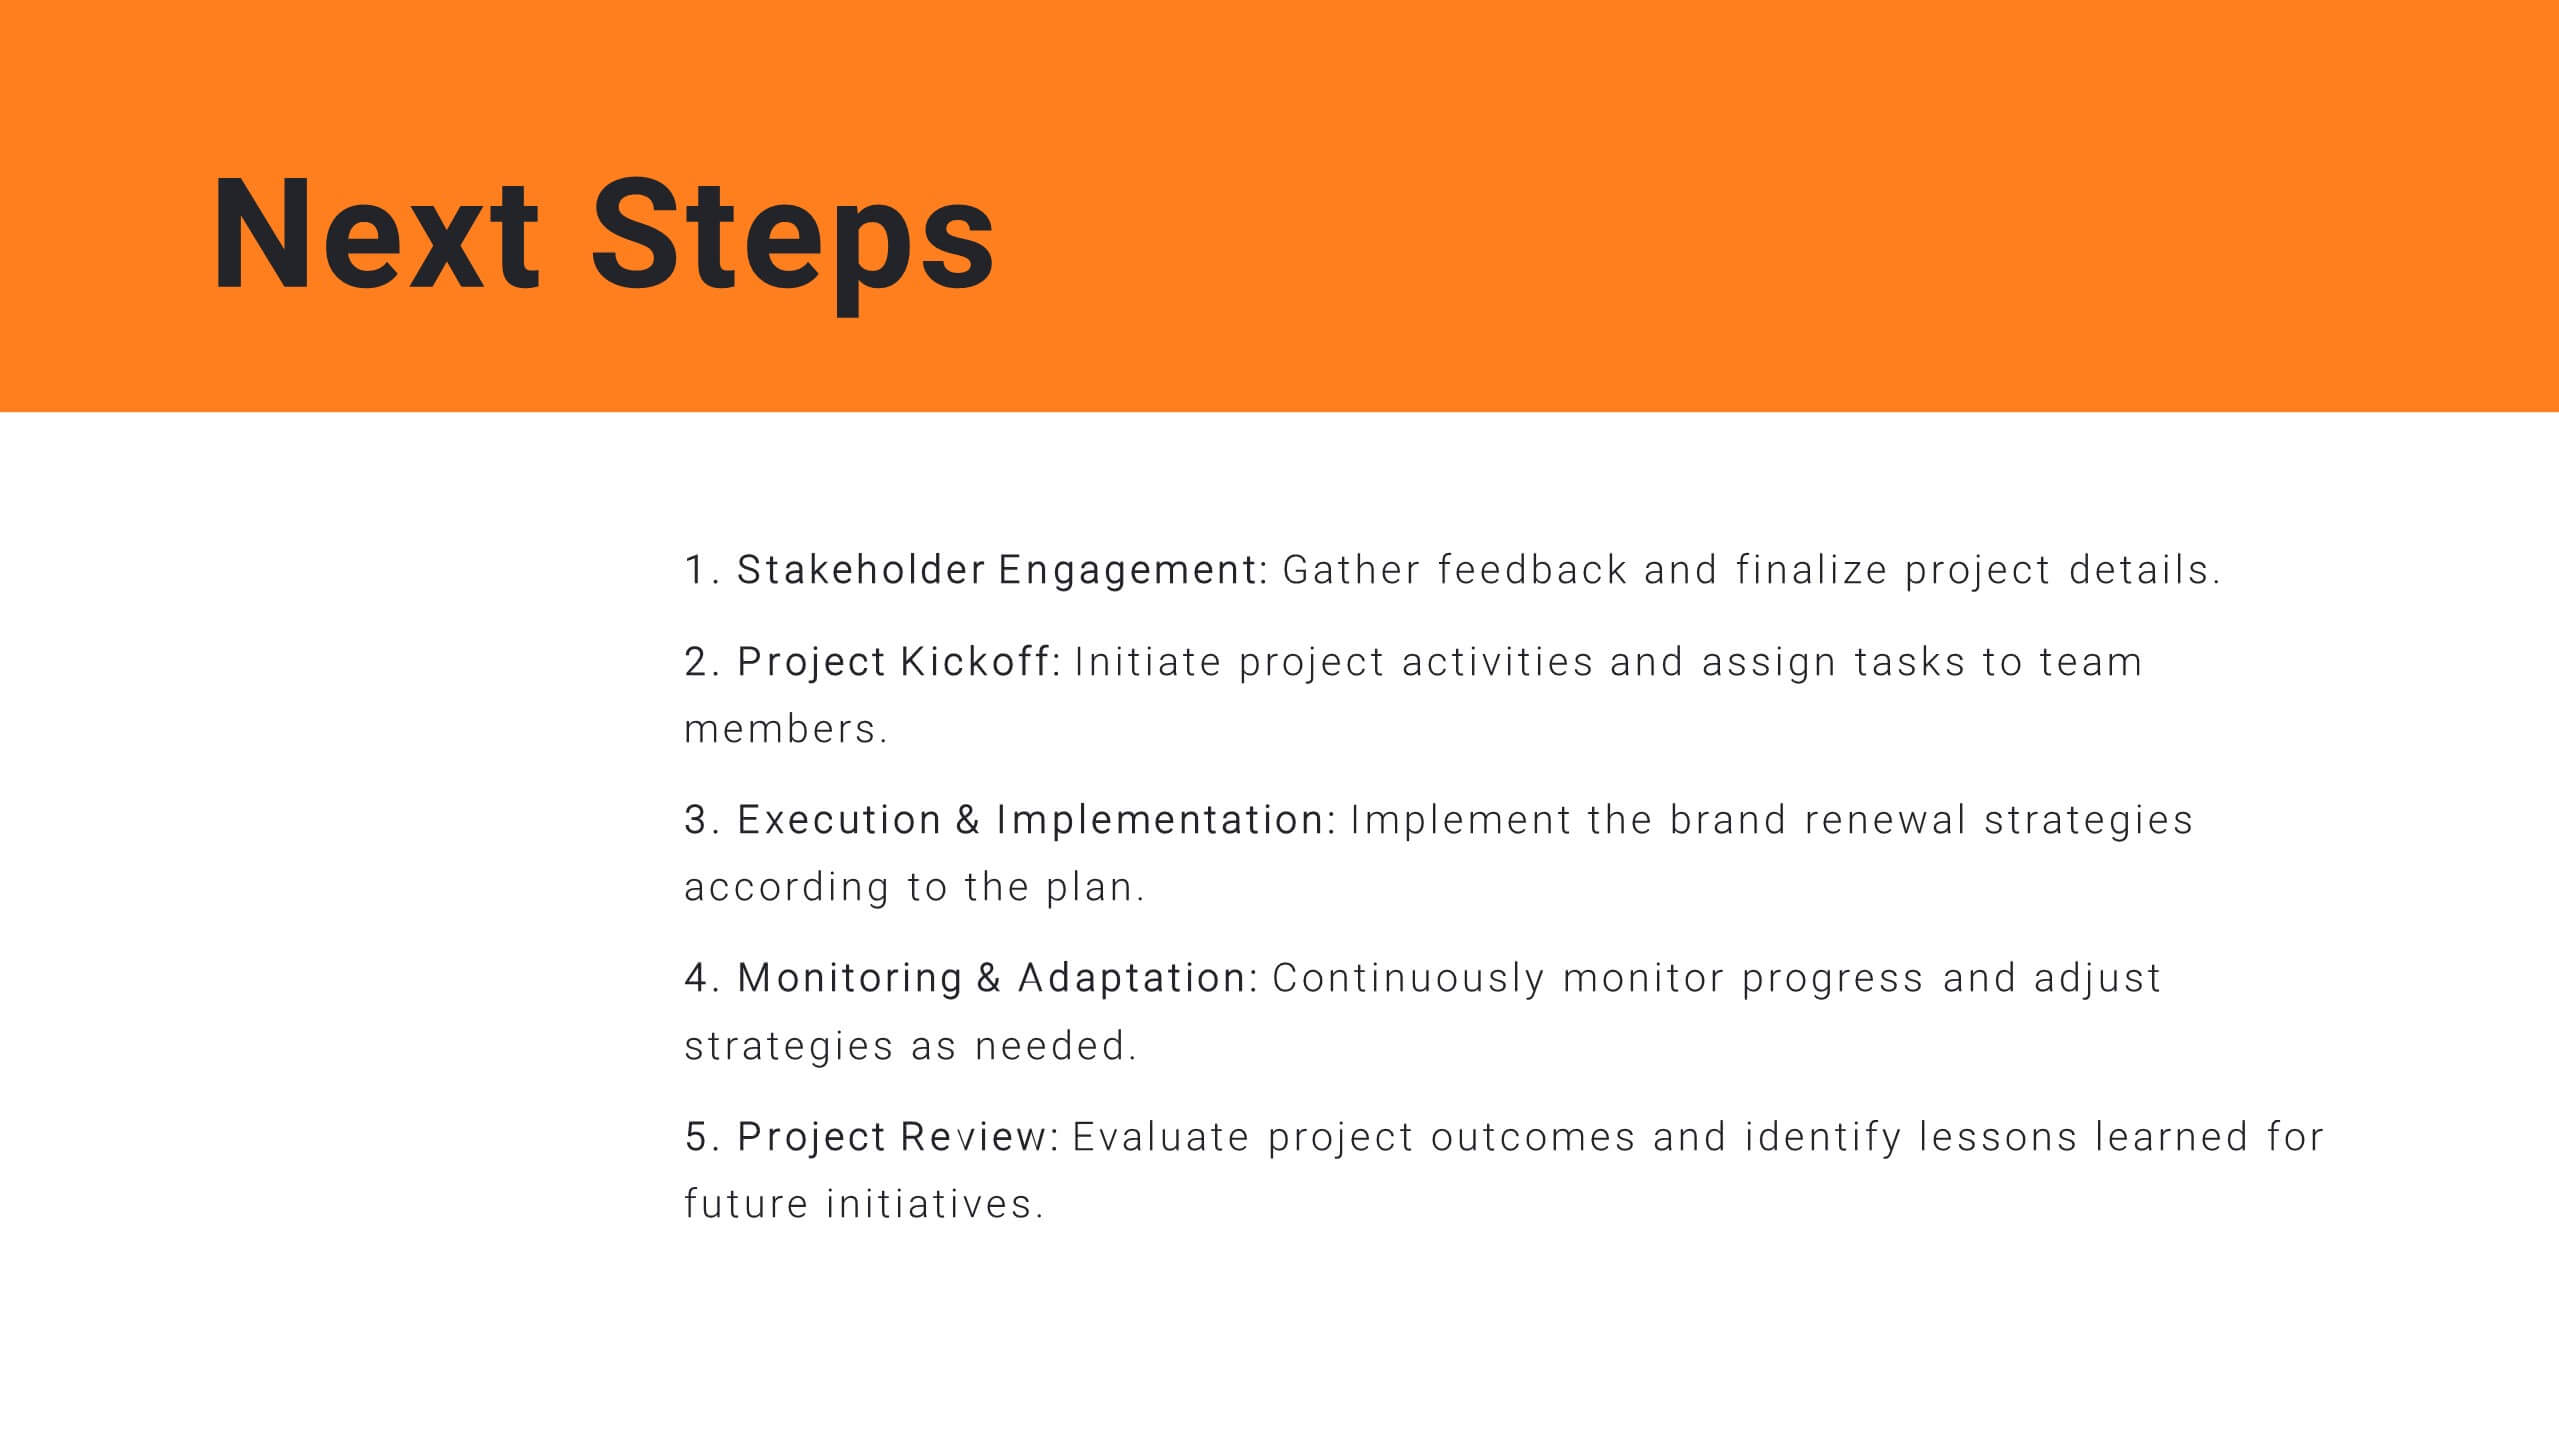
Harmony Project Management Plan Presentation
Plan your project efficiently with this comprehensive project management plan template! It covers all essential aspects including timeline, budget, resource allocation, and risk management. Ensure smooth project execution and achieve your objectives. Compatible with PowerPoint, Keynote, and Google Slides, it's designed to streamline your project planning and management process.


7 diapositivas
Target Market Advertising Infographic
Target market advertising, also known as target advertising or target marketing, is a strategy in marketing and advertising where promotional efforts are directed towards a specific and well-defined group of consumers who are most likely to be interested in a product or service. The goal of this infographic template is to tailor marketing messages and campaigns to resonate with the characteristics and preferences of your specific audience, thus increasing the effectiveness and efficiency of the marketing efforts. Fully customize the content, to educate about targeting the right audience for advertising presentations.


5 diapositivas
United States States Outline Presentation
Make your data pop with a vibrant, easy-to-read snapshot of U.S. state insights. This presentation helps you highlight regional trends, compare performance, and showcase key information using a clean state-by-state outline. Perfect for reports, geography topics, or analytics. Fully compatible with PowerPoint, Keynote, and Google Slides.


7 diapositivas
Performance Improvement Infographics
A Performance Improvement infographic is a visual representation of the key elements of a plan to enhance the performance of an individual, team, or organization. The purpose of this template is to communicate the plan's objectives, strategies, and metrics in an informative and engaging way. This infographic contains graphs, and diagrams to illustrate key performance indicators and other measures of success. This performance template can help motivate and engage stakeholders, highlight the benefits of performance improvement, and facilitate communication and collaboration among team members.


6 diapositivas
Startup Business Launch Framework Presentation
Showcase your startup journey with the Startup Business Launch Framework Presentation. This step-by-step visual illustrates four key stages in your business launch process—from ideation to execution—using ascending blocks and modern icons. Ideal for founders, incubators, and pitch decks. Fully customizable in PowerPoint, Keynote, Google Slides, and Canva.


5 diapositivas
Workflow Management Diagram Presentation
Simplify your process visuals with a clean, modern layout designed to clarify every step. This presentation helps you map workflows, define responsibilities, and streamline communication across teams. Perfect for project planning and operations, it’s fully compatible with PowerPoint, Keynote, and Google Slides for effortless customization and professional presentation delivery.


6 diapositivas
12-Month Calendar Overview Presentation
Kick off your planning with a clean, colorful layout that makes every month easy to visualize at a glance. This presentation helps you map timelines, milestones, and deadlines in a structured format ideal for yearly planning. Fully editable and compatible with PowerPoint, Keynote, and Google Slides.


26 diapositivas
Premium Finance for Daily Life Presentation
Introducing our Premium Finance for Daily Life Presentation template this is a comprehensive and informative tool to educate individuals about the concept of premium finance and its relevance in everyday life. This presentation aims to provide valuable insights on how premium finance can be utilized to manage and optimize personal finances. The slides are fully customizable and compatible with PowerPoint, Keynote, and Google Slides. It features a professional design with clean layouts, visually appealing graphics, and icons related to finance and daily life activities. The presentation can cover various topics related to premium finance.


4 diapositivas
4-Quadrant RACI Chart Slide Presentation
Bring structure and clarity to your workflow with a bold, pyramid-style layout that makes responsibilities instantly understandable. This presentation helps teams outline who leads, supports, approves, and informs across key tasks, turning complex processes into a clean visual map. Fully editable and compatible with PowerPoint, Keynote, and Google Slides.


4 diapositivas
Business Gap Analysis Framework
Visually bridge the gap between current and desired performance with this impactful Business Gap Analysis slide. Featuring a creative cliff and bridge design with editable text sections, it's ideal for strategic planning, performance improvement, and operational reviews. Fully compatible with PowerPoint, Keynote, and Google Slides.


7 diapositivas
Business 3D Infographic
Bring a new dimension to your business presentations with our 3D Business Infographics. These dynamic visuals are perfect for professionals and educators who want to add depth to their data representation and make complex information more accessible. Our 3D Business Infographics collection features a range of formats, from layered pyramids to multidimensional bar graphs, allowing for innovative depictions of hierarchies, relationships, and progressions. Whether you're illustrating strategic frameworks, financial analysis, or project milestones, these graphics can enhance understanding and engagement. Customizable for any business context, these infographics are designed to stand out in reports, presentations, or educational materials. Their SEO-friendly nature ensures that your content is more likely to be seen and shared, extending your reach. Use these 3D infographics to make a strong visual impact that communicates your business concepts with clarity and creativity.
8 diapositivas
3-Step Arrow Diagram Presentation
Streamline your presentations with the 3-Step Arrow Diagram Presentation. Designed for process flows, strategic planning, and step-by-step guides, this visually engaging template simplifies complex ideas into clear, structured steps. Customize colors, text, and icons effortlessly to match your brand. Fully compatible with PowerPoint, Keynote, and Google Slides for seamless editing and professional results.


21 diapositivas
Ceres Financial Report Presentation
This financial report template is designed to showcase performance metrics, sales analysis, project progress, and strategic insights with clarity and professionalism. Featuring slides for operational updates, competitor insights, and recommendations for improvement, it ensures a comprehensive financial overview. Compatible with PowerPoint, Keynote, and Google Slides for flexible presentations.


7 diapositivas
SEO Infographic Presentation Template
SEO stands for “search engine optimization.” In simple terms, it's the process of improving your site to increase its visibility when people search for products or services related to your business in Google and other search engines. Learn more about SEO with this clean template, including how to optimize your pages and how search engines work. This template will inform you how keywords and phrases drive search engine results, how they affect rankings, and what steps to take to achieve higher rankings. This template comes packed with fun illustrations, and can be used as a great presentation.