


Características


¿Tienes alguna pregunta?
Recomendar


4 diapositivas
Points-Based Membership Program Strategy Presentation
Communicate your rewards system with clarity using the Points-Based Membership Program Strategy presentation. This visual template is ideal for outlining tiered rewards, point accumulation methods, and redemption mechanics through a clean, card-themed layout. Perfect for loyalty teams, marketing strategists, and membership programs. Fully editable in PowerPoint, Keynote, and Google Slides.


26 diapositivas
Coffee Shop Simple Presentation
Perk up your presentation with this Coffee Shop template, brimming with the energy of a bustling café. It’s the perfect blend for baristas, café owners, or anyone presenting on the coffee industry. The design features rich, warm colors and images that evoke the cozy ambiance of a coffee shop. Introduce your team with 'Meet Our Team' slides, and discuss your menu or business strategies with the option slides. Utilize the 'Chart Slide' for sales figures or customer preferences, and map out your global coffee sources with the 'Asia Map Slide'. The 'Mobile Device Mockup' is ideal for demonstrating your café's app or online ordering system. Each slide is like a cup of your finest brew—crafted to energize and engage your audience. The 'Thank You' slide sends them off with the satisfaction of a well-spent coffee break. This template isn’t just a visual aid; it's an experience, inviting your audience to savor every detail of your coffee-centric venture.


6 diapositivas
Customer Journey Mapping with Buyer Persona Presentation
Clearly visualize the customer experience across all touchpoints with this structured journey mapping slide. Featuring a central buyer persona graphic and six customizable steps with icons, this layout helps you break down each stage of the customer path. Perfect for UX strategy, customer service insights, and product development. Fully editable and compatible with PowerPoint, Keynote, and Google Slides.


6 diapositivas
Healthy Meal Planning Template Presentation
Visualize balanced nutrition with the Healthy Meal Planning Template. Featuring a layered jar graphic, this presentation organizes up to six content sections—ideal for meal prep, wellness routines, or health education. Clean and editable in PowerPoint, Keynote, and Google Slides. Perfect for nutritionists, fitness professionals, or wellness-focused content planning.


21 diapositivas
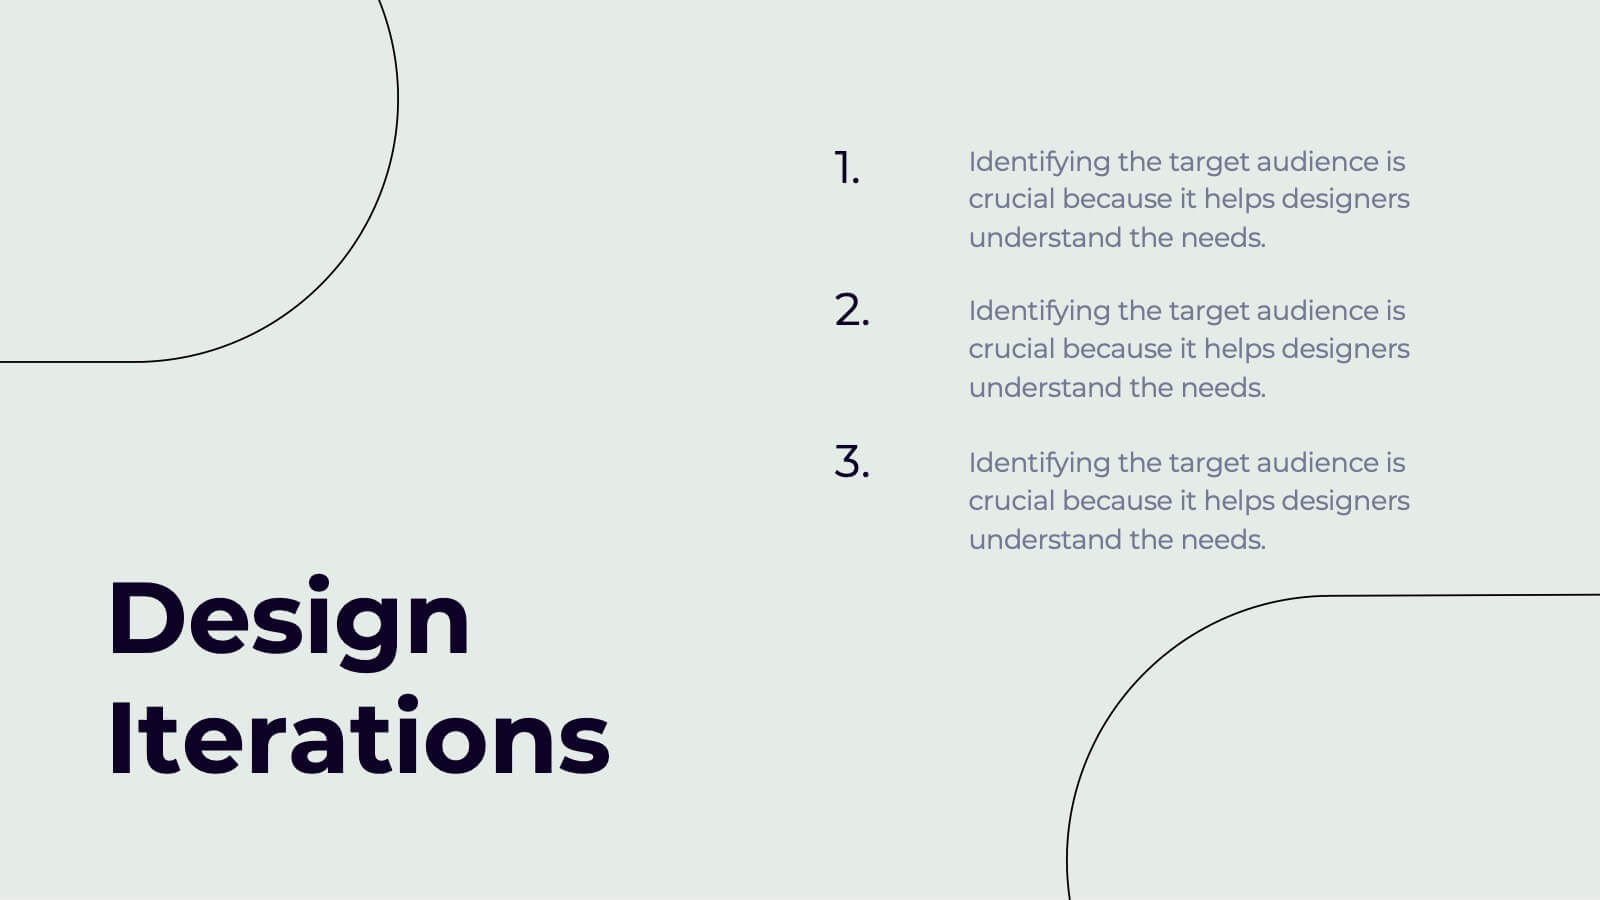
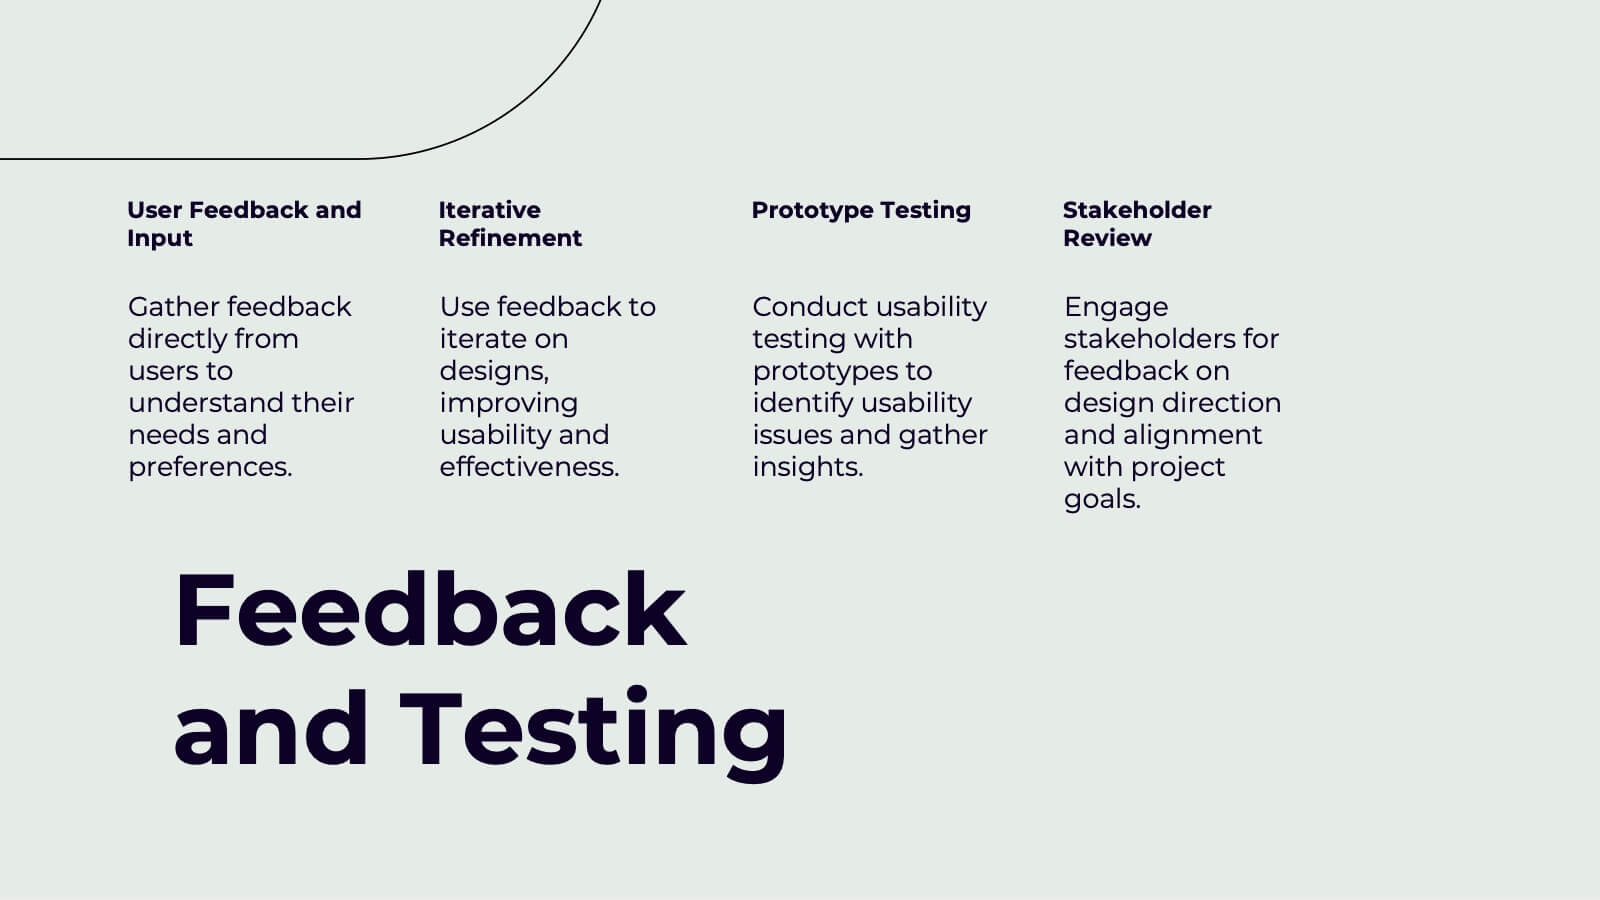
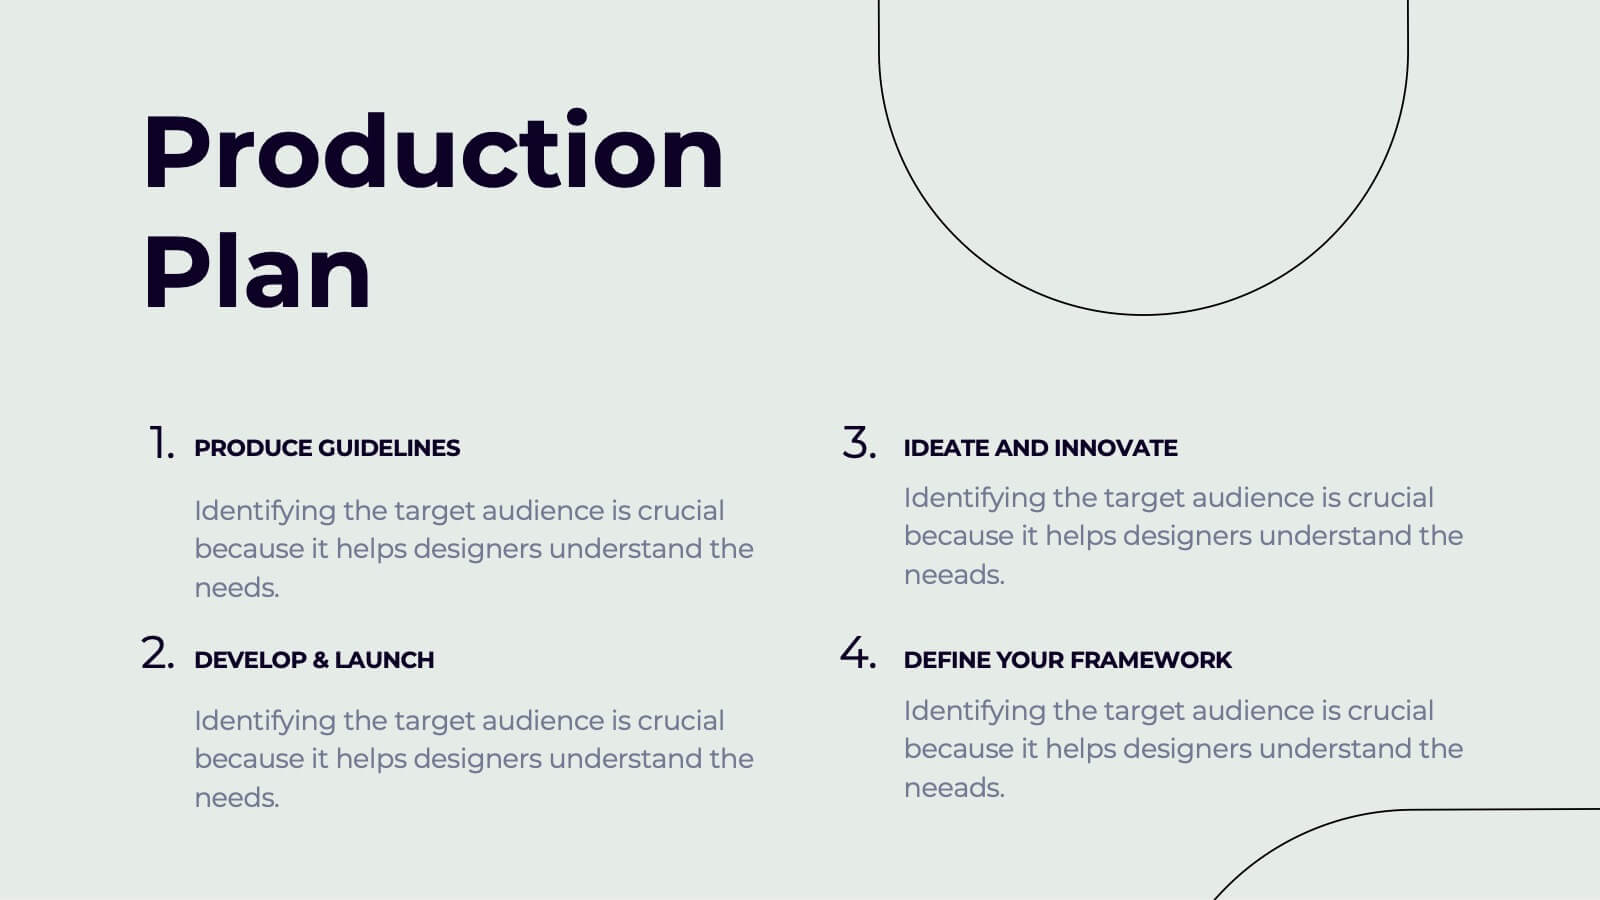
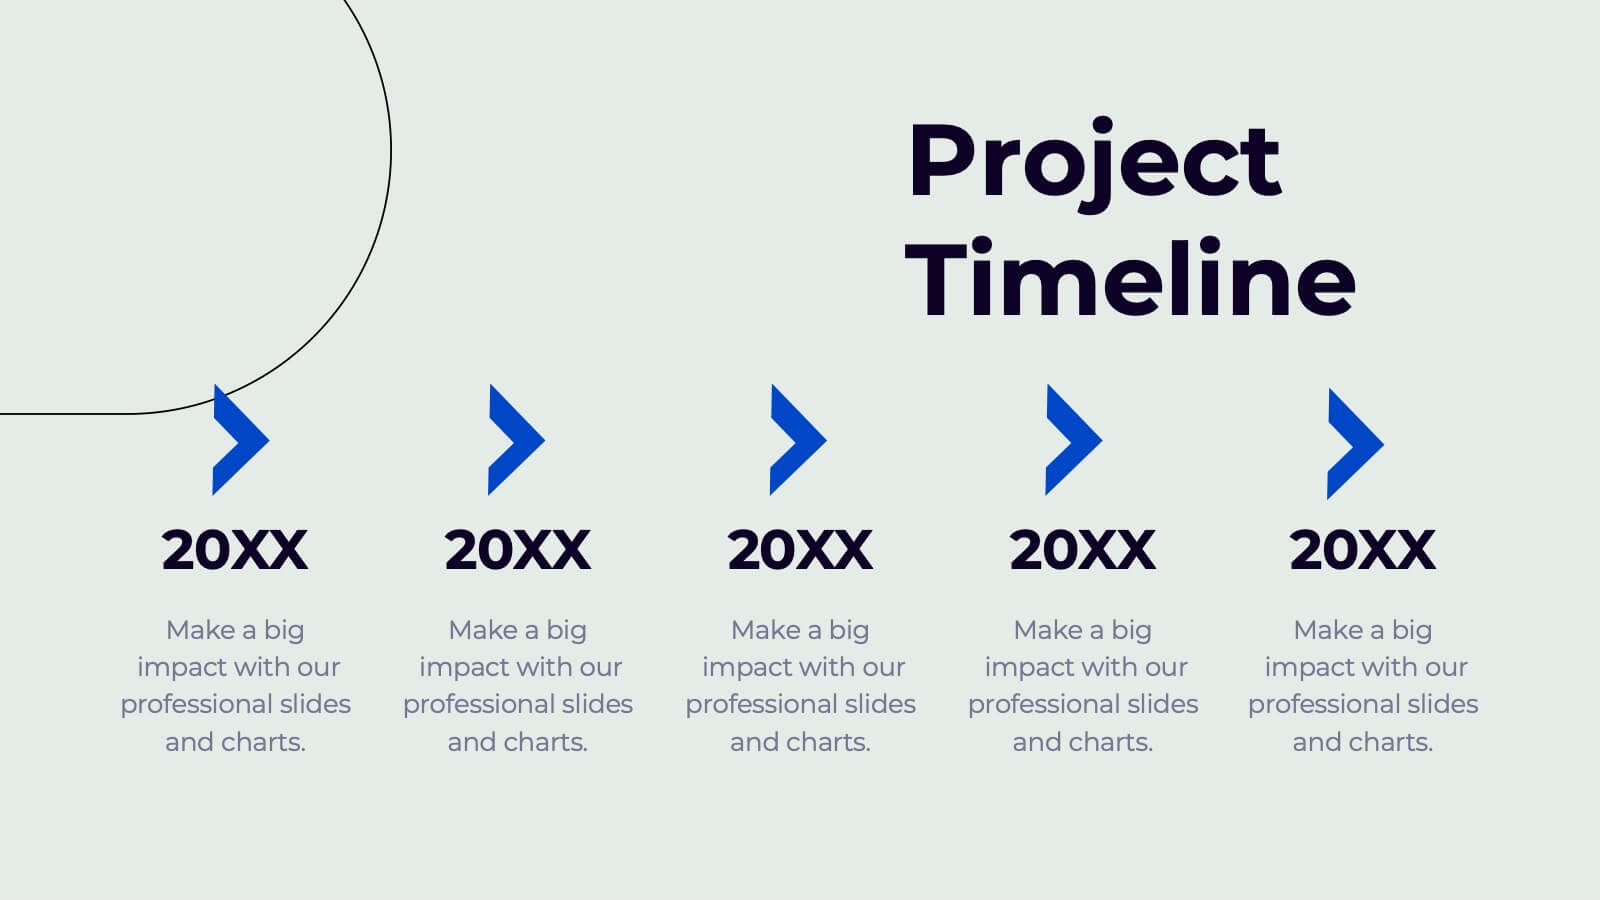
Yeti Creative Design Report Presentation
This modern design report template covers everything from concept development to design iterations and feedback testing. It’s visually striking, with sections for color schemes, typography, textures, and production plans. Ideal for showcasing creative projects and delivering professional presentations. Compatible with PowerPoint, Keynote, and Google Slides for ease of use.


6 diapositivas
Customer Conversion Funnel
Visualize every stage of your customer journey with the Customer Conversion Funnel Presentation. This layered funnel diagram breaks down the conversion process into five clear levels—from awareness to action—making it easy to explain how leads are captured and converted. Ideal for digital marketers, sales teams, and consultants presenting campaign performance, lead nurturing, or CRM workflows. Compatible with PowerPoint, Keynote, and Google Slides.


20 diapositivas
Dreamlet Marketing Proposal Presentation
Deliver a persuasive marketing proposal with this sleek and modern presentation template. It covers essential topics such as industry trends, social media strategies, influencer marketing, and customer experience, helping you make a strong impact. Perfect for agencies and businesses alike. Compatible with PowerPoint, Keynote, and Google Slides for easy customization.


6 diapositivas
Sales Funnel Performance Presentation
Visualize your customer journey with this Sales Funnel Performance Presentation. The clean funnel diagram allows you to clearly represent each stage—awareness, interest, decision, and action—using vibrant, stacked layers. Customize the six labeled steps and supporting icons to fit your brand strategy. Perfect for showcasing conversion metrics or campaign insights in PowerPoint, Keynote, or Google Slides.


8 diapositivas
Success Metrics and Performance Presentation
Showcase your Success Metrics and Performance with this data-driven presentation template. Designed with bar-style visualizations and percentage-based highlights, this layout is ideal for business analysts, project managers, and executives looking to present key performance indicators (KPIs) with clarity. Featuring customizable colors, icons, and text placeholders, this template ensures clear and impactful storytelling. Compatible with PowerPoint, Keynote, and Google Slides for easy integration.


3 diapositivas
Business Ethics and Legal Guidelines Presentation
Navigate the complexities of corporate governance with the "Business Ethics and Legal Guidelines" template, designed to simplify and clarify the presentation of legal standards and ethical expectations in business environments.This visually engaging layout helps emphasize the progression and importance of each principle, ensuring clarity in communication. Ideal for training modules, compliance meetings, or strategic planning sessions, it's compatible with PowerPoint, Keynote, and Google Slides.


4 diapositivas
HR Policies and Employee Management Presentation
Clearly outline your workplace strategies with this HR Policies and Employee Management slide. Featuring four color-coded segments alongside an illustration of employee analysis, this layout is ideal for presenting onboarding steps, employee benefits, internal policies, or training procedures. Fully editable and compatible with PowerPoint, Keynote, and Google Slides for seamless customization.


20 diapositivas
Creative Agency Presentation
Showcase your agency’s capabilities with the Magic Coat Creative Agency template. It features slides detailing team introductions, service overviews, case studies, and more. Ideal for creative agencies aiming to impress potential clients, this template supports PowerPoint, Keynote, and Google Slides, enhancing your presentation's professional appeal.


5 diapositivas
Organizational Structure Framework
Visualize your company hierarchy with this tiered pyramid diagram. This presentation framework is designed to outline roles and responsibilities across four structured levels, using labels A to D for clear communication. Each section includes iconography and editable text blocks, perfect for leadership, operations, or team management slides. Fully compatible with PowerPoint, Keynote, and Google Slides.


6 diapositivas
Lean Business Canvas Framework
Simplify your business strategy with the Lean Business Canvas Framework Presentation. This slide offers a structured layout to map out key elements like partners, activities, value propositions, customer segments, and revenue streams—all in one view. Ideal for startups, business plans, or internal strategy sessions. Fully editable in PowerPoint, Keynote, and Google Slides.


7 diapositivas
Time Management Goal Infographic
Time management is the process of organizing and planning how to divide your time between specific activities effectively and efficiently to achieve desired goals or outcomes. This infographic template is designed to empower you in mastering time, optimizing productivity, and seizing the day. This infographic provides a visually striking way to illustrate time management strategies, tips, and hacks for anyone looking to make the most of their time. Fully customizable and compatible with Powerpoint, Keynote, and Google Slides. This showcases time-bound tasks, emphasizing the importance of setting deadlines and managing tasks within periods.


6 diapositivas
Project Proposal Goals Infographic
Maximize the impact of your project proposals with this professional collection of templates, designed to outline your project goals and strategies with precision. Each template facilitates clear communication of project objectives, timelines, and the desired outcomes, making them essential for project managers, consultants, and business analysts. These slides are crafted with a clean, corporate design that uses a harmonious blend of blue tones, engaging charts, and concise content layouts. This ensures that key points are easily digestible and effectively conveyed to stakeholders. The structured format of these templates is ideal for detailing the scope of work, expected milestones, and resource allocation, supporting a comprehensive overview of your project plan. Customize these templates to align with your organization's branding and project specifics, enhancing your presentation and strengthening the proposal's persuasive power. Whether for internal briefings or external pitches, these slides are tailored to help you present a coherent and compelling case for your projects.


5 diapositivas
Timeline-Based Year-End Recap Presentation
Summarize milestones with the Timeline-Based Year-End Recap Presentation. This structured, column-based layout allows you to compare achievements across multiple years in a clear, organized format. Each year is color-coded and paired with icons and editable label sections to highlight key points. Ideal for annual reports, strategic reviews, and progress tracking. Fully editable in PowerPoint, Google Slides, and Canva.