


Características


¿Tienes alguna pregunta?
Recomendar


5 diapositivas
Business Advantages and Benefits Presentation
Showcase your company's strengths with this modern Business Advantages and Benefits Presentation. Featuring a sleek puzzle-style design, this slide is perfect for illustrating interconnected benefits, core features, or success factors. Ideal for business proposals, team briefings, and client meetings, the layout is fully customizable in PowerPoint, Keynote, or Google Slides to match your brand colors and message.


6 diapositivas
Business Revenue Break-Even Strategy
Visualize profitability with clarity using this dynamic break-even strategy template. Ideal for business analysts, finance teams, and consultants, this diagram highlights the balance between cost, loss, and profit at the break-even point. With intuitive icons and space for key metrics, it's fully editable in PowerPoint, Keynote, and Google Slides.


8 diapositivas
Revenue Projection and Expense Planning Presentation
Simplify your financial forecasting with our Revenue Projection and Expense Planning template. This intuitive tool is designed for effectively mapping out revenue streams and budget allocations, making it easier to visualize and manage financial goals. Ideal for businesses and finance professionals, it's compatible with PowerPoint, Keynote, and Google Slides, ensuring seamless integration into any presentation workflow.
23 diapositivas
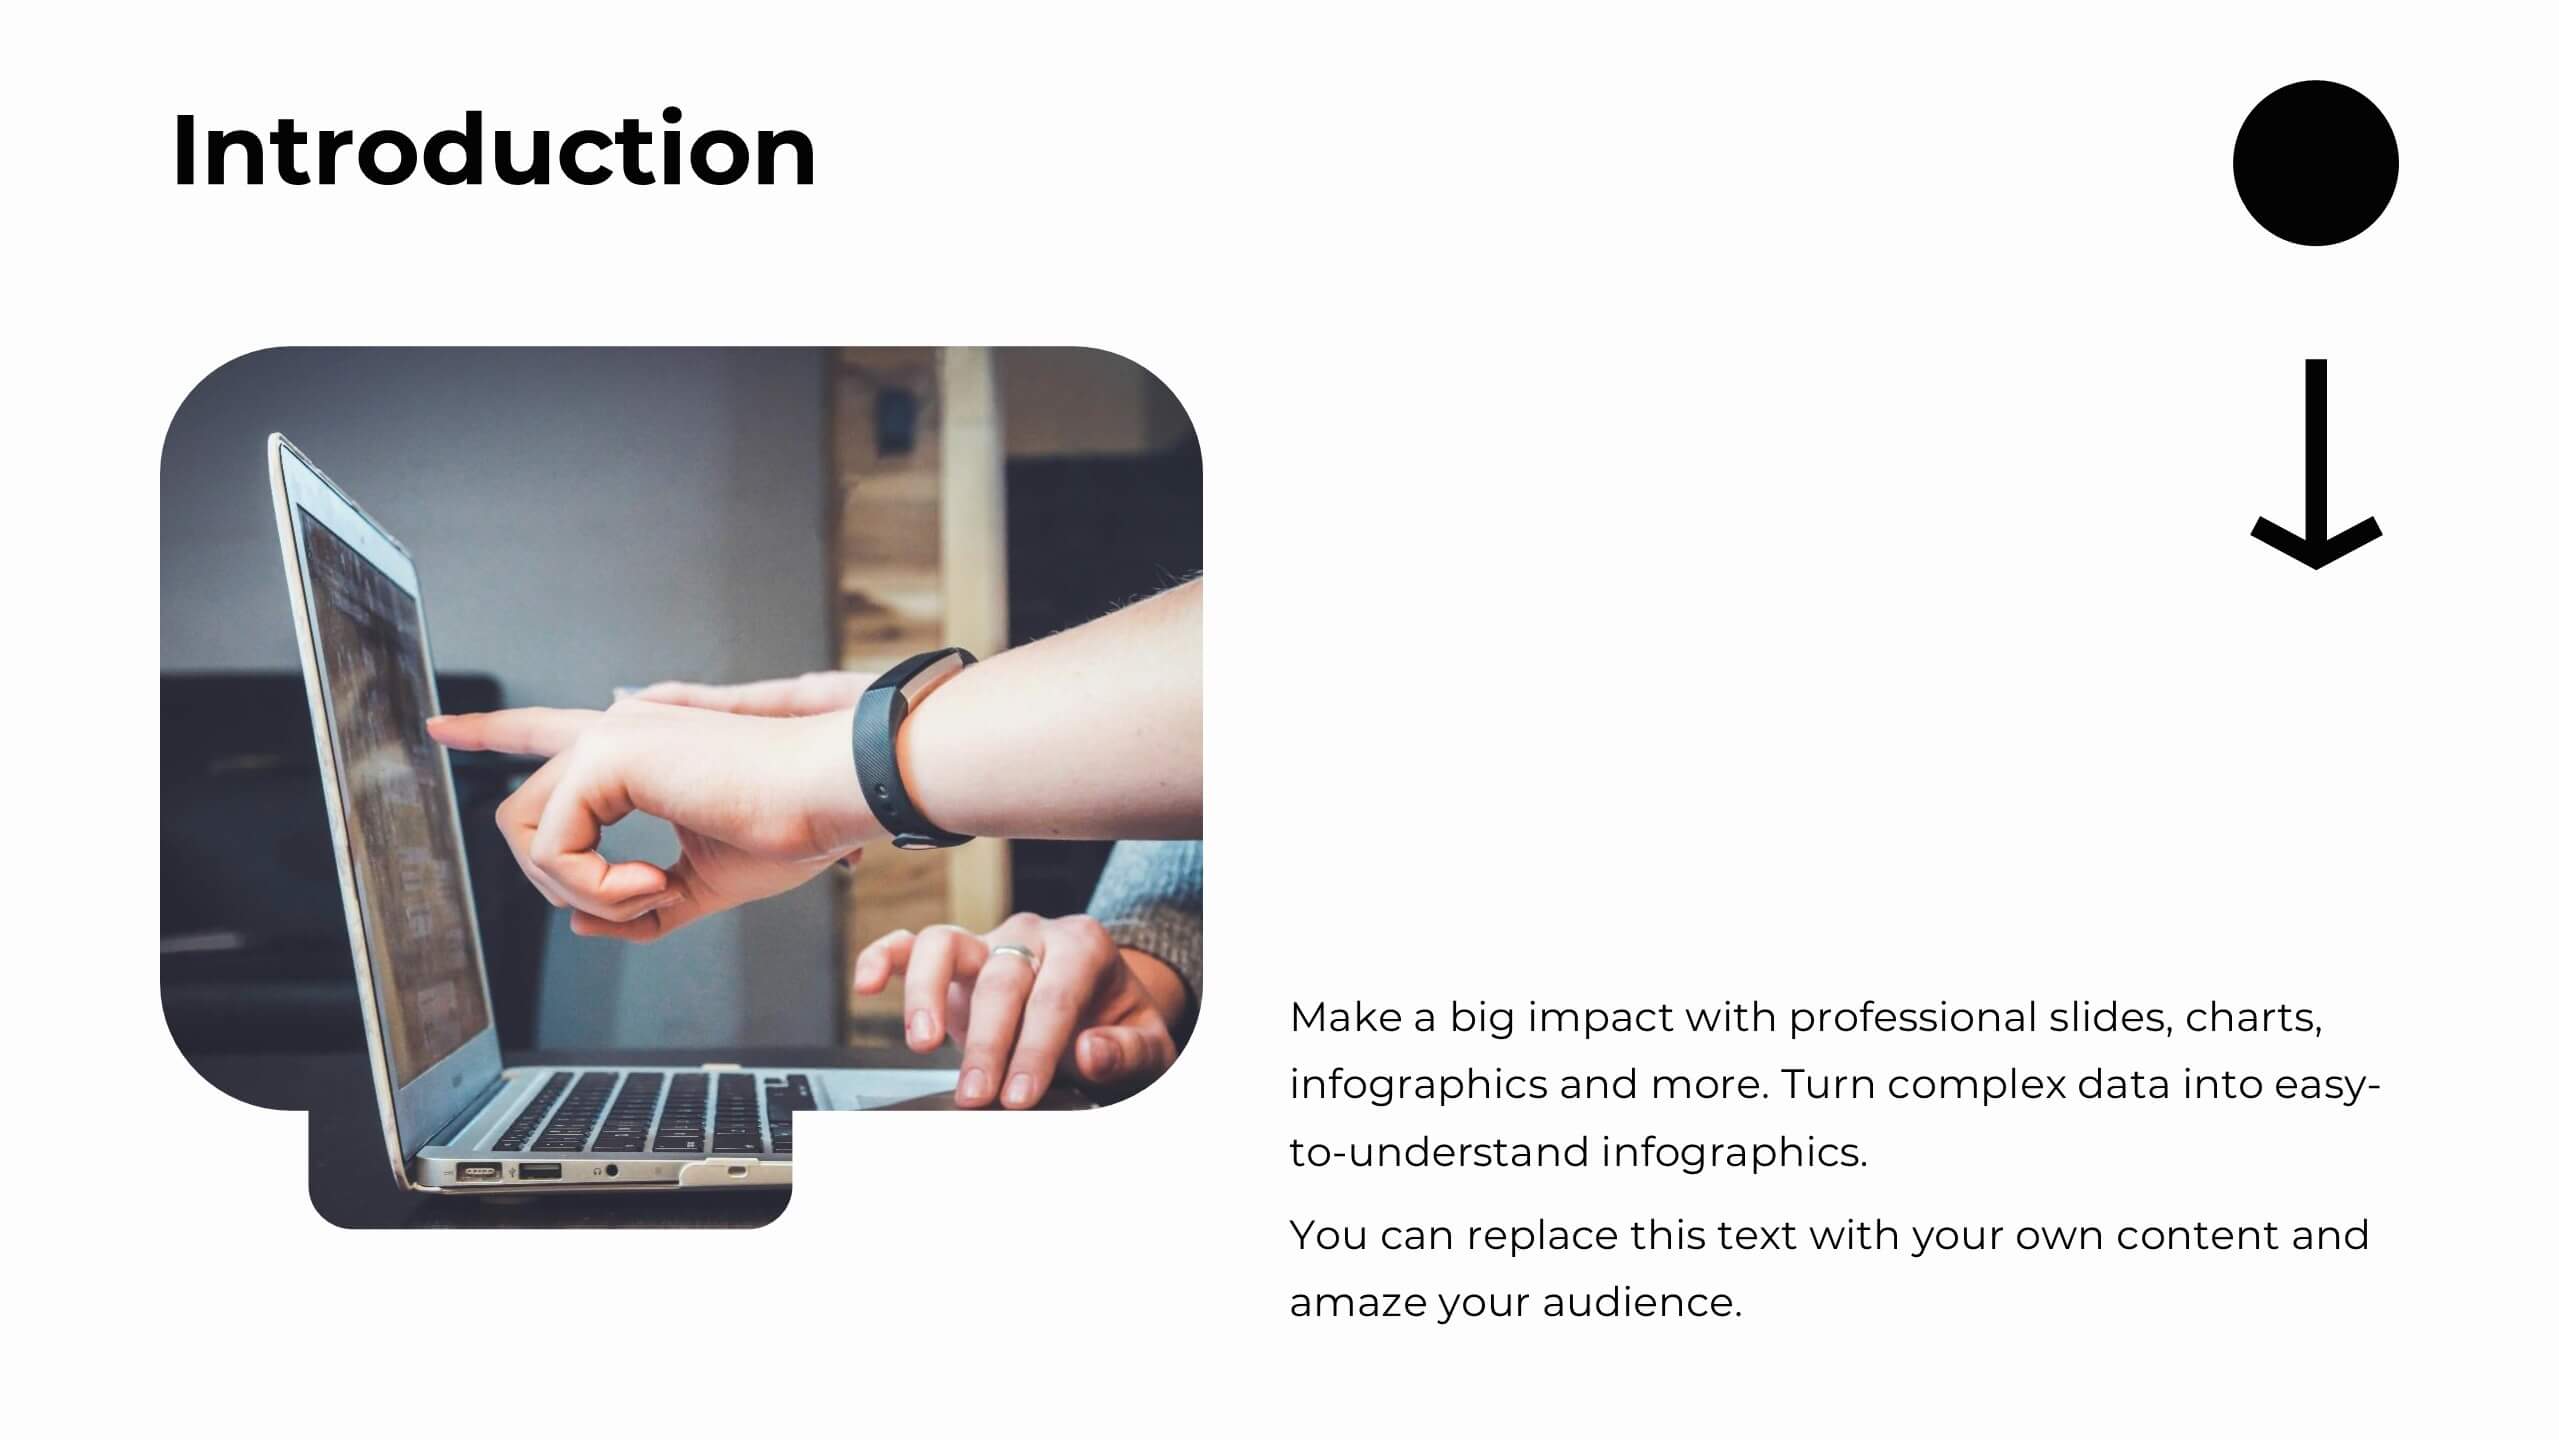
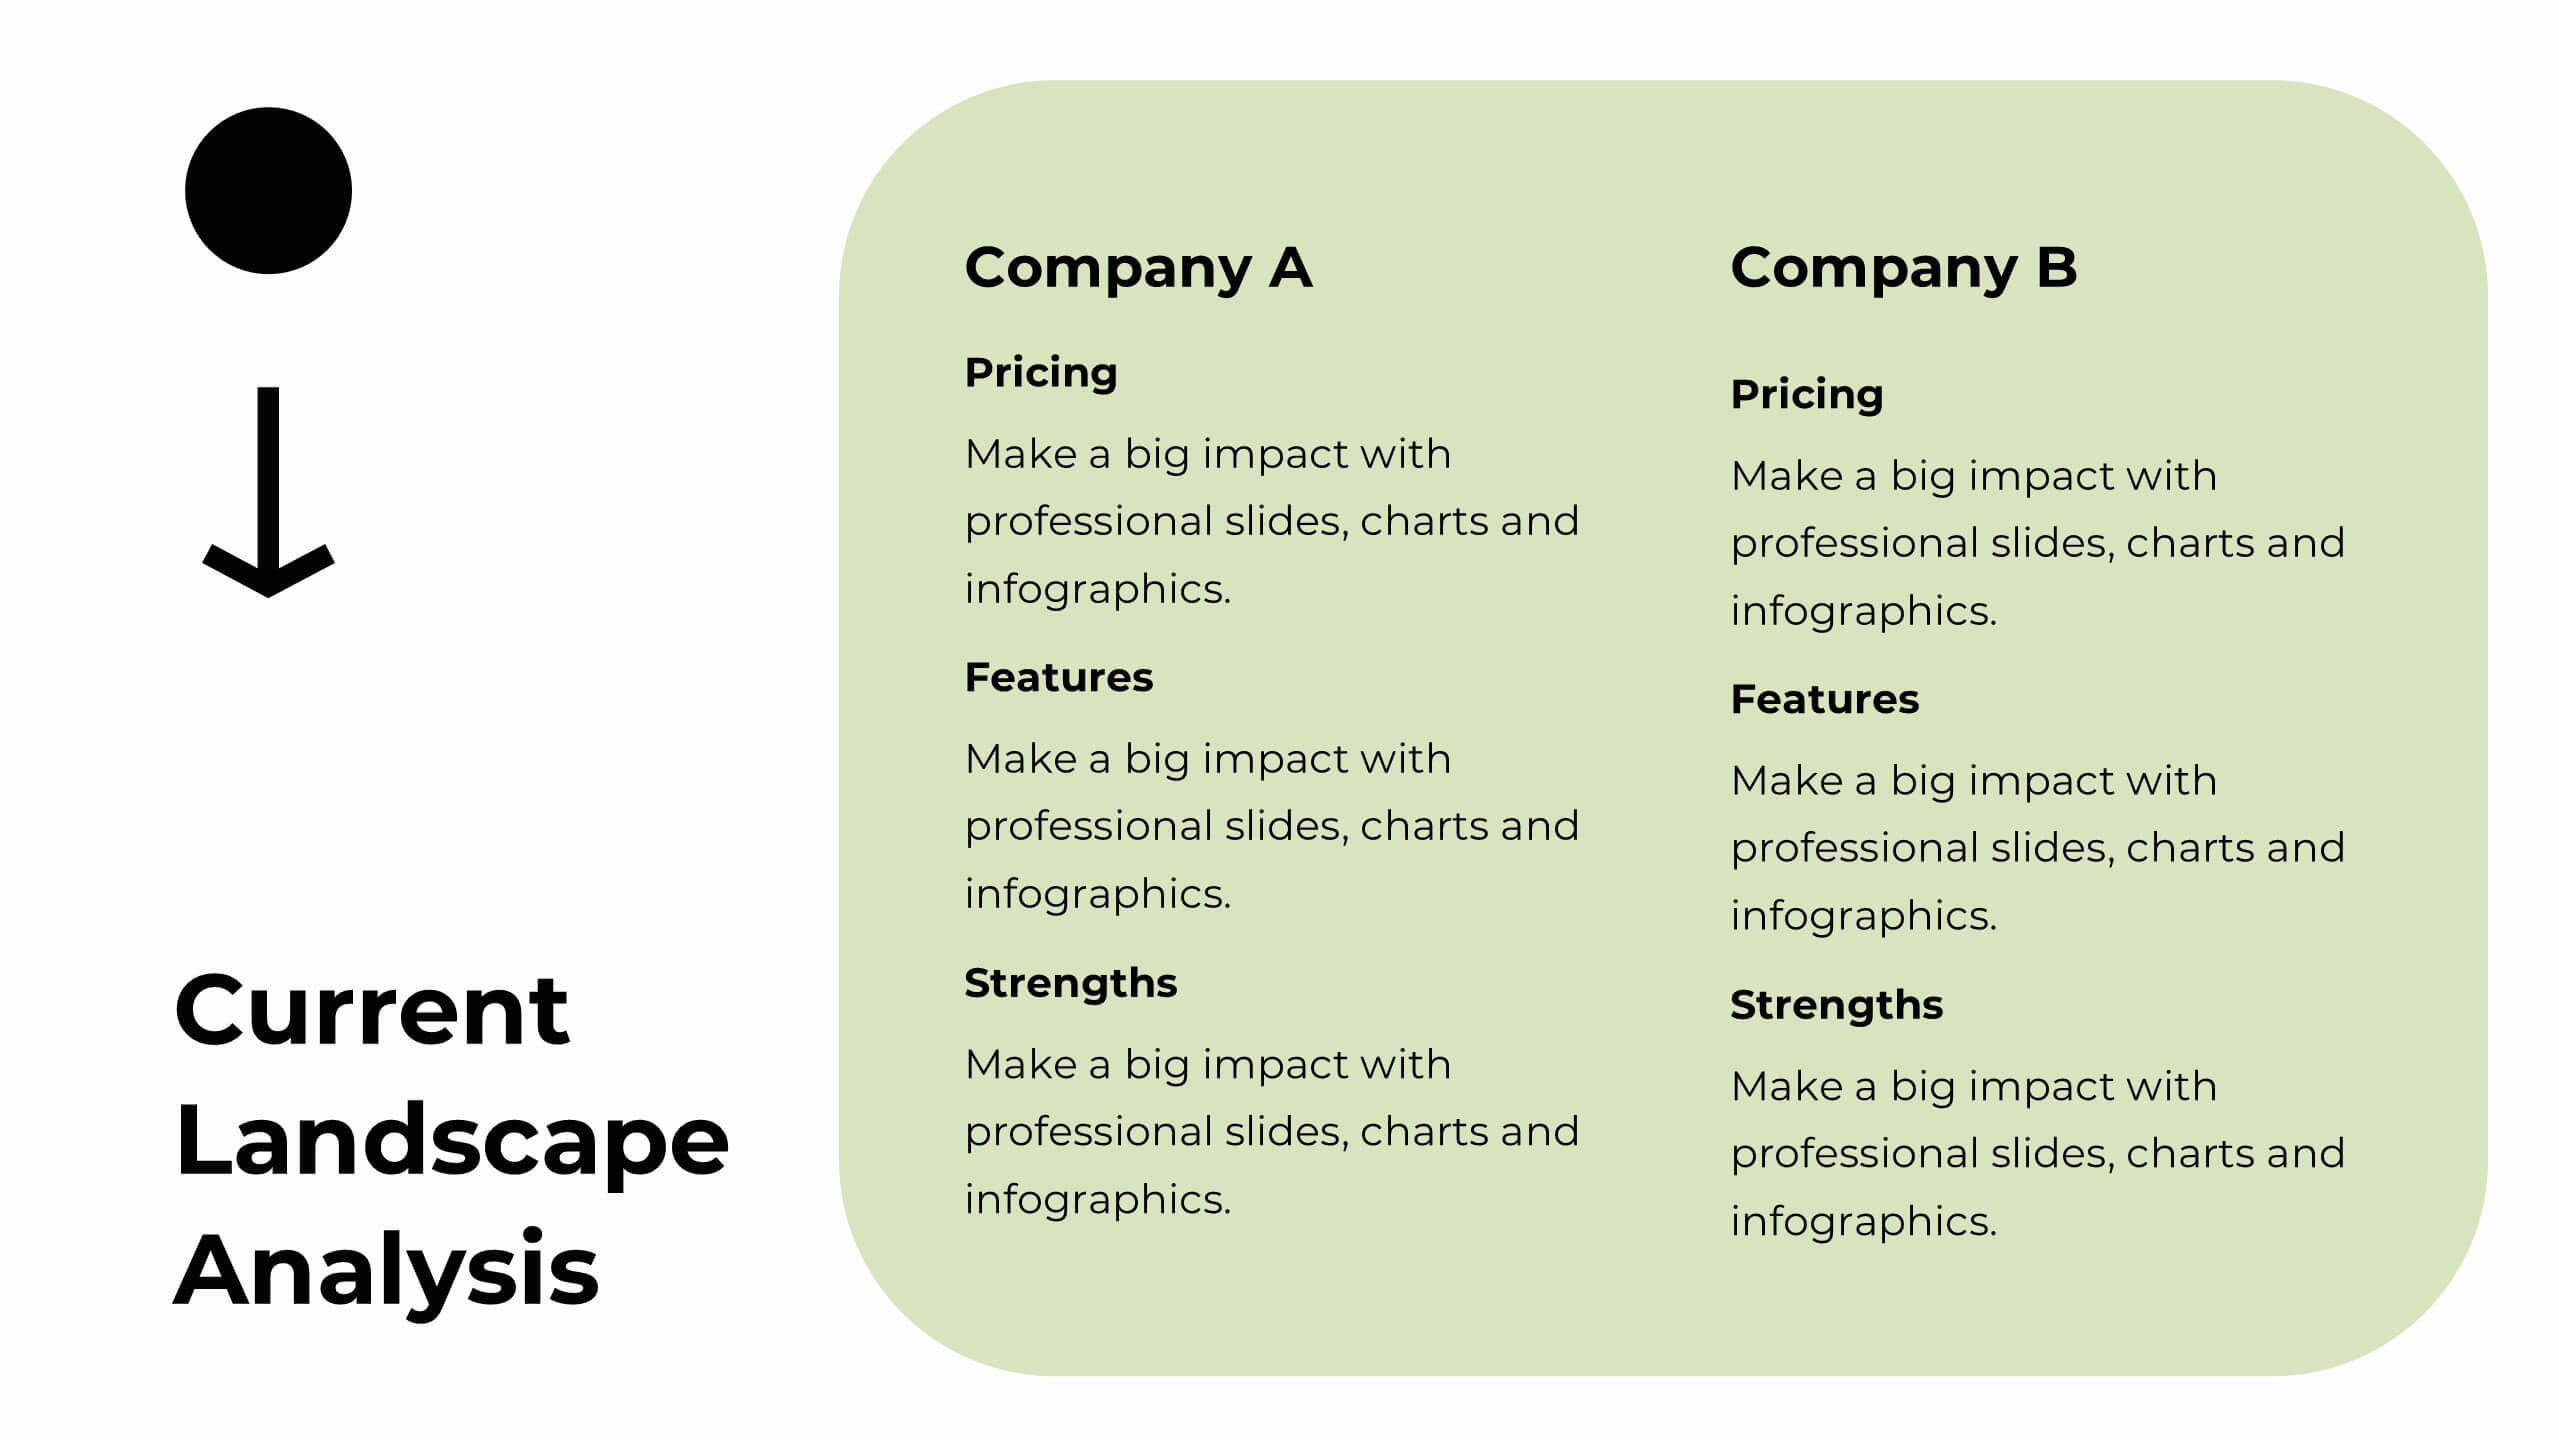
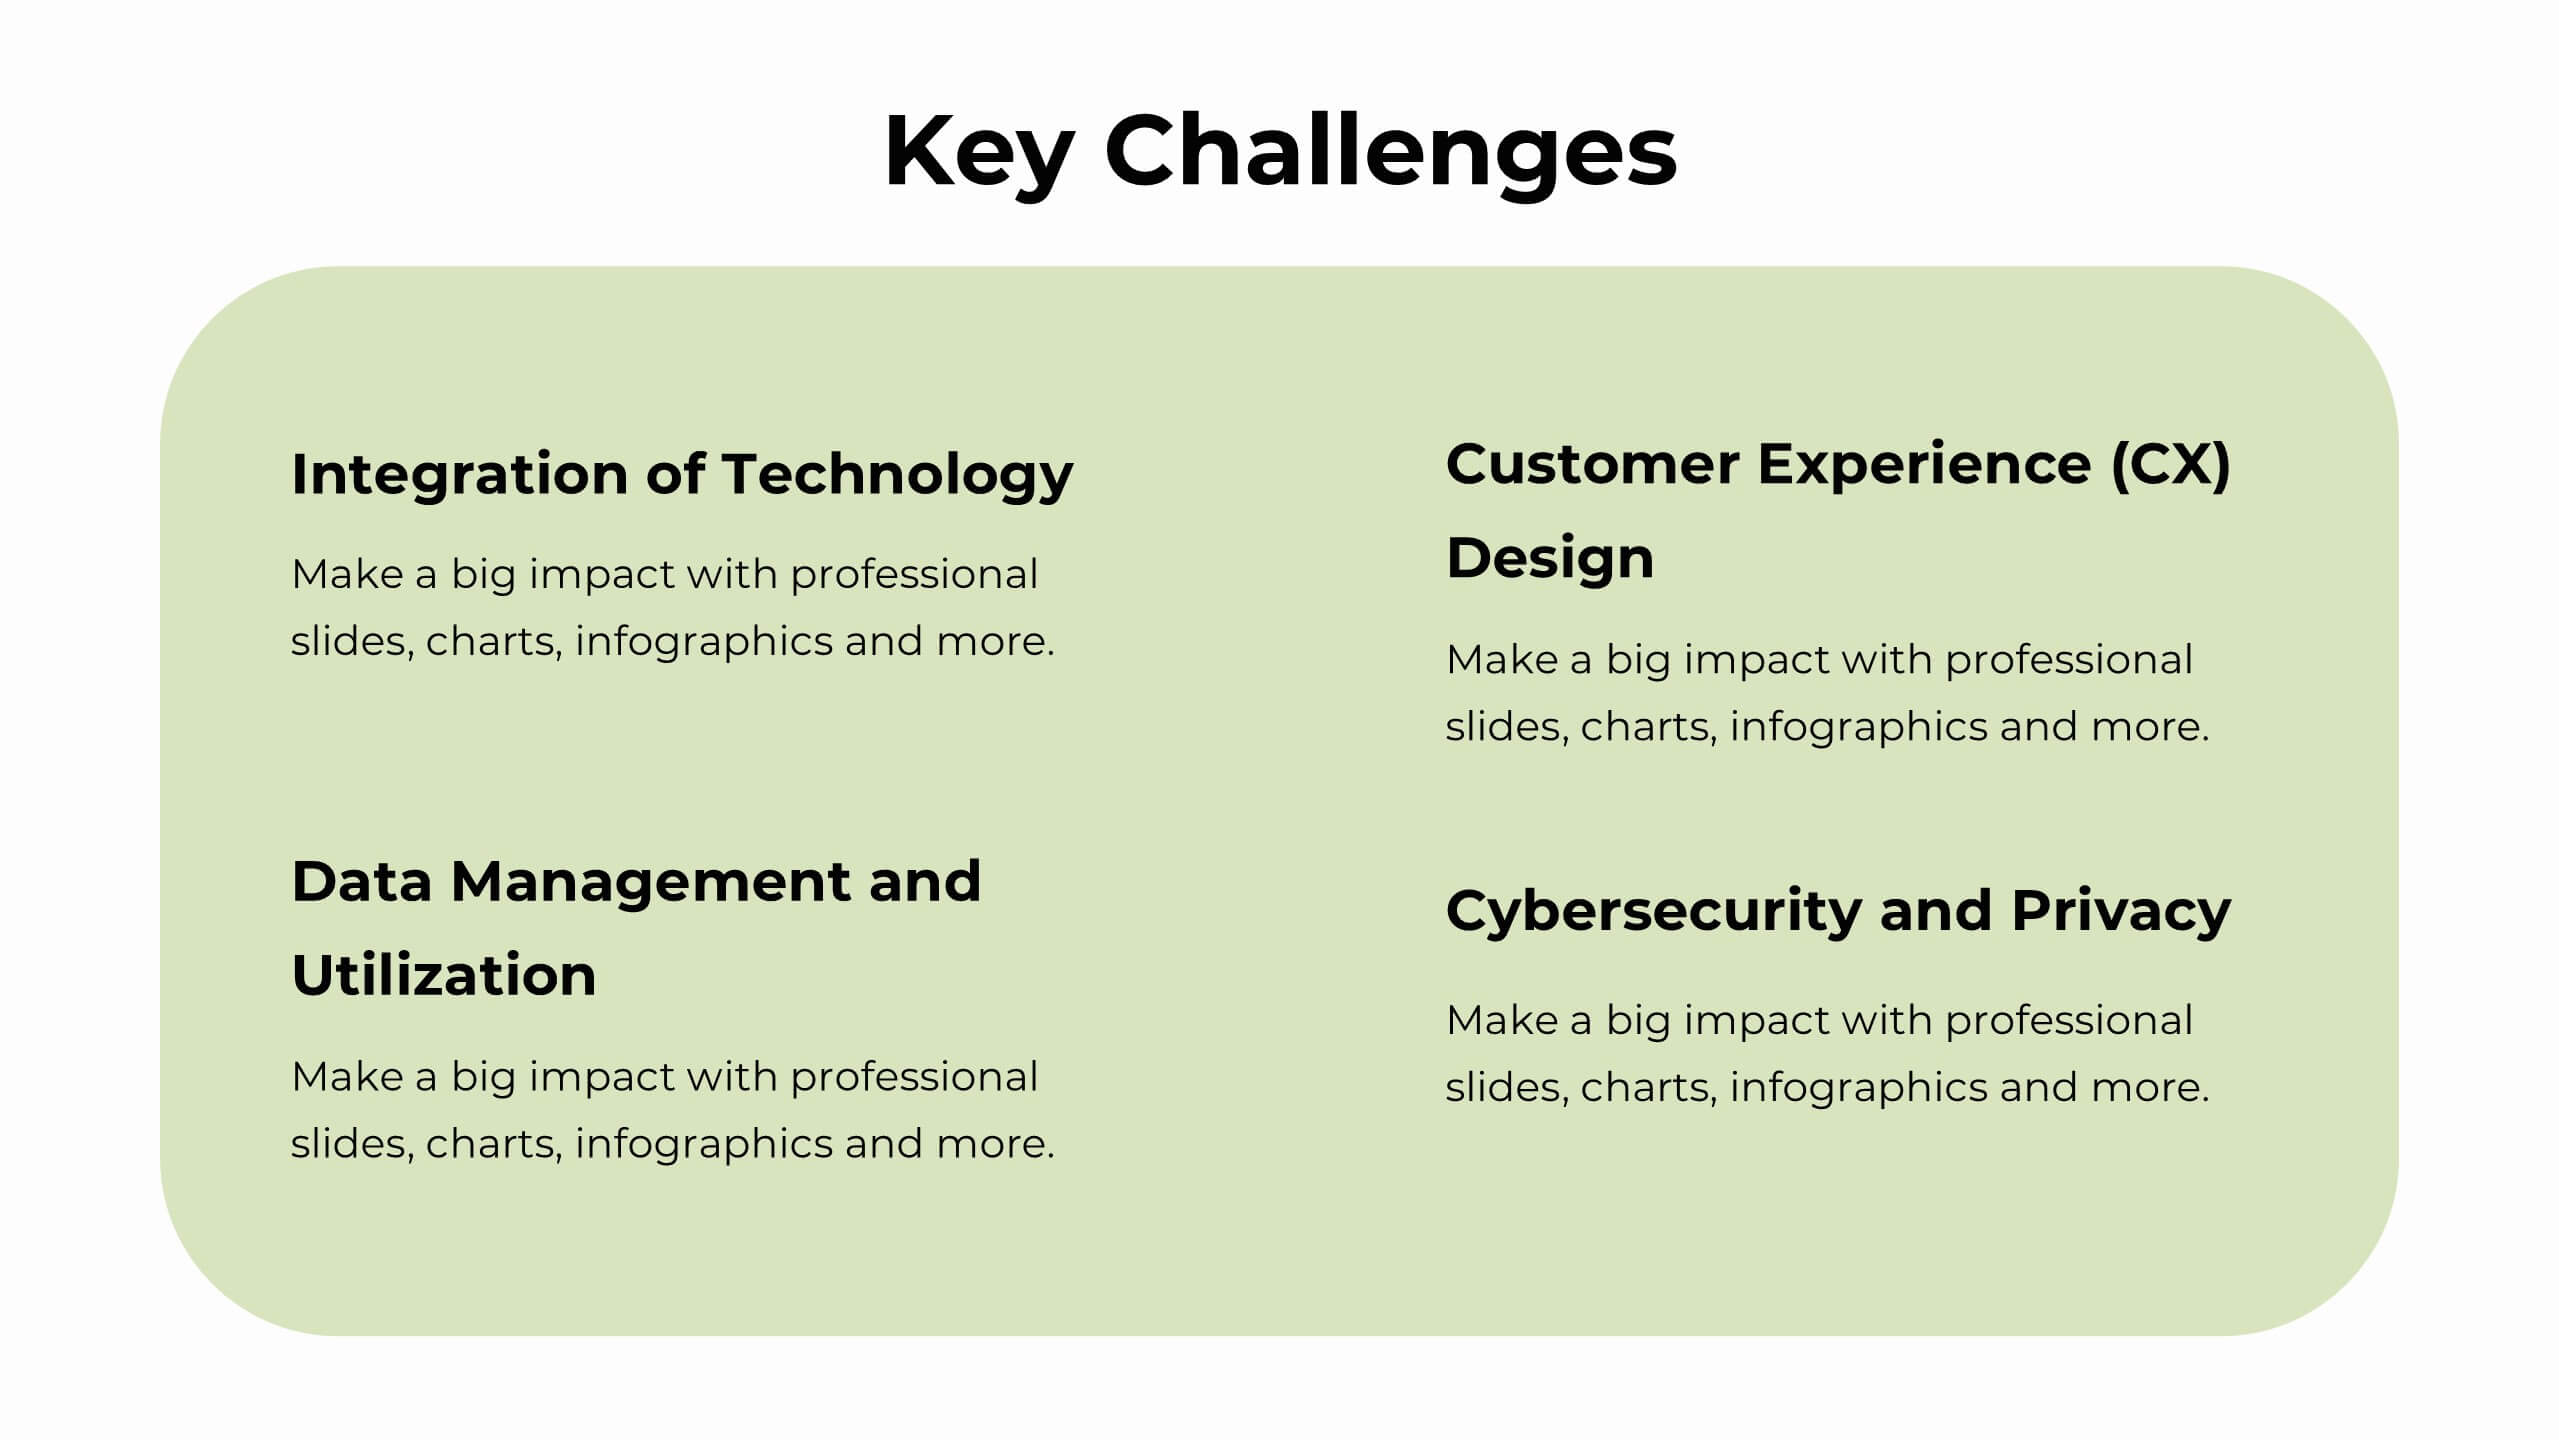
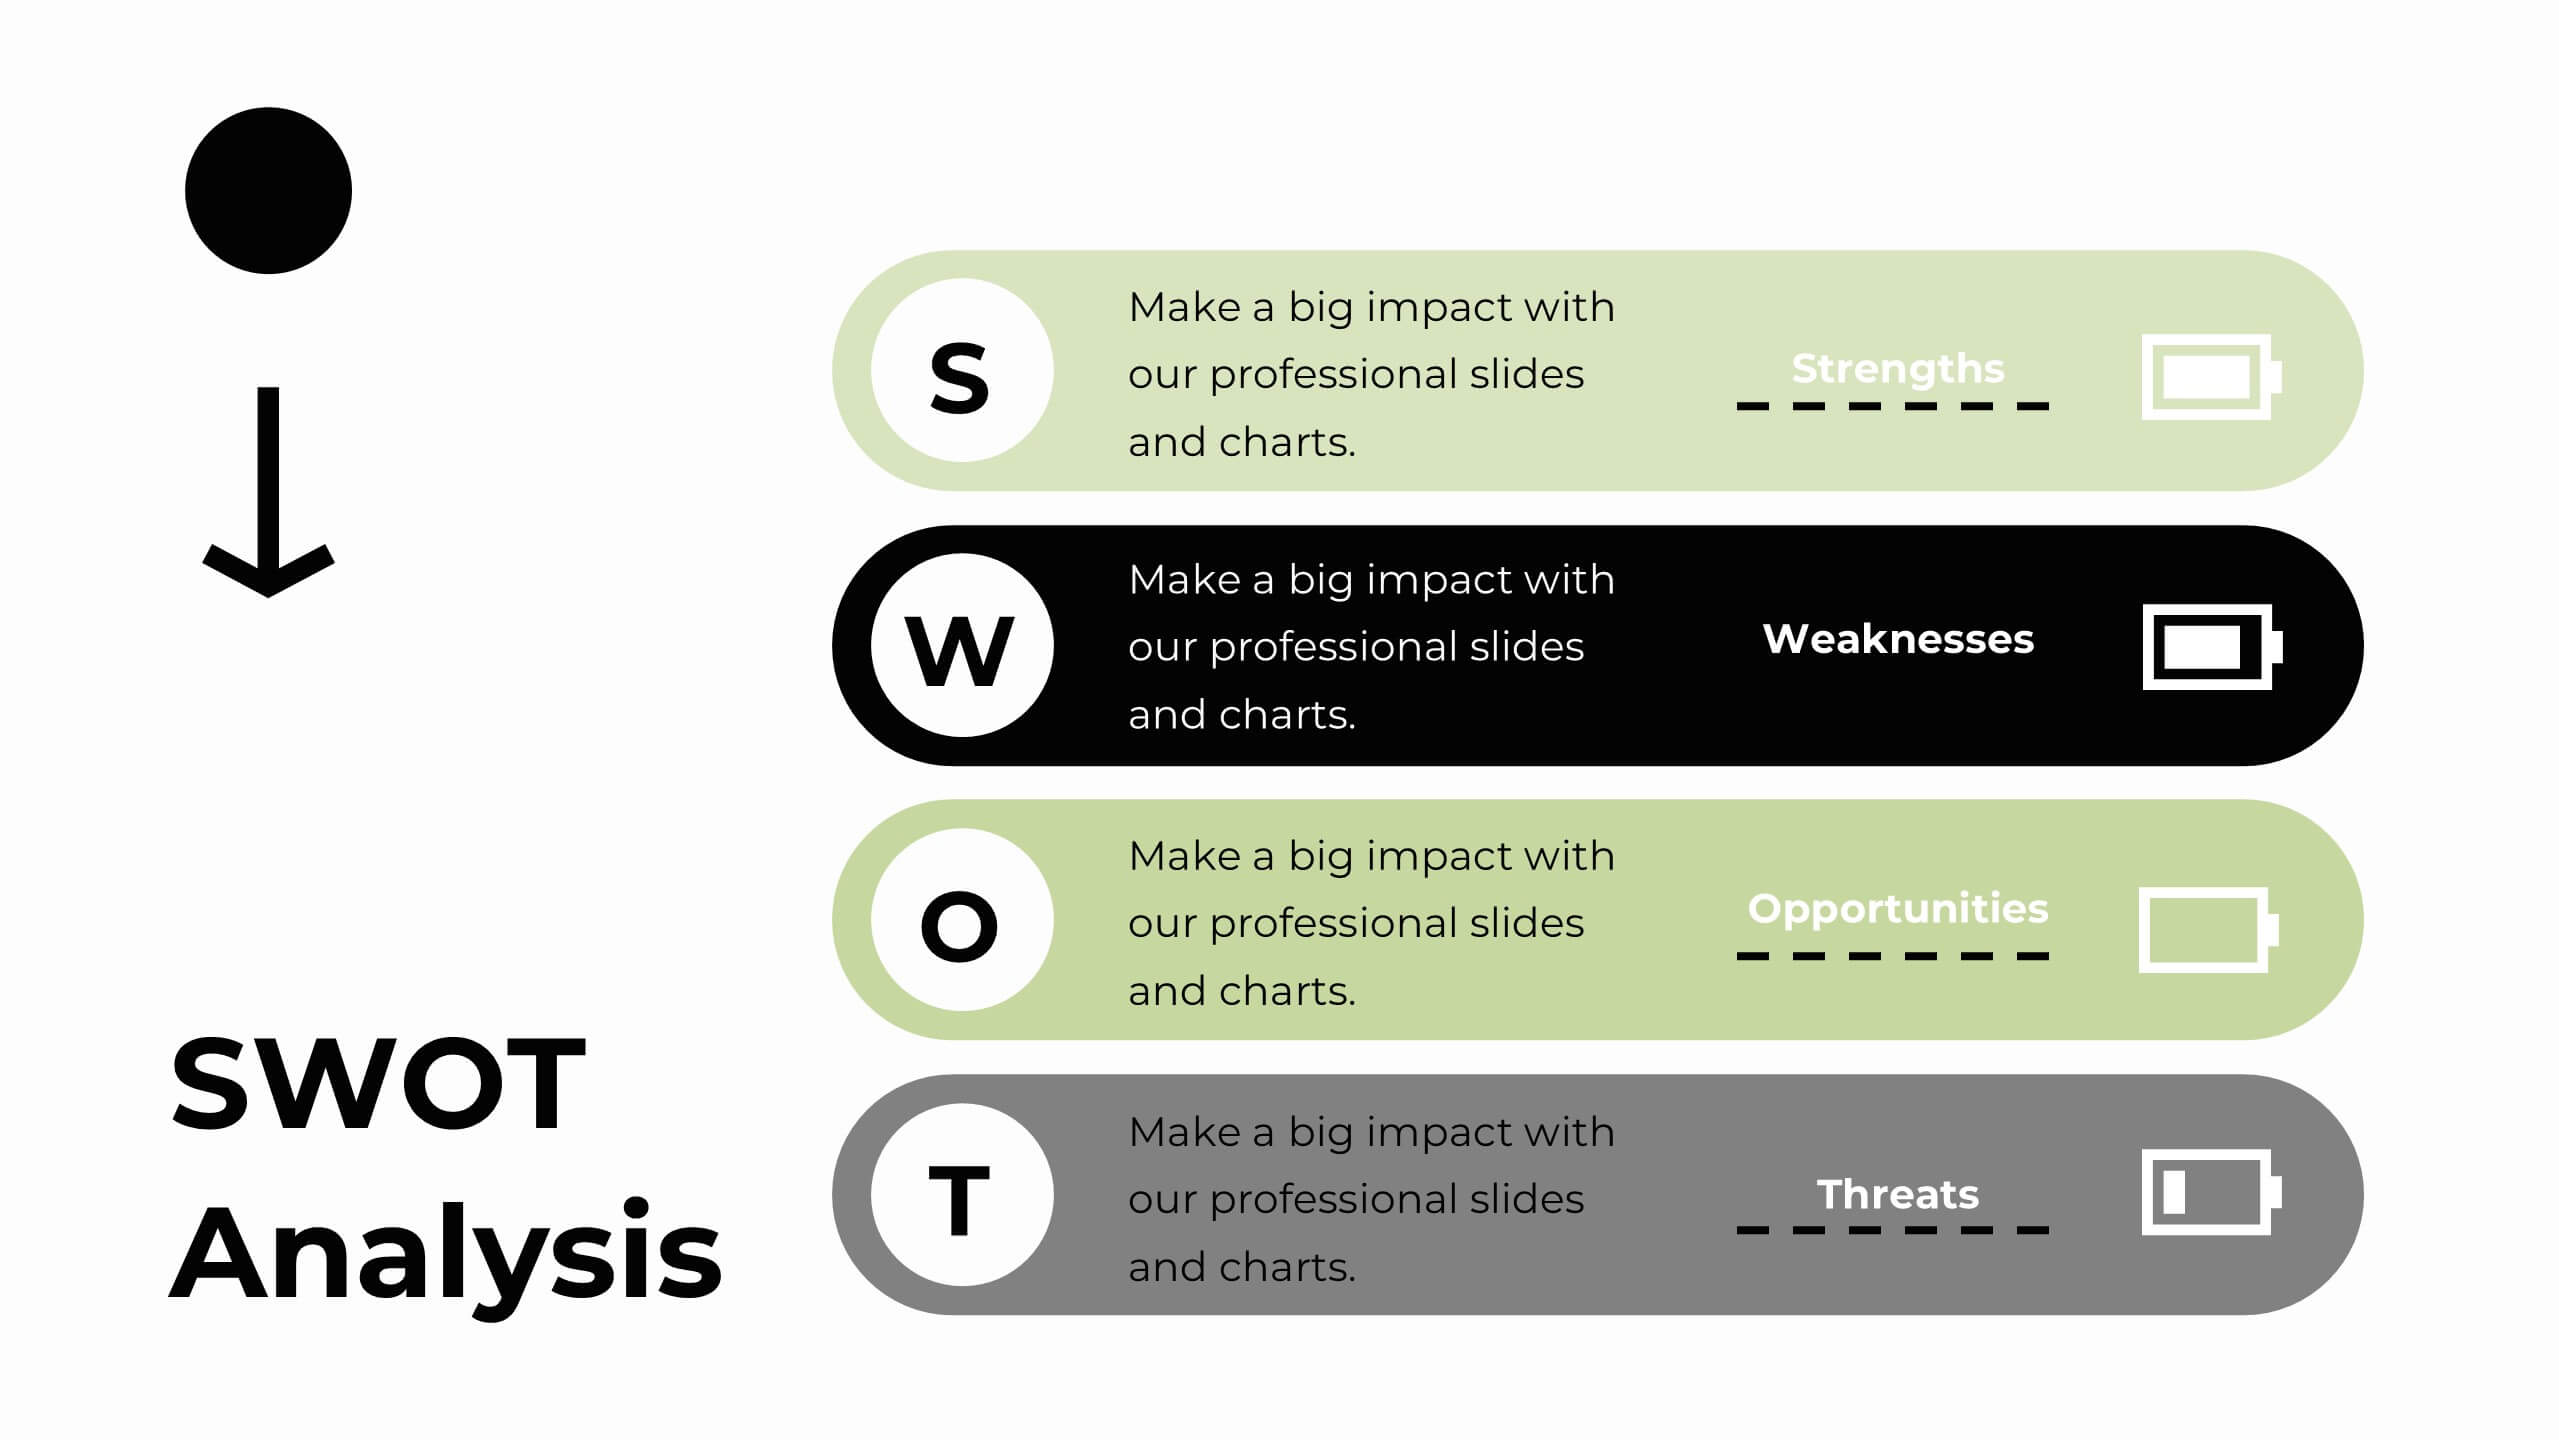
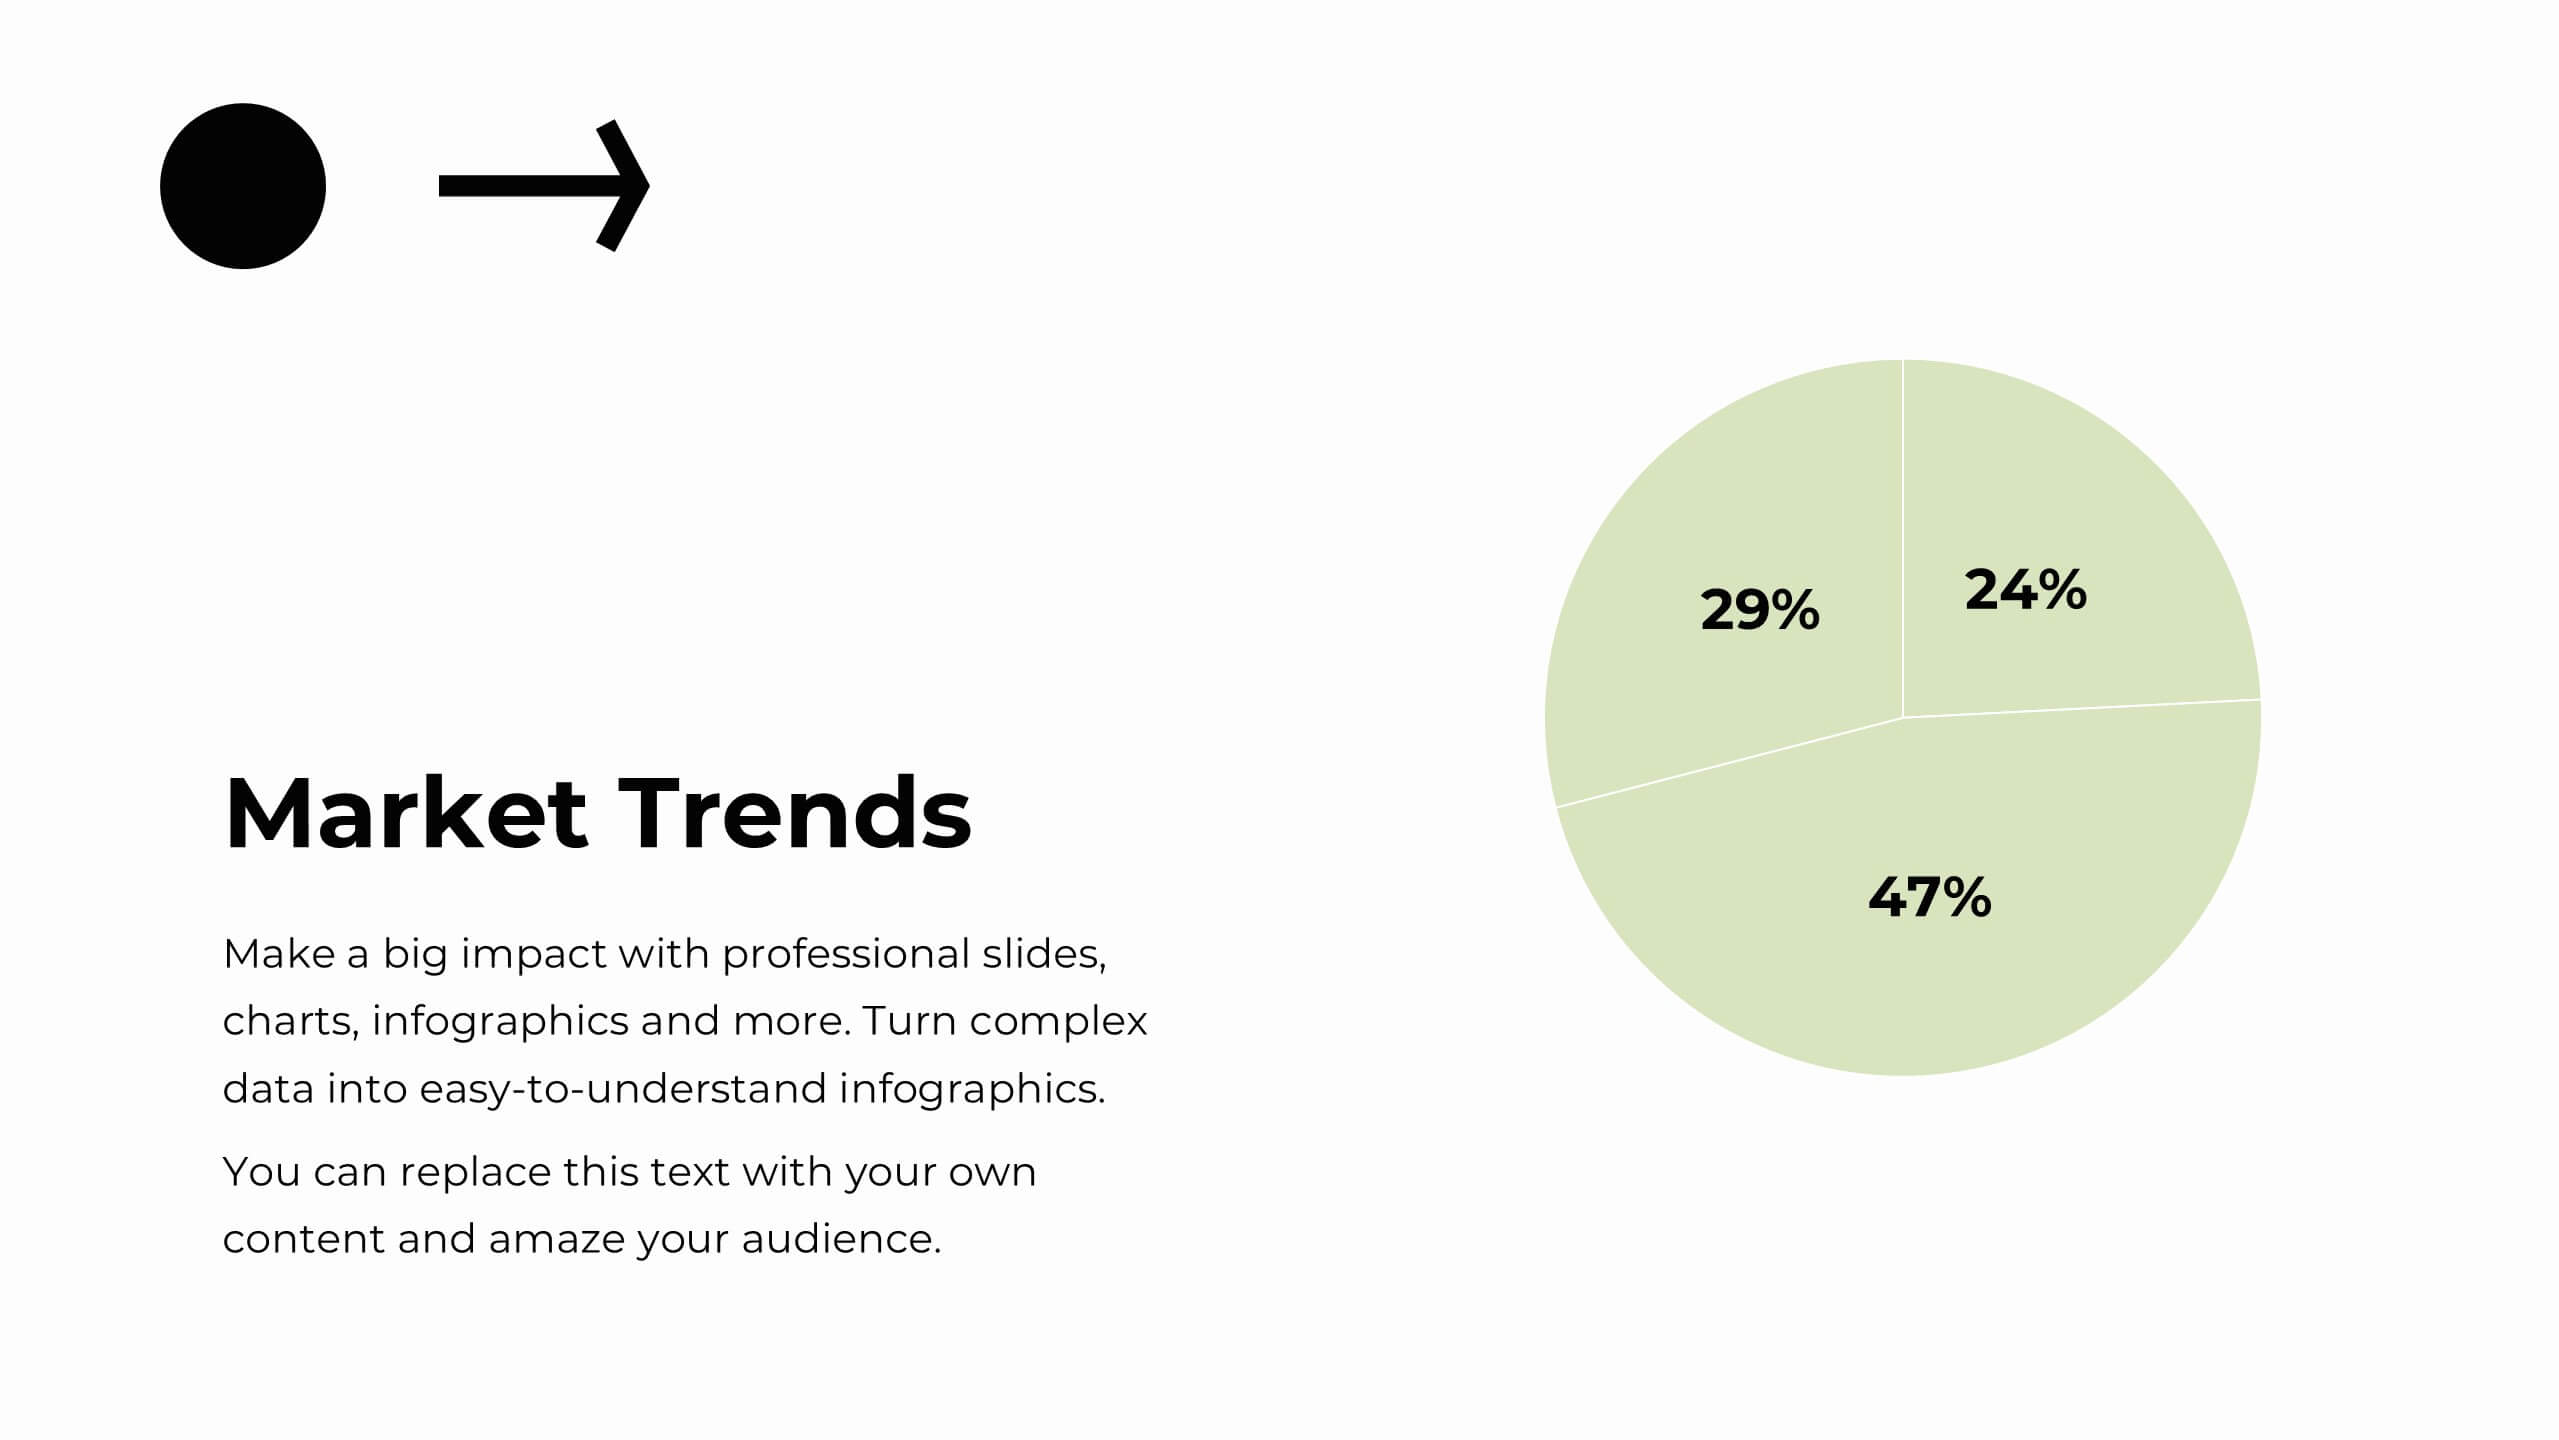
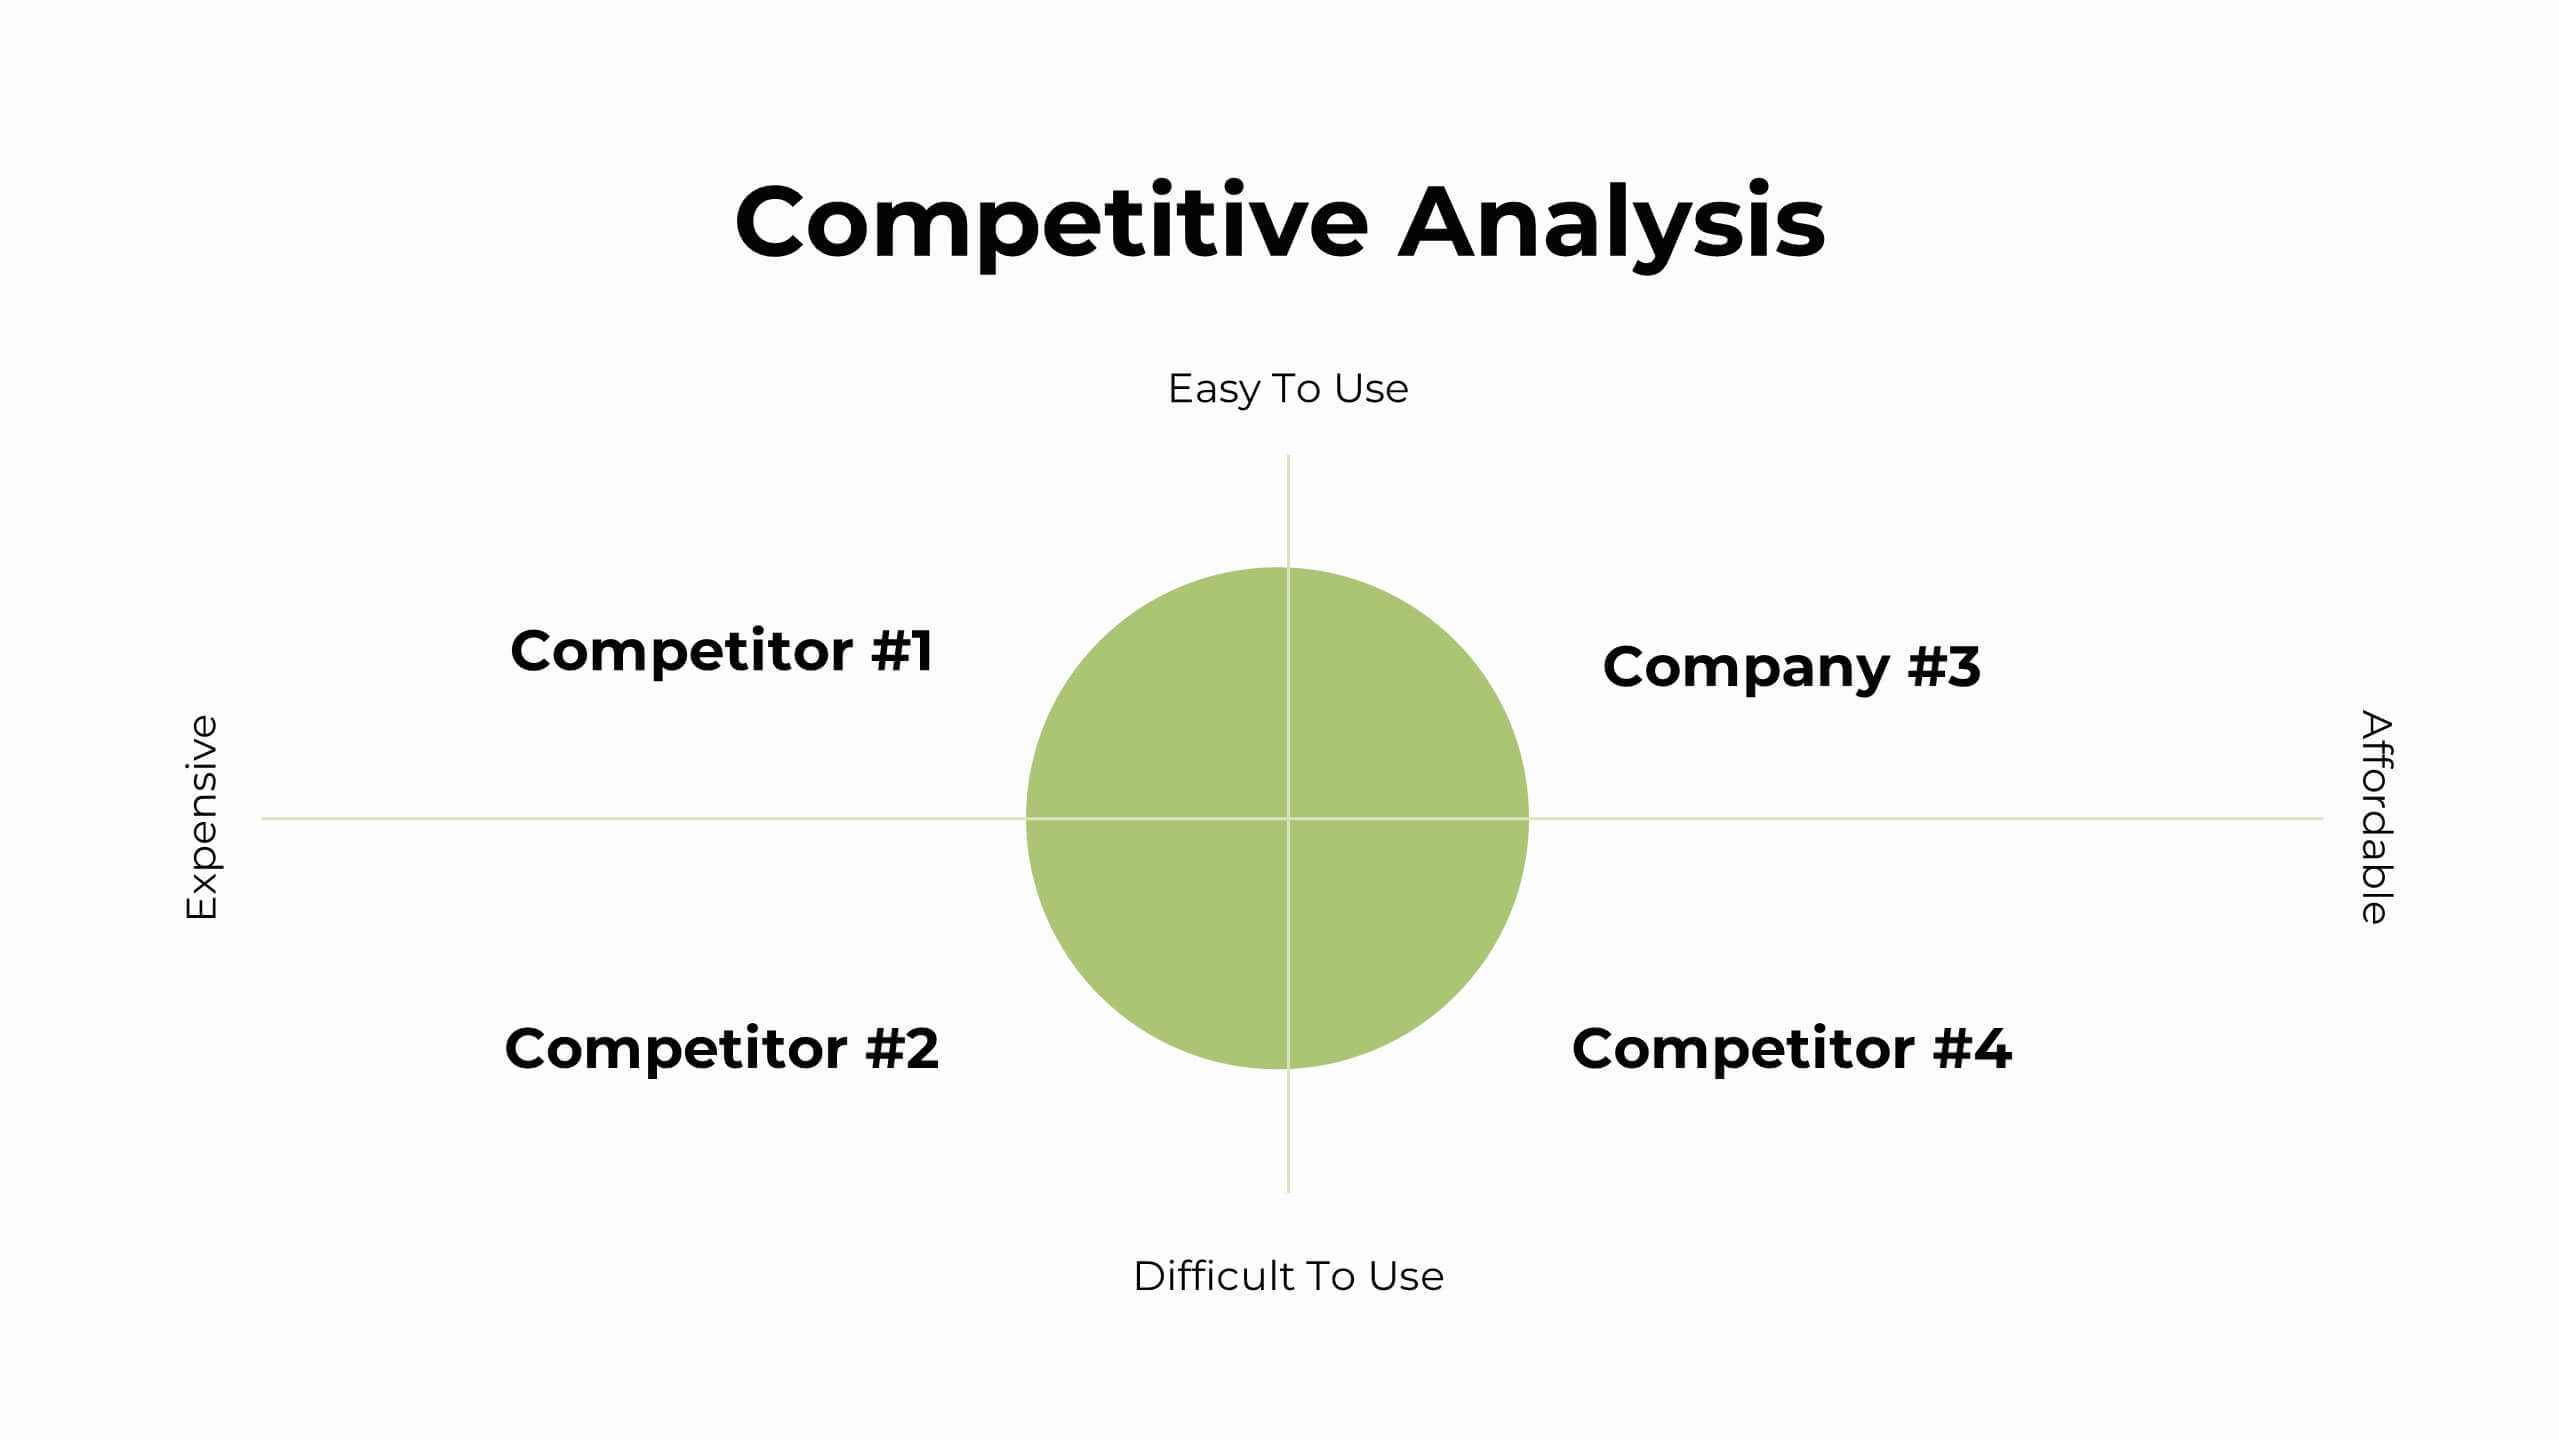
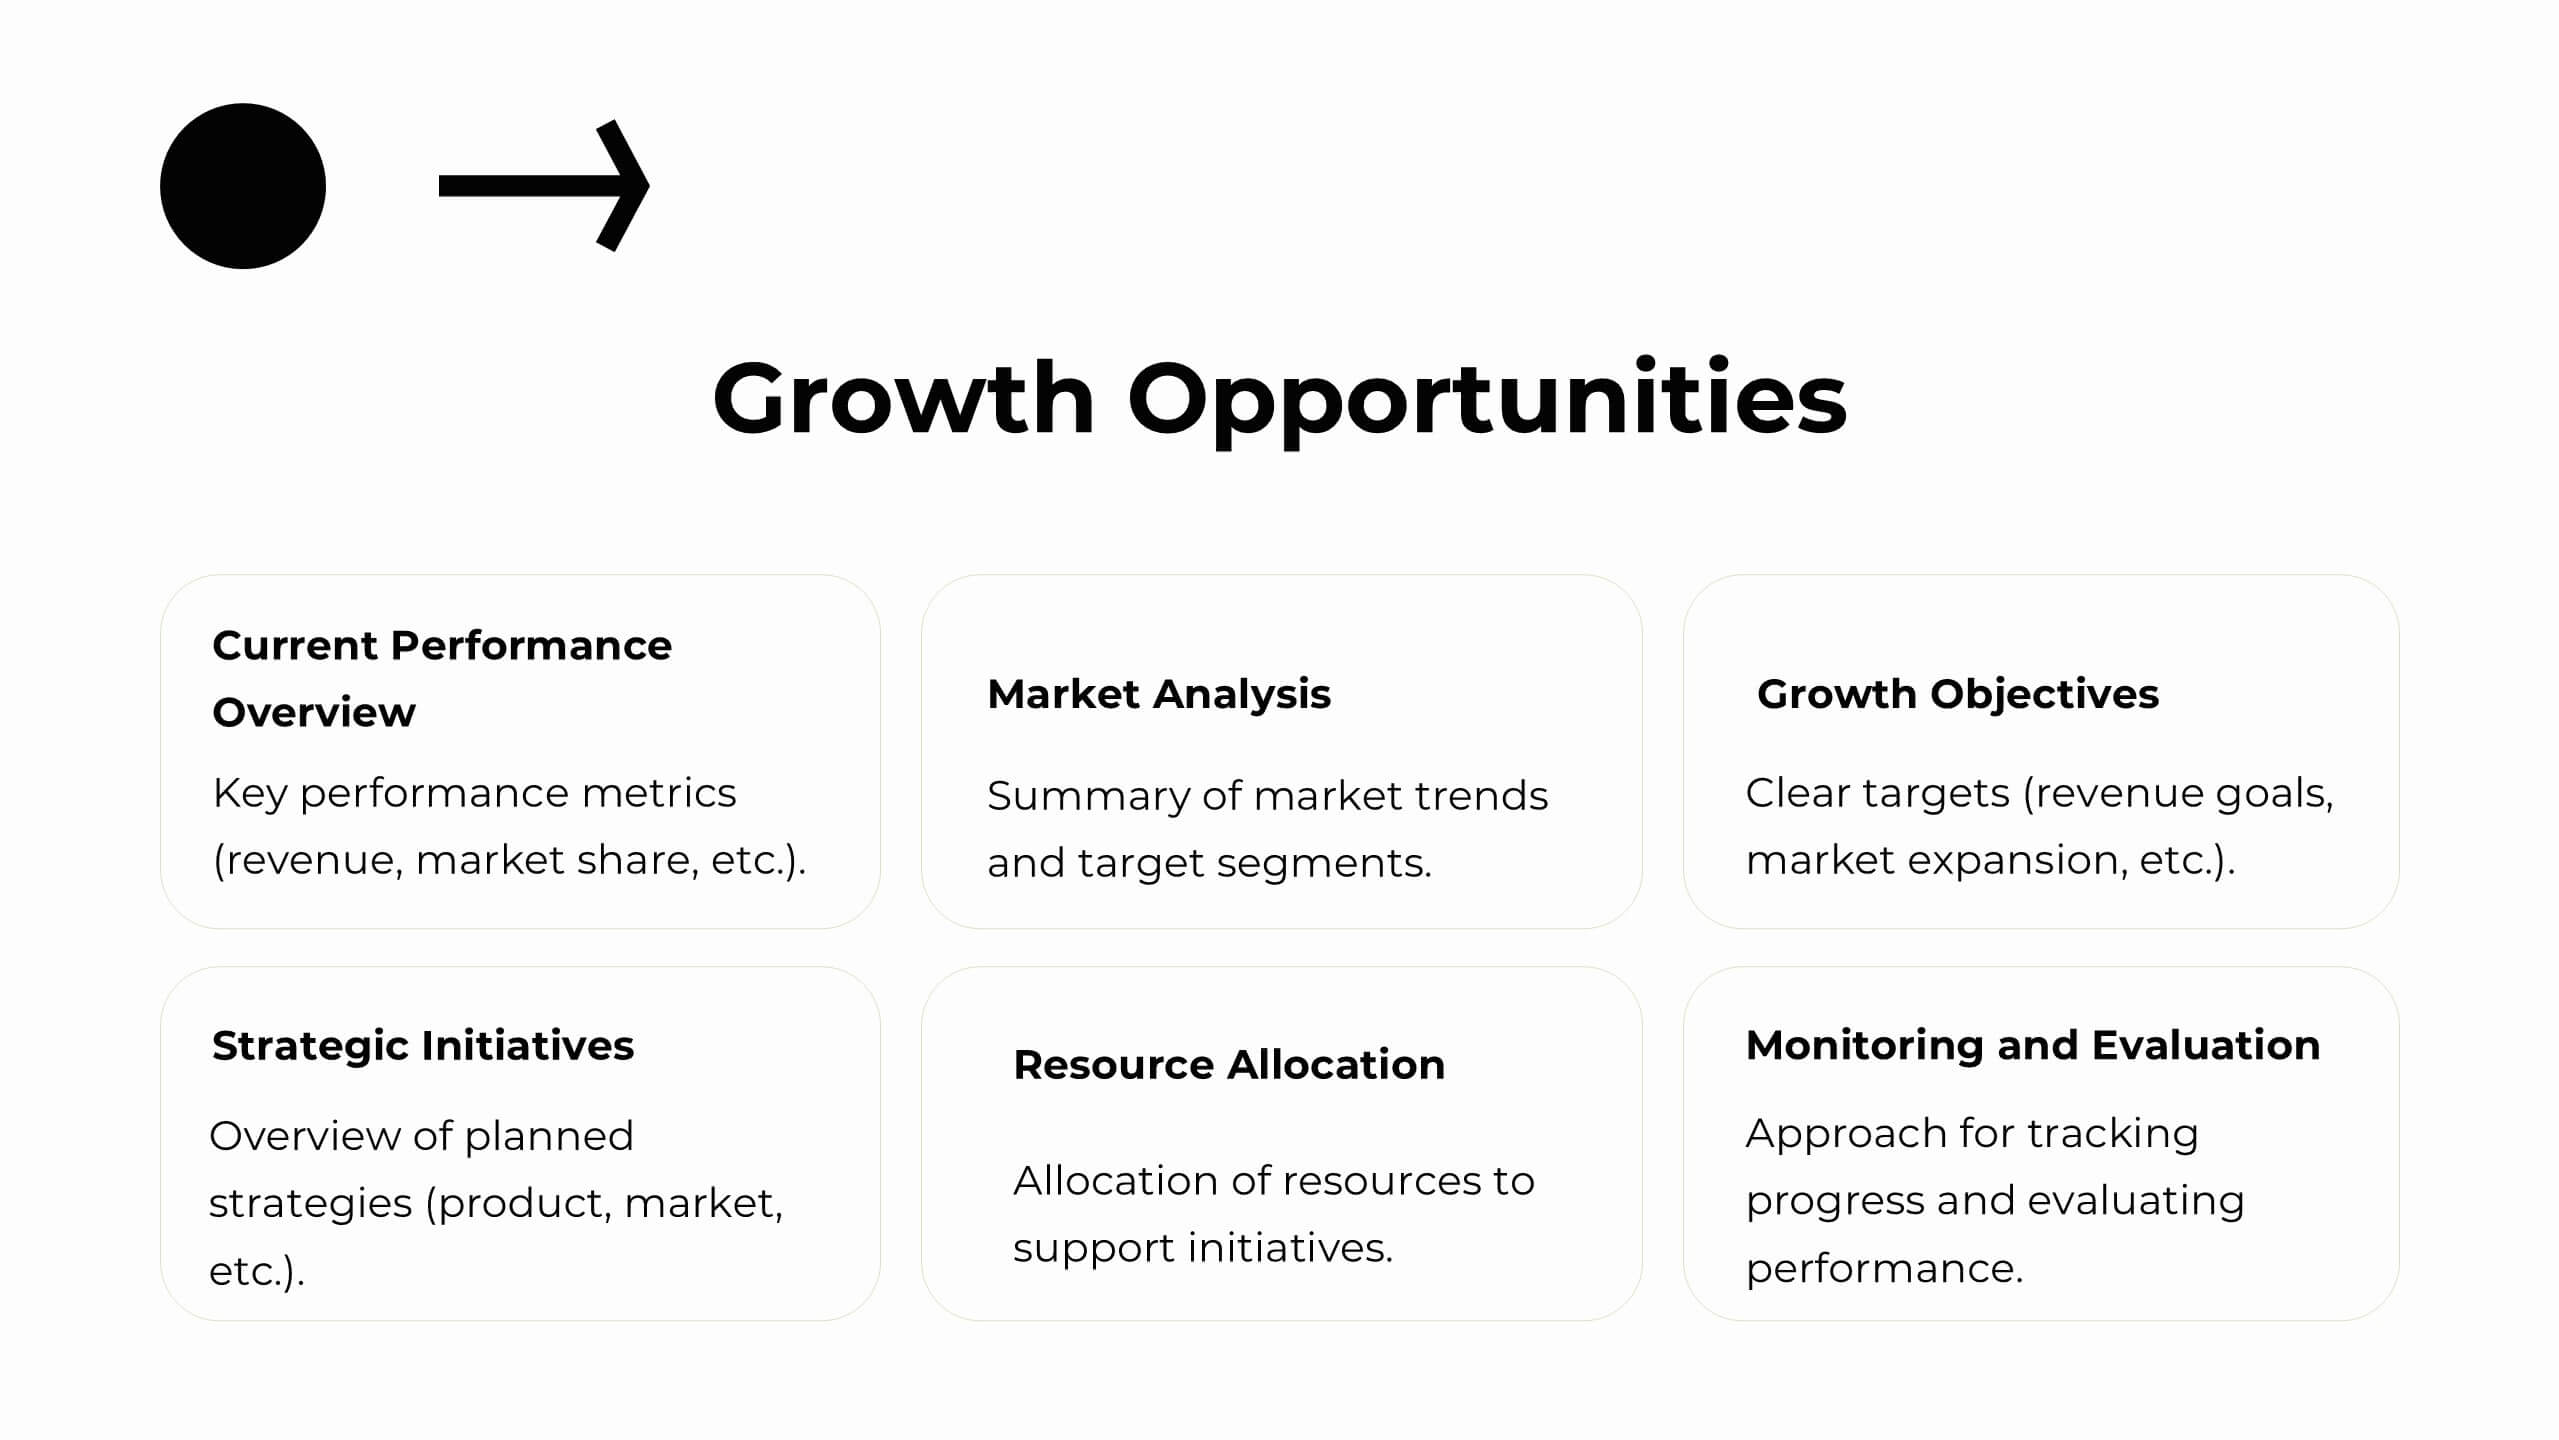
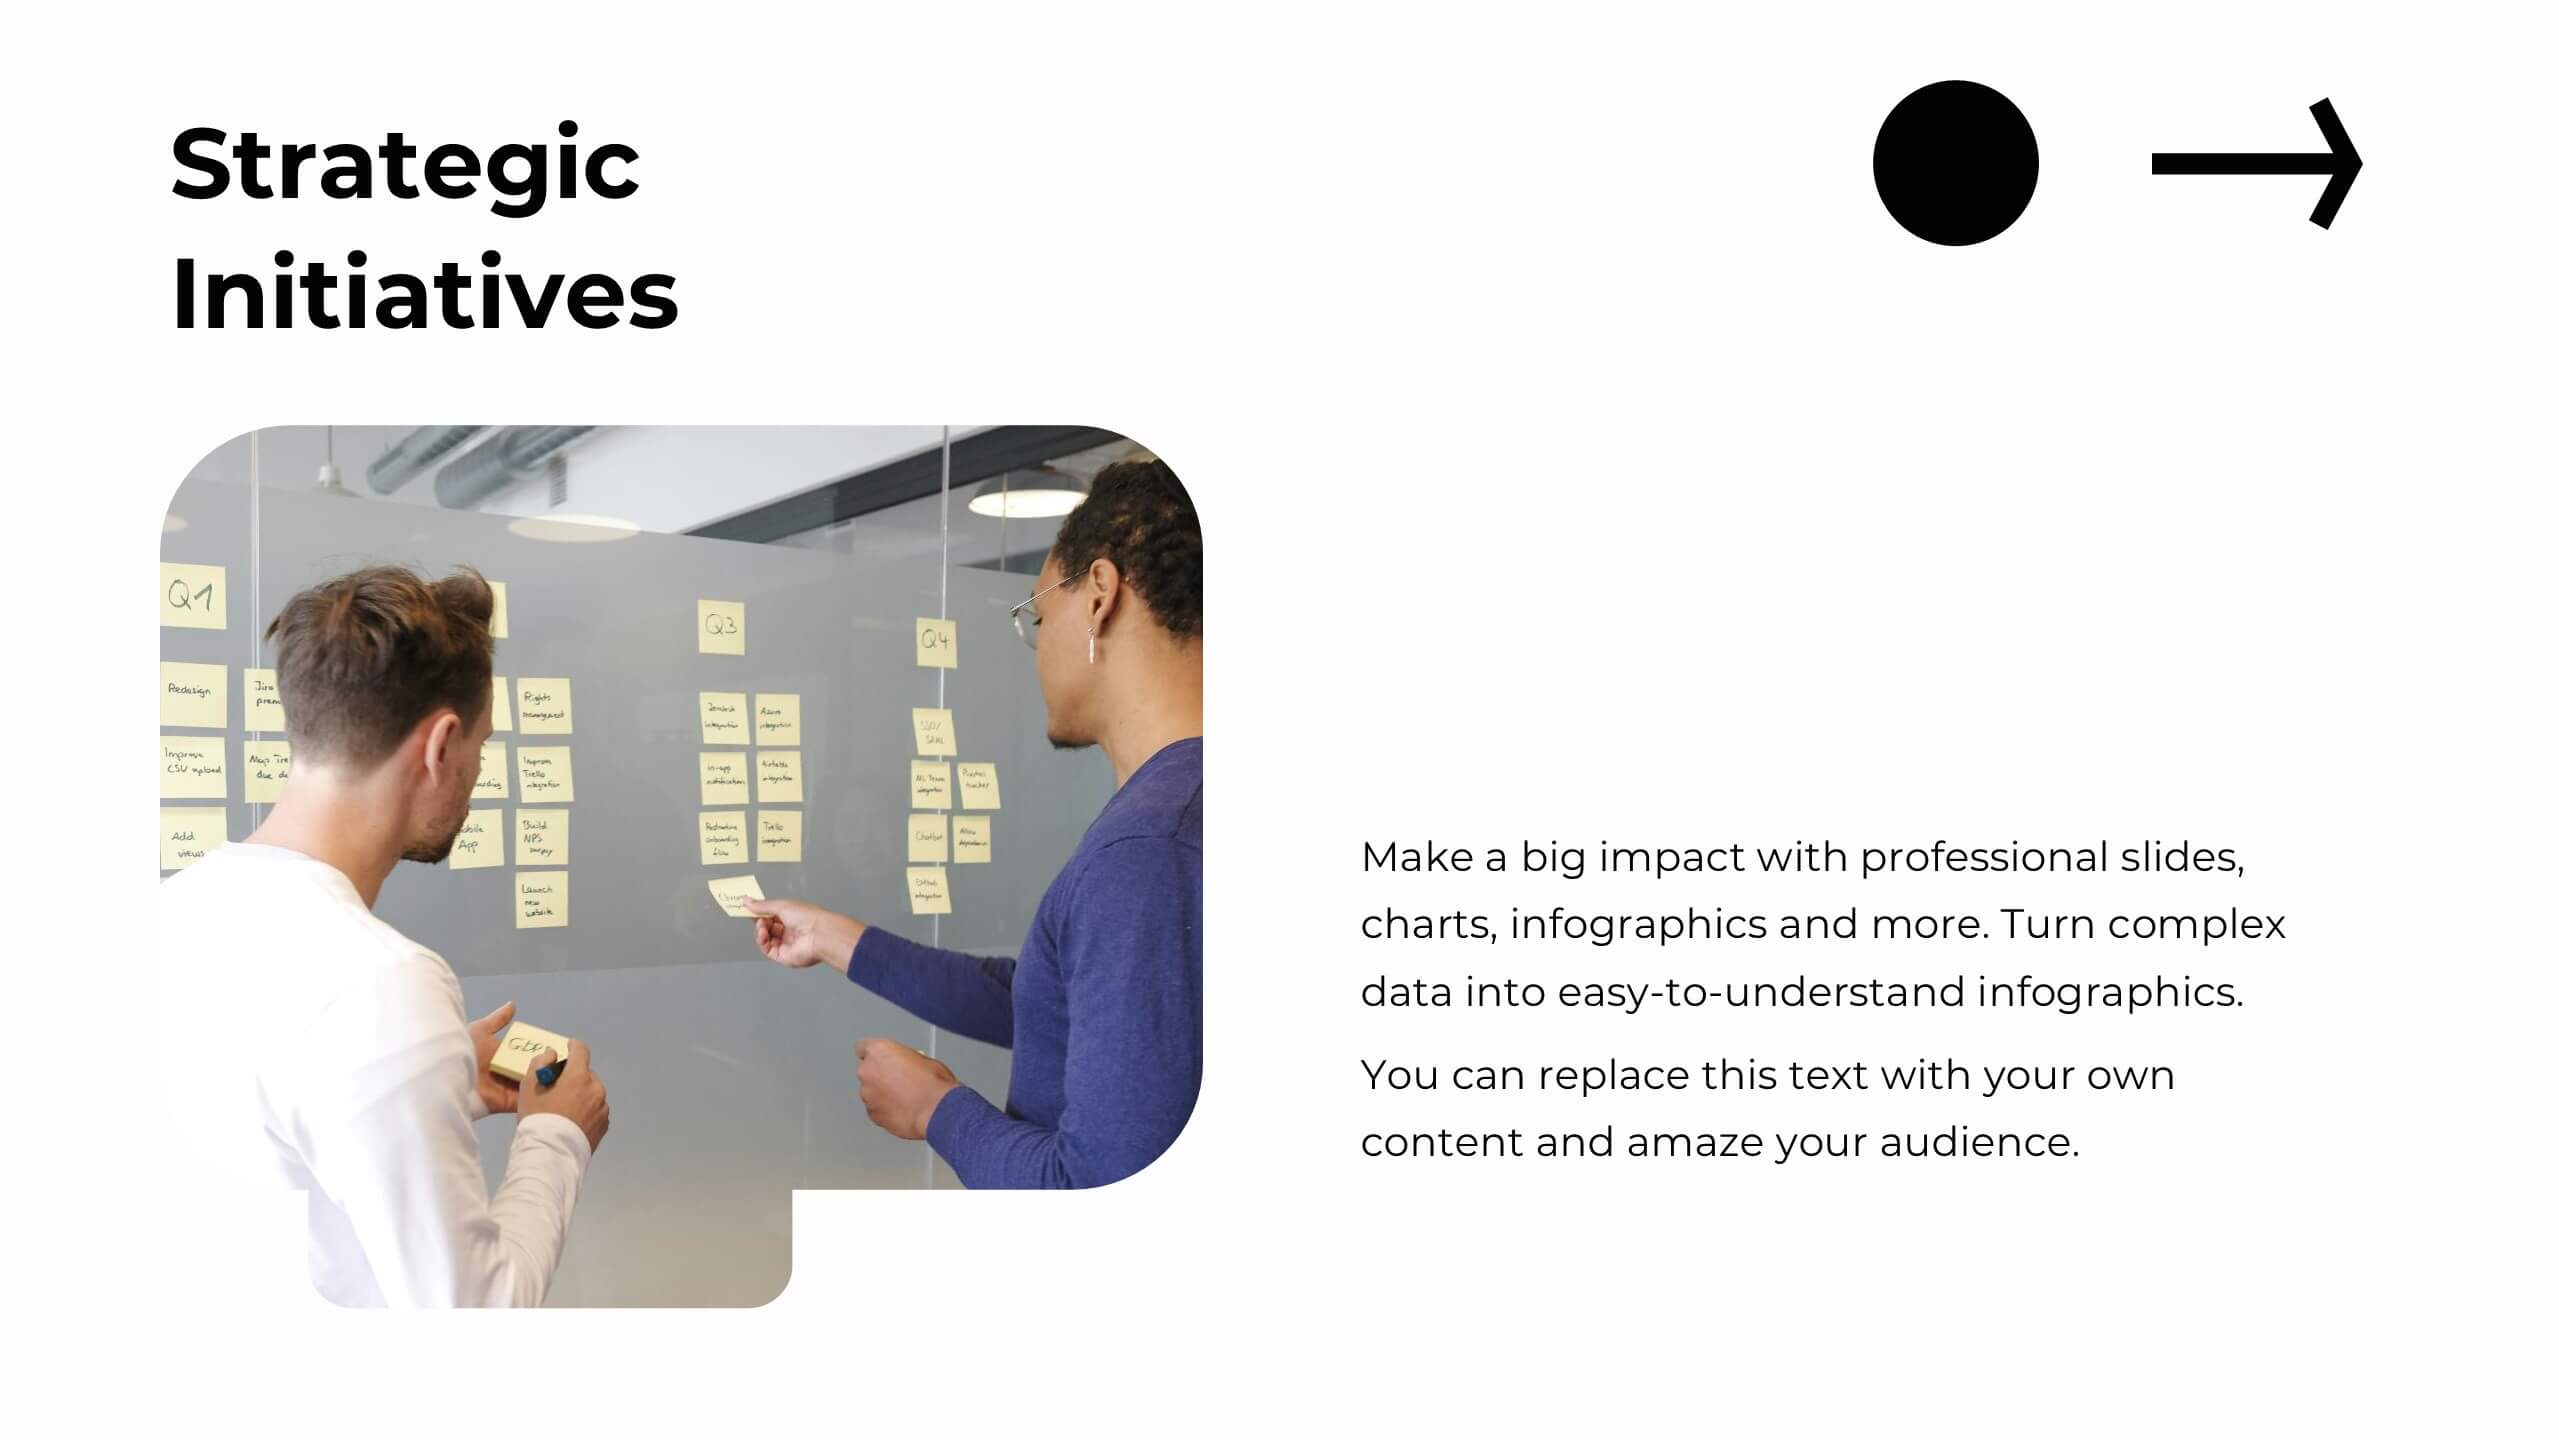
Zirconium Strategic Planning Report Presentation
Plan and present your strategies with precision using this comprehensive strategic planning report template! Designed for clear communication of goals, market trends, SWOT analysis, and growth opportunities, it’s perfect for aligning team objectives and driving success. Fully customizable and compatible with PowerPoint, Keynote, and Google Slides, this template is ideal for strategic initiatives and performance reviews.


7 diapositivas
Pricing Comparison Table Infographic
Dive into the strategic world of pricing with our intricately designed pricing table infographic. Imbued with the trustworthiness of blue, the crisp clarity of white, the optimism of yellow, and the urgency of red, our template visualizes pricing strategies in an engaging manner. Furnished with detailed infographics, distinct icons, and adaptable image placeholders, it translates complex pricing data into an easy-to-grasp format. Seamlessly crafted for Powerpoint, Keynote, or Google Slides. A vital asset for business analysts, marketers, sales professionals, or any brand strategizing its pricing model. Engage your audience; let every slide be a value proposition.


7 diapositivas
PESTEL Framework Business Presentation
The "PESTEL Framework Business" presentation effectively utilizes a segmented color scheme to categorize different environmental factors impacting business strategy: Political, Economic, Social, Technological, Environmental, and Legal. Each segment is color-coded and designated space for text, making it easy to highlight how each factor can influence business operations and decision-making processes. This visual arrangement not only aids in easy comprehension but also allows for a systematic review of external factors, essential for strategic planning.


6 diapositivas
Customer Journey Management Infographic
Map out the customer's path to purchase with our intuitive Customer Journey Management Infographic, perfect for Powerpoint, Google Slides, and Keynote. This visual tool helps businesses understand and enhance the customer experience at every touchpoint. Highlight critical stages from awareness to advocacy with distinct, easy-to-follow layouts. Customize it to fit your brand’s journey, showcasing the interactions and emotions customers encounter. Ideal for marketing strategy sessions and client presentations, it simplifies complex consumer behavior into a clear, actionable pathway.


21 diapositivas
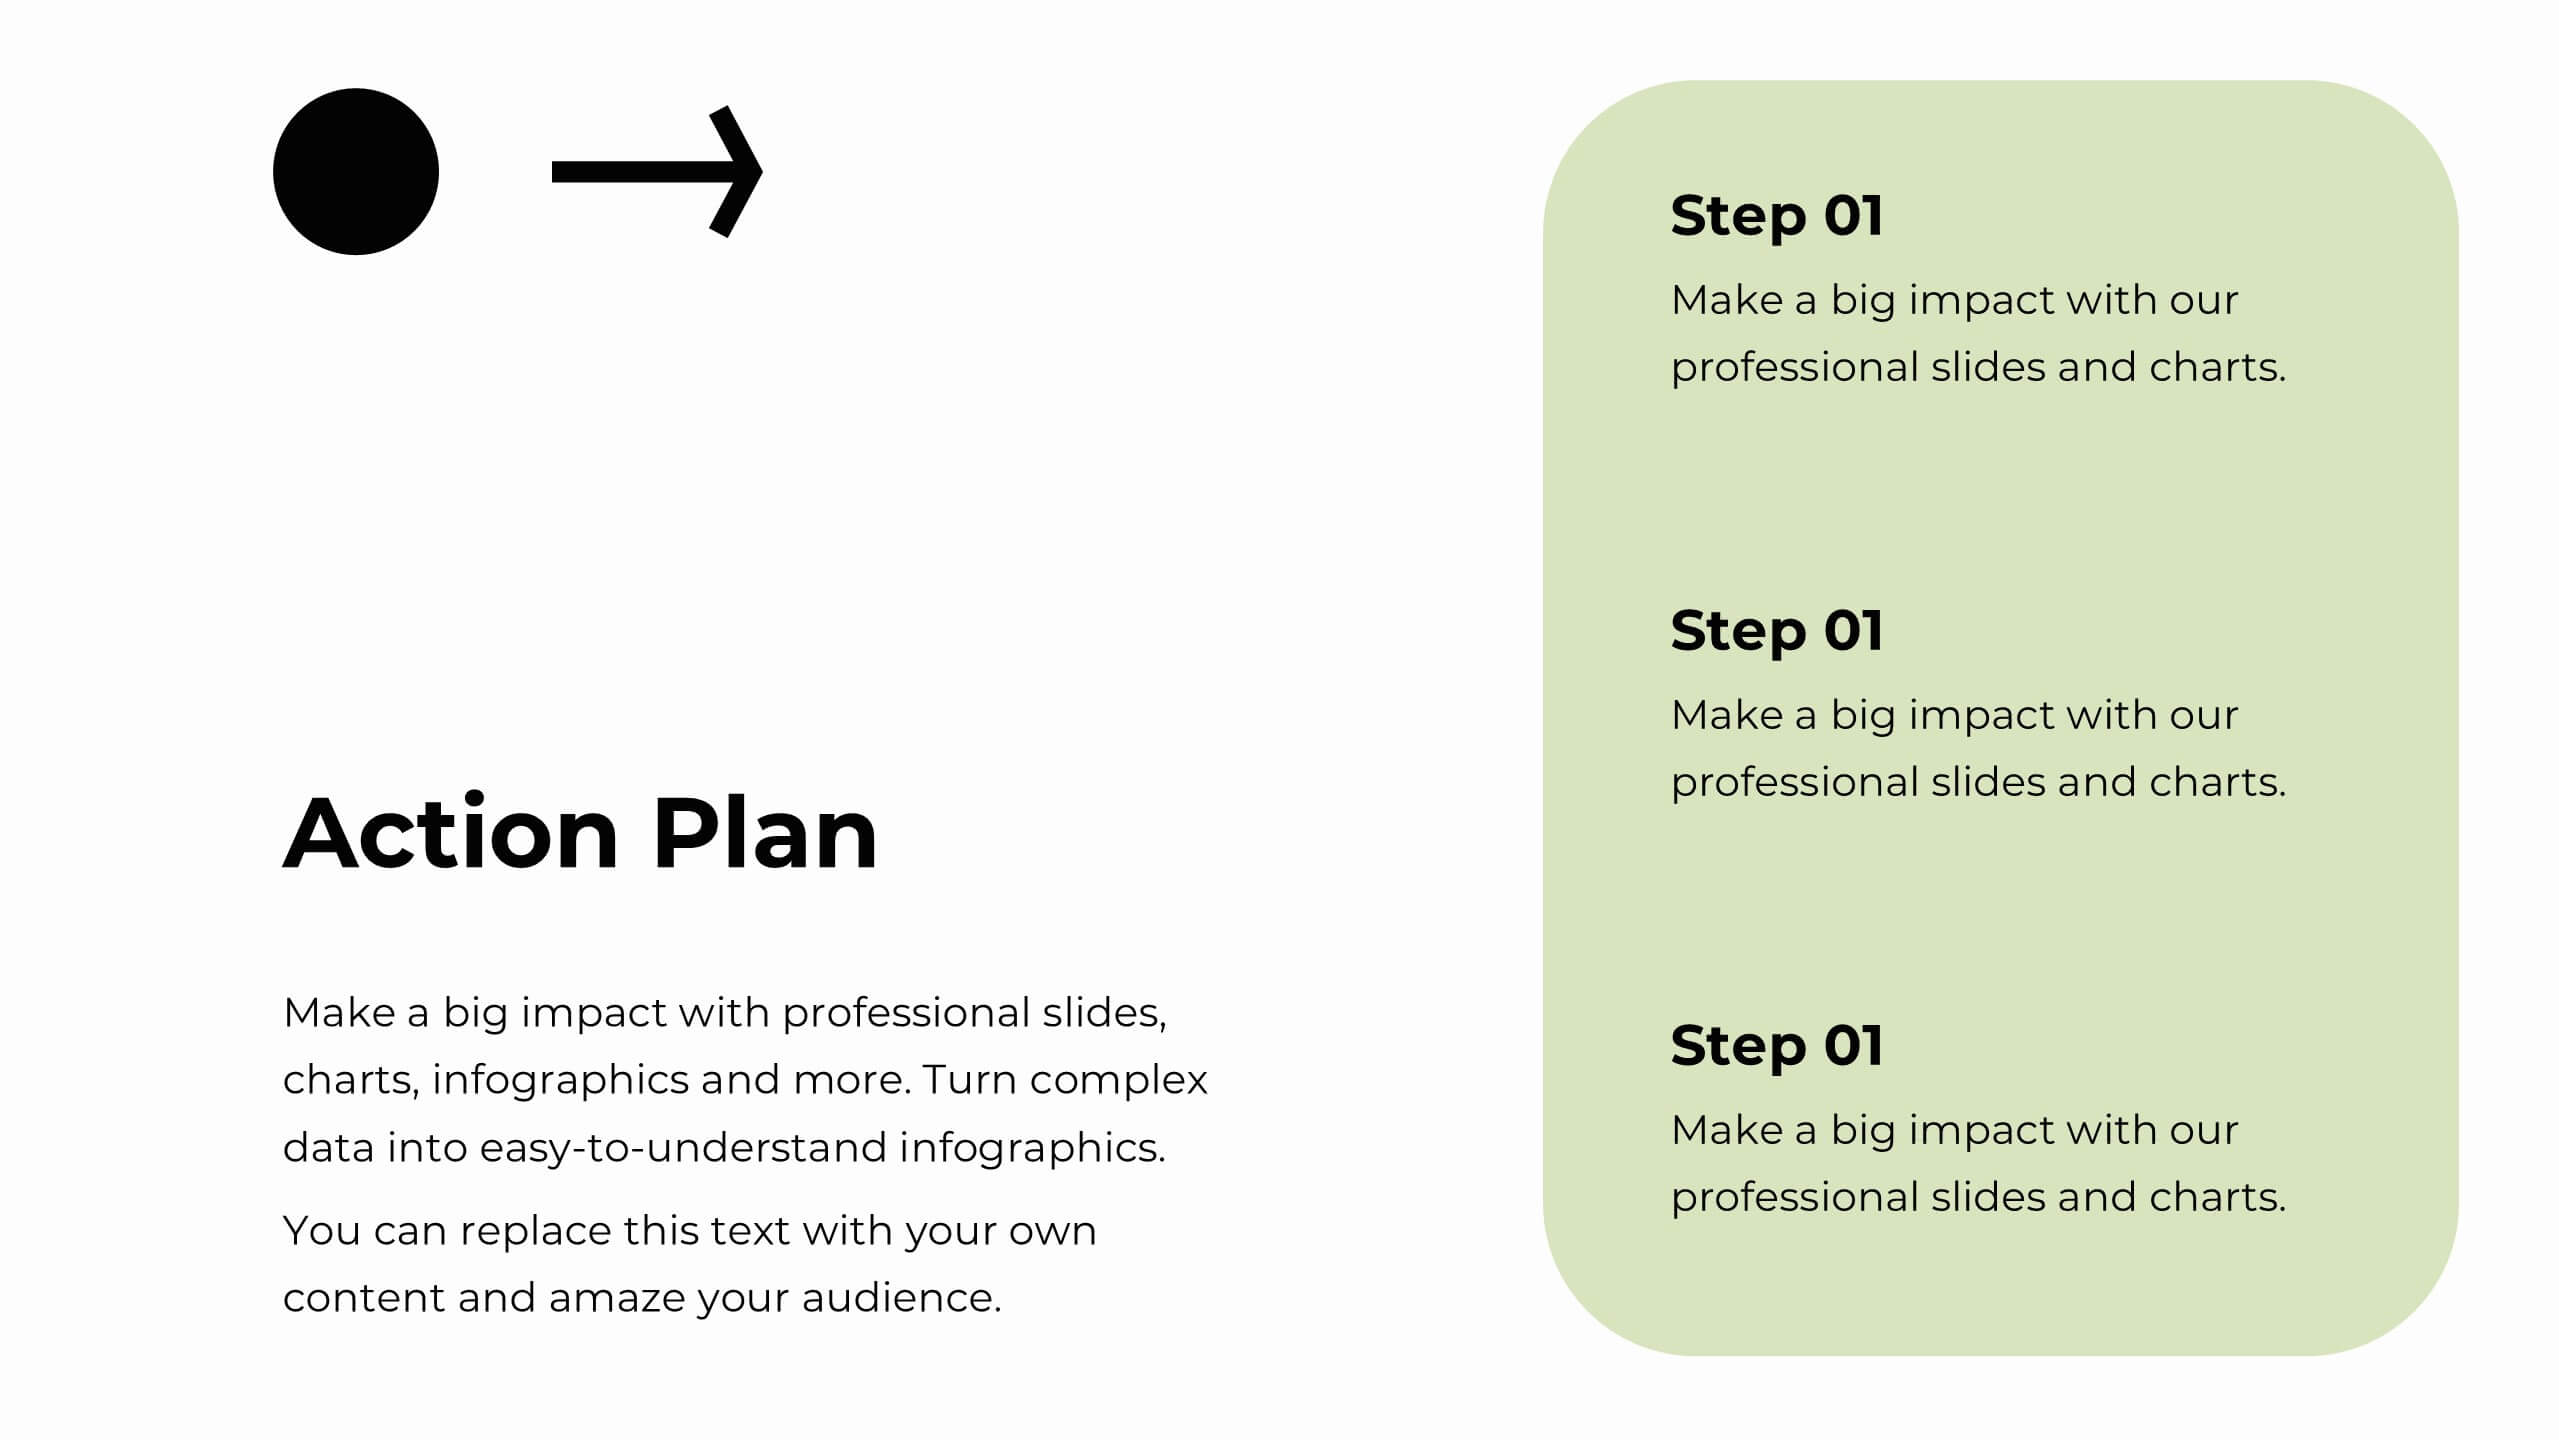
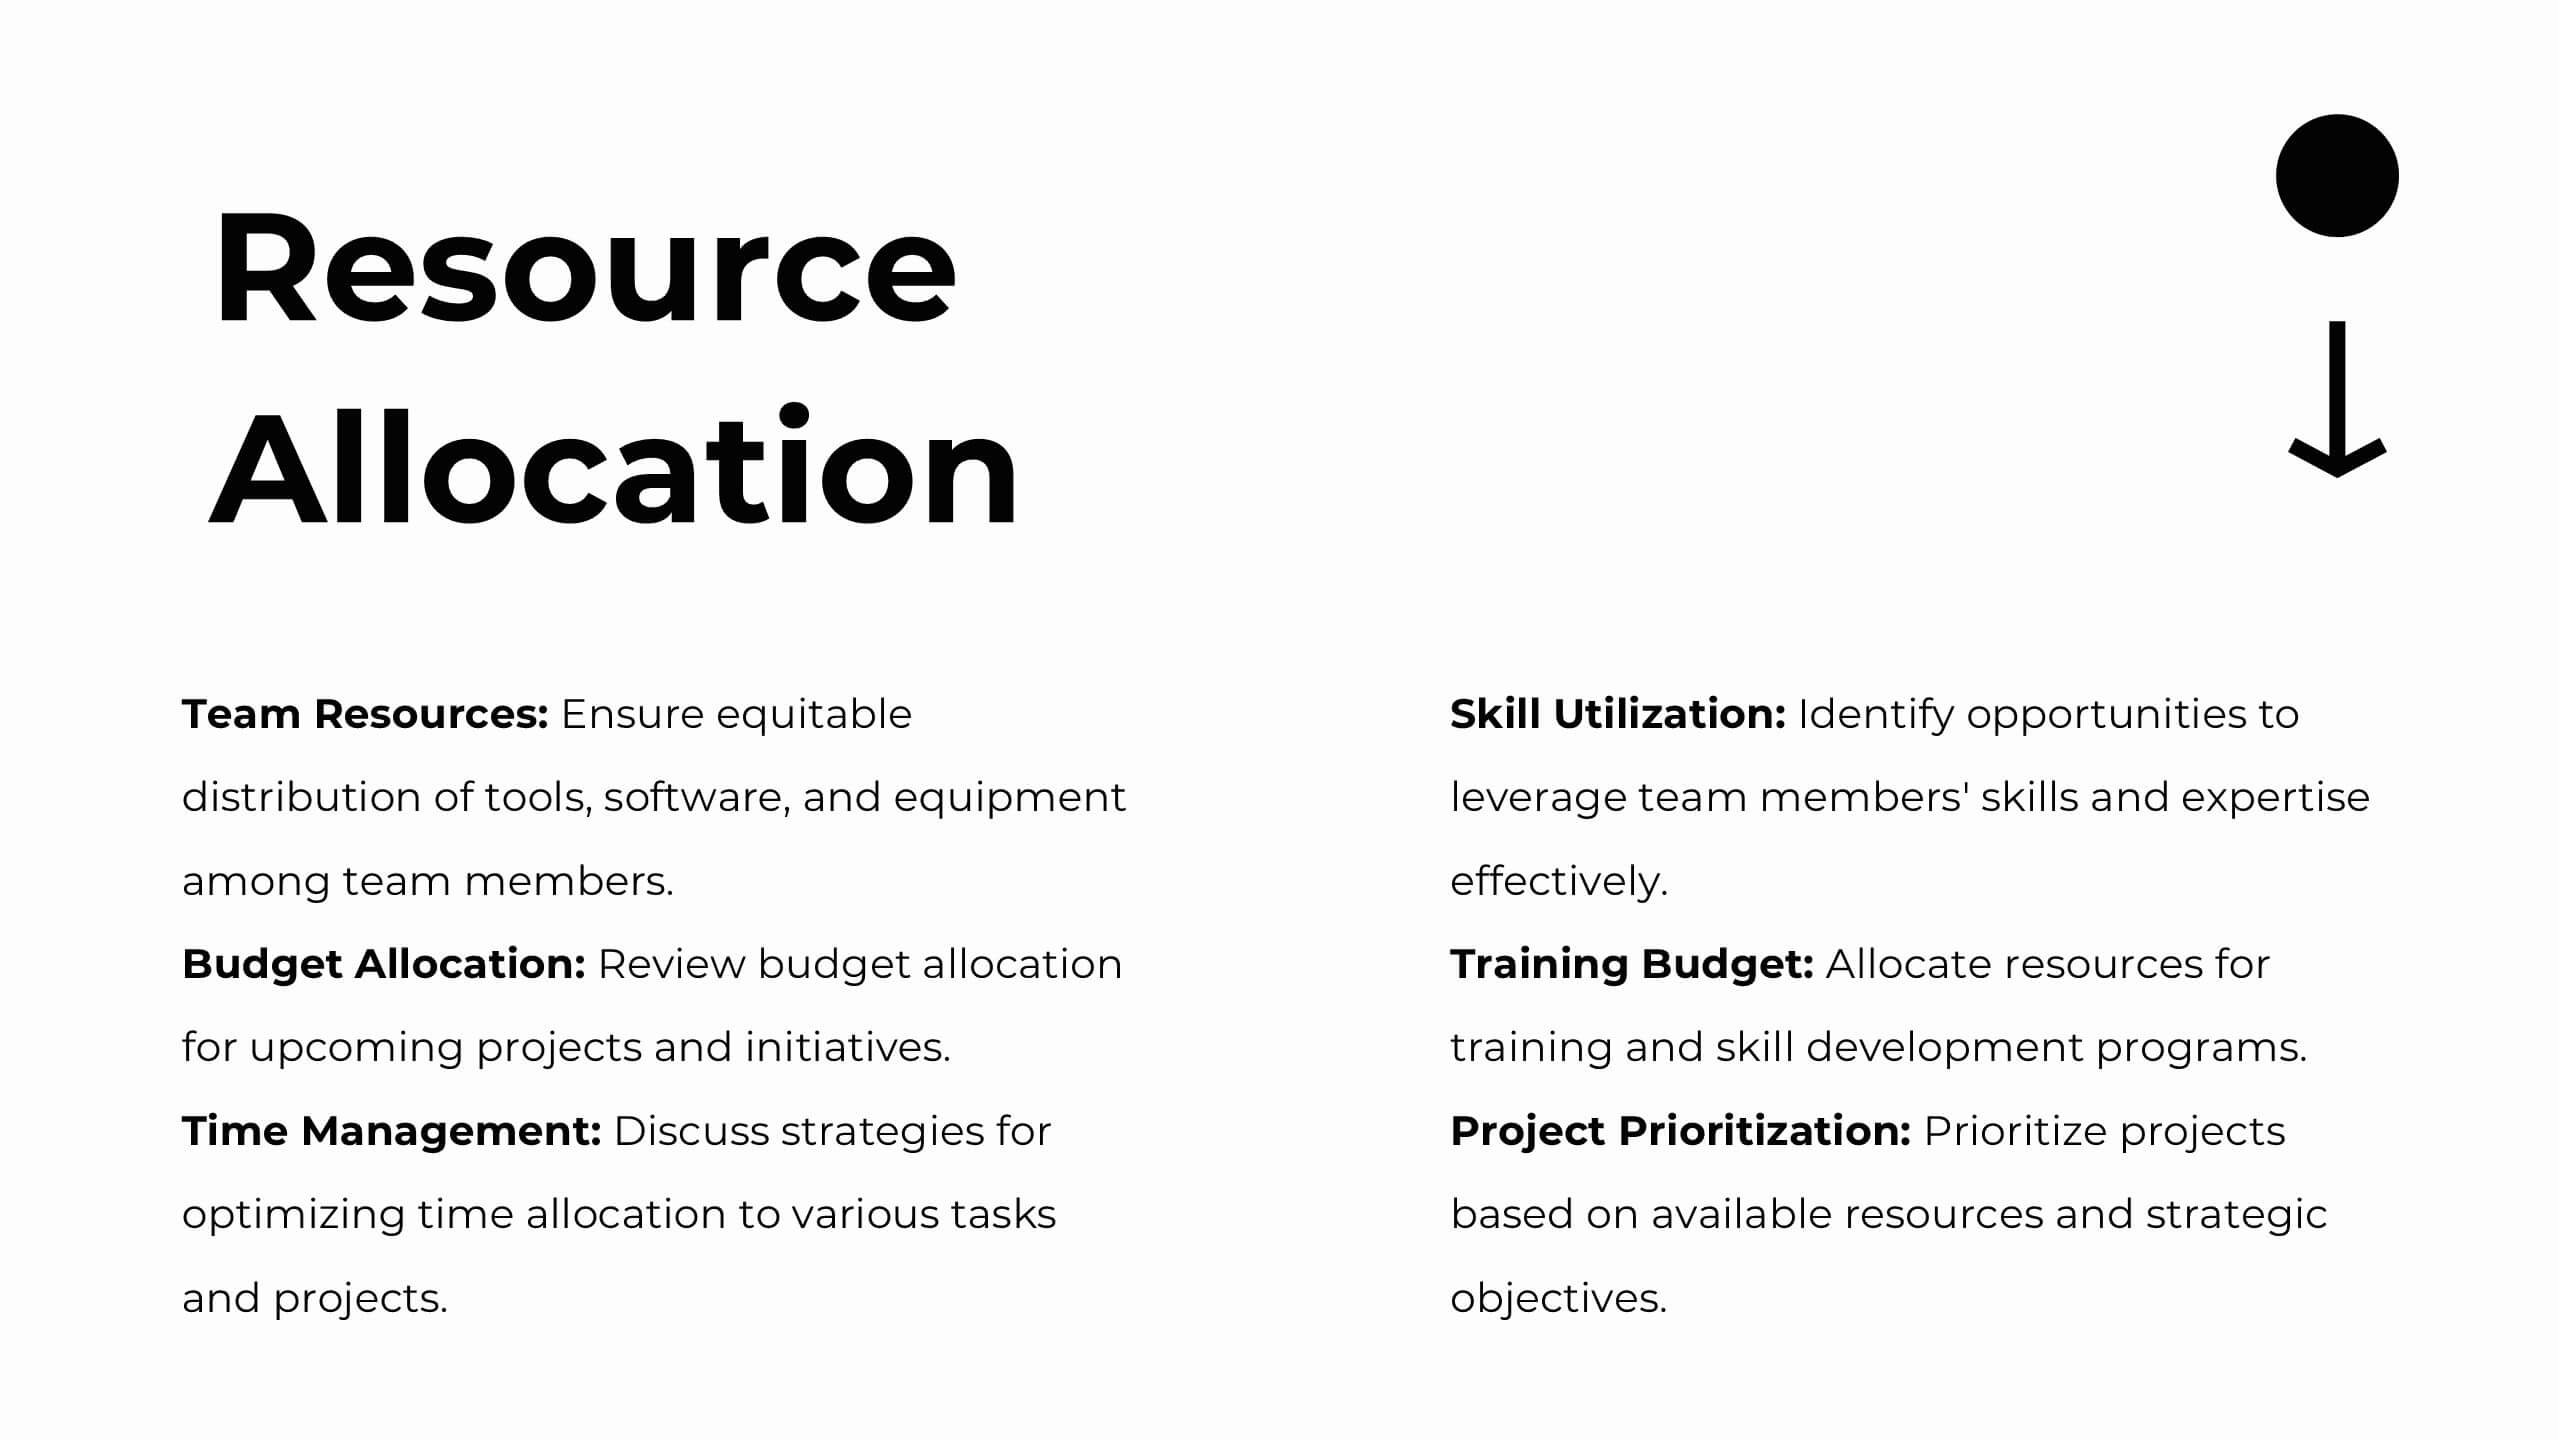
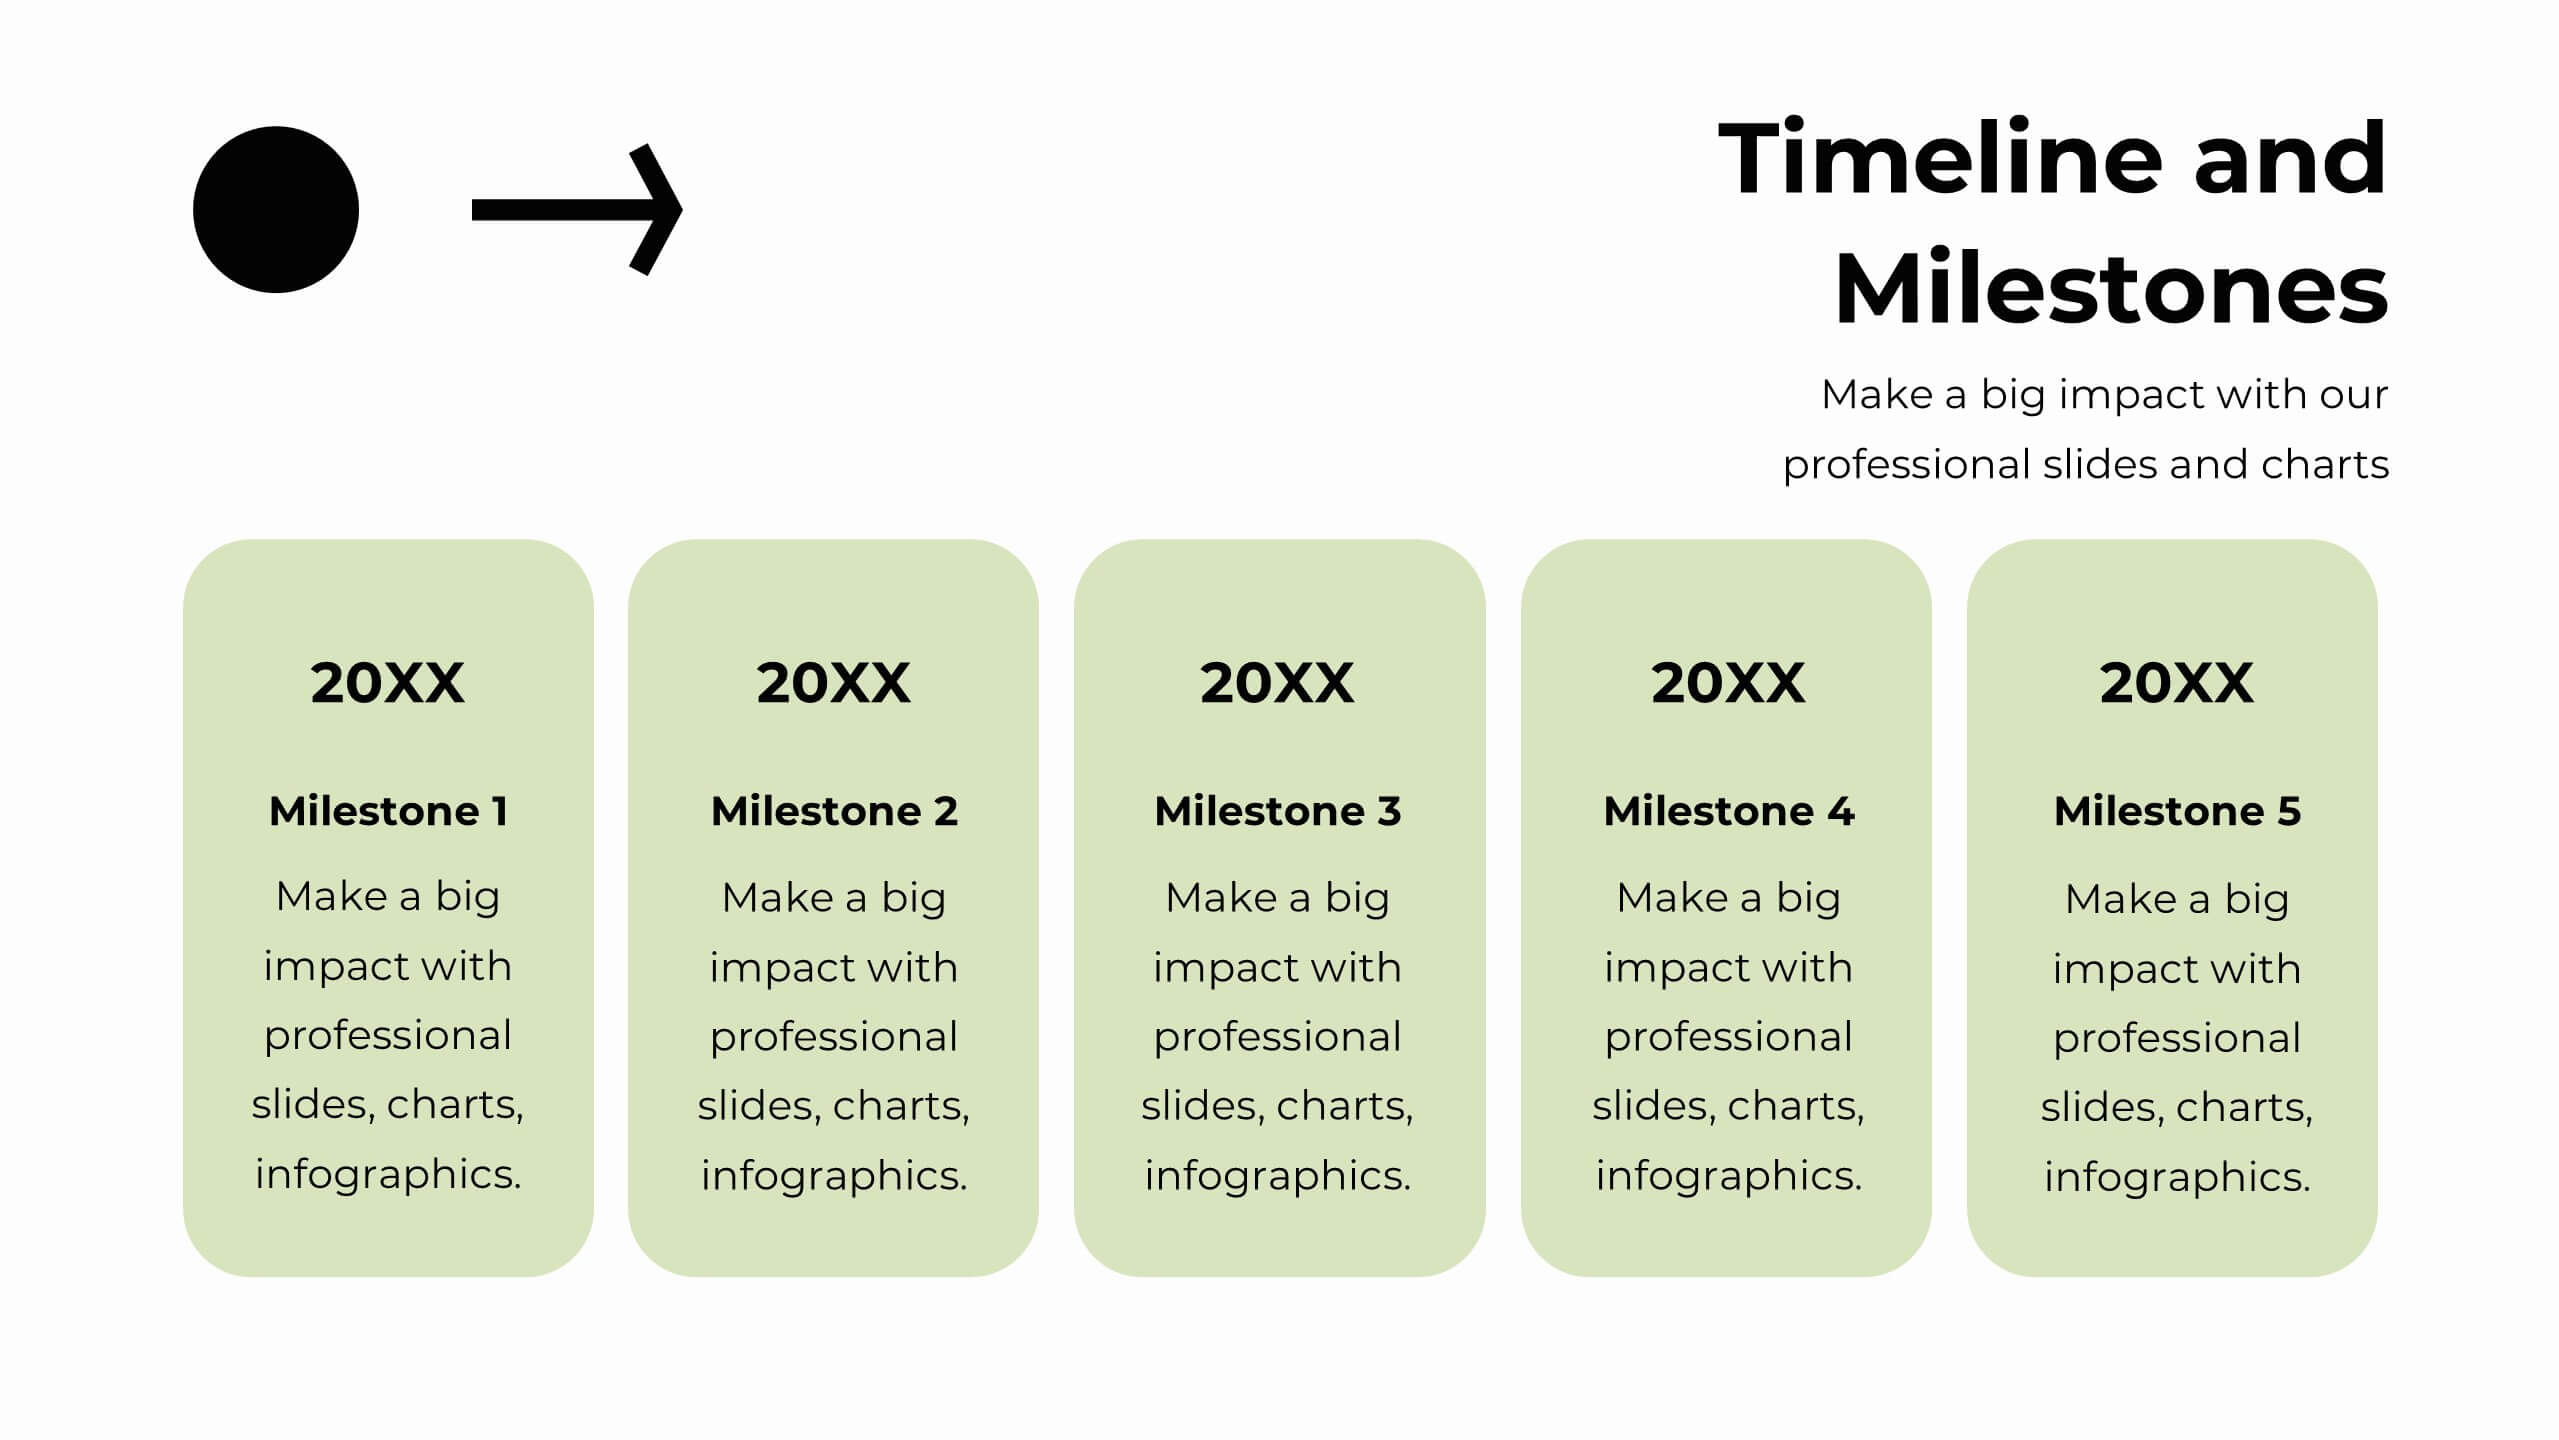
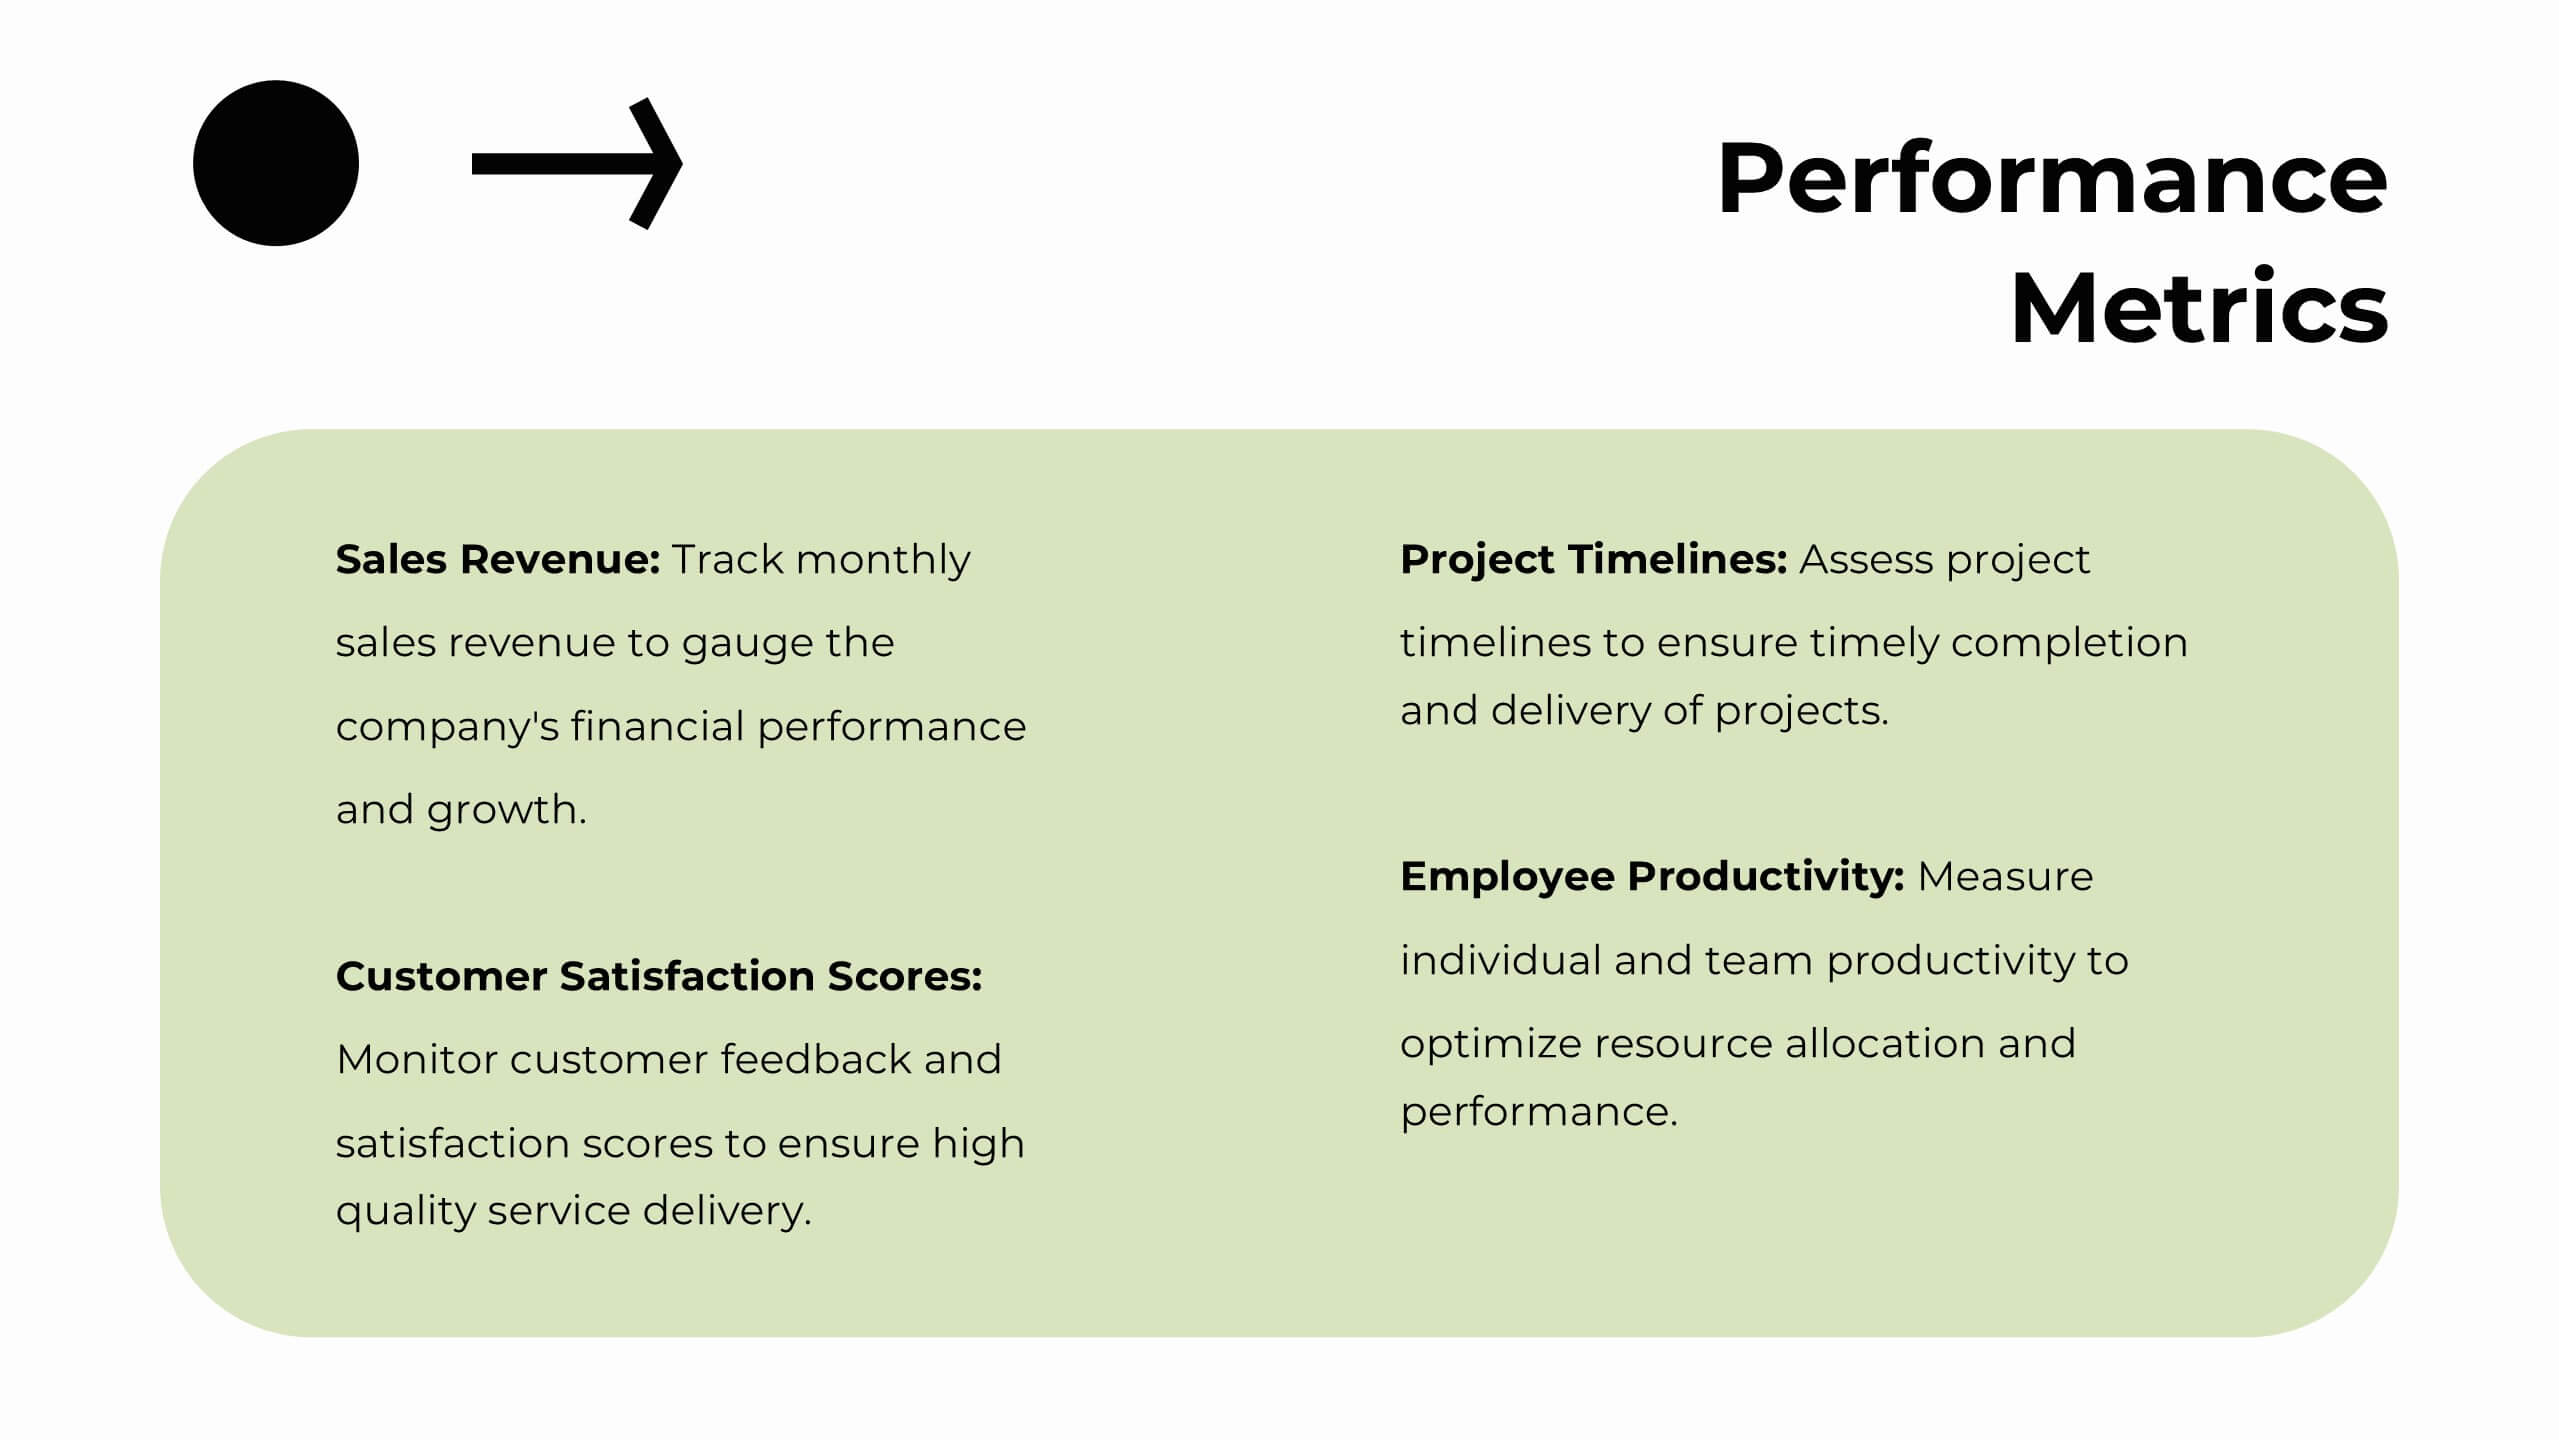
Galactic Strategic Planning Report Presentation
Launch your strategic vision into the stars with this captivating Galactic-themed presentation template! Ideal for presenting a strategic planning report, it allows you to outline goals, action plans, and performance metrics with a sleek, cosmic design that captures attention. Compatible with PowerPoint, Keynote, and Google Slides for easy, seamless customization.


6 diapositivas
Lean Six Sigma Workflow Steps Presentation
Present the DMAIC cycle with clarity using this Lean Six Sigma workflow template. Each step—Define, Measure, Analyze, Improve, Control—is highlighted with sleek visuals and editable content blocks. Ideal for operations teams, quality experts, and consultants. Customize seamlessly in PowerPoint, Keynote, or Google Slides to fit your process presentations.


4 diapositivas
Company Long-Term Vision Presentation
Craft your company's roadmap with our "Company Long-Term Vision" presentation template. This design lets you vividly showcase your strategic direction and future goals through a modern, image-centric layout. Ideal for board meetings and stakeholder briefings, it supports PowerPoint, Keynote, and Google Slides, ensuring you can reach your audience on any platform. Utilize this template to clearly communicate your vision and drive your organization forward.


6 diapositivas
Europe Regions Infographic
Europe is a diverse continent with various regions that have their own unique characteristics and cultural identities. This infographic provides an overview of the different regions in Europe. It is designed to help viewers understand the diverse geography, culture, and characteristics of each region within Europe. The template features a map of Europe that highlights the various regions. Viewers can easily identify and explore each region on the map. The template includes slides dedicated to providing key information such as capital cities and major landmarks. The template incorporates statistical data to showcase key facts and figures about each region.


26 diapositivas
Beauty Products Company Profile Presentation
A beauty products company is a business that specializes in the development, manufacturing, marketing, and sale of various beauty and skincare products. This presentation template is designed to showcase your cosmetics and skincare brand in the most captivating and alluring way possible. With a blend of elegance and modernity, this template is your beauty brand's ticket to leaving a lasting impression on clients, investors, and partners. Fully customizable and compatible with Powerpoint, Keynote, and Google Slides. The sophisticated color palette will reflect the elegance of your beauty company.


7 diapositivas
Money Value Infographic
The value of money refers to its purchasing power or what it can buy in goods, services, or investments. Creating an infographic about the value of money can help people understand various aspects of finance, investment, and wealth. This template is compatible with Powerpoint, Keynote, and Google Slides. Customize the content, design, and visuals to create an engaging and informative infographic that helps people better understand the value of money and how to manage it wisely. Financial literacy is a valuable skill, and your infographic can empower individuals to make sound financial decisions.


4 diapositivas
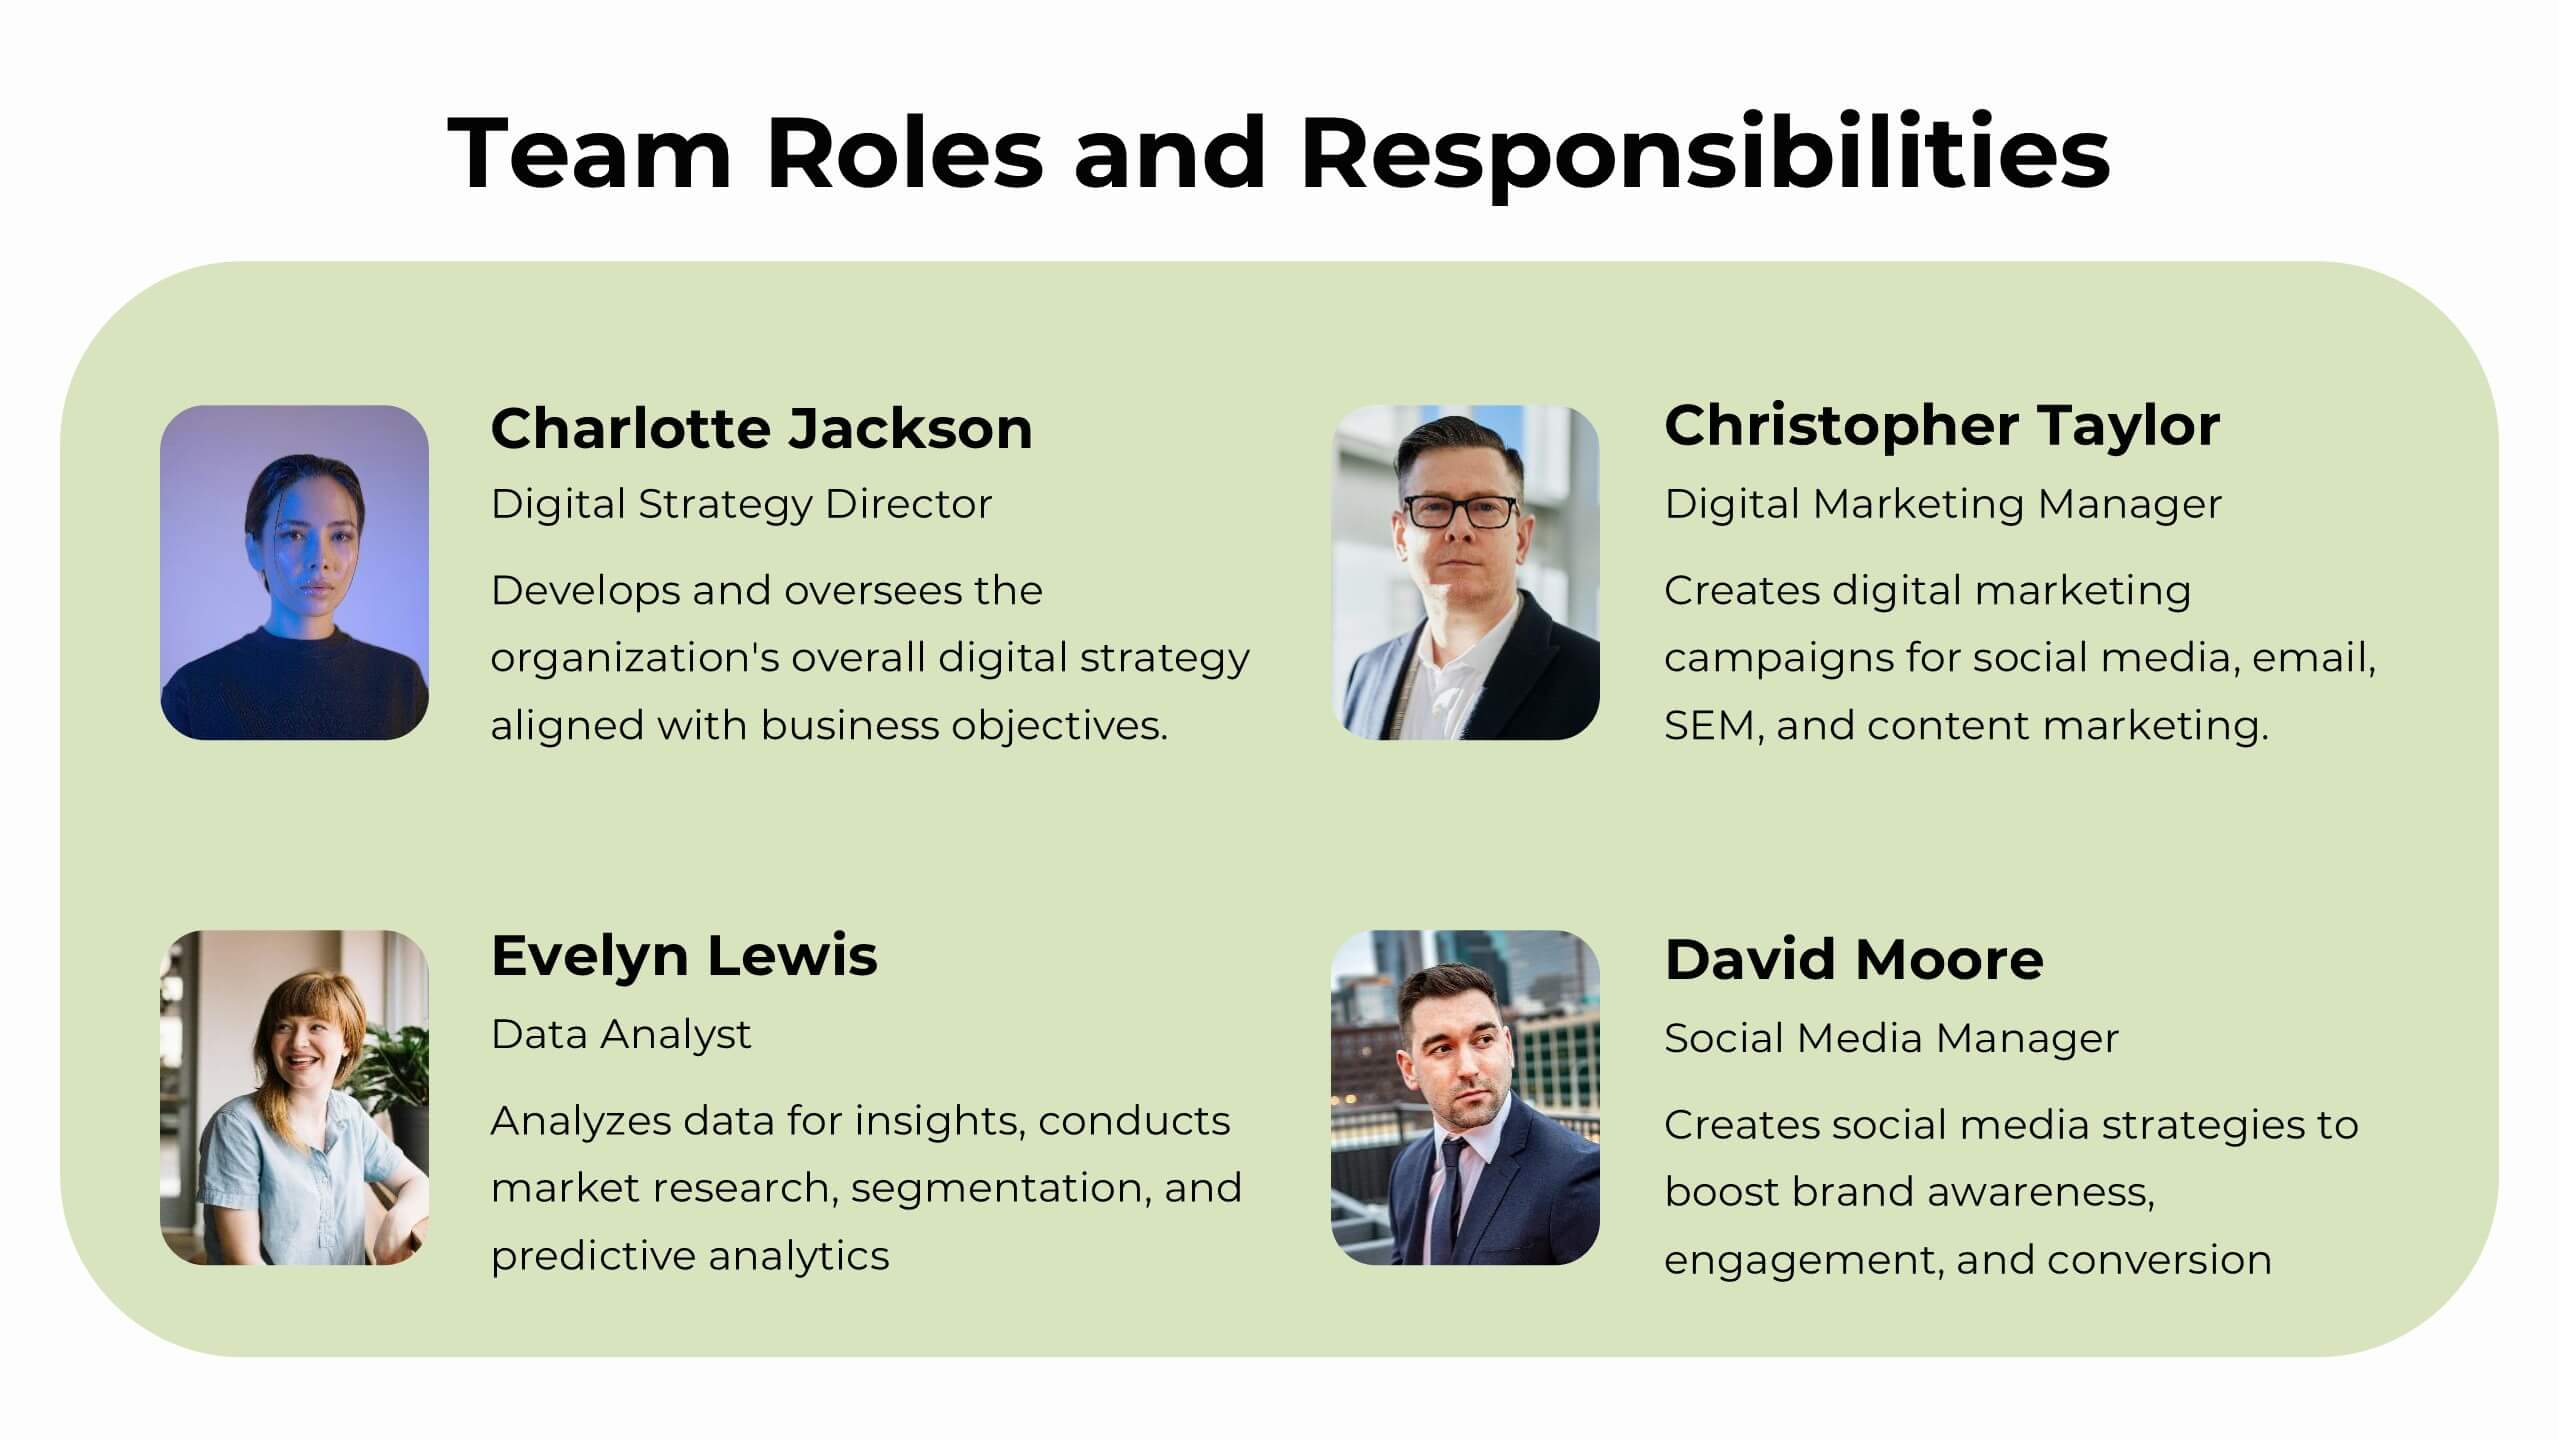
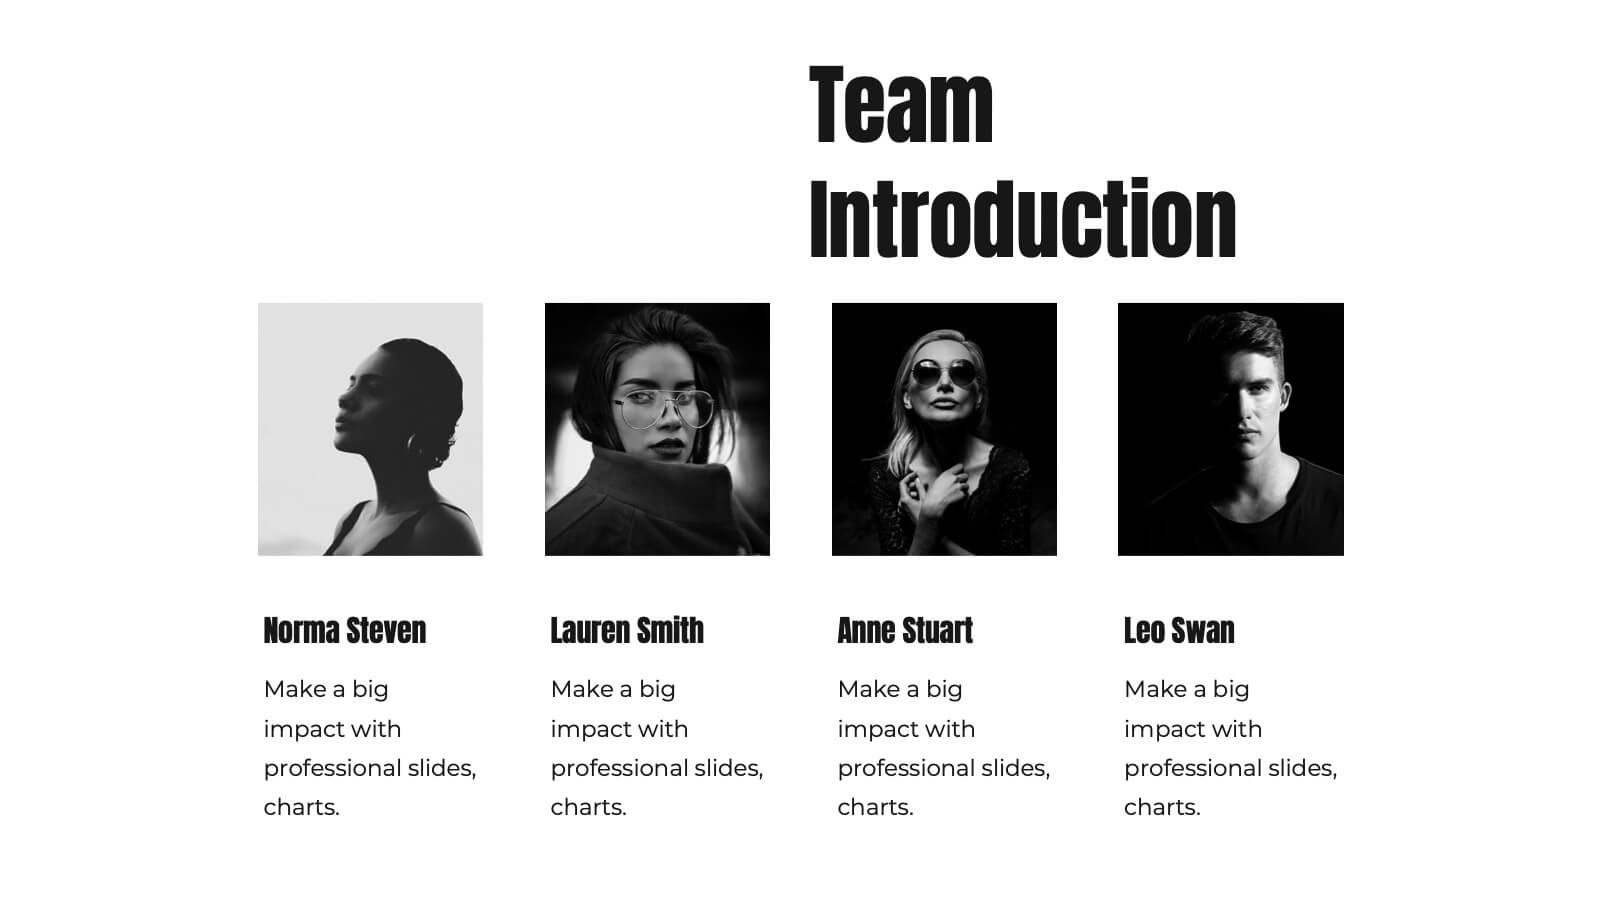
Professional Team Member Slides Presentation
Meet your team in a fresh, dynamic way with a layout that highlights personalities, roles, and key contributions at a glance. This presentation helps introduce members clearly, supporting stronger collaboration and professional communication across any project. Fully customizable and compatible with PowerPoint, Keynote, and Google Slides.


7 diapositivas
Thank You Card Infographic
Celebrate the art of gratitude with this sophisticated collection, perfectly blending contemporary design with a personal touch. Each layout is crafted with aesthetic finesse, featuring subtle color palettes, elegant typography, and thoughtful placement of visual elements that enhance the warmth of your message. Offering a variety of designs from minimalist to richly textured backgrounds, this collection provides a unique backdrop for expressing thanks. Customize these cards for any occasion, whether it's professional gratitude towards colleagues and clients, or personal appreciation for friends and family. Ideal for both digital expressions and printed notes, this set ensures your message of thanks is received with the sentiment it’s intended. It’s a wonderful way to convey appreciation and leave a memorable impression on its recipients.


21 diapositivas
Fahrenheit Scientific Research Presentation
Present your findings with clarity using this scientific research presentation template. Designed for researchers, it includes sections for objectives, methodology, data analysis, results, and recommendations. Perfect for academic and professional use, this template ensures a polished, organized presentation and is fully compatible with PowerPoint, Keynote, and Google Slides.


21 diapositivas
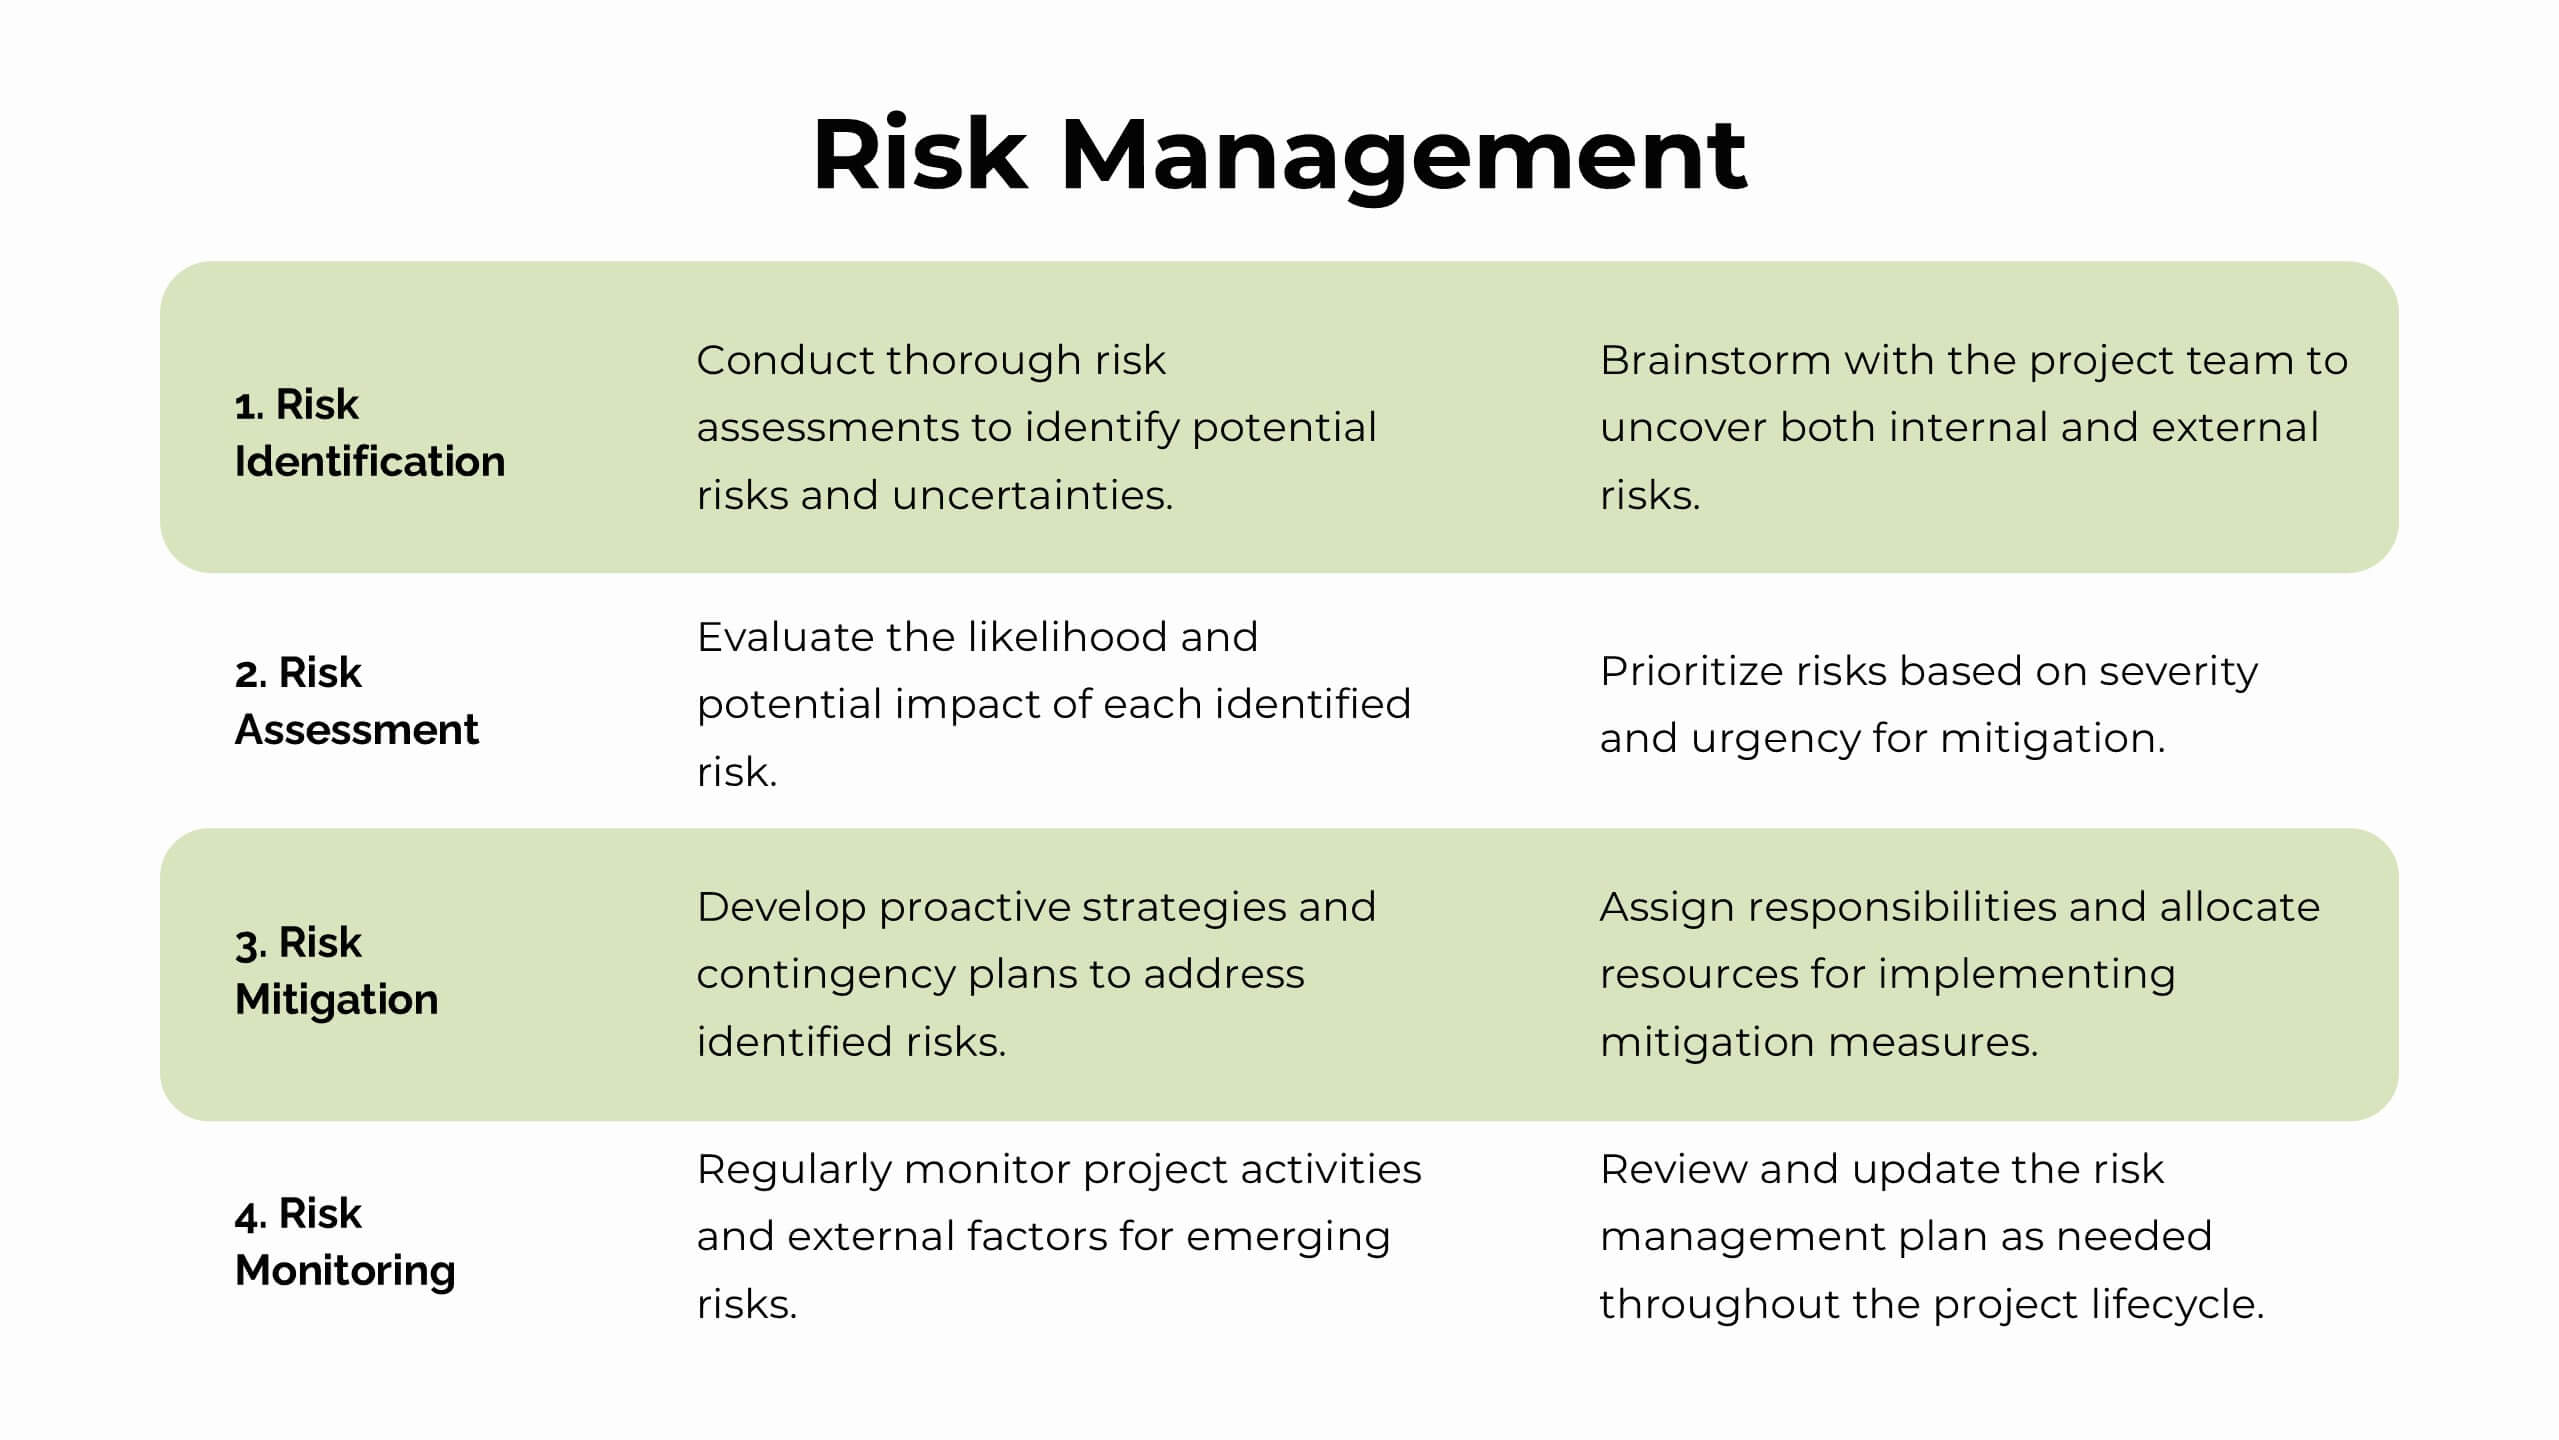
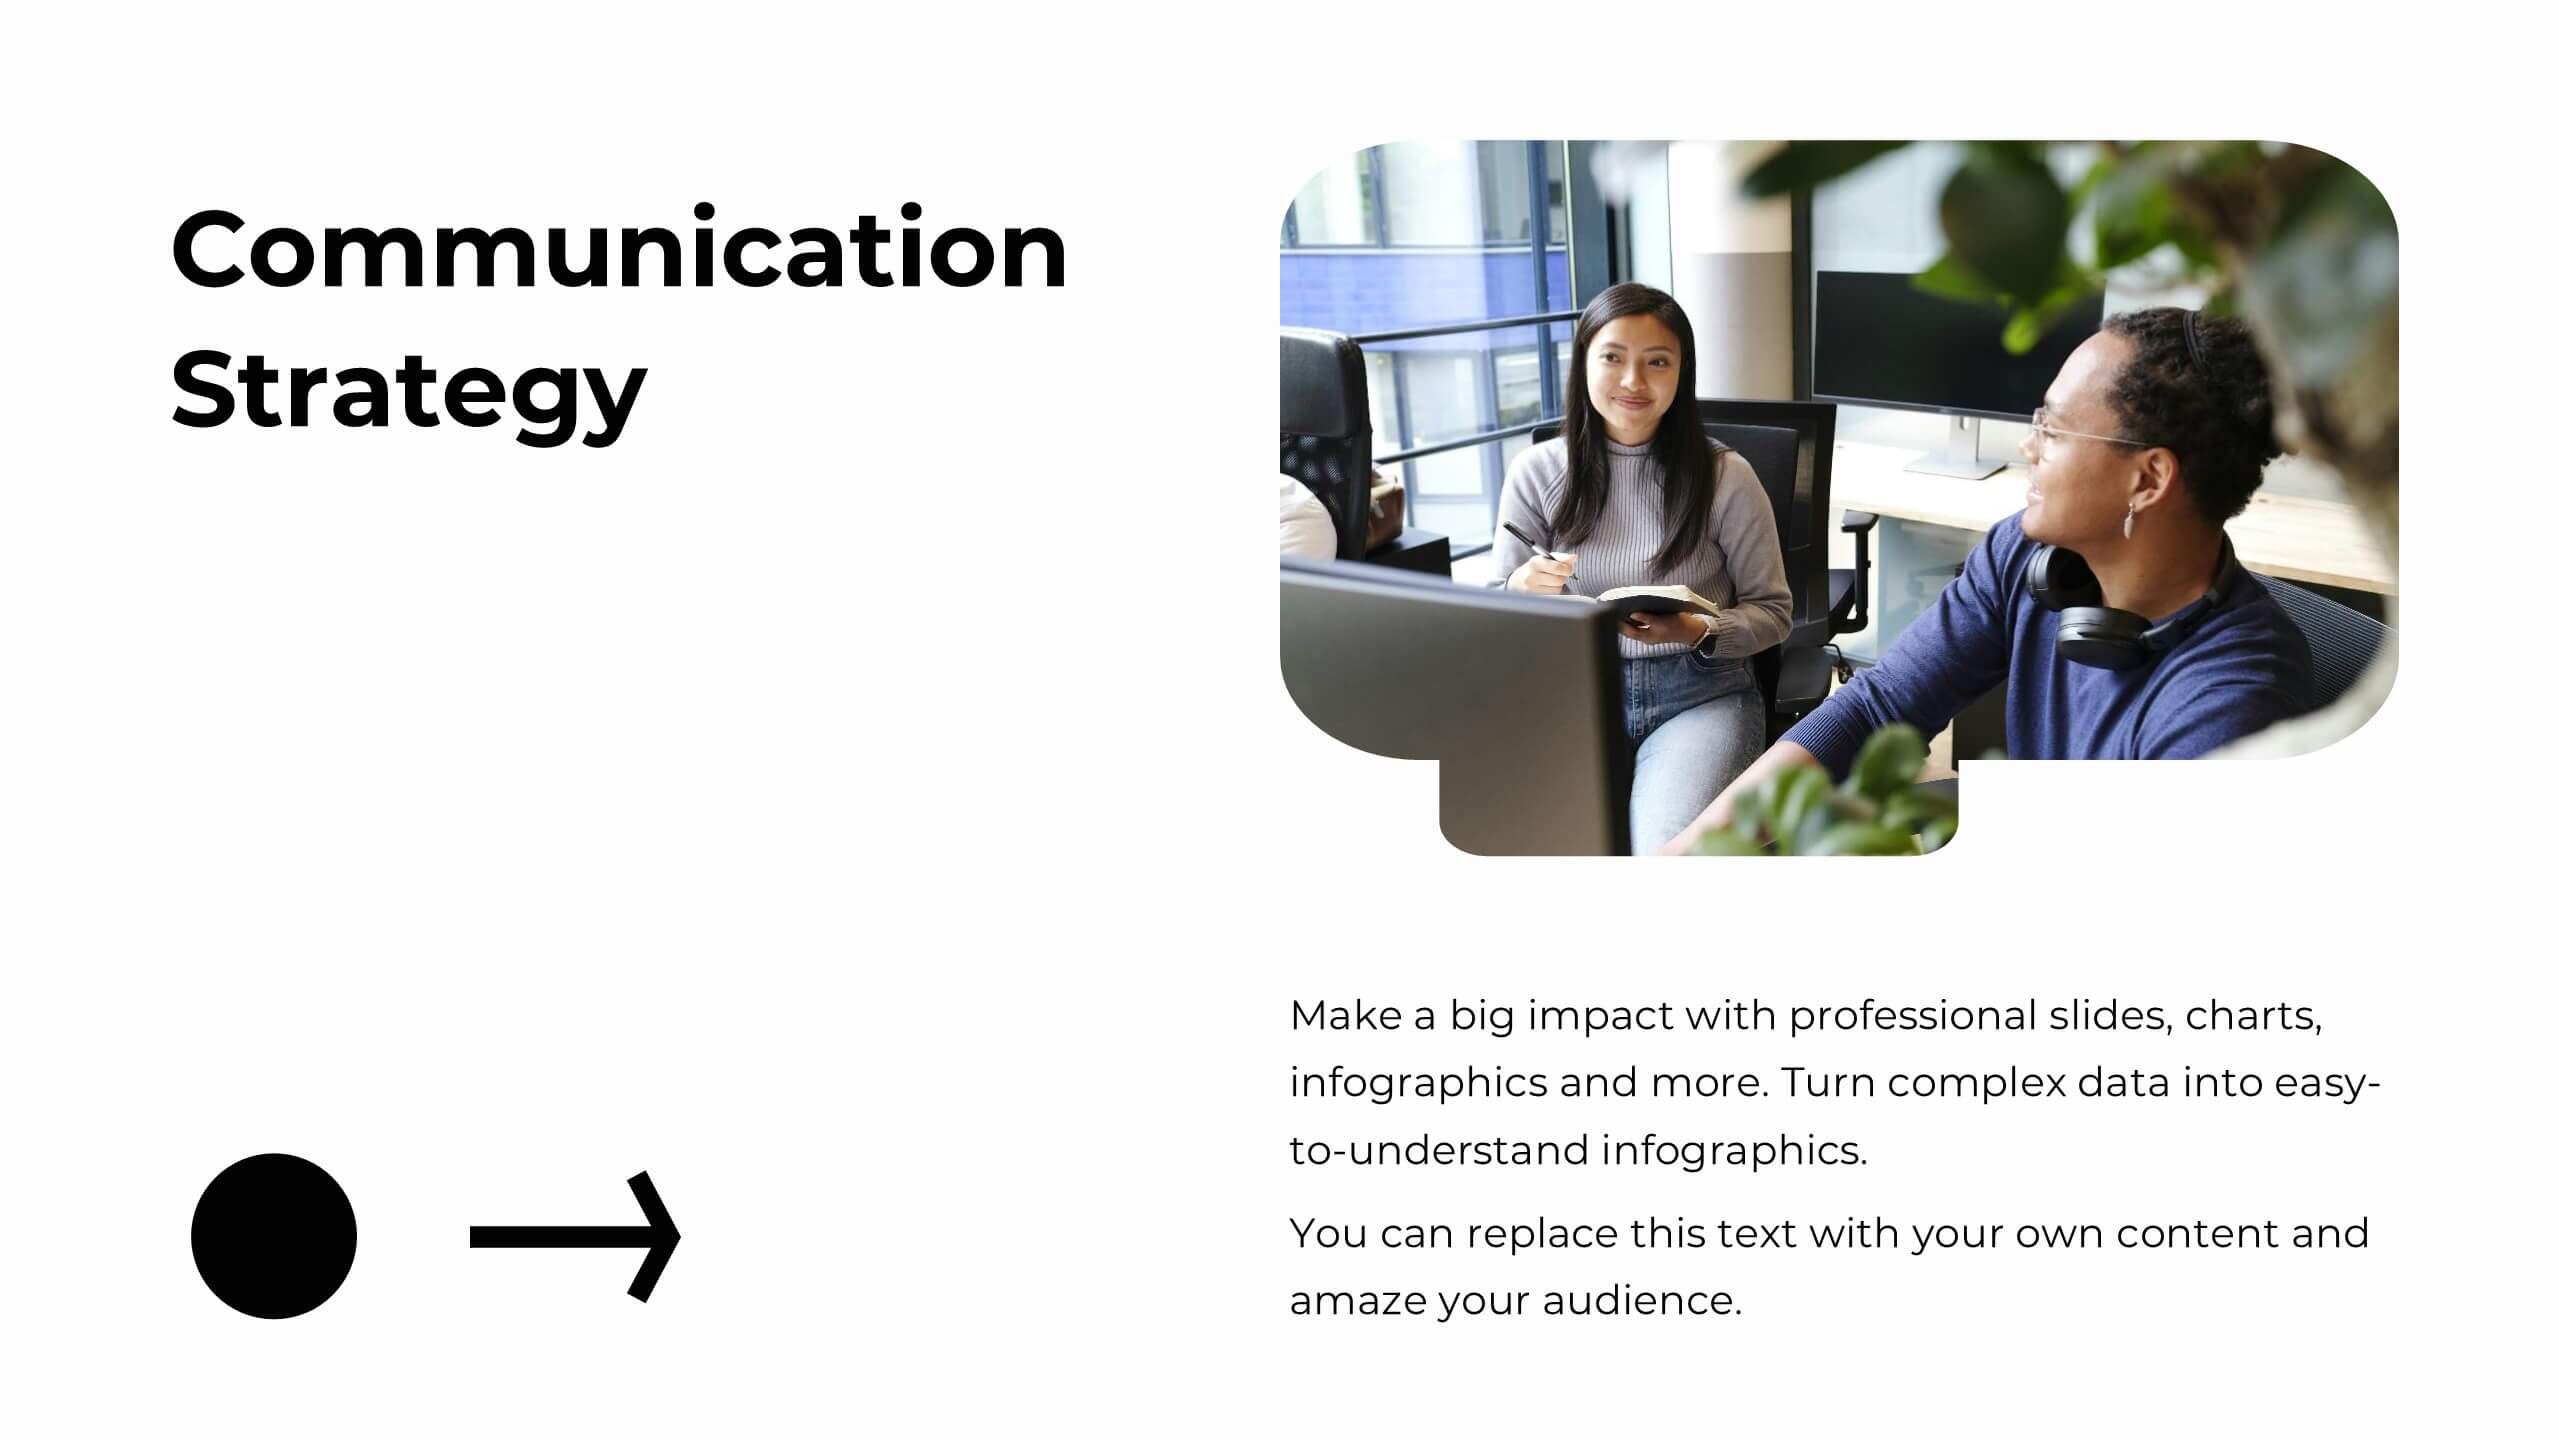
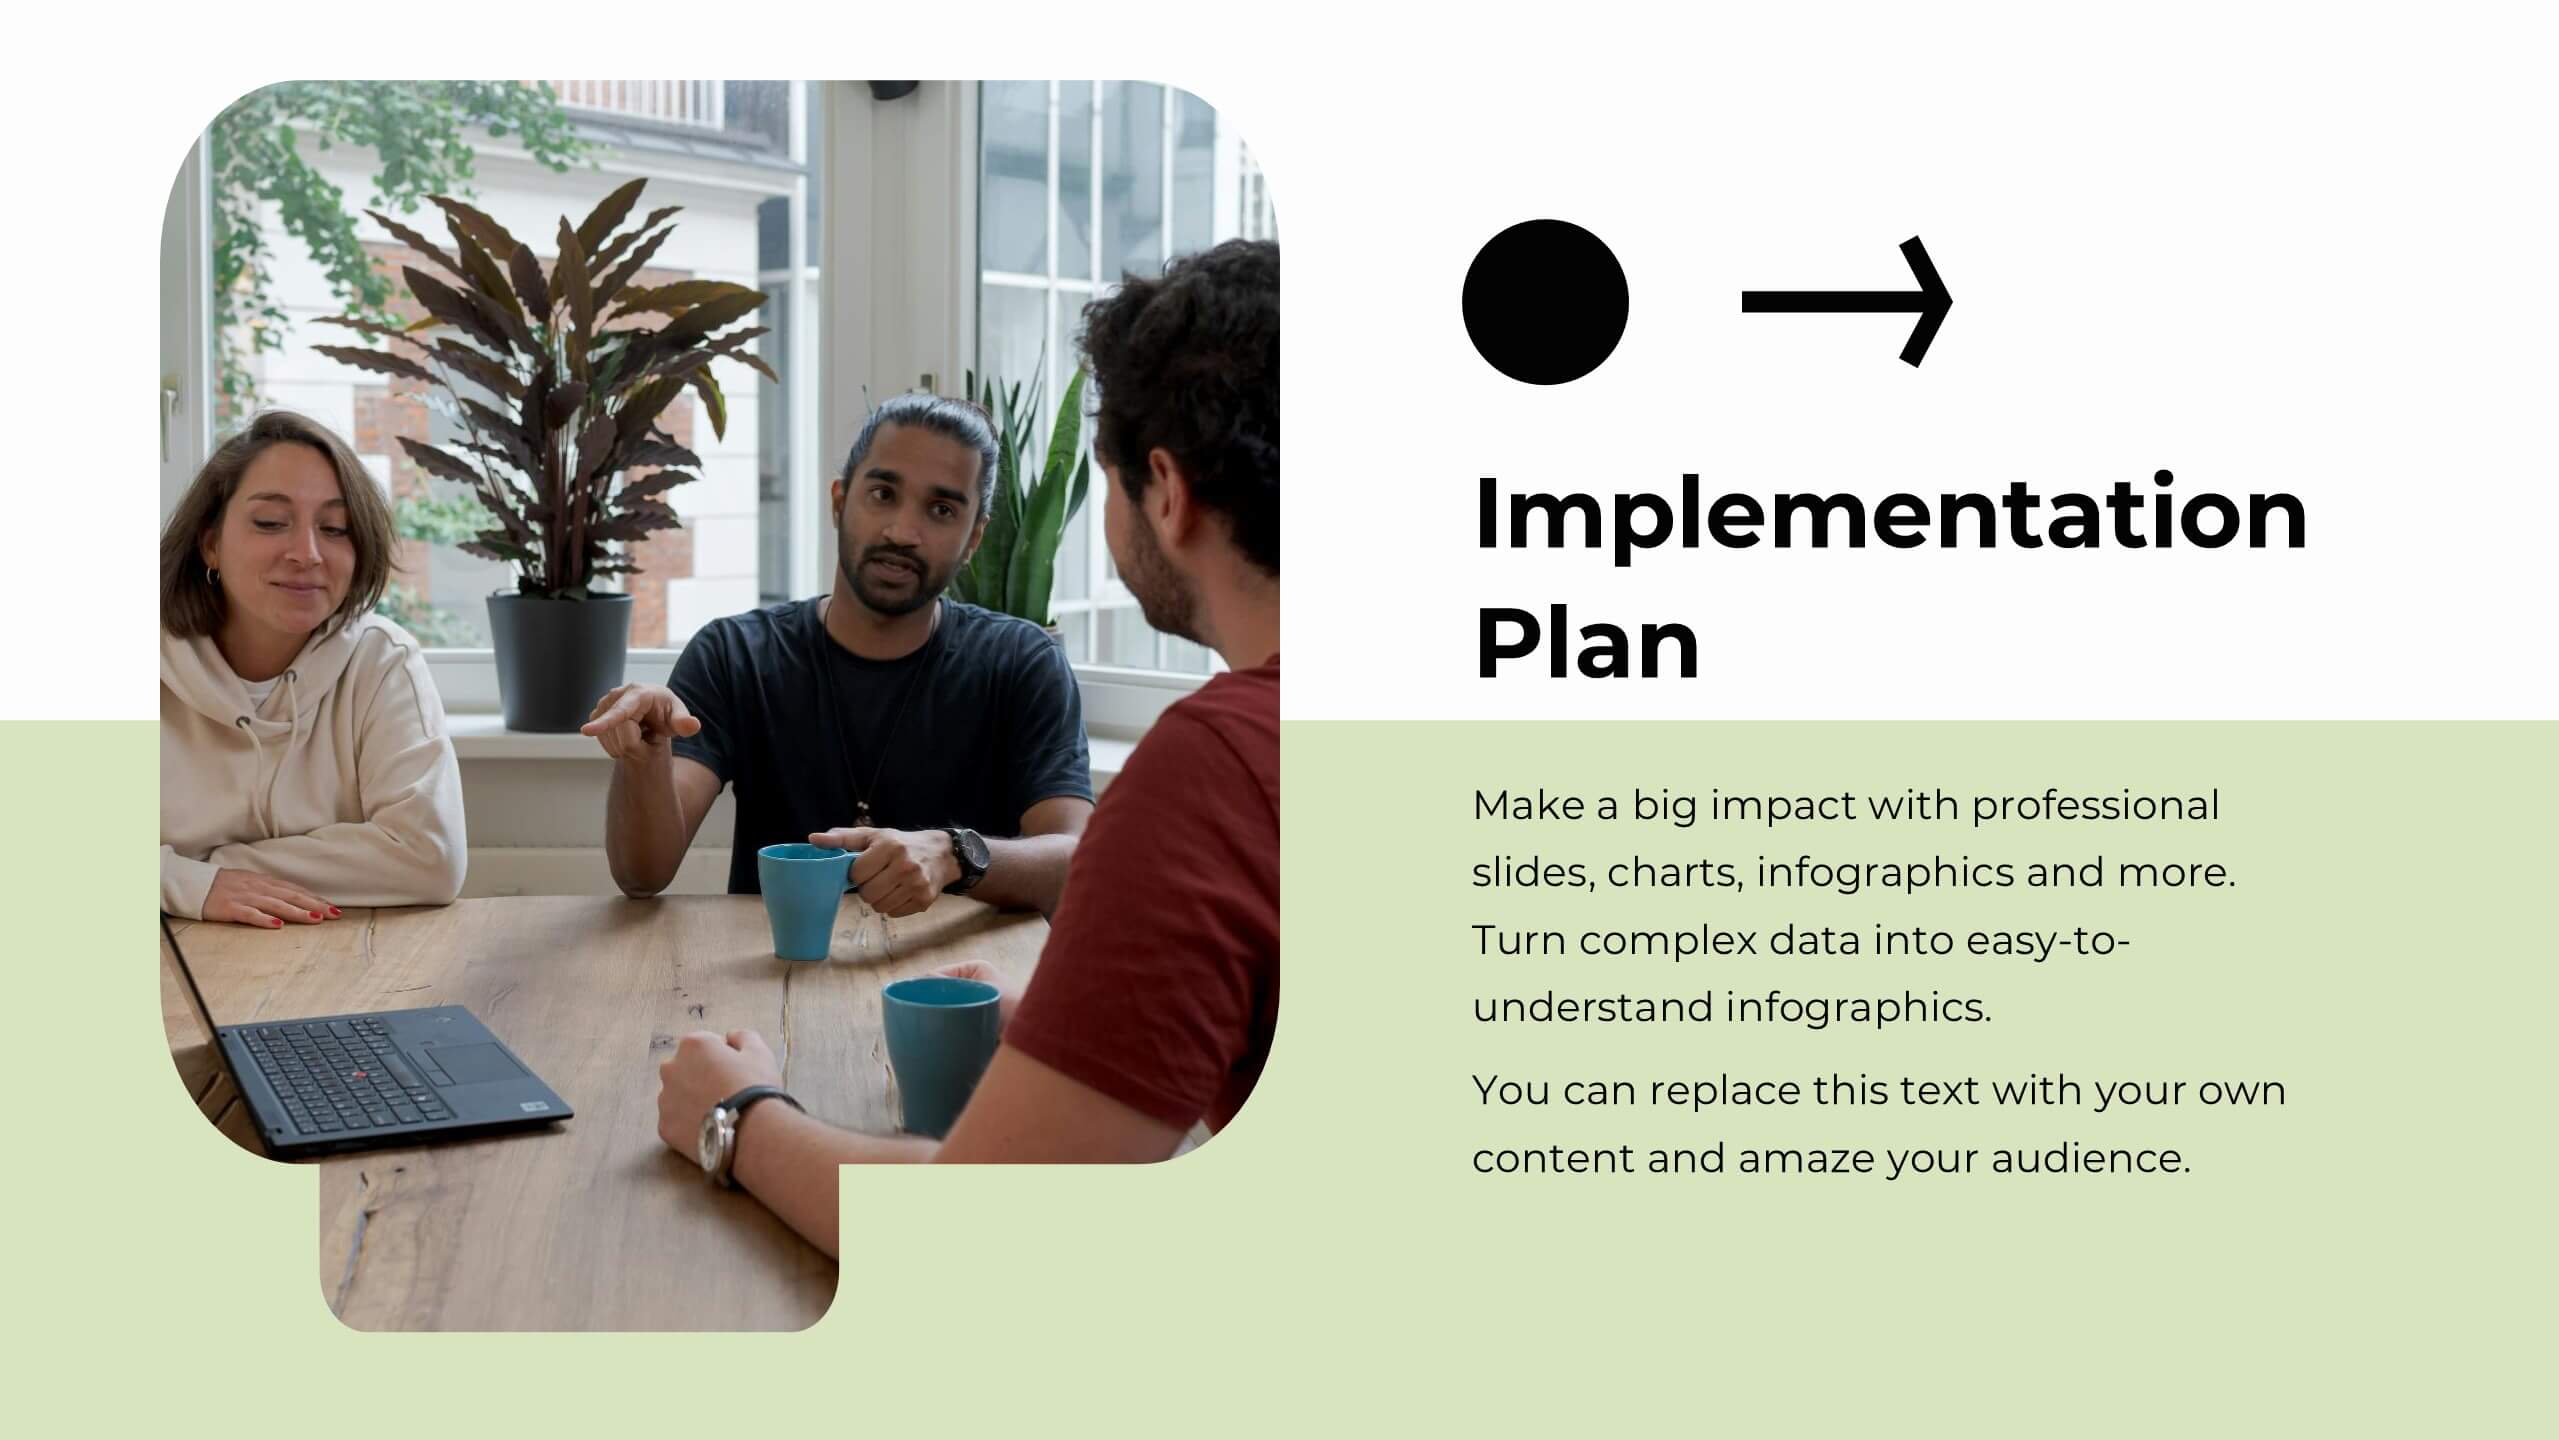
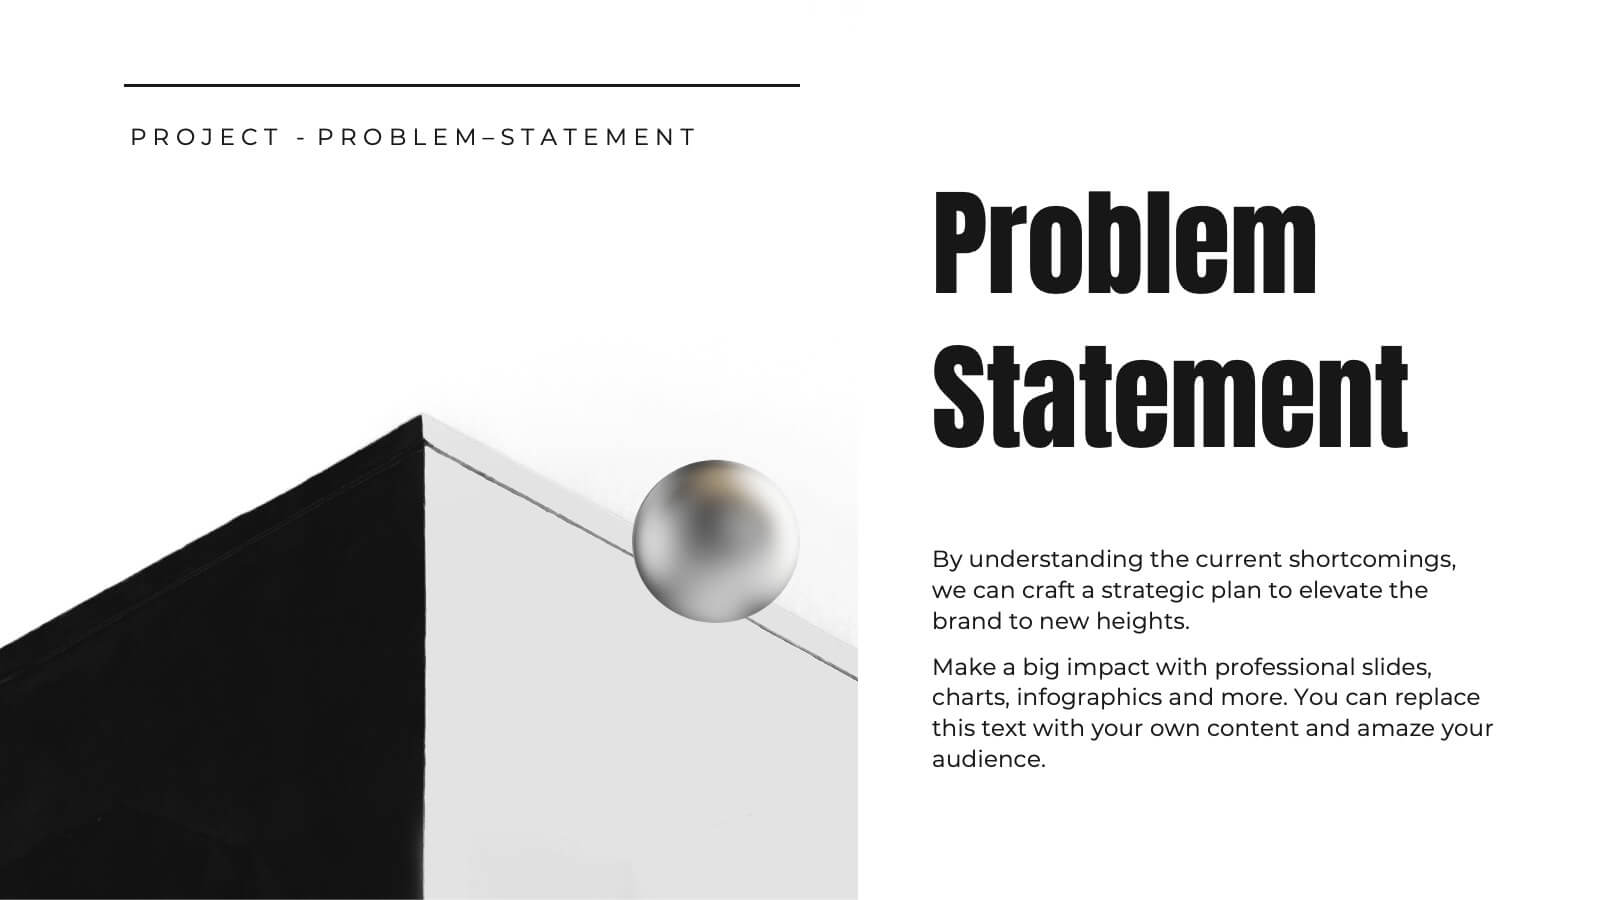
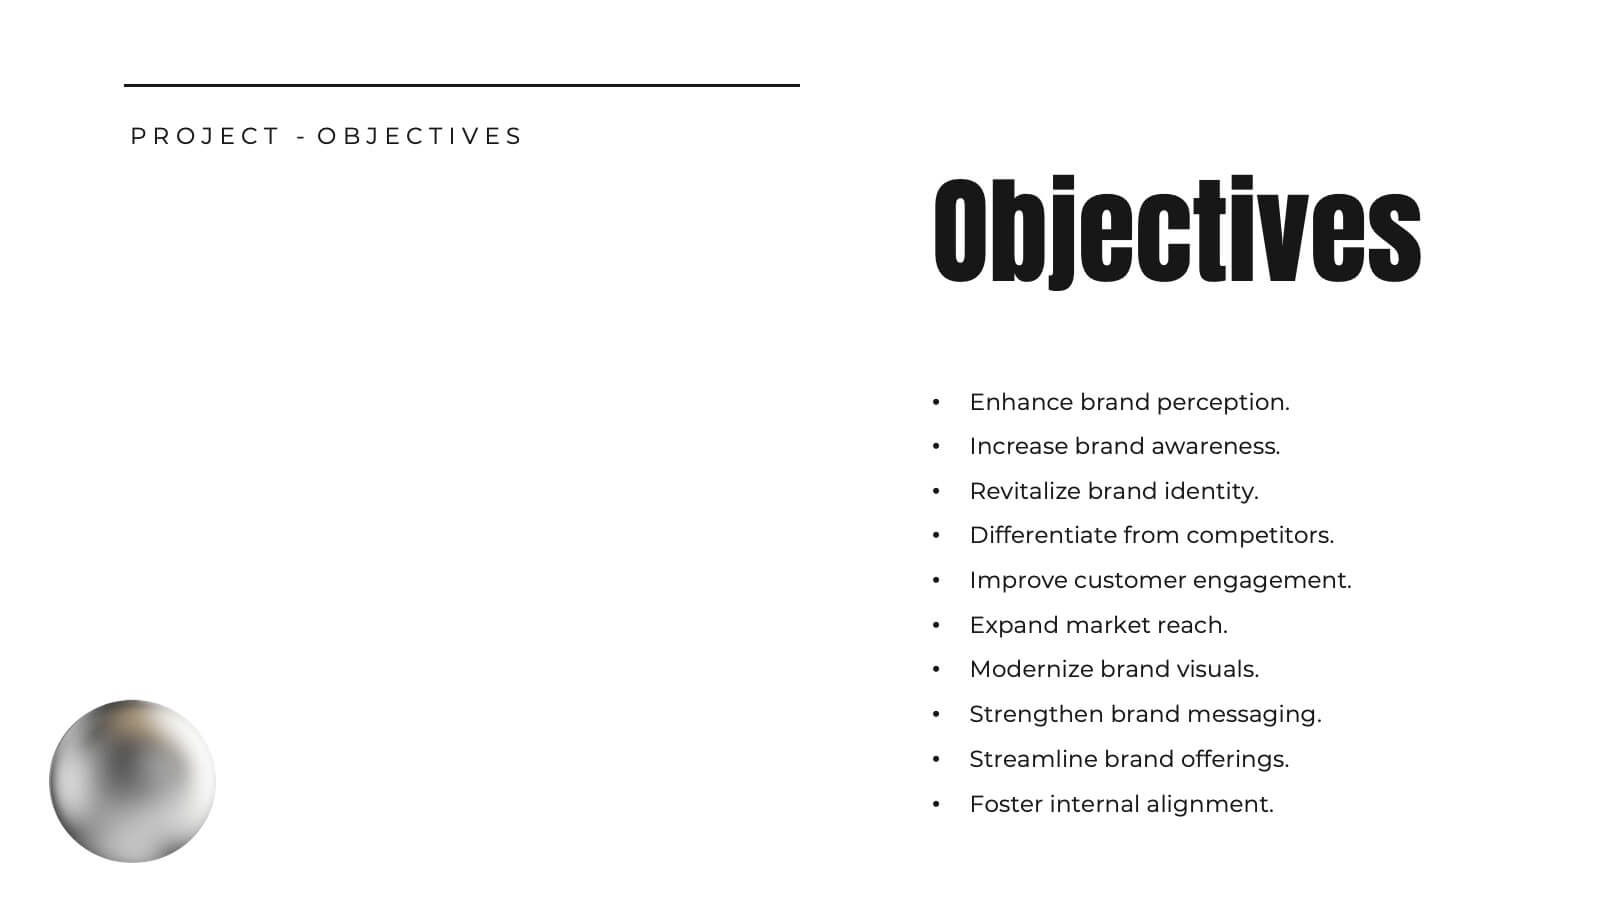
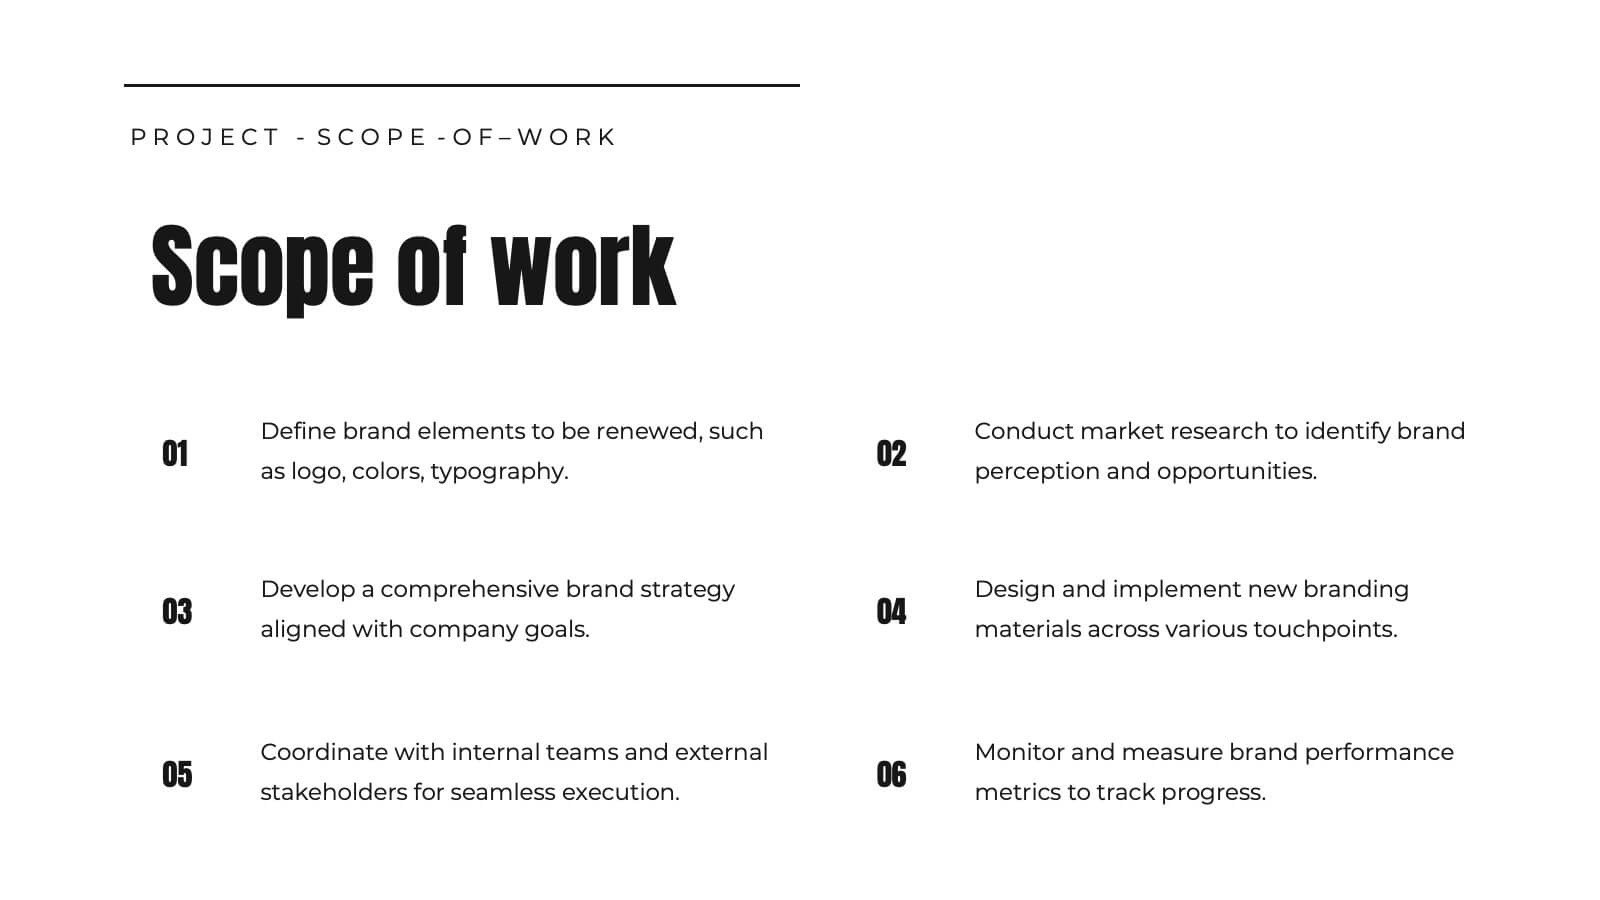
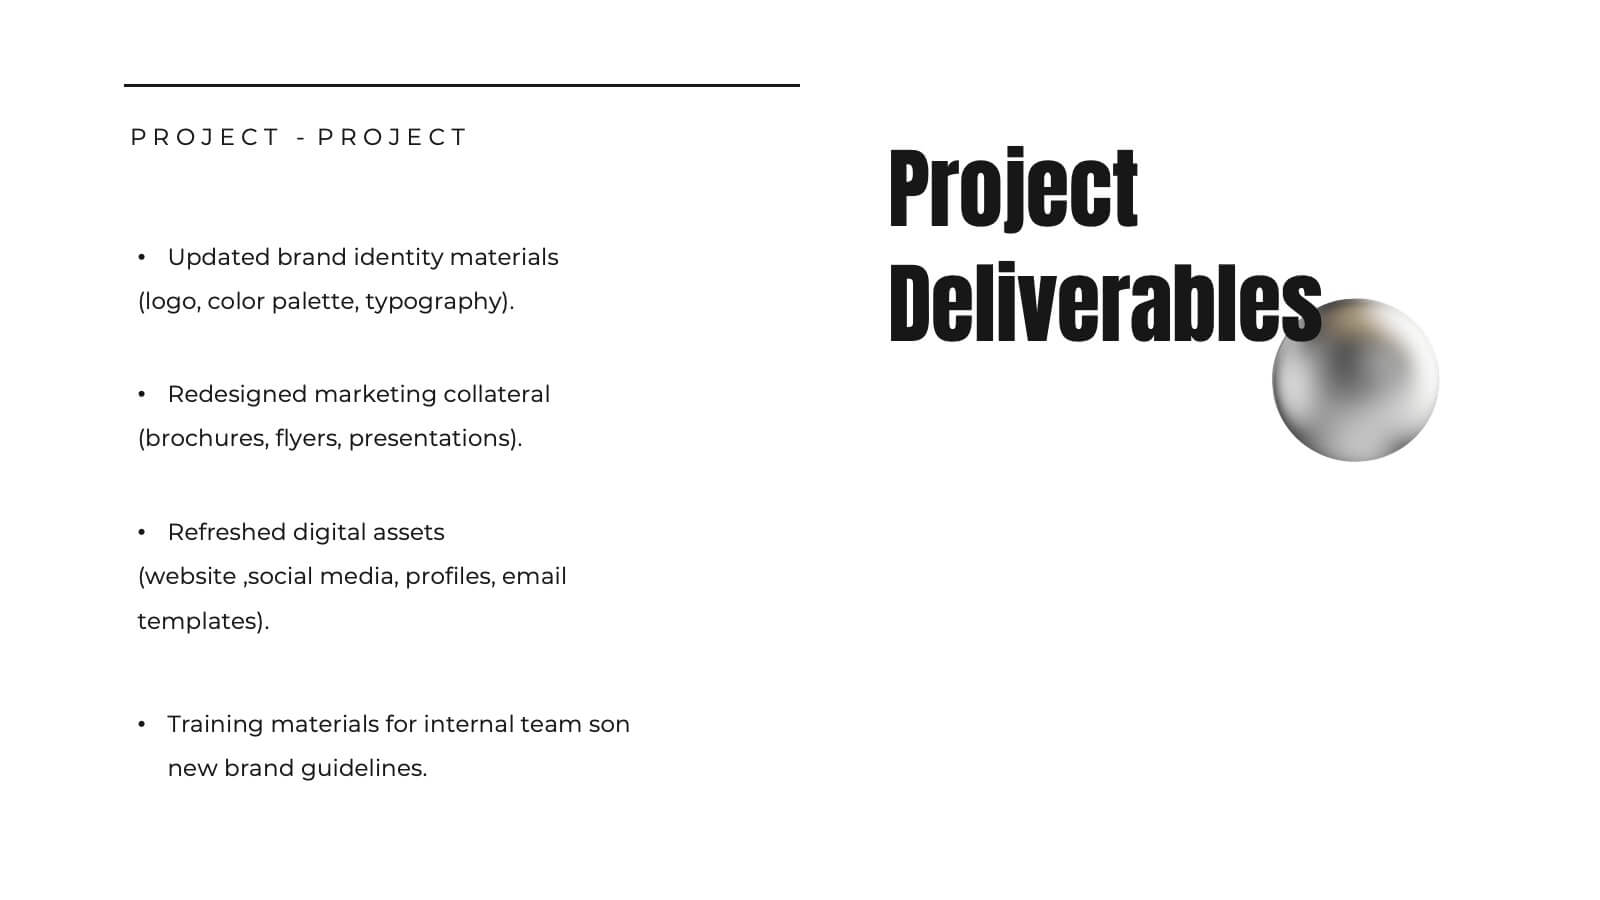
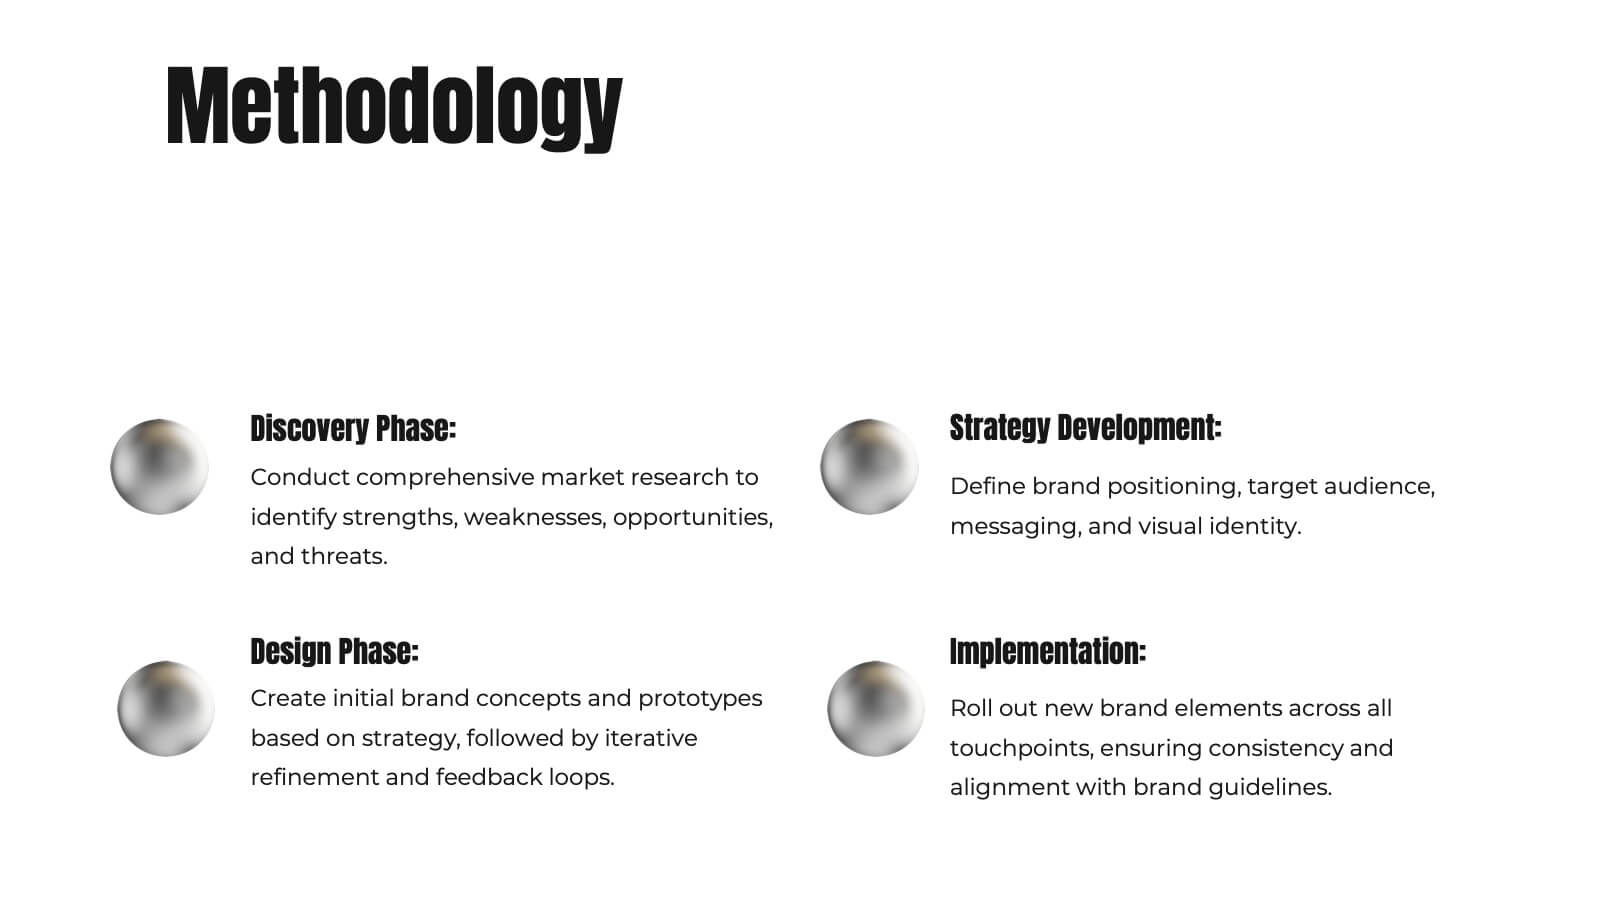
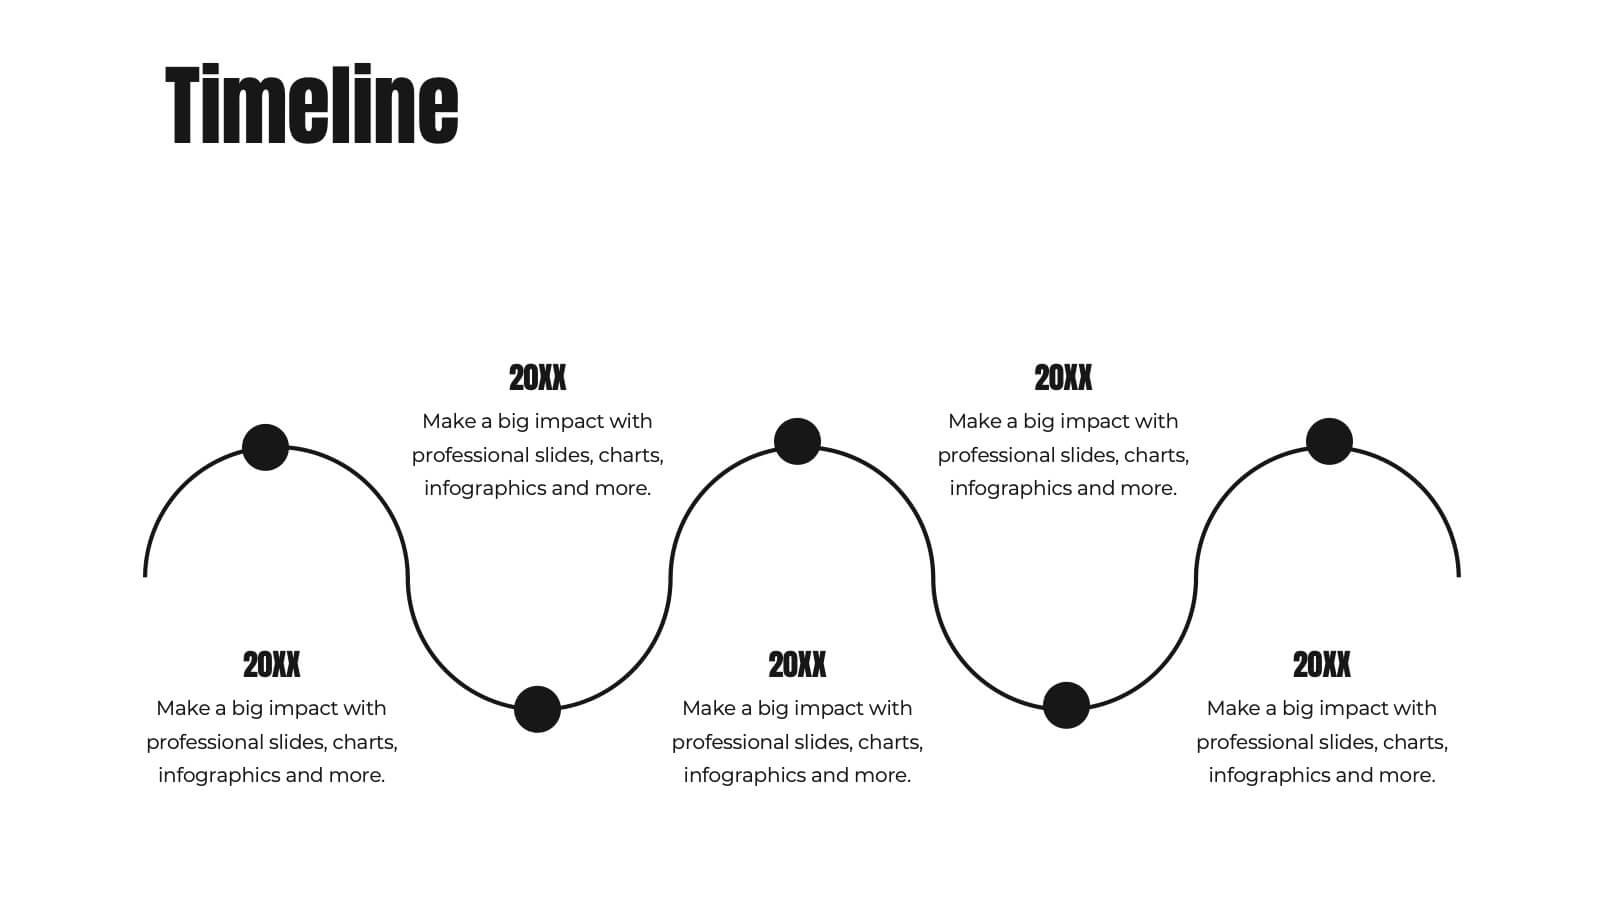
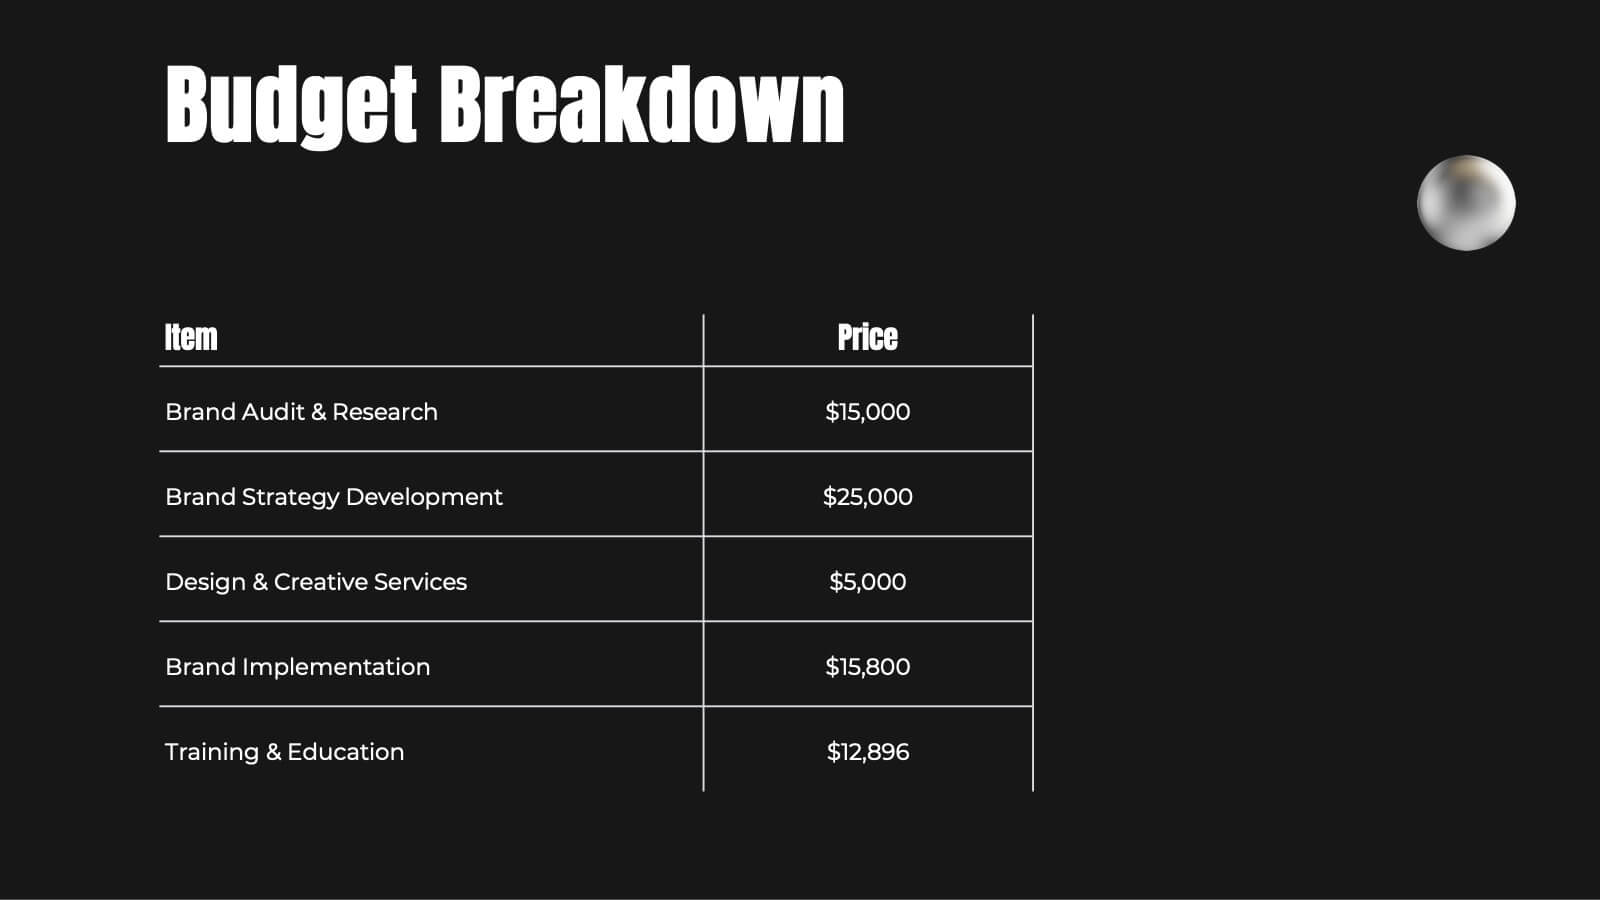
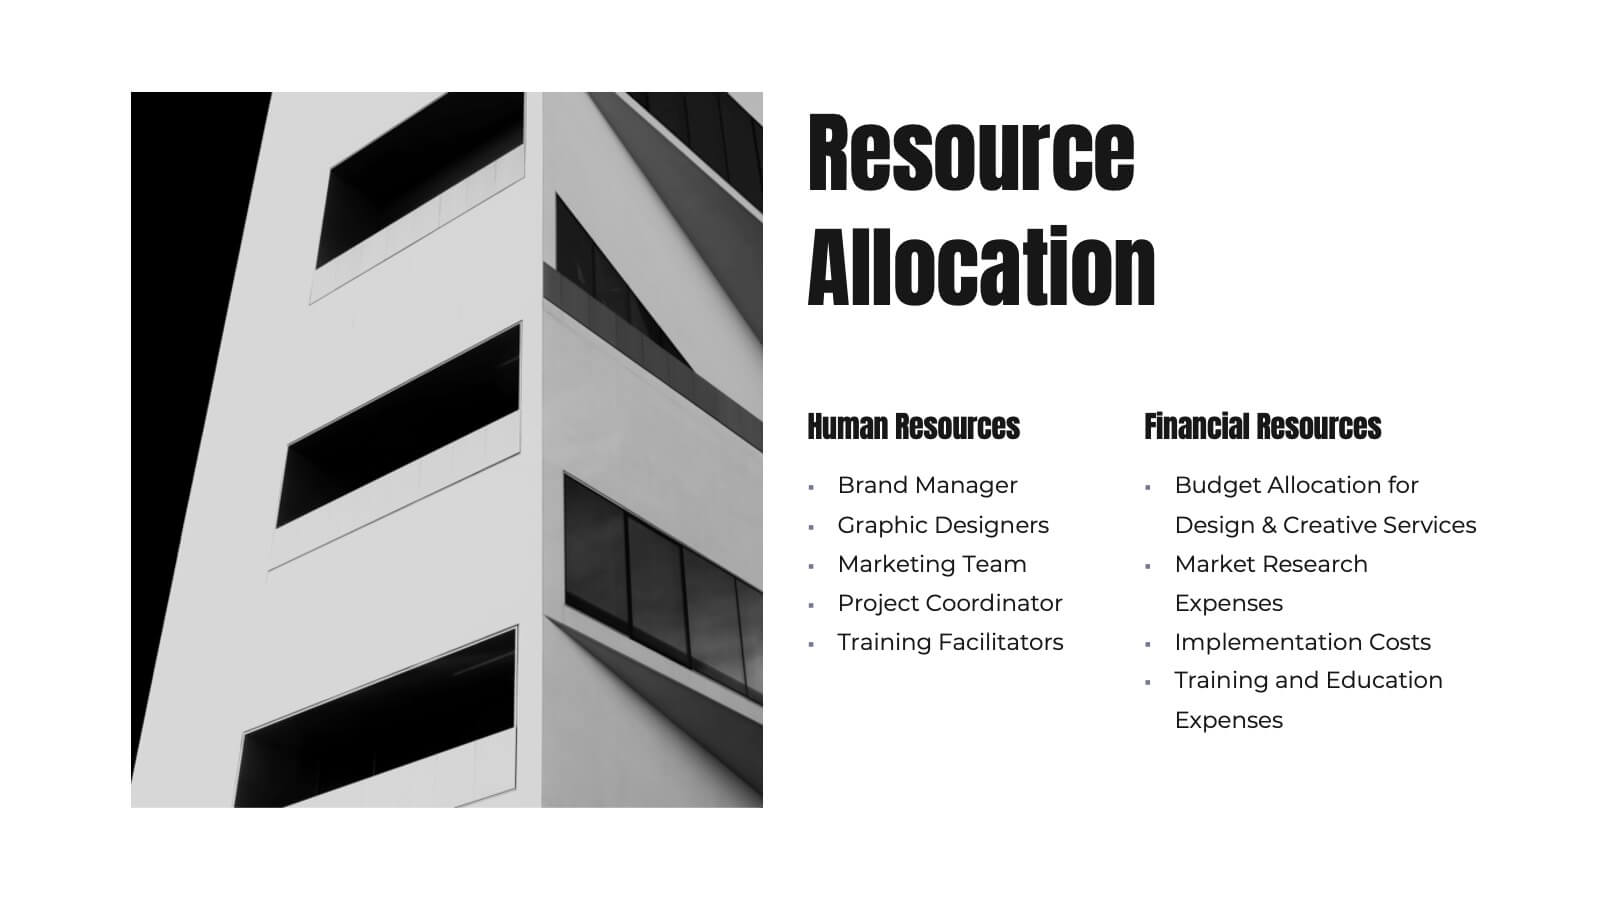
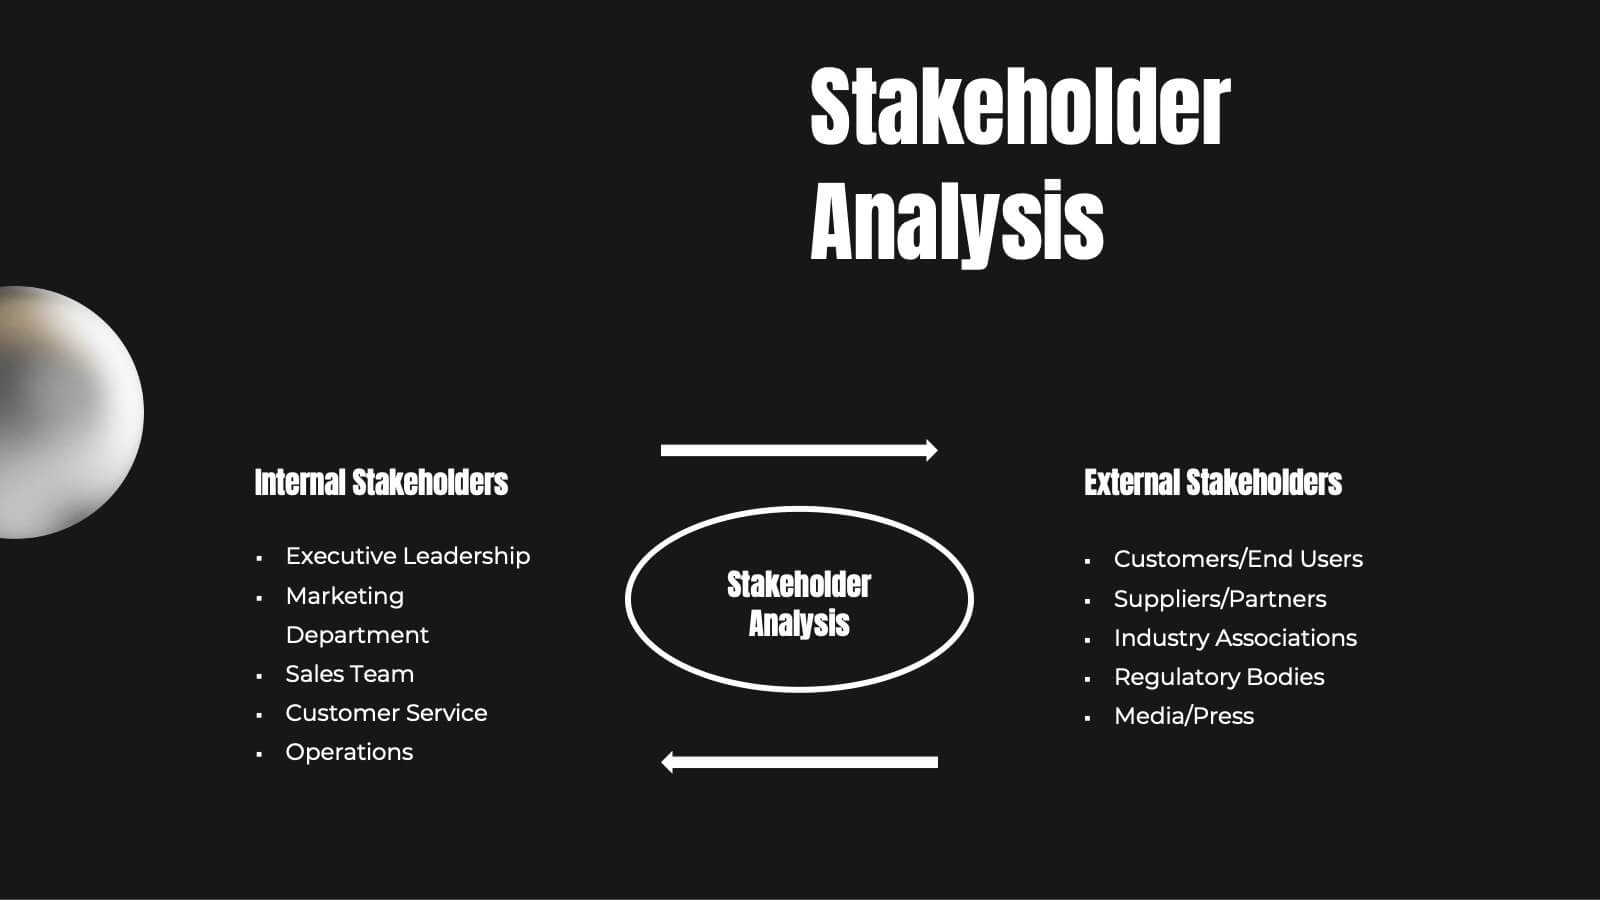
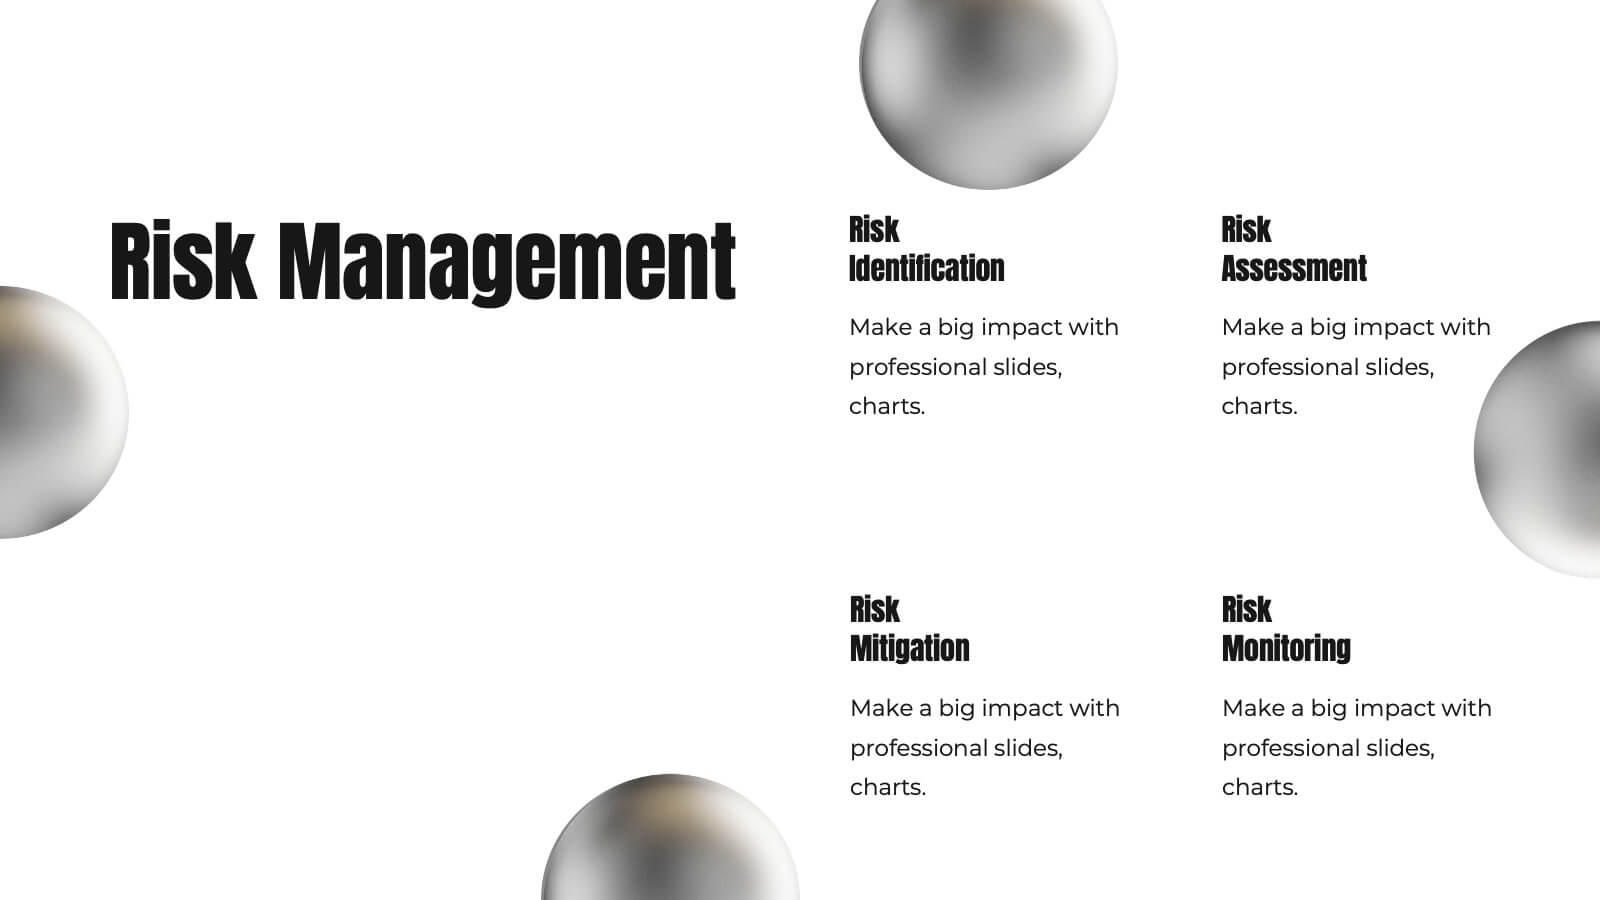
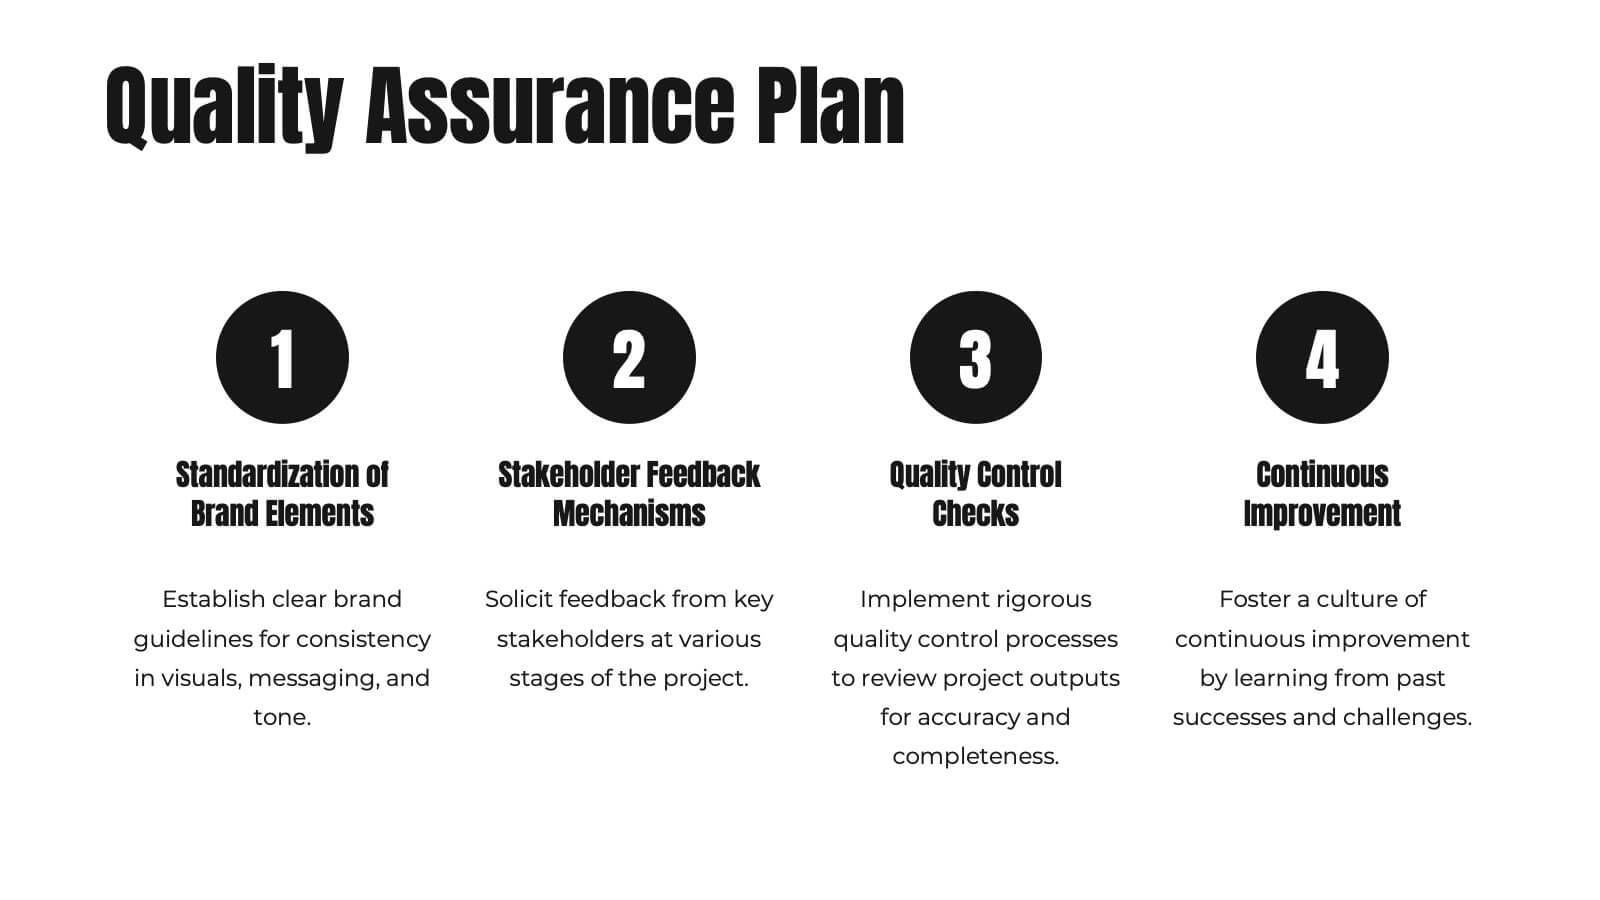
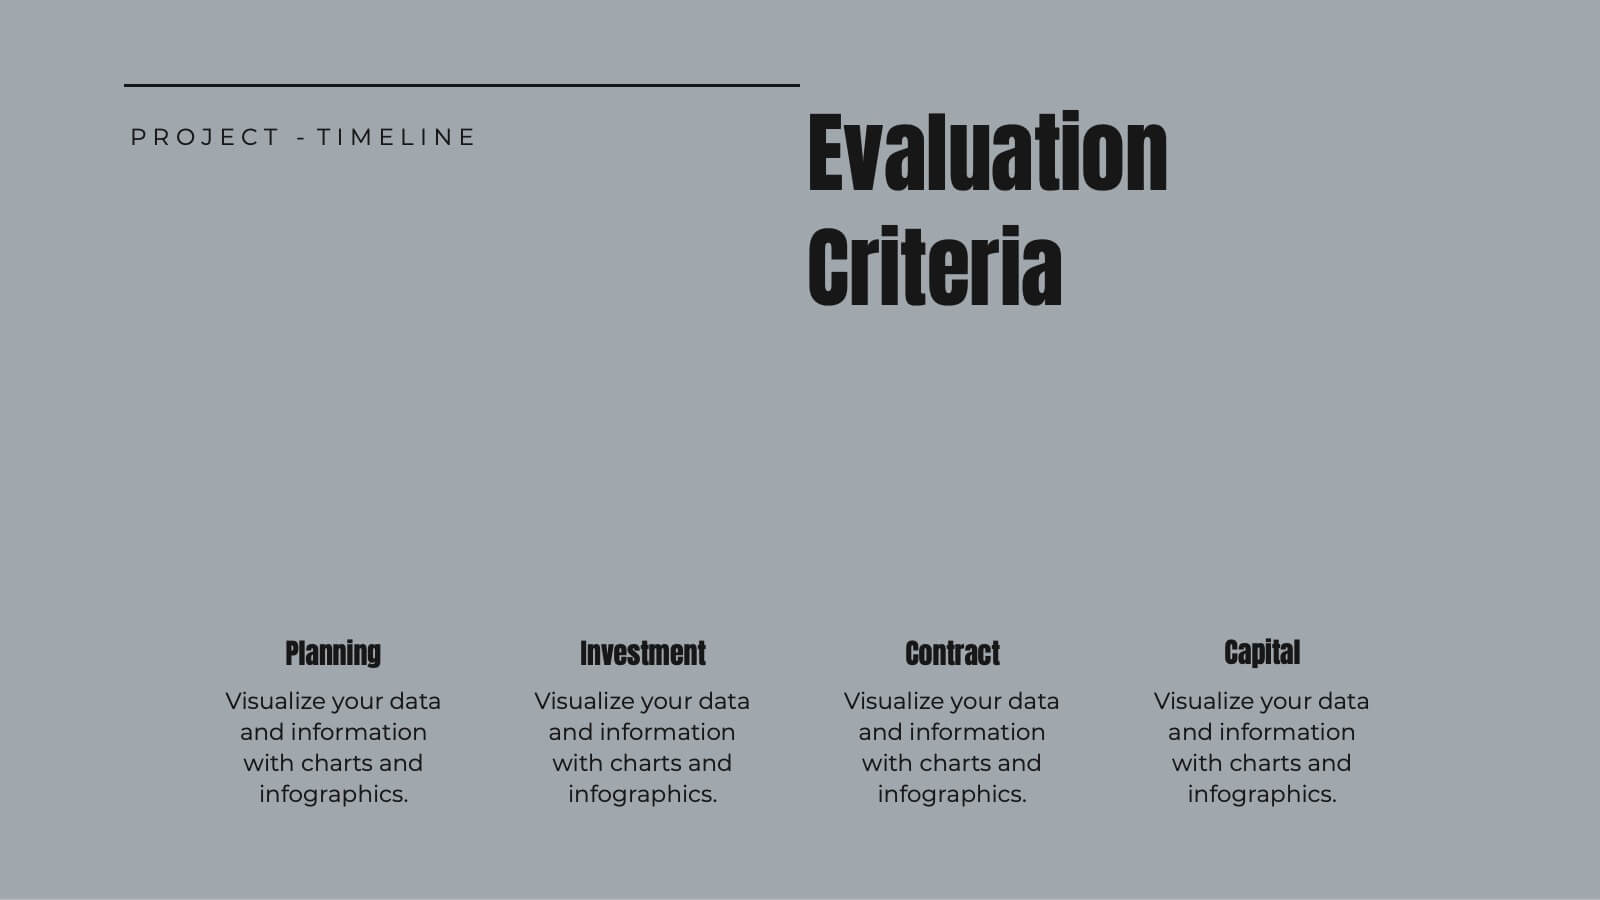
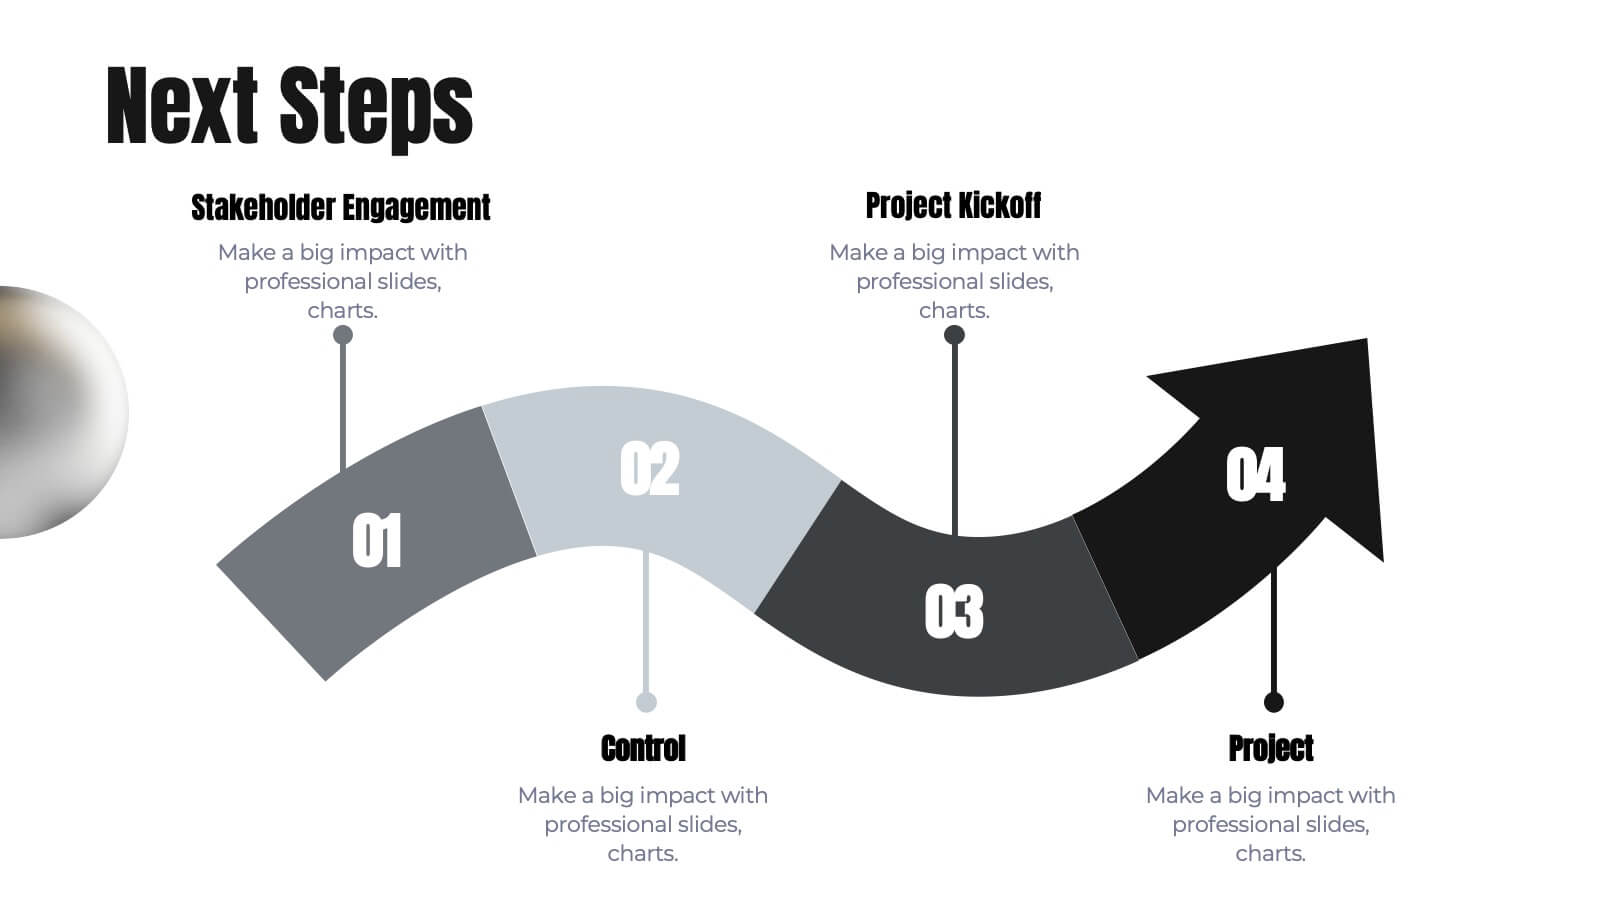
Janus Project Timeline Presentation
Craft a seamless project plan with this sleek and professional presentation template! Designed to guide you through every step, from project overview and scope of work to risk management and resource allocation, this template covers all the essentials. It's perfect for keeping your team on track with clear deliverables, timelines, and evaluation criteria. Compatible with PowerPoint, Keynote, and Google Slides for effortless presentations.