


Características


¿Tienes alguna pregunta?
Recomendar


20 diapositivas
Whisper Creative Portfolio Presentation
The Creative Portfolio Presentation Template is a visually striking 20-slide design, ideal for showcasing your professional work or services. It features slides for introductions, about us, portfolio overviews, and individual project highlights. Key sections include philosophy, style, creative process, client testimonials, awards, and pricing structures. The vibrant yellow and pink gradient elements provide a modern, creative flair that grabs attention. Fully customizable and compatible with PowerPoint, Keynote, and Google Slides, this template is perfect for designers, agencies, and freelancers aiming to present their work professionally and uniquely.


7 diapositivas
Performance Improvement Infographics
A Performance Improvement infographic is a visual representation of the key elements of a plan to enhance the performance of an individual, team, or organization. The purpose of this template is to communicate the plan's objectives, strategies, and metrics in an informative and engaging way. This infographic contains graphs, and diagrams to illustrate key performance indicators and other measures of success. This performance template can help motivate and engage stakeholders, highlight the benefits of performance improvement, and facilitate communication and collaboration among team members.


10 diapositivas
Cryptocurrency Market Trends
Highlight key movements in the crypto space with this 5-step 3D bar chart layout. Ideal for financial analysts, fintech startups, and blockchain professionals. Fully editable in PowerPoint, Keynote, or Google Slides—customize colors, text, and data to reflect your insights with precision.


6 diapositivas
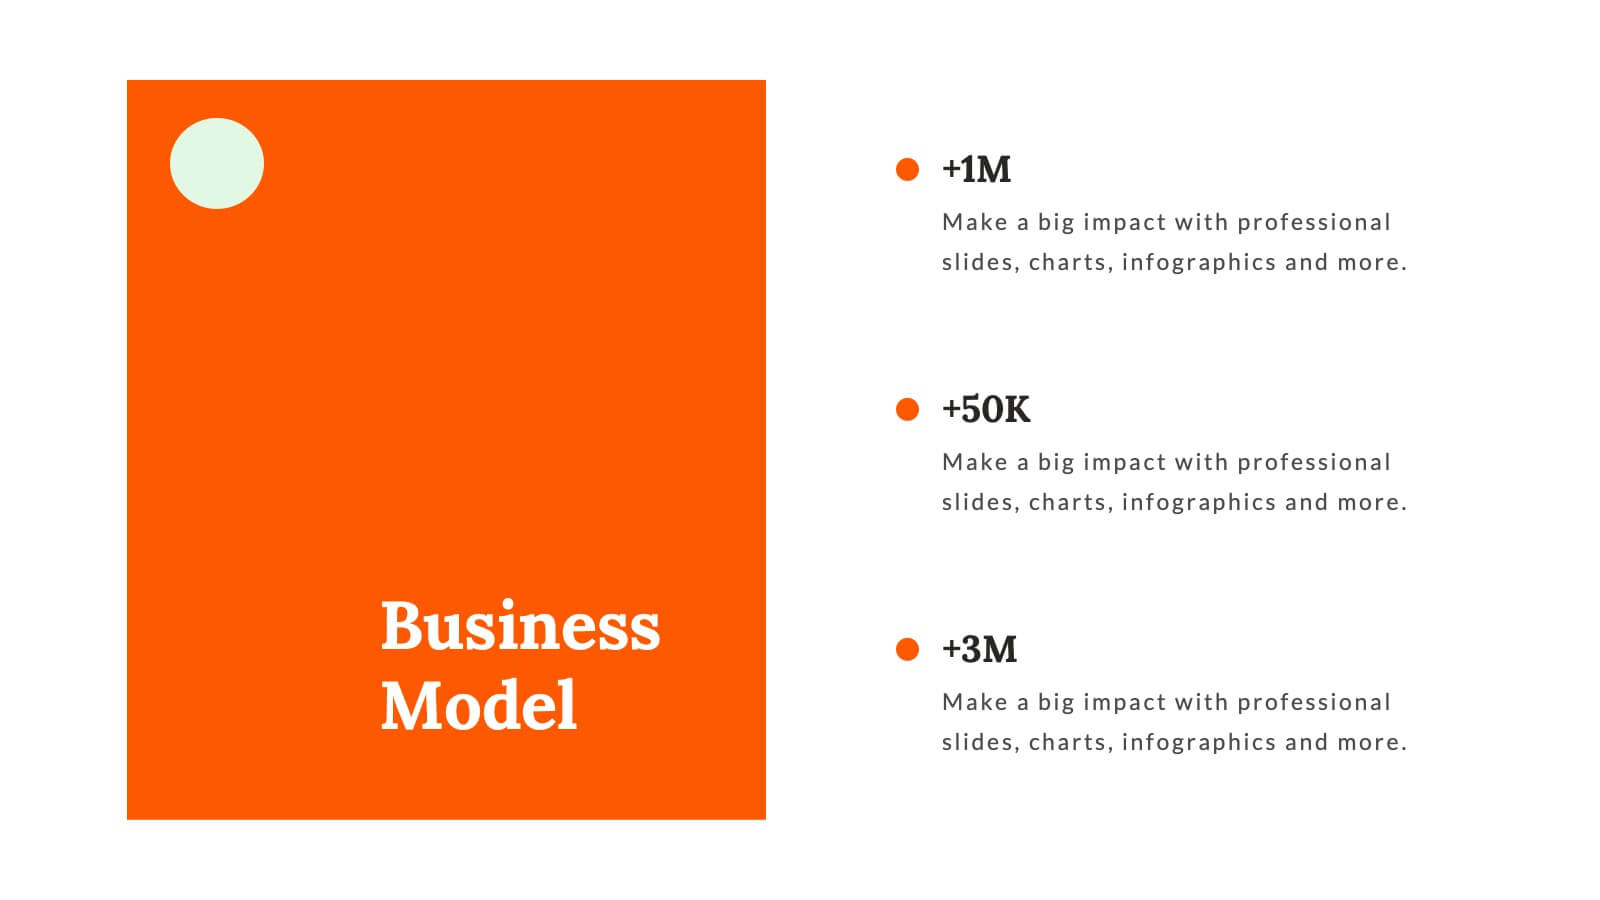
Circular Business Wheel Model Presentation
Break down your strategy into dynamic segments with this Circular Business Wheel Model. This layout is ideal for showcasing interconnected business areas like sustainability, innovation, monetization, and market appeal. Perfect for strategy decks, business planning, and growth presentations. Compatible with PowerPoint, Keynote, and Google Slides—fully editable for your needs.


5 diapositivas
SEO Strategies Infographics
Immerse yourself in the dynamic world of digital marketing with our SEO strategies infographics. Rendered in bold black, vibrant orange, and various eye-catching colors, this creative and vertical template serves as a beacon for marketing professionals, digital strategists, and entrepreneurs who aim to conquer the digital space. Each element, from engaging graphics to interpretative icons, is specifically tailored to present SEO methodologies with clarity and charisma. This infographic template is not only a visual treat but a reservoir of insights, facilitating users to communicate influential SEO tactics effectively and drive their brand's online visibility forward.


34 diapositivas
Pitch Deck Startup
Introducing our Pitch Deck Startup! Whether you are pitching to investors, partners, or customers, this template will help you create a persuasive presentation that showcases your company, growth plans, and financial projections. Customize the template to suit your needs and deliver a successful pitch that highlights the unique value of your startup and attracts potential investors or customers. This template includes sections for introducing your startup, explaining your business idea and market opportunity, showcasing your products or services, highlighting your financial projections, and outlining your growth plans.


8 diapositivas
Marketing Campaign Performance Presentation
Showcase campaign metrics in style with this Marketing Campaign Performance layout. Featuring four icon-labeled data cards at the top and two integrated charts below (pie and bar), this slide offers a snapshot of performance insights—ideal for comparing reach, engagement, and conversion data across platforms. Fully editable and compatible with PowerPoint, Keynote, and Google Slides.


5 diapositivas
Investor Pitch Slide Deck Presentation
Captivate investors from the first slide with a clean, modern design that showcases your business idea, traction, and vision with clarity. This presentation helps you structure key points effectively for funding discussions. Fully customizable and compatible with PowerPoint, Keynote, and Google Slides for a seamless pitching experience.


20 diapositivas
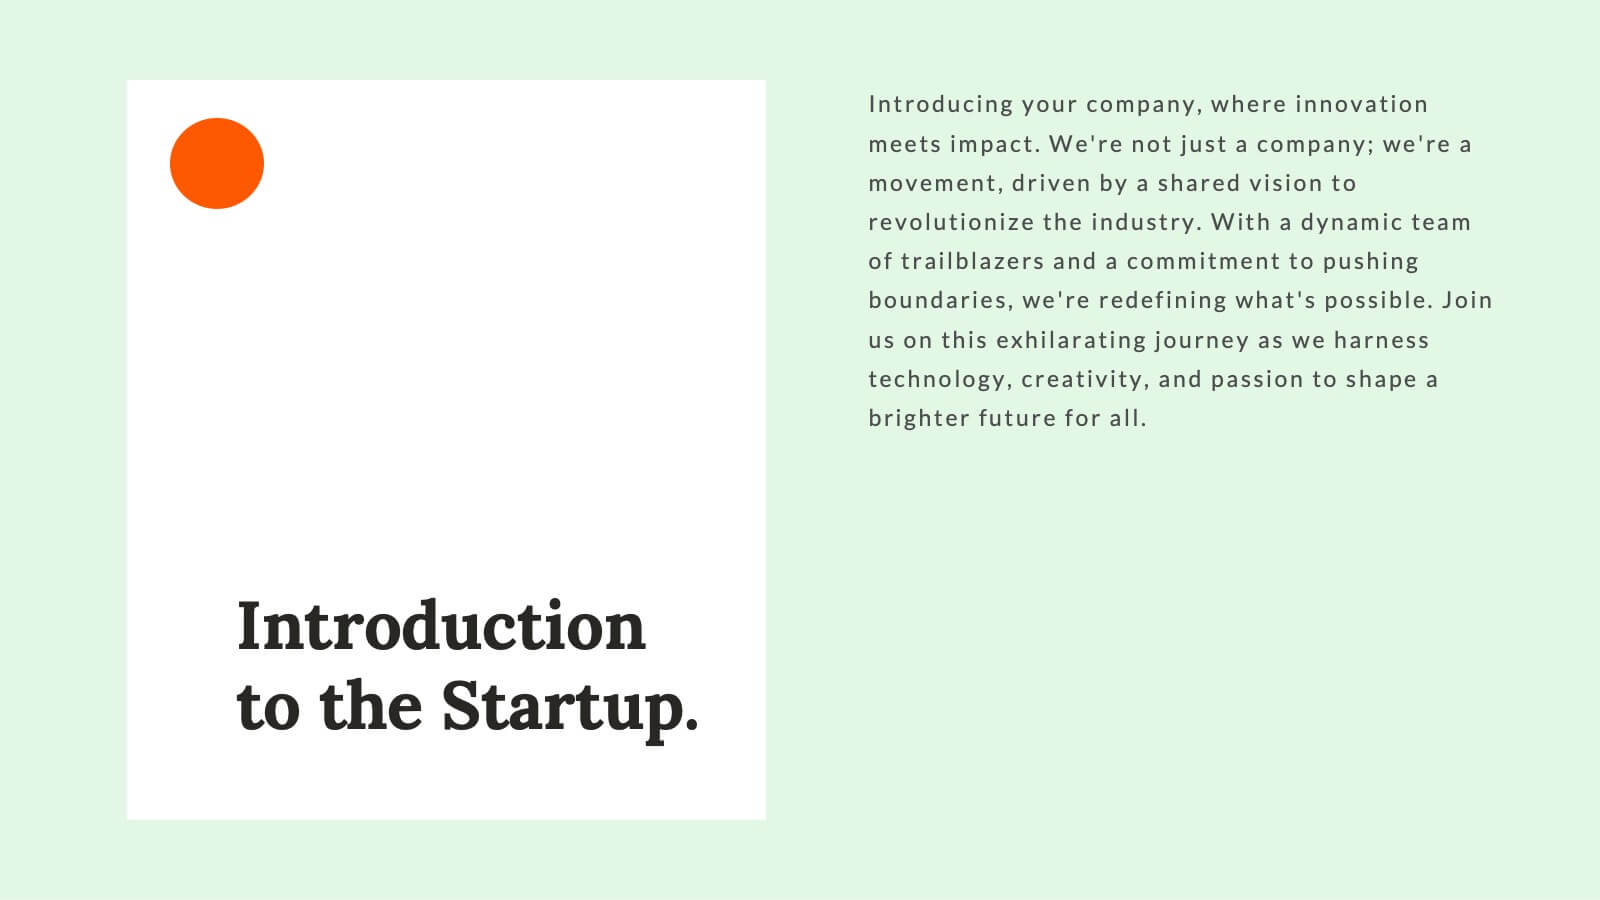
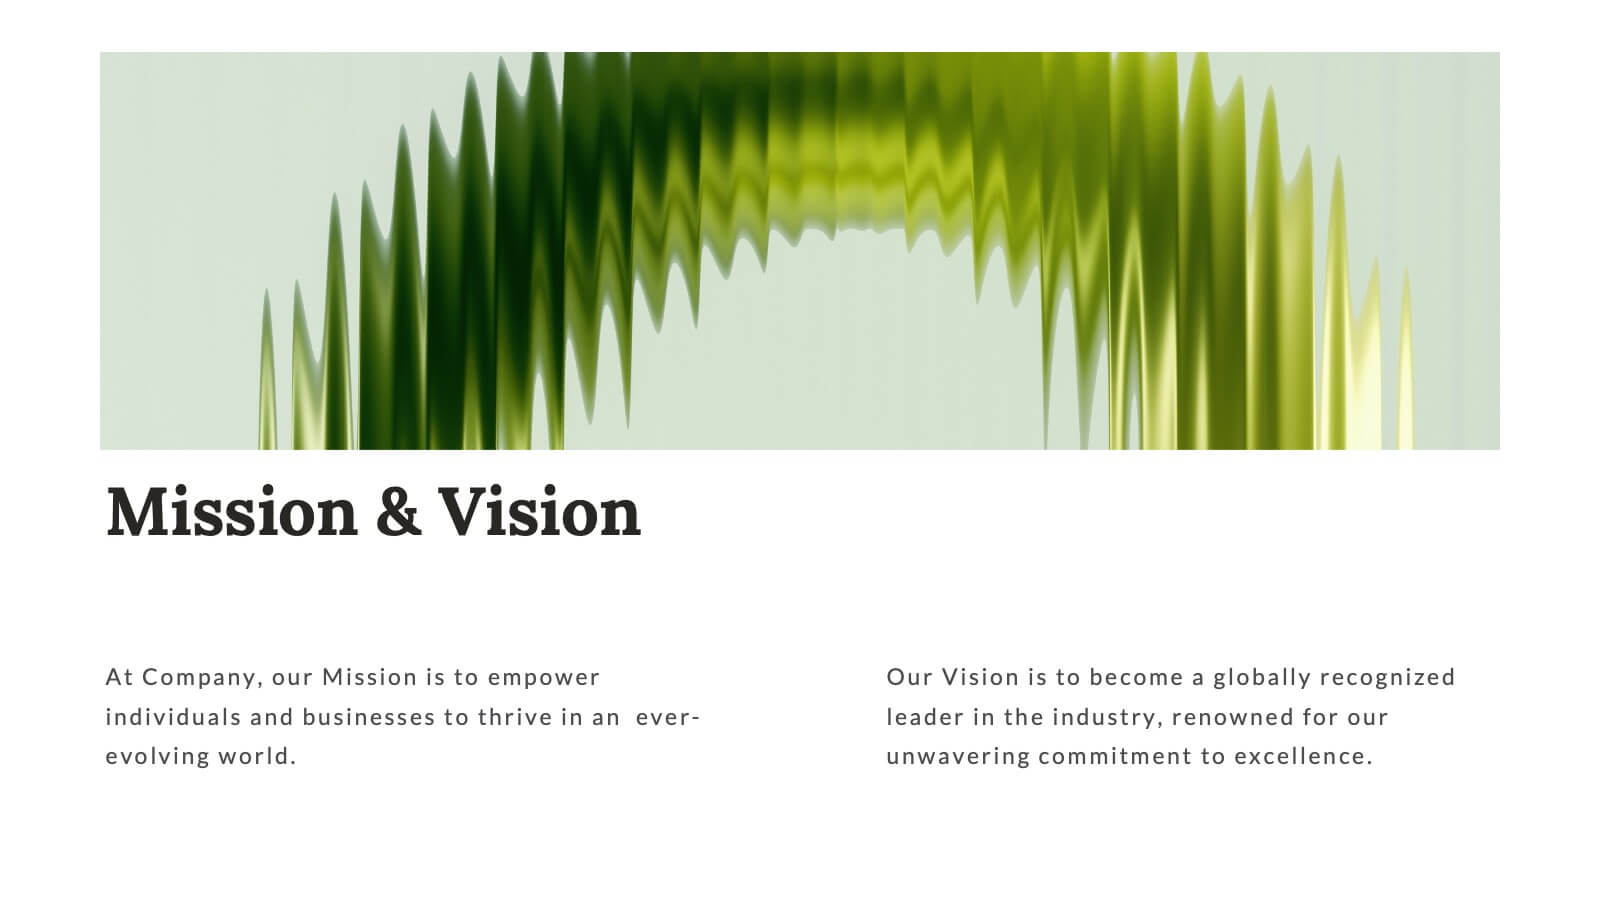
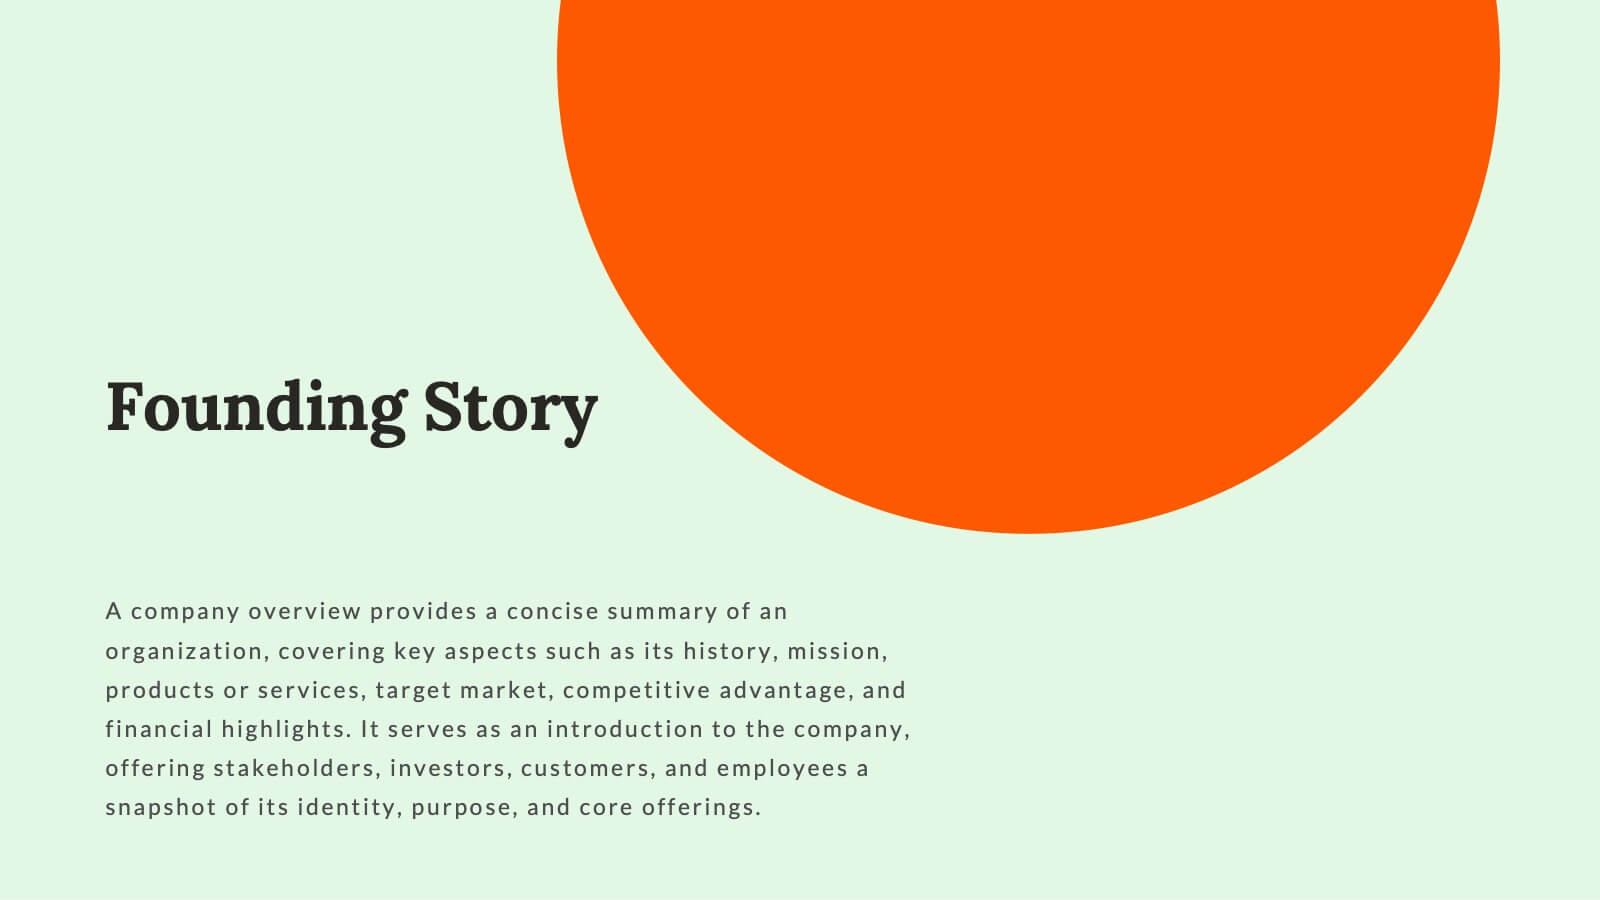
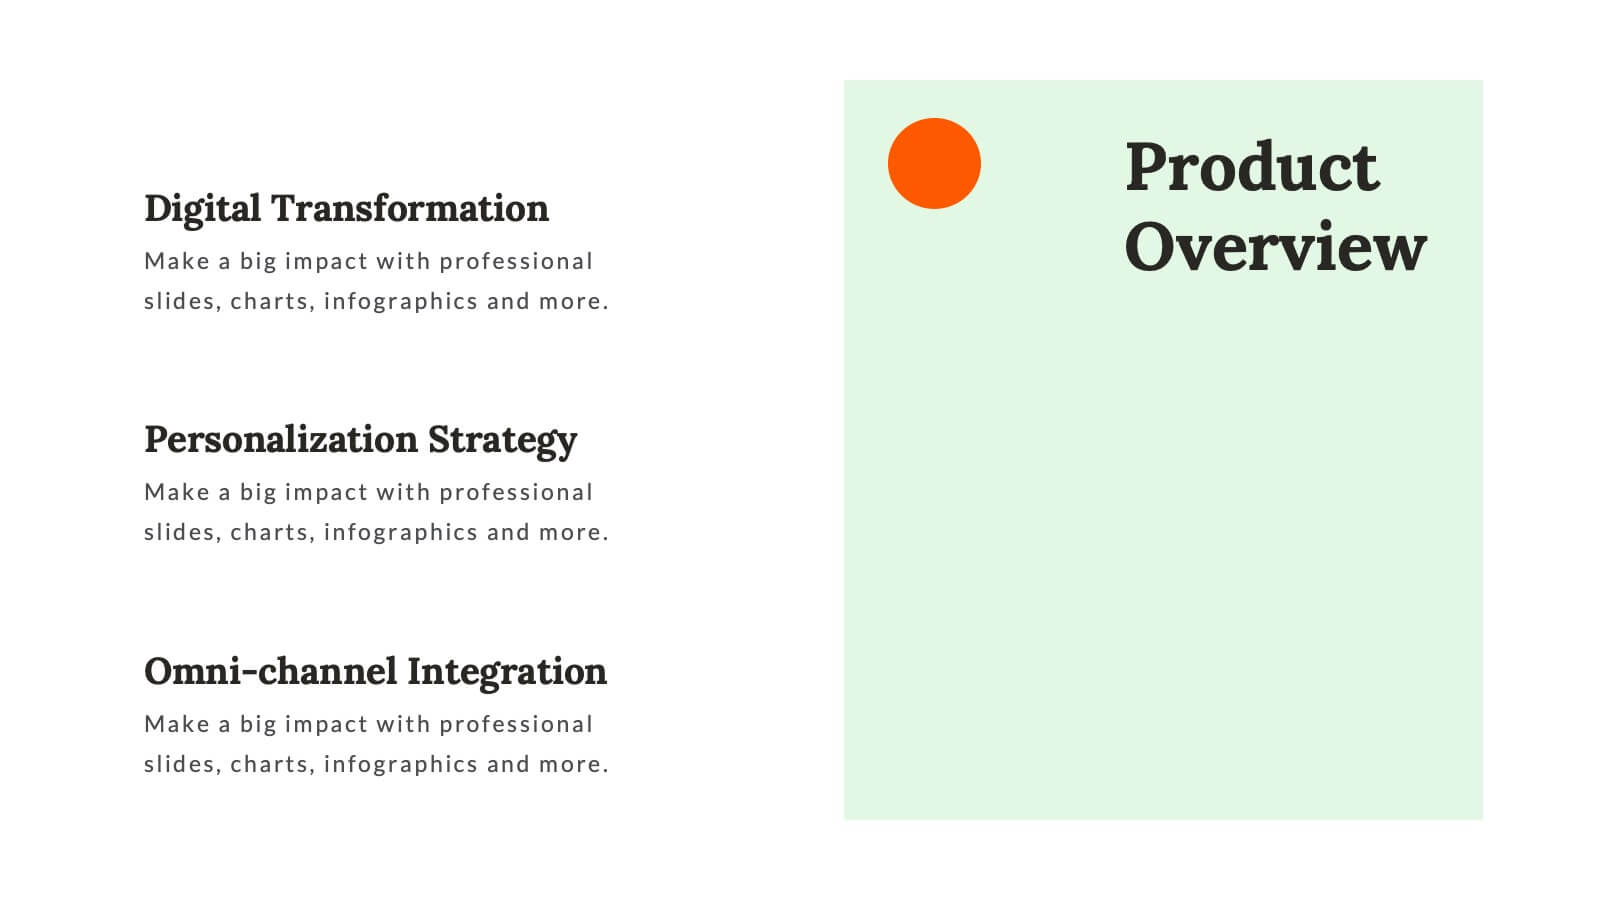
Whirlwind Startup Funding Proposal Presentation
Transform your startup funding proposals with this vibrant and professional template. Designed to impress potential investors, it features sections for mission & vision, founding story, market analysis, and financial overview. Highlight your unique value proposition and business model with clarity and style. This template is compatible with PowerPoint, Keynote, and Google Slides, ensuring seamless presentations on any platform. Perfect for conveying your innovative ideas and growth plans effectively.


6 diapositivas
Business Decision Venn Diagram Presentation
Make complex decision-making simple and visually impactful with this Business Decision Venn Diagram Presentation. Featuring a bold triangular layout with six segmented areas, this slide is ideal for presenting overlapping factors, interconnected strategies, or priority zones. Perfect for business planning, competitive analysis, or project evaluation. Fully editable in PowerPoint, Keynote, and Google Slides for seamless integration into your presentations.


6 diapositivas
Six Sigma Process Infographic
Dive into the world of process improvement with our six sigma process infographic. Crafted with a harmonious blend of blue, yellow, and white, this infographic elucidates the principles of Six Sigma methodology in an engaging manner. Ideal for business analysts, quality assurance teams, and corporate trainers, it delineates the DMAIC process in vivid detail. The design encapsulates the rigorous methodology of Six Sigma, providing clarity and fostering knowledge retention. This versatile template is a perfect fit for PowerPoint, Keynote, and Google Slides, making your presentations both captivating and insightful.


12 diapositivas
Employee Roles and Professional Profiles
Break down team structure and highlight individual strengths with this modern hub-and-spoke layout—perfect for showcasing employee roles, departments, or professional profiles. Whether you're onboarding, presenting org charts, or outlining responsibilities, this slide keeps it all clear and cohesive. Fully compatible with PowerPoint, Keynote, and Google Slides.


23 diapositivas
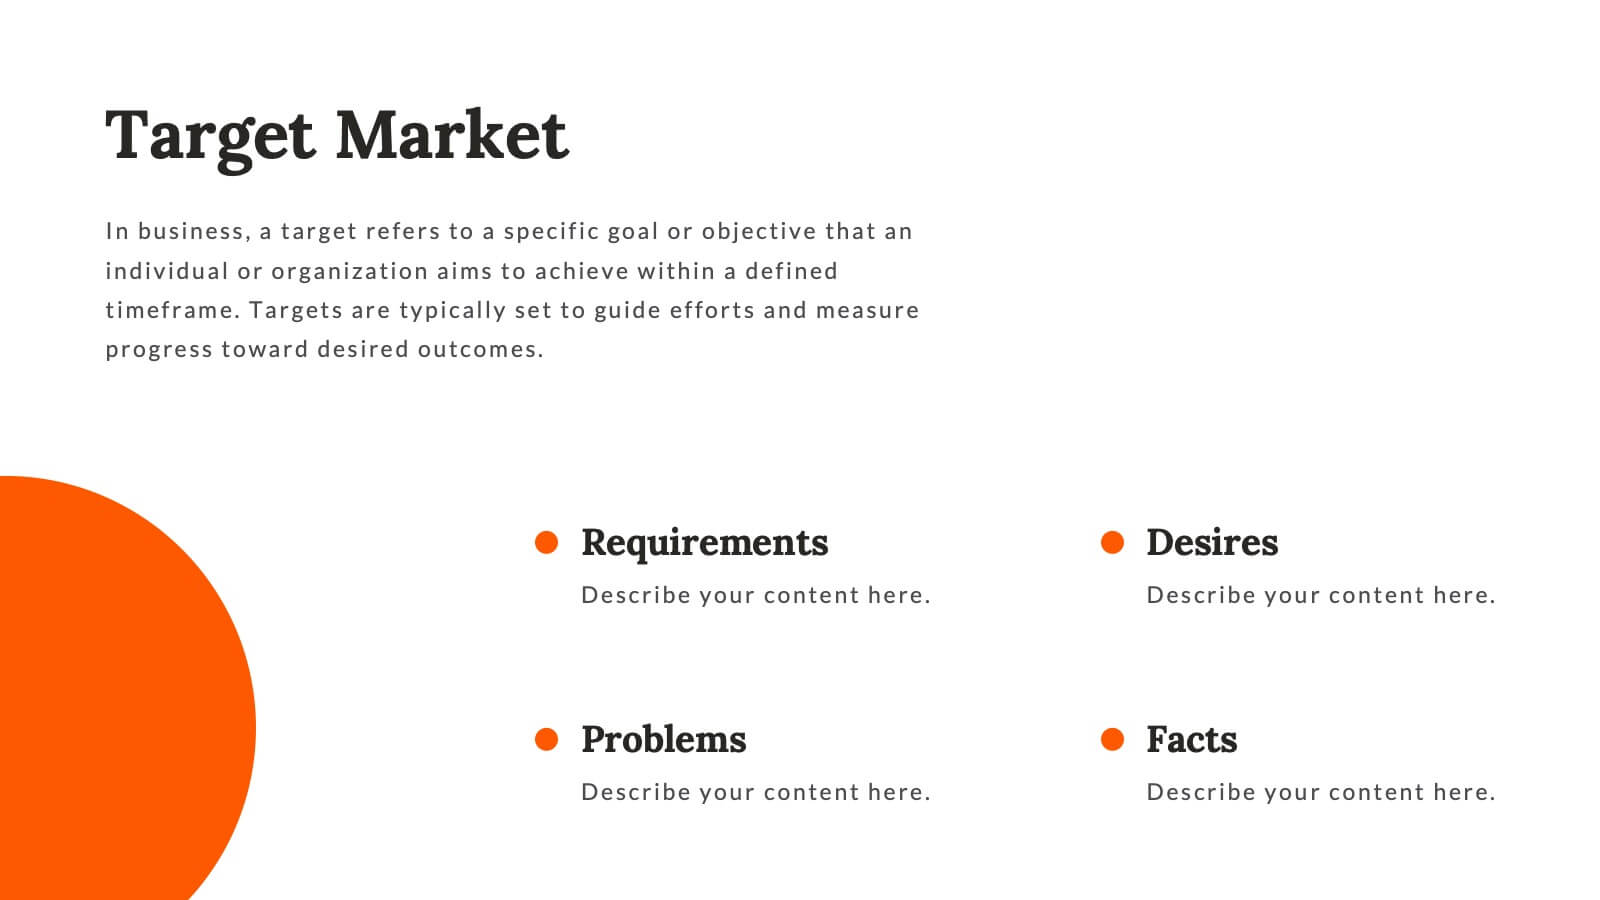
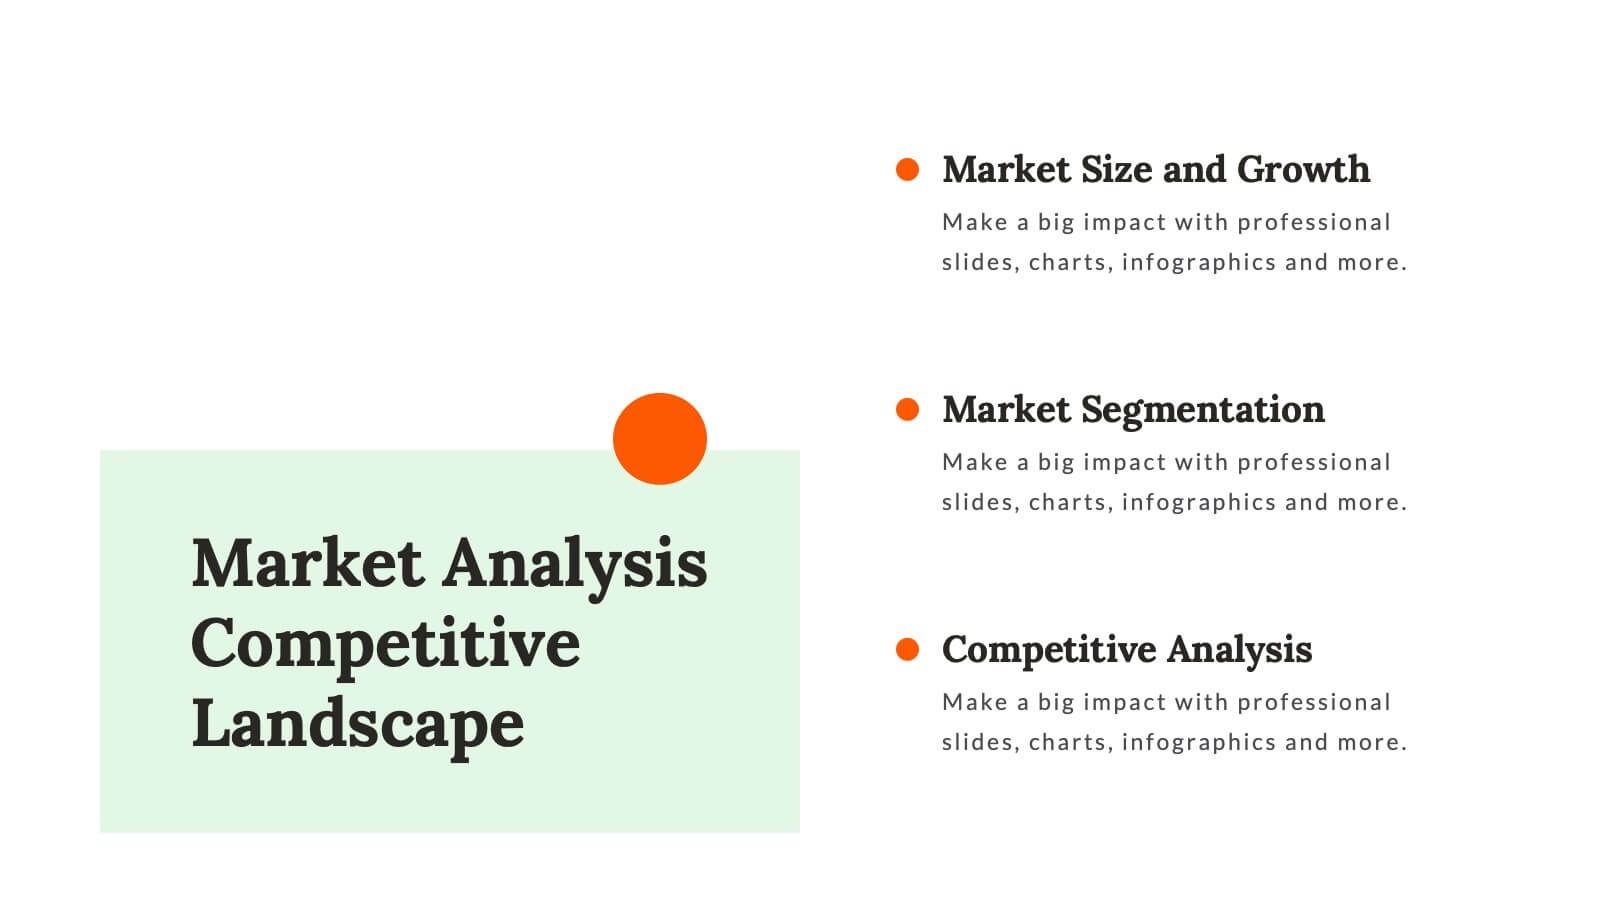
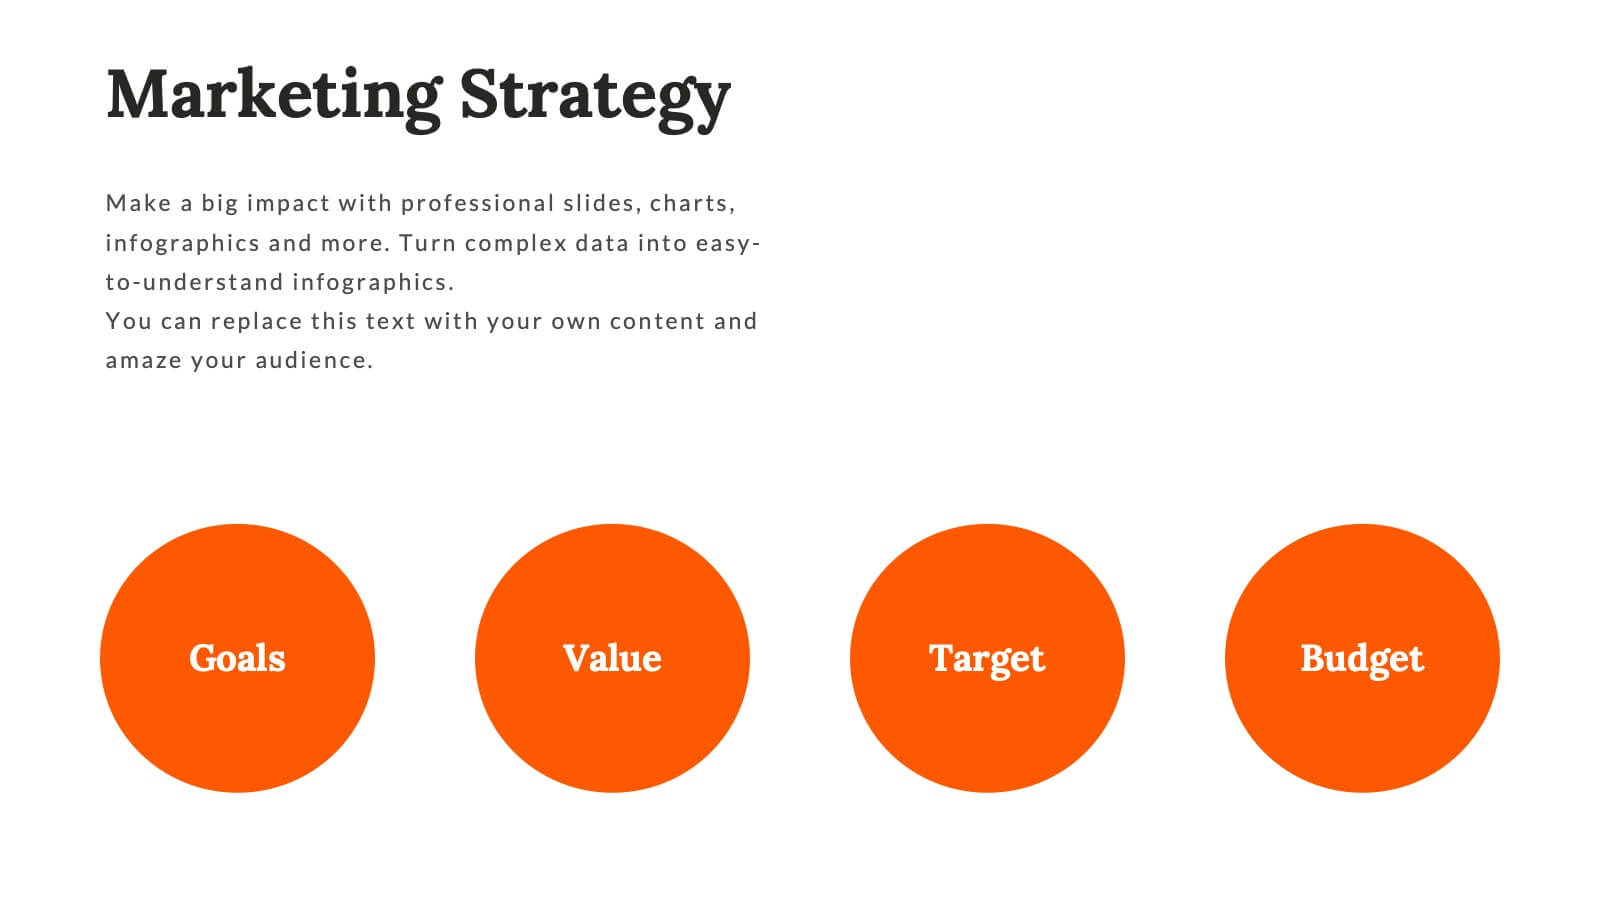
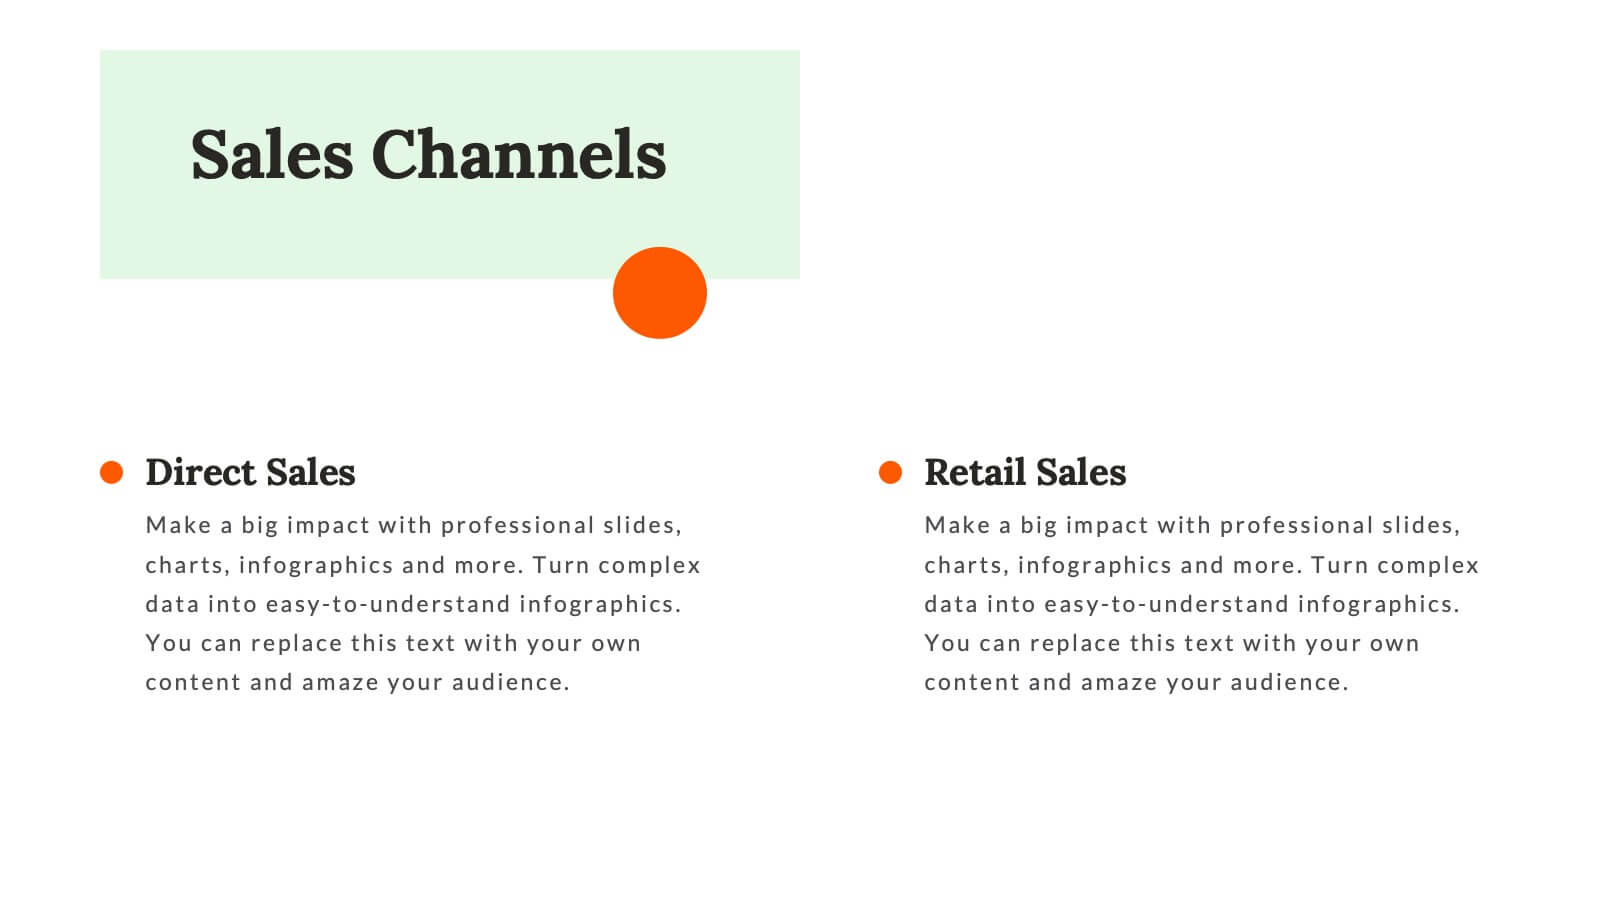
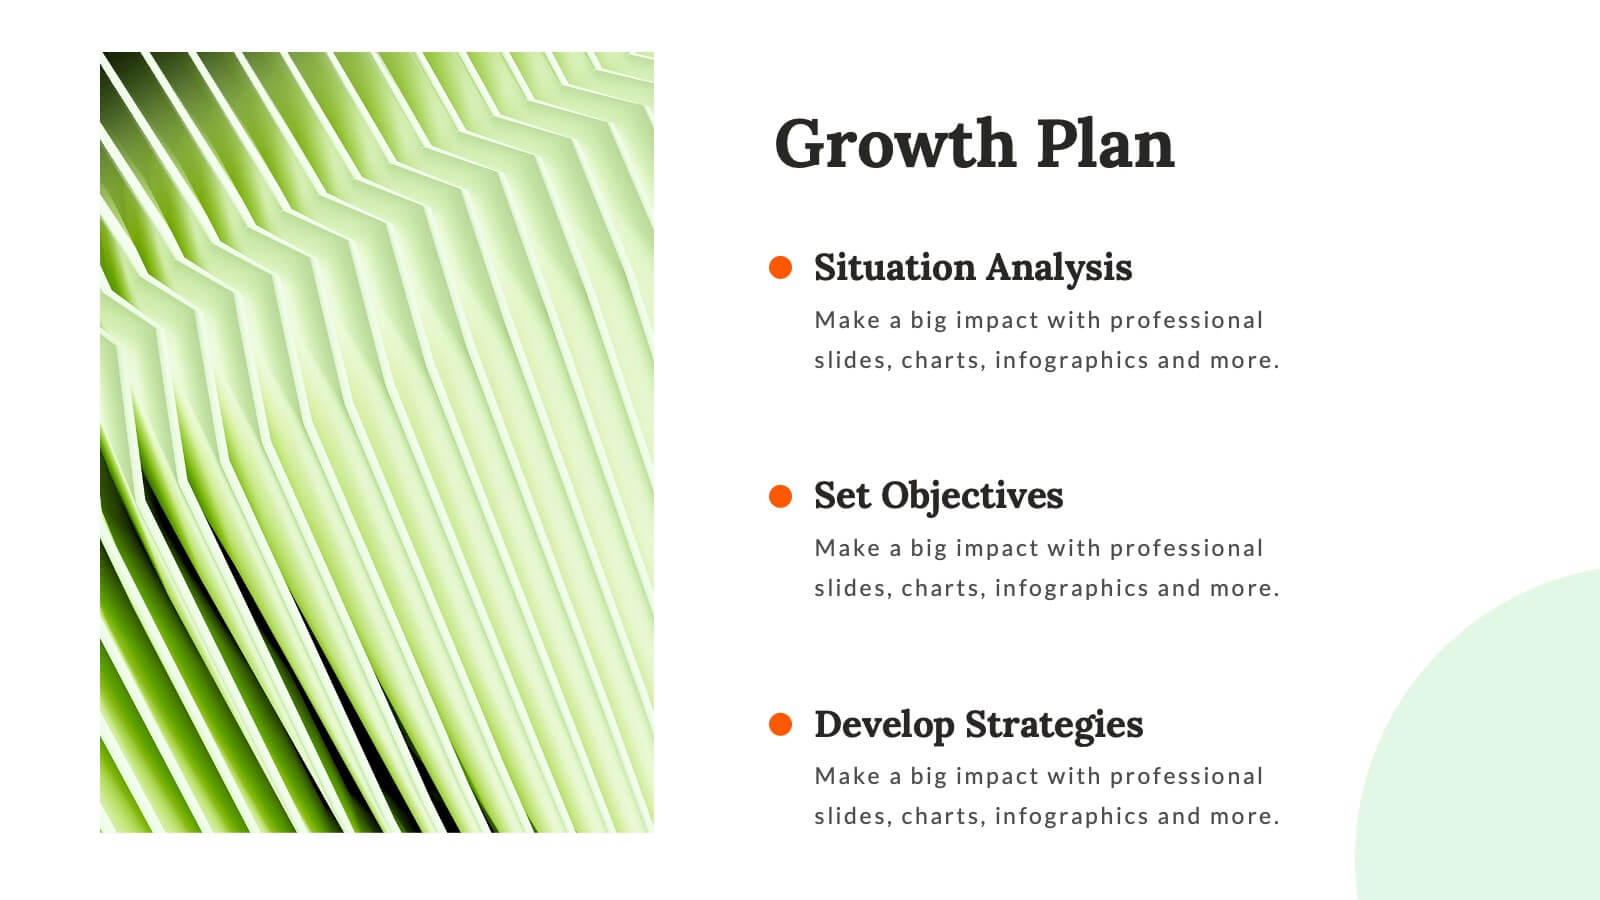
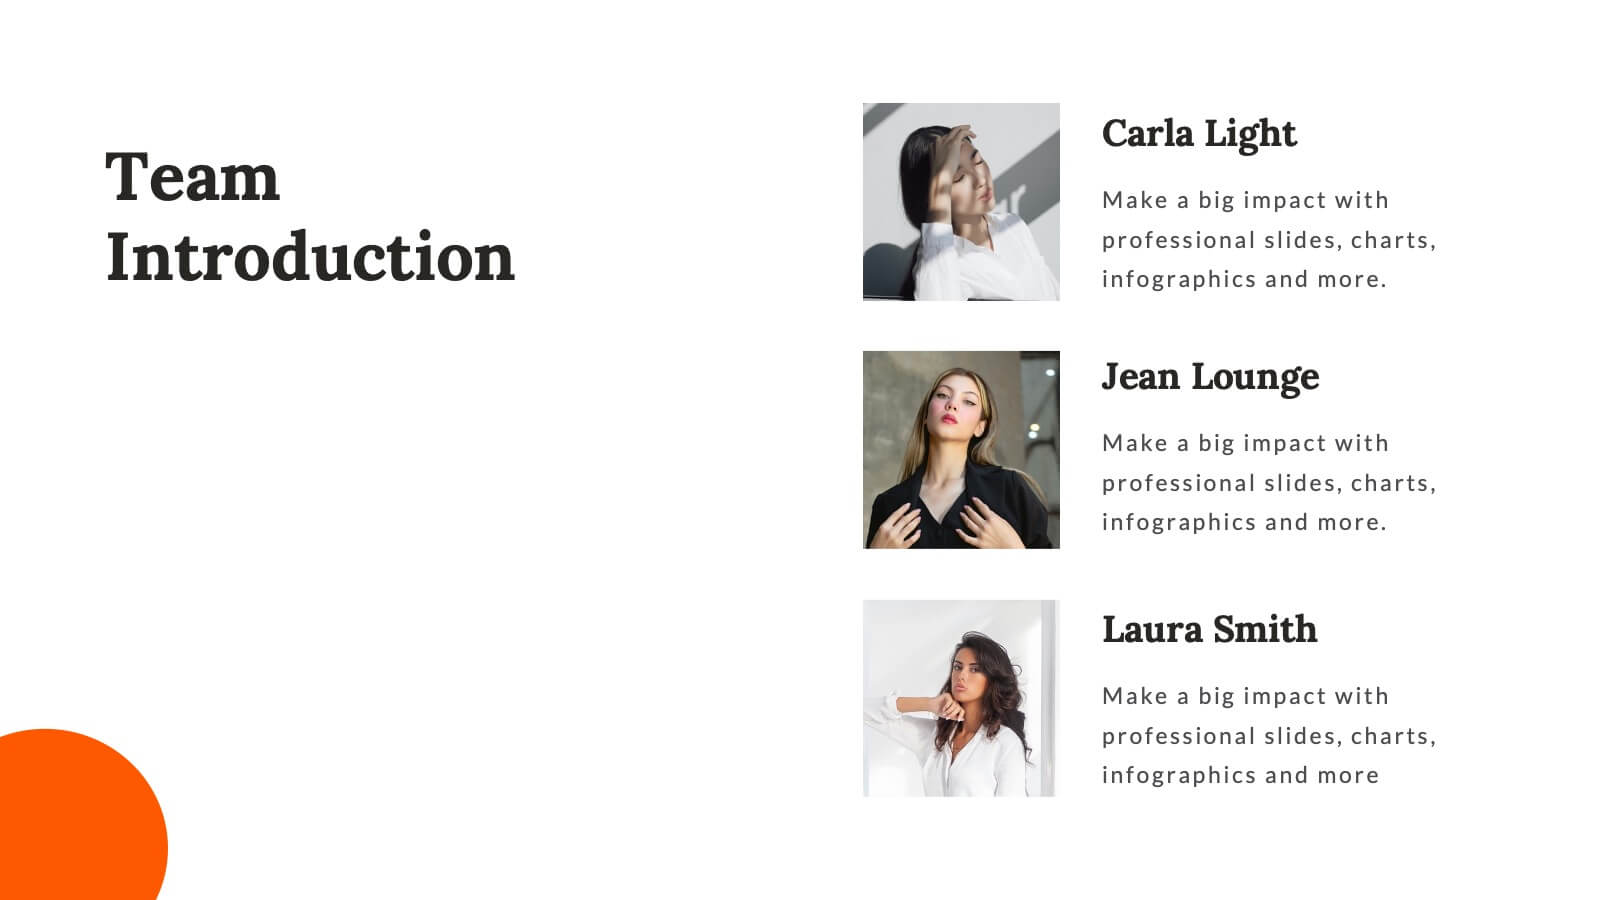
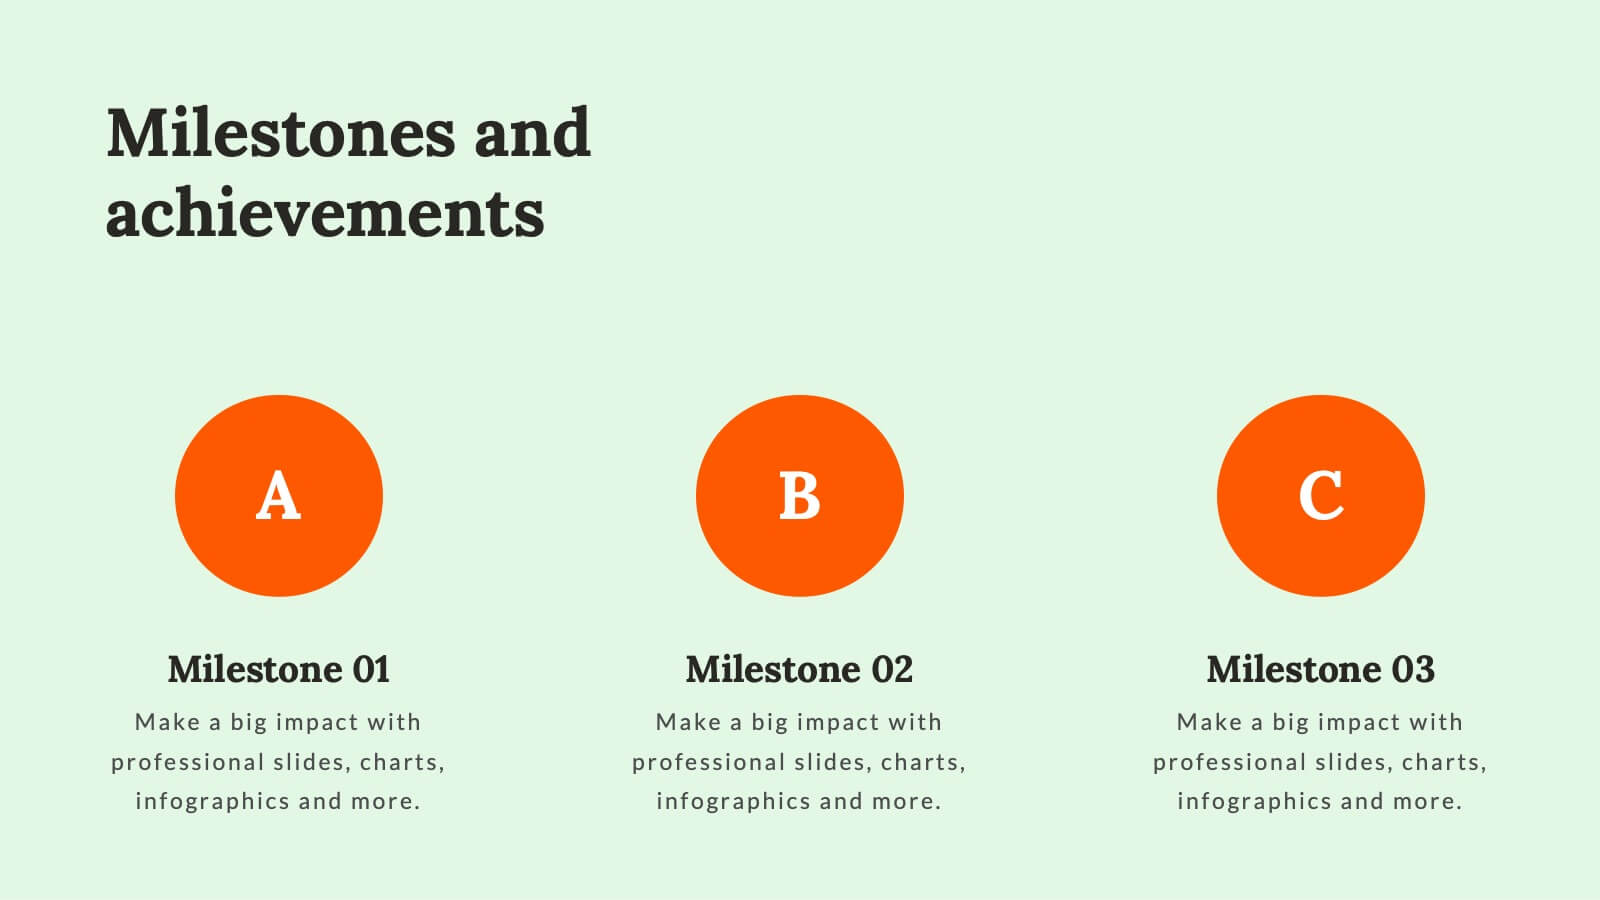
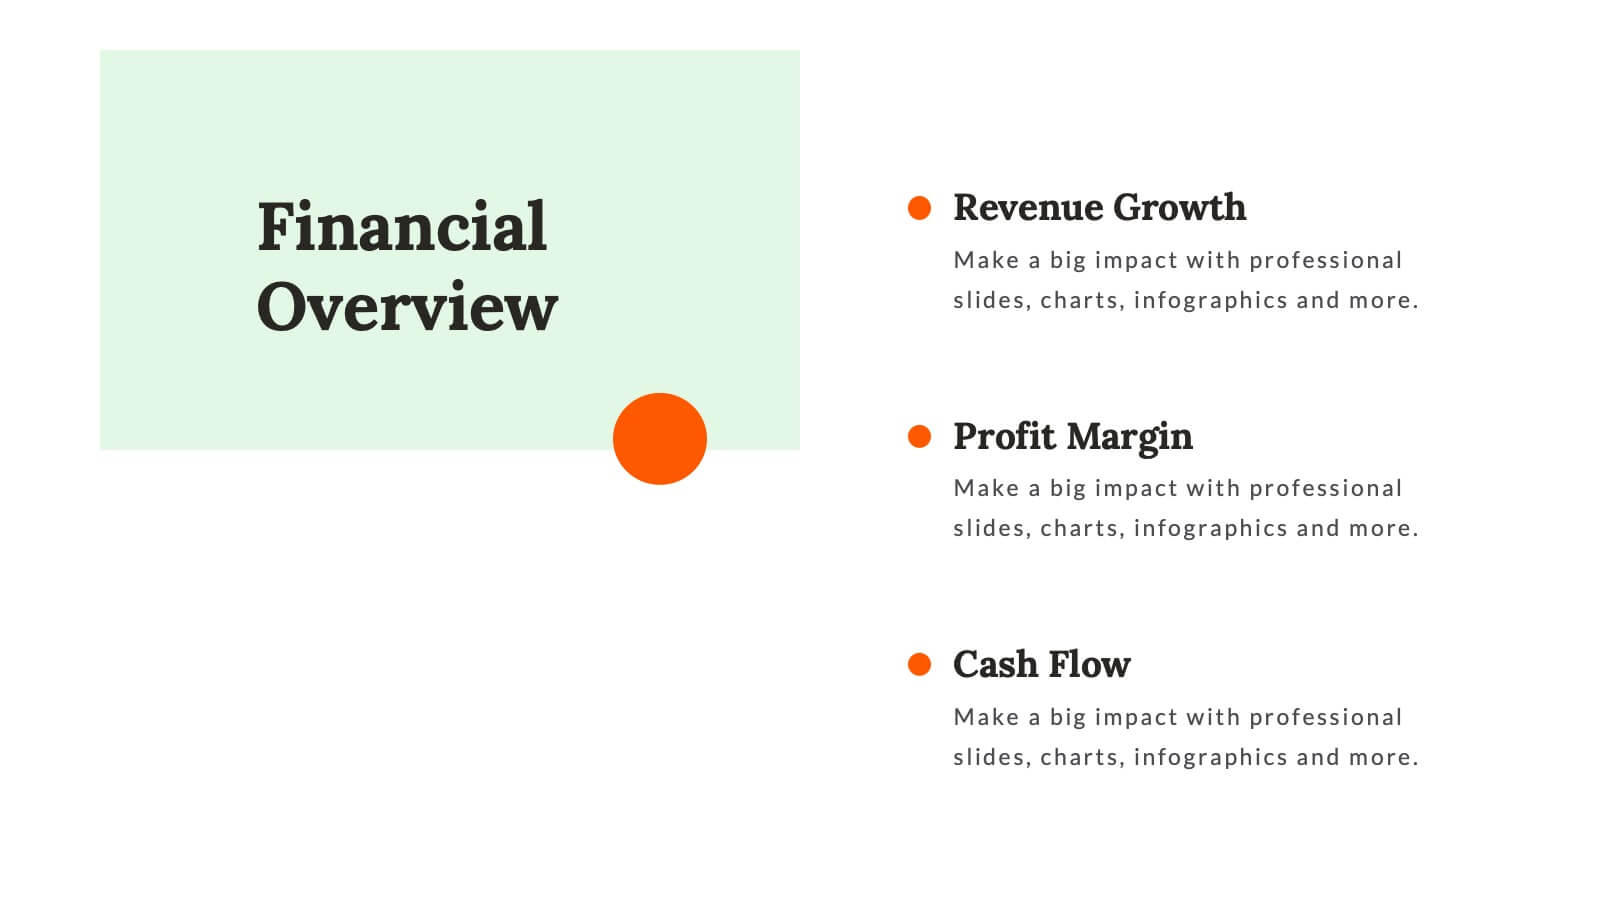
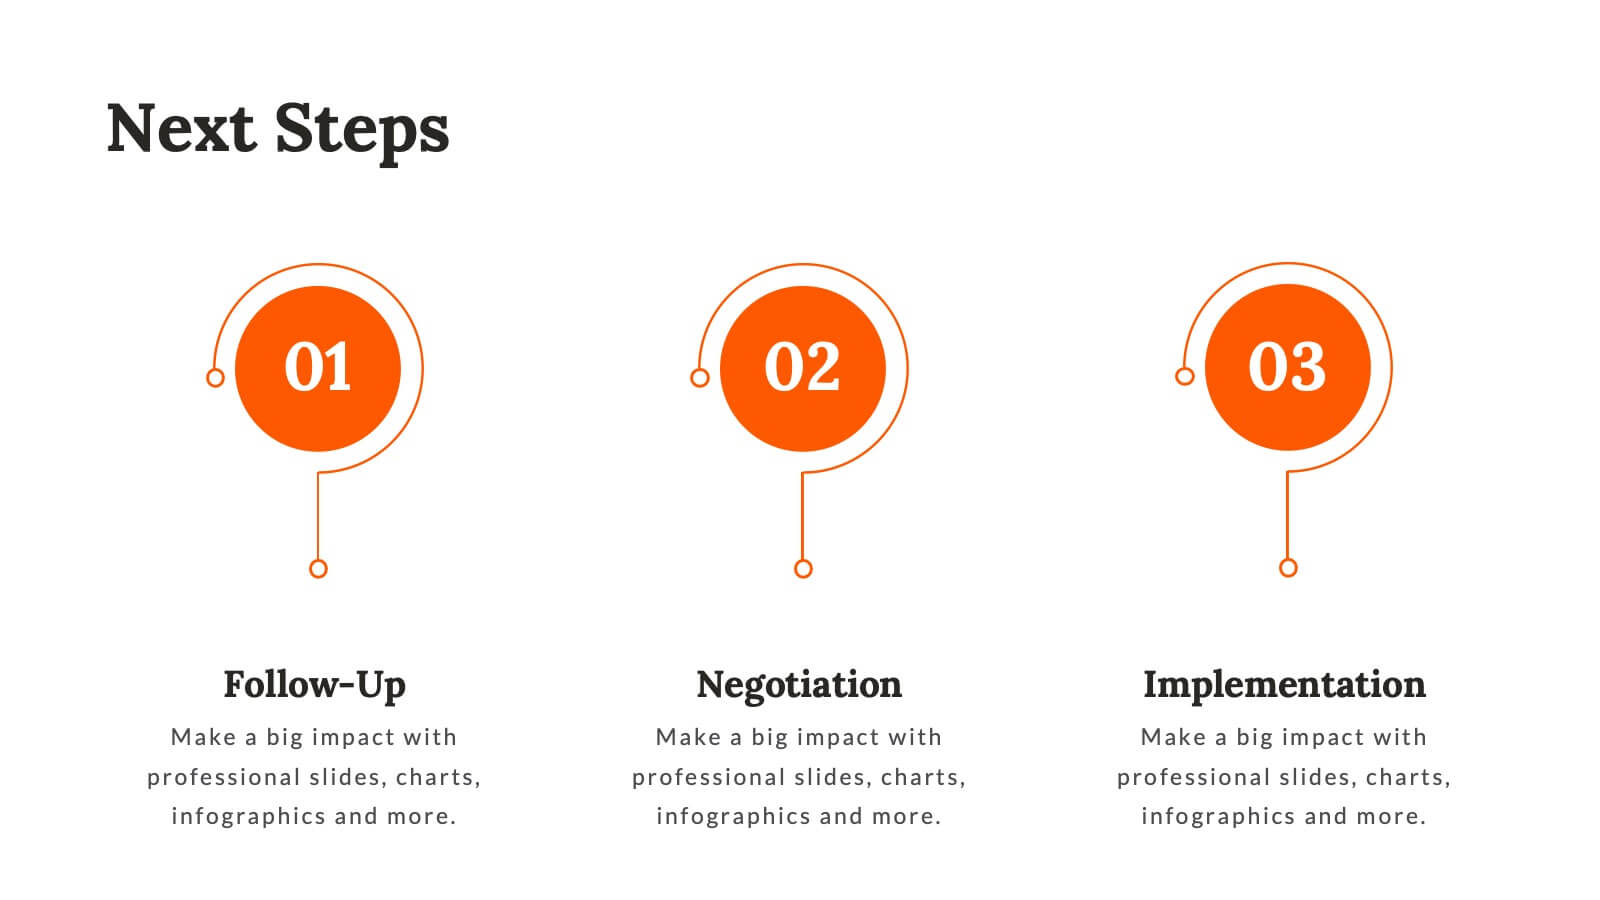
Lexicon Startup Pitch Deck Template Presentation
The Startup Pitch Deck Presentation Template provides a modern and professional design with 23 fully customizable slides, ideal for startups seeking funding or presenting their business idea. Key sections include company overview, problem statement, solution, market opportunity, business model, and unique selling proposition (USP). It also covers competitive landscape, product features, financials, milestones, and funding requirements, ensuring a comprehensive pitch. The vibrant orange and gray color scheme adds energy and creativity to the presentation. Compatible with PowerPoint, Keynote, and Google Slides, this template is perfect for impactful startup pitches.


6 diapositivas
Statistical Data Overview Presentation
Transform raw numbers into a compelling visual story with a clean and structured layout that highlights key insights effortlessly. Ideal for showcasing progress, analytics, and results, this design helps simplify complex data for clear communication. Fully editable and compatible with PowerPoint, Keynote, and Google Slides for seamless customization.


6 diapositivas
Harvey Ball Chart Business Analysis Presentation
Visualize comparisons with clarity using this Harvey Ball Chart Business Analysis slide. Perfect for showcasing performance, risk assessments, satisfaction ratings, or benchmarking, this layout includes 6 labeled items with corresponding Harvey Ball visuals. Easily customizable in PowerPoint, Keynote, or Google Slides, it’s ideal for executive reporting and strategic analysis.


7 diapositivas
Solution Infographics Presentation Template
Featuring our solution Infographic template, We have a solution for your presentation problems. Give your next presentation the edge with this template, that allows you to present the perfect solutions to your audience. All the content is completely customizable and the built-in icons can be replaced with your own text and illustrations. Choose from the various themes available, and make it fit your needs. This template contains all the elements needed to make your infographic presentation pop! graphs, photos and a minimal style makes this design perfect for any kind of project.


10 diapositivas
Remote Work Best Practices Presentation
Streamline your team's productivity with this Remote Work Best Practices presentation. Ideal for hybrid or fully remote businesses, this layout features five key steps illustrated in a connected visual path, helping communicate structure and flow. With a clean, modern design and editable sections, it's perfect for onboarding, policy training, or workflow optimization. Compatible with PowerPoint, Keynote, and Google Slides for easy customization.