


Características


¿Tienes alguna pregunta?
Recomendar


6 diapositivas
AIDA Communication Model Infographics
Embark on a journey through the AIDA Communication Model, a fundamental concept in marketing and advertising! This infographic serves as your guide to understanding how this powerful model can elevate your communication strategy. From capturing Attention and holding Interest to sparking Desire and driving Action, we unveil the secrets that make the AIDA model an indispensable tool. Delve into the art of holding the audience's interest. Discover methods to maintain engagement and curiosity as you convey your message. Learn how to keep your audience captivated and eager to learn more. With this engaging infographic, compatible with PowerPoint, Keynote, and Google Slides, sharing your understanding of the AIDA Communication Model becomes effortless. Empower yourself with the knowledge to enhance your marketing and advertising efforts. Dive into the world of AIDA and embark on a journey of effective communication and persuasion.


7 diapositivas
Credit Card Infographic Presentation Template
A Credit card Infographic is a stacked chart showing data visualization of credit card types and associated information, including the number of cards owned by different age groups and gender, as well as overall debt. This infographic allows you to cover the ins and outs of credit cards, from rewards to fees and interest rates. This template will help you understand how credit cards work, while comparing cards based on price and other important factors. This Infographic is the perfect way to visualize data, trends and facts in an engaging way that grabs attention and keeps people reading.


4 diapositivas
Root Cause Analysis for Problem Solving
Tackle problems from the inside out with this structured and easy-to-follow layout. This root cause analysis template helps you clearly map out underlying issues and visualize their impact in one slide. Ideal for team discussions, audits, and presentations—fully editable in PowerPoint, Keynote, and Google Slides for maximum flexibility.


2 diapositivas
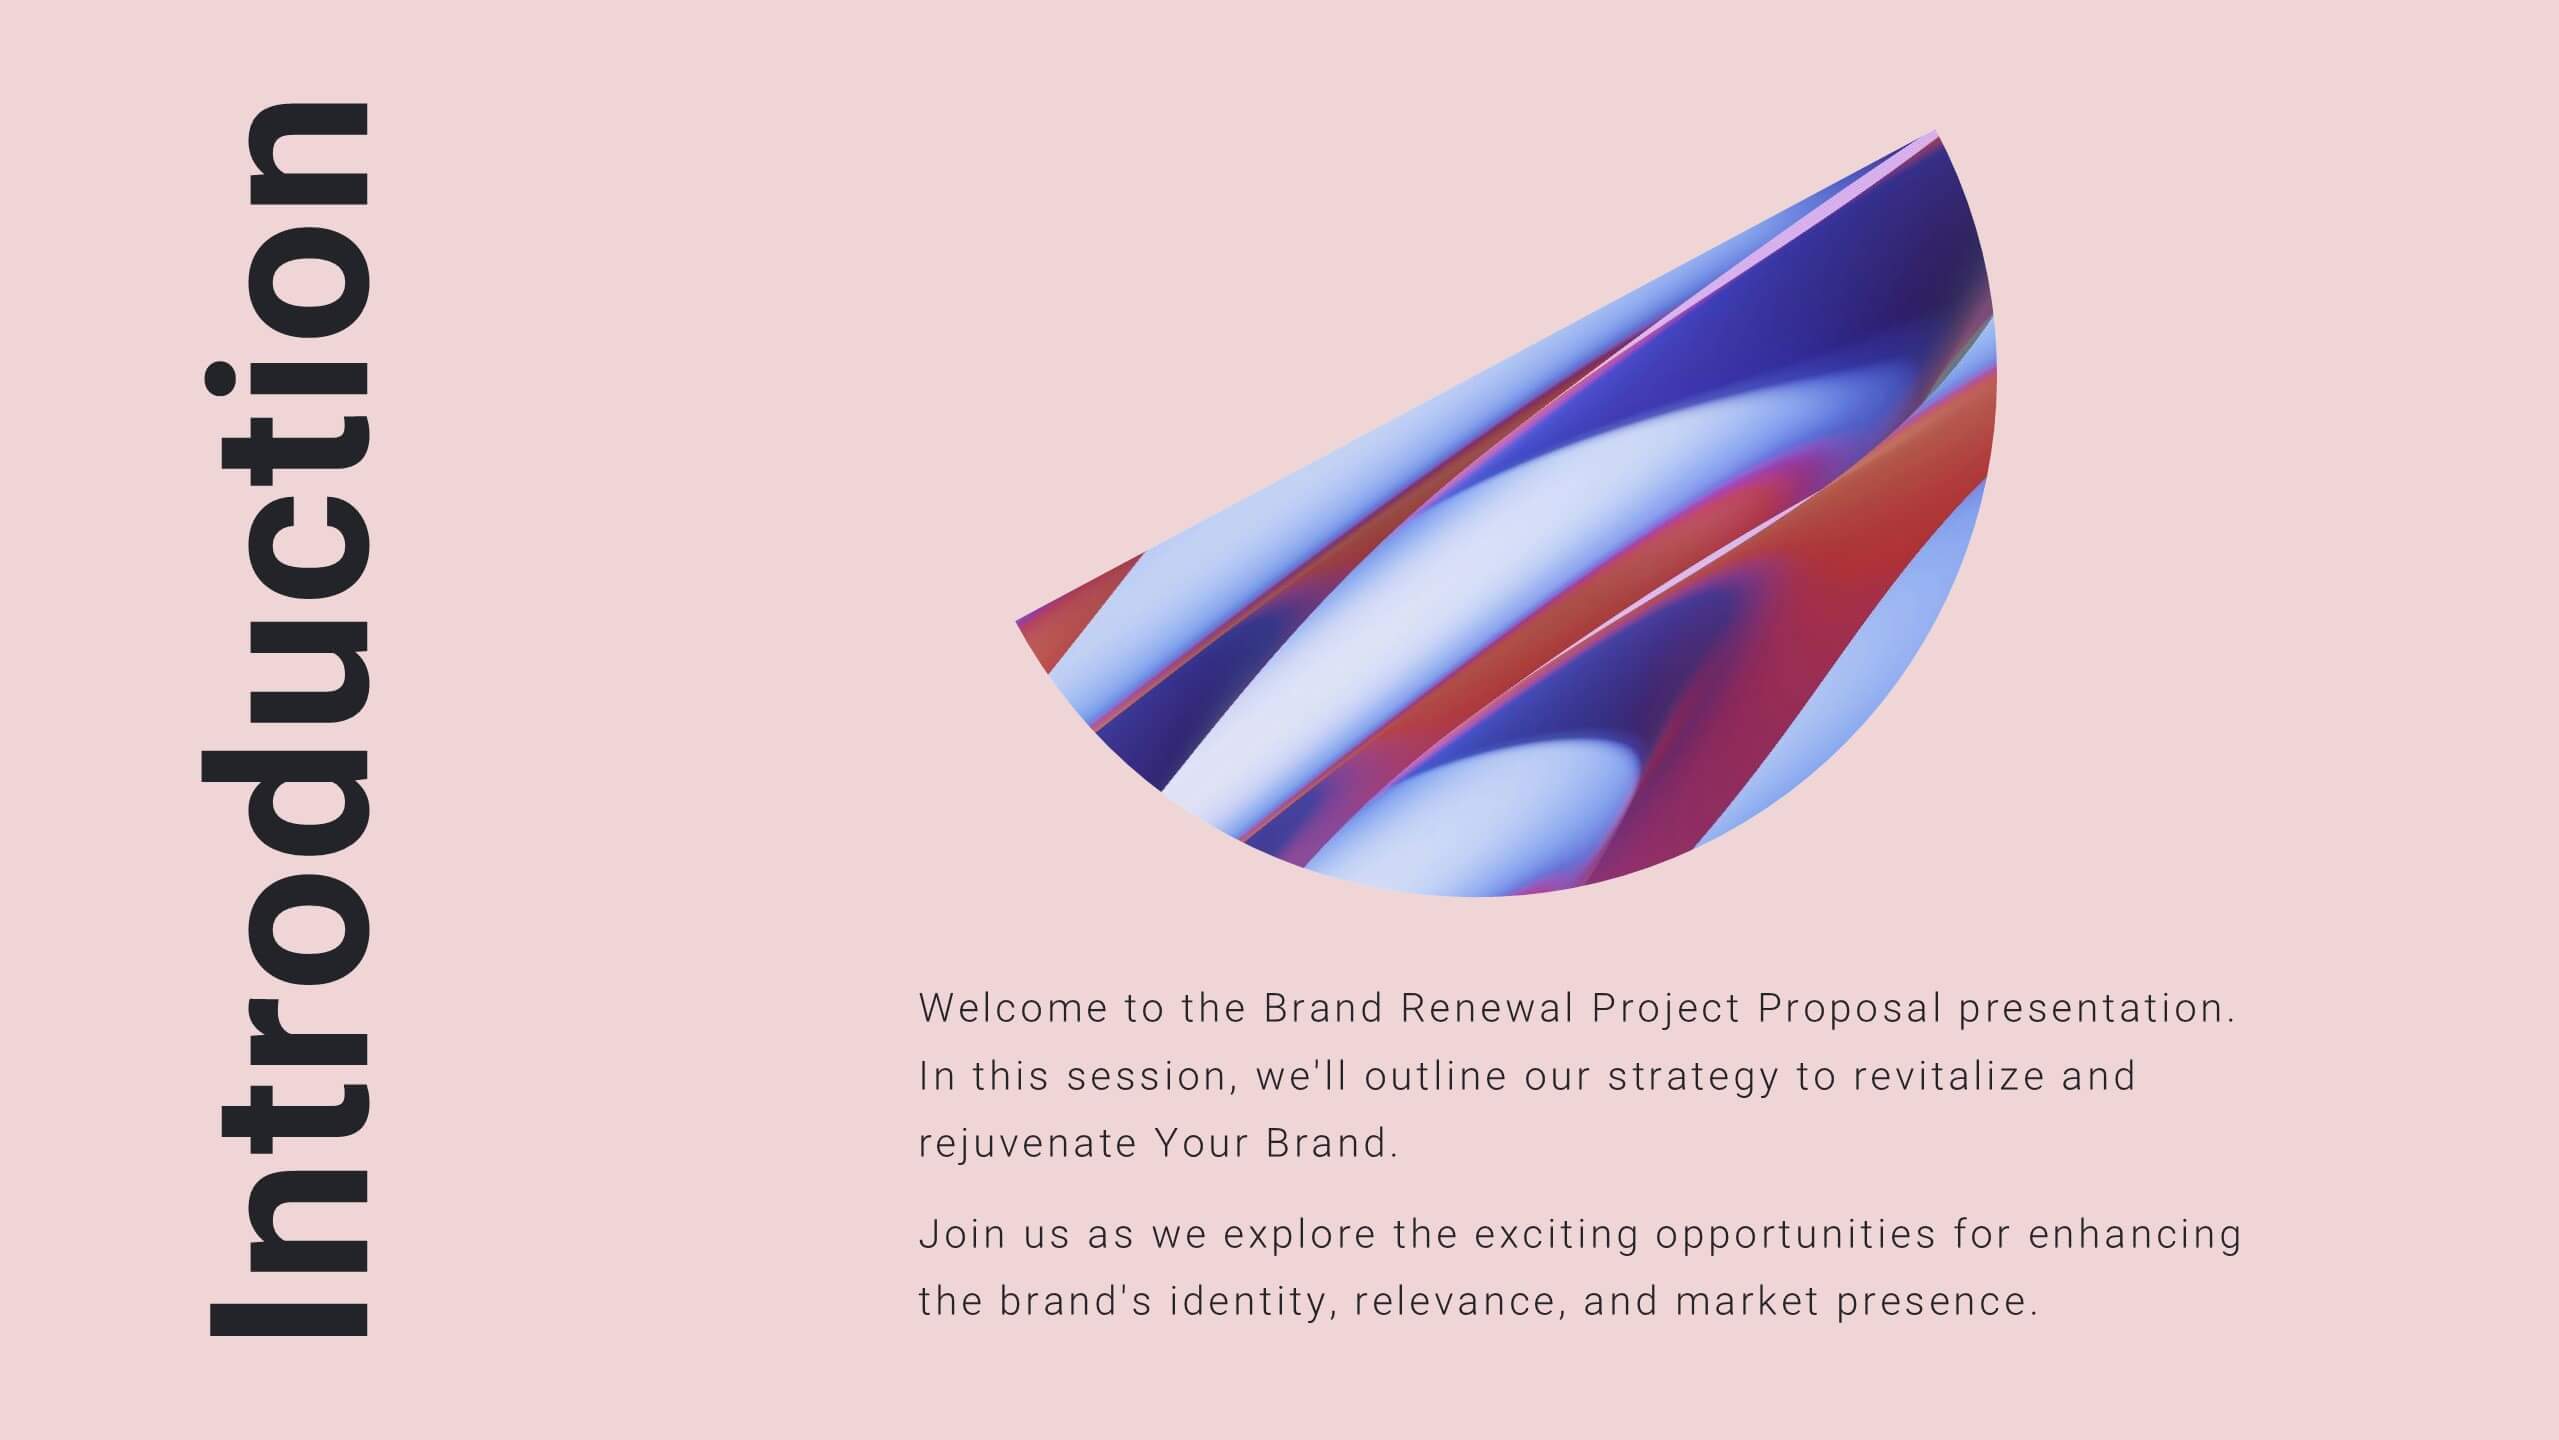
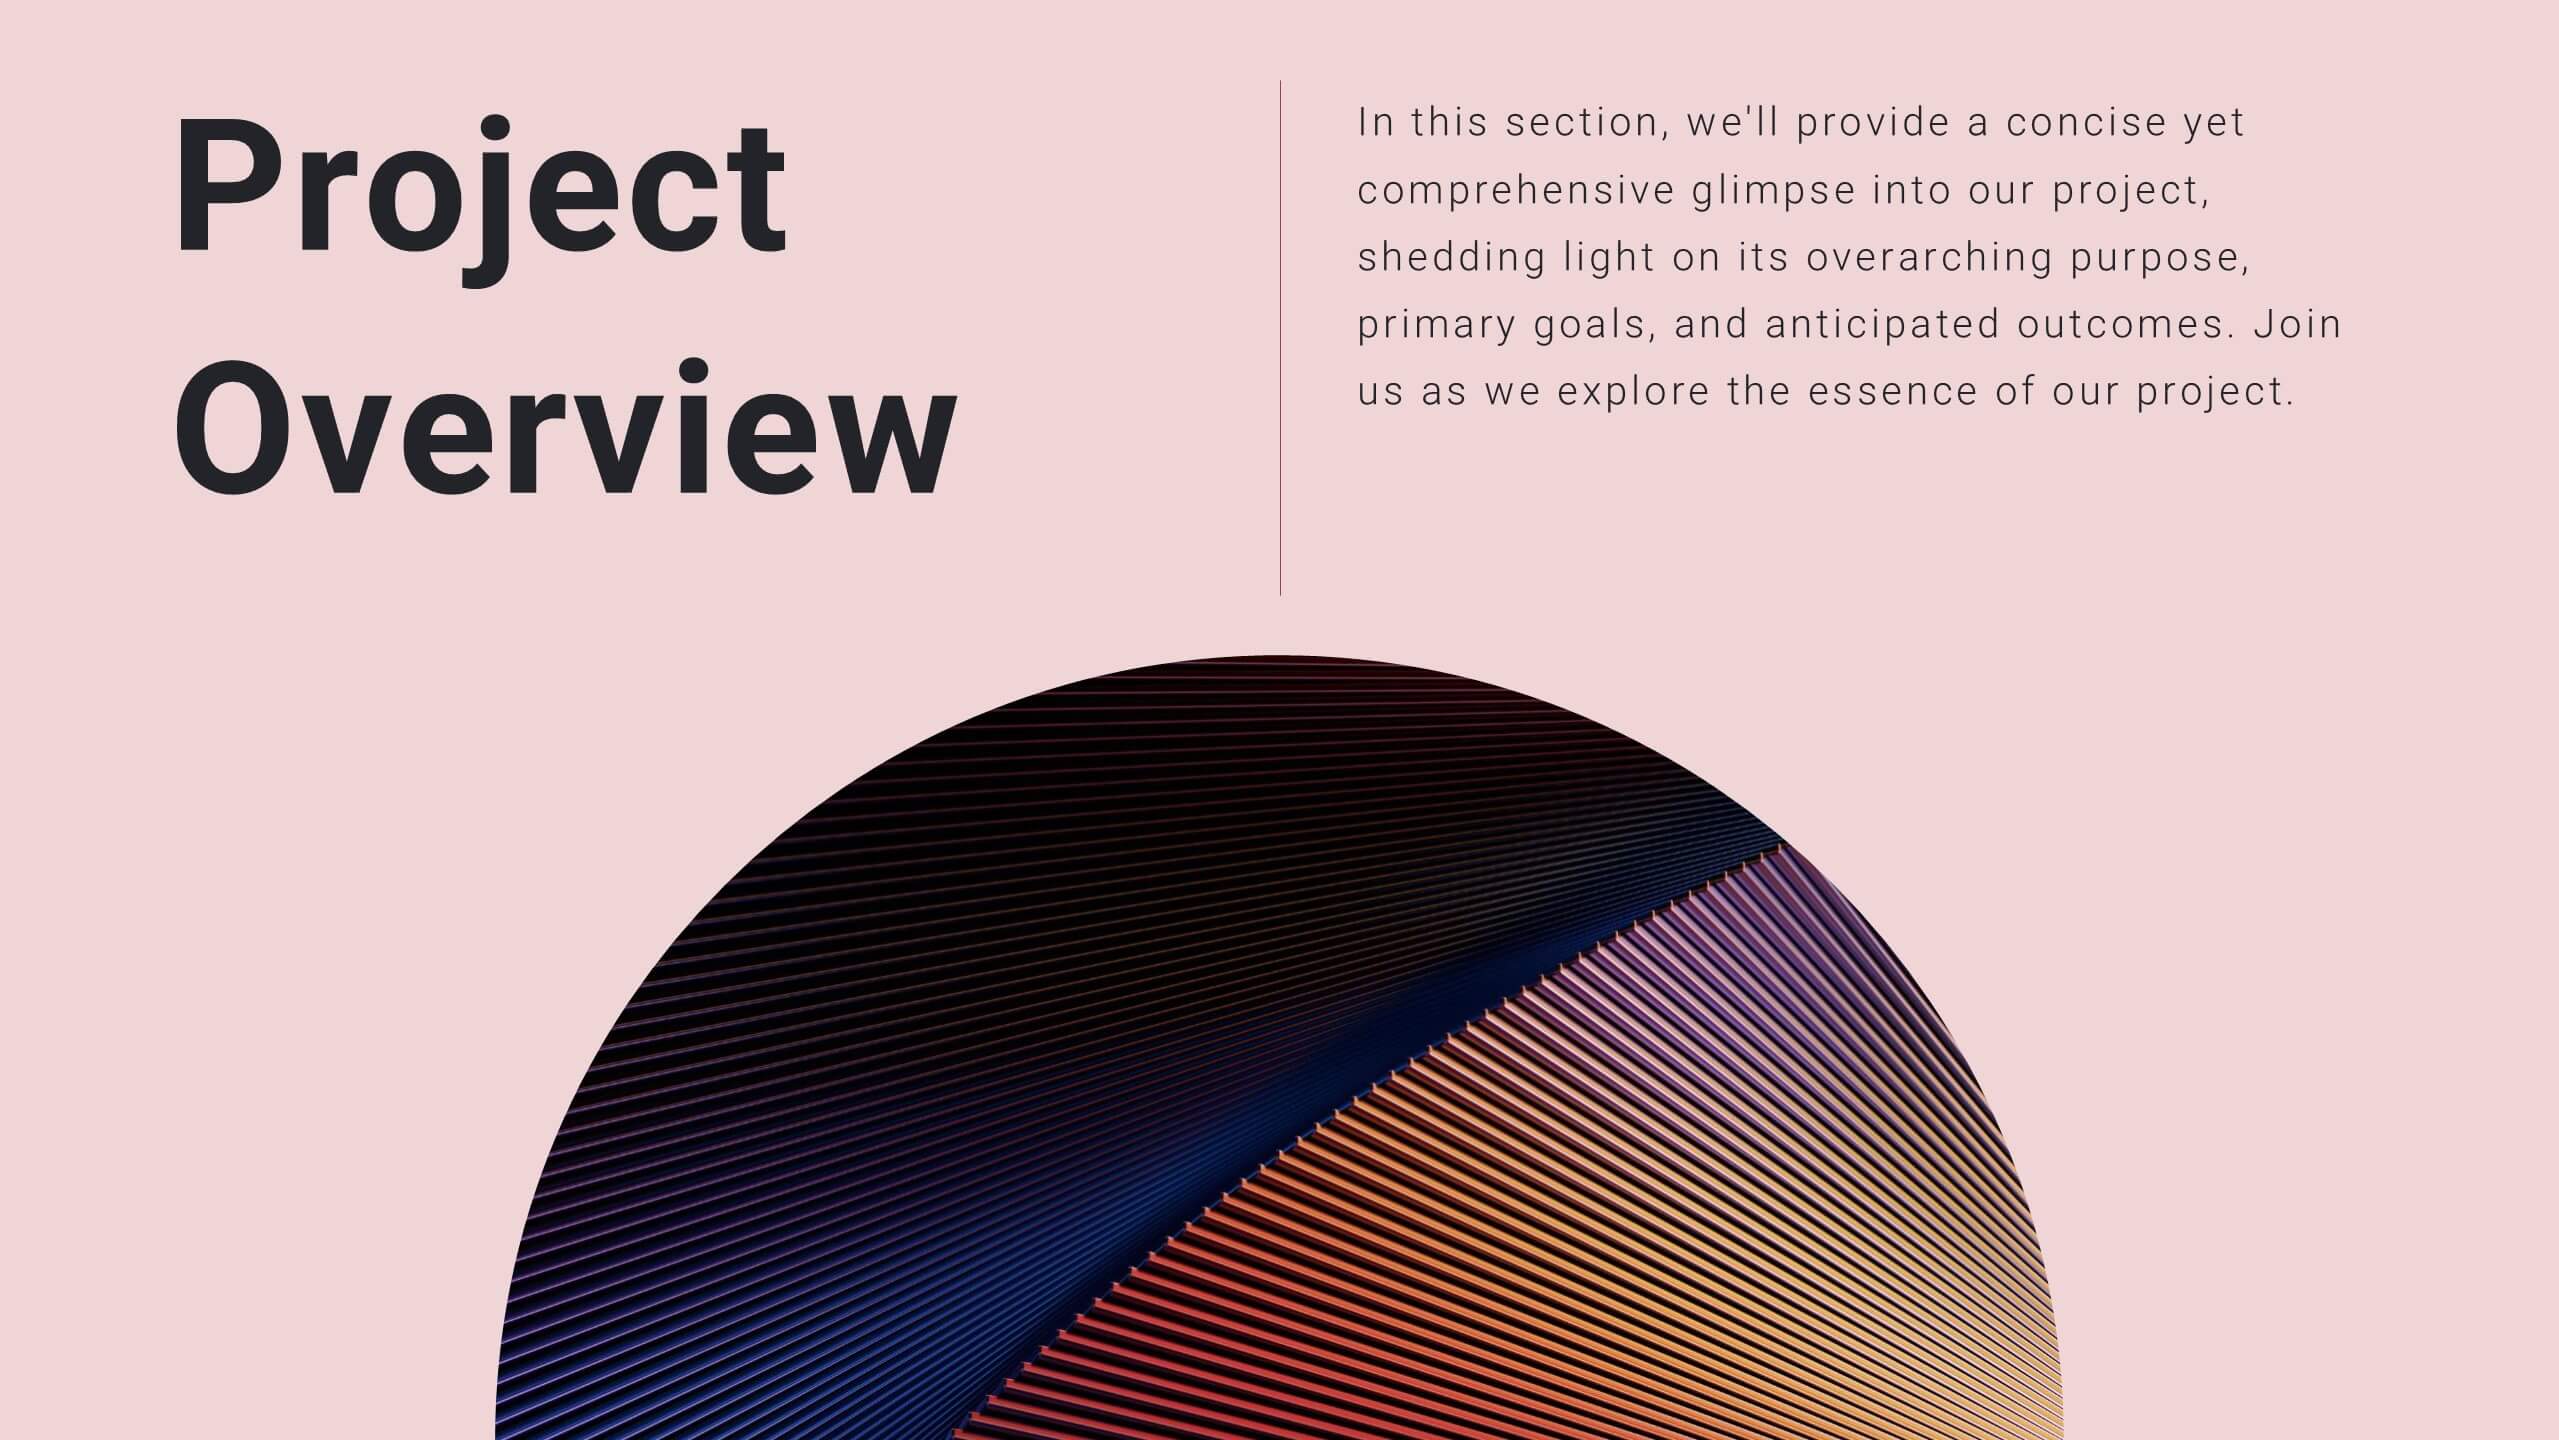
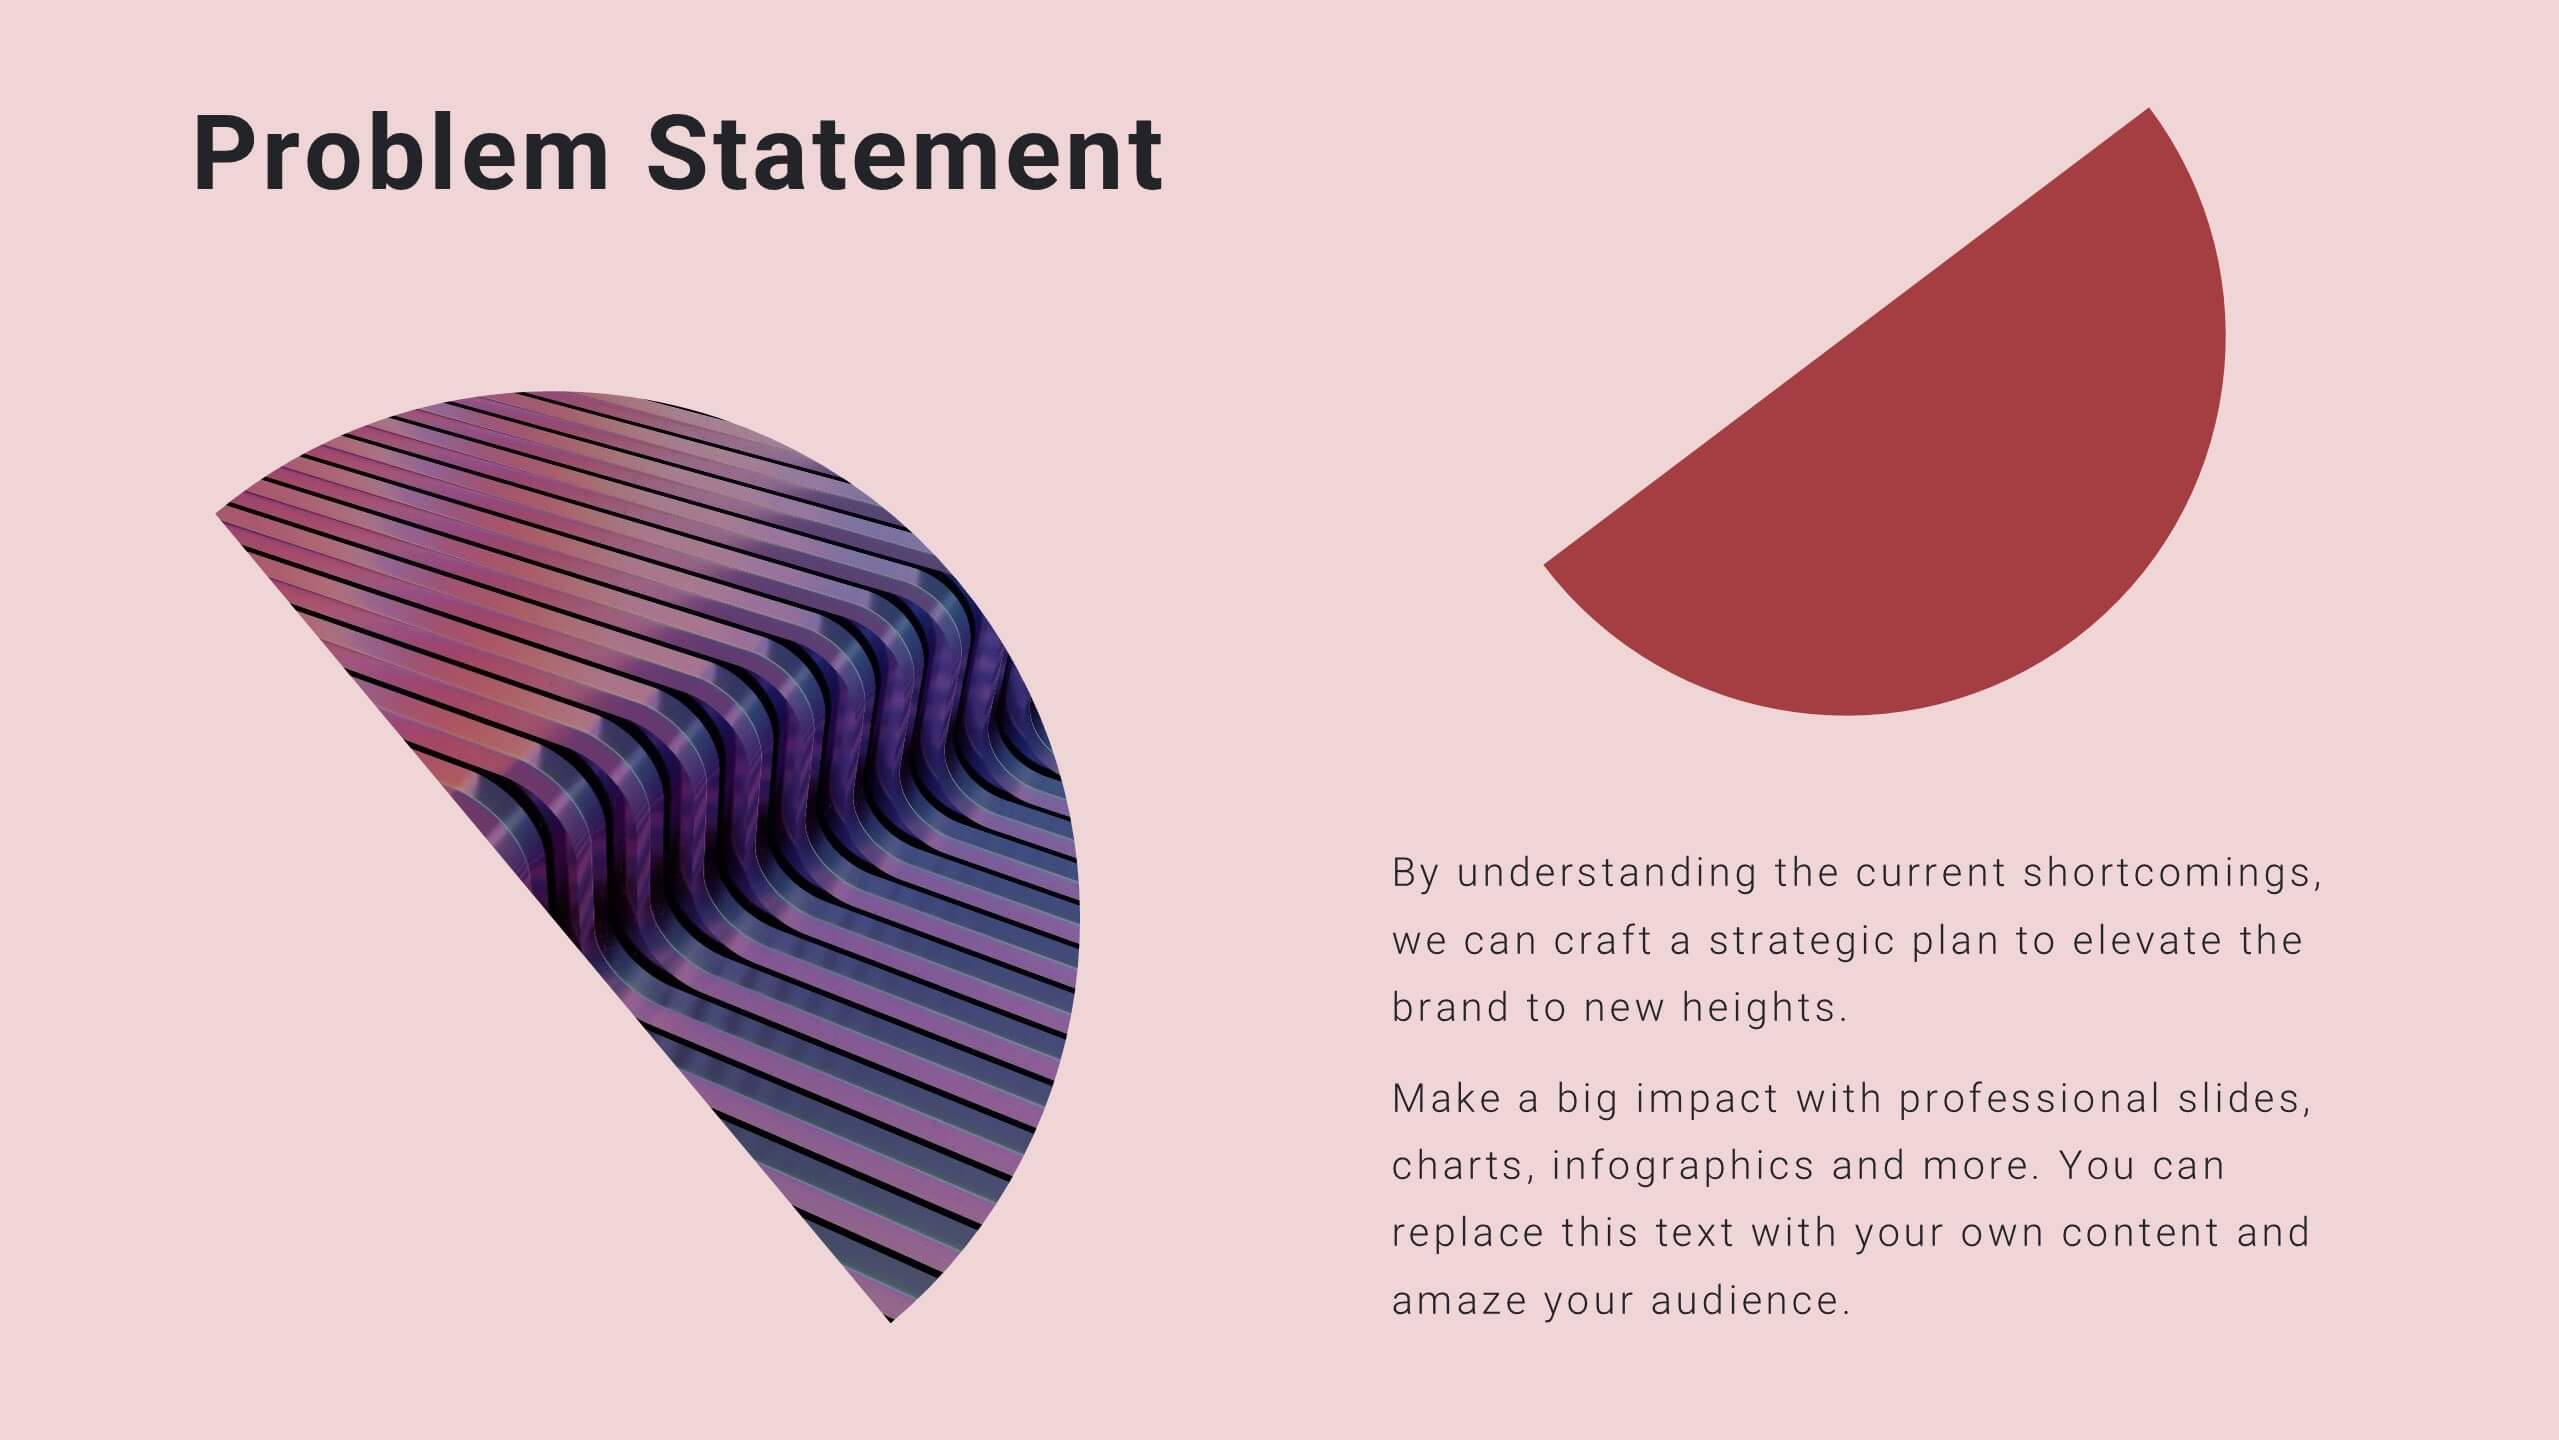
Creative Presentation Opening Title Slides
Step into a world of innovation with the "Creative Presentation" title slides, where vibrant geometric shapes meet clean, modern design. Perfect for showcasing your ideas and transforming them into impactful solutions, these slides set the stage for inspiration. Compatible with PowerPoint, Keynote, and Google Slides, they're ideal for anyone looking to make a memorable impression.


21 diapositivas
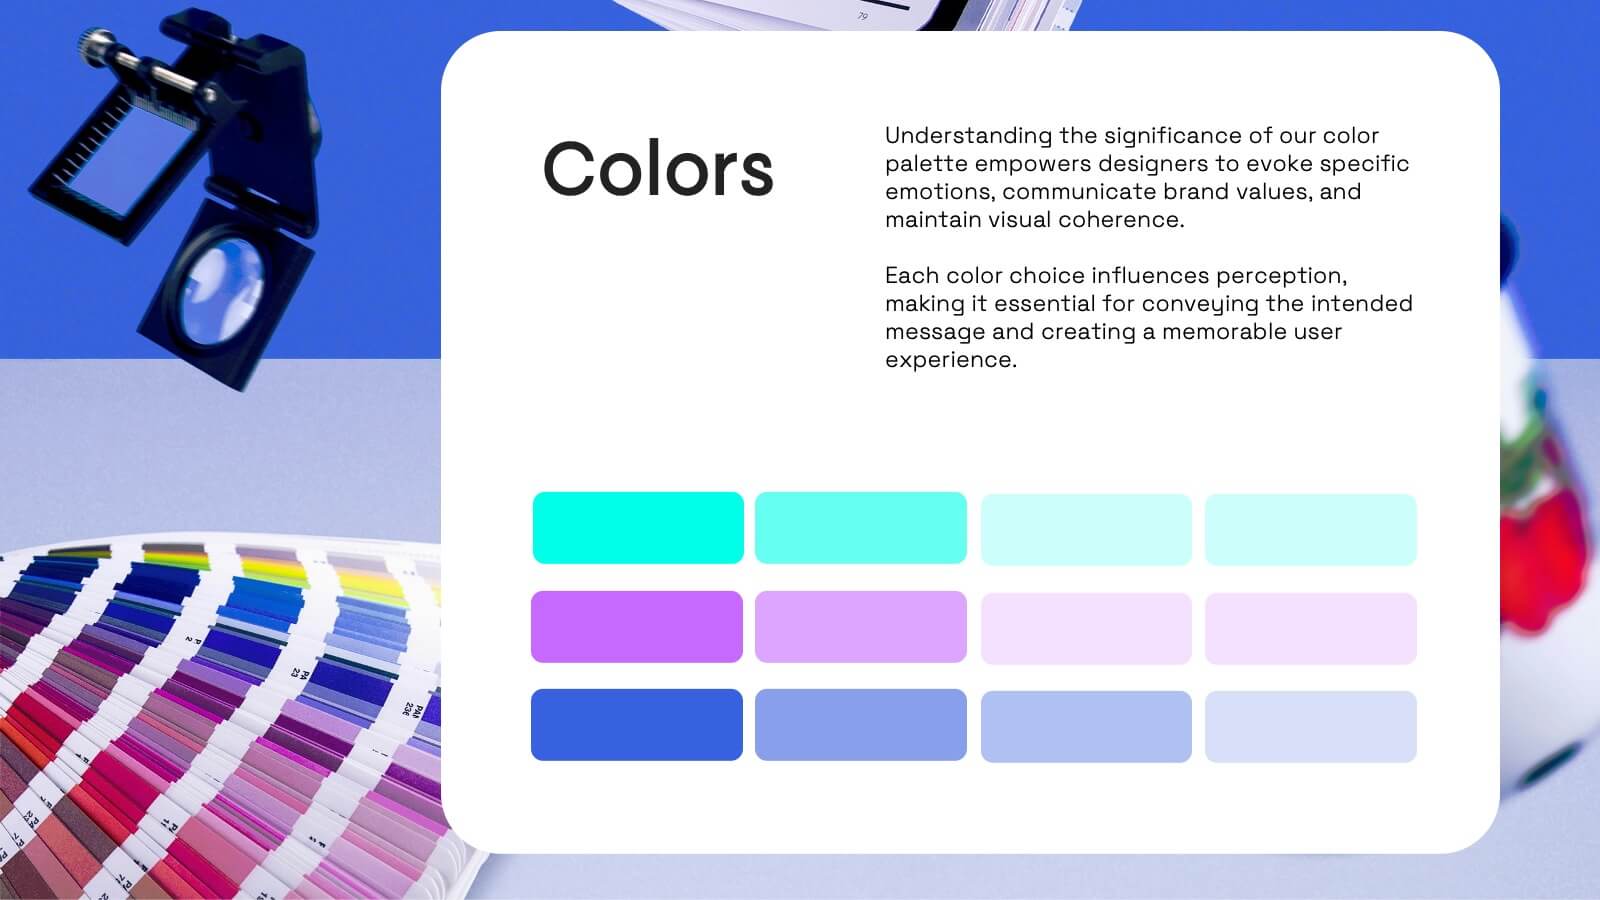
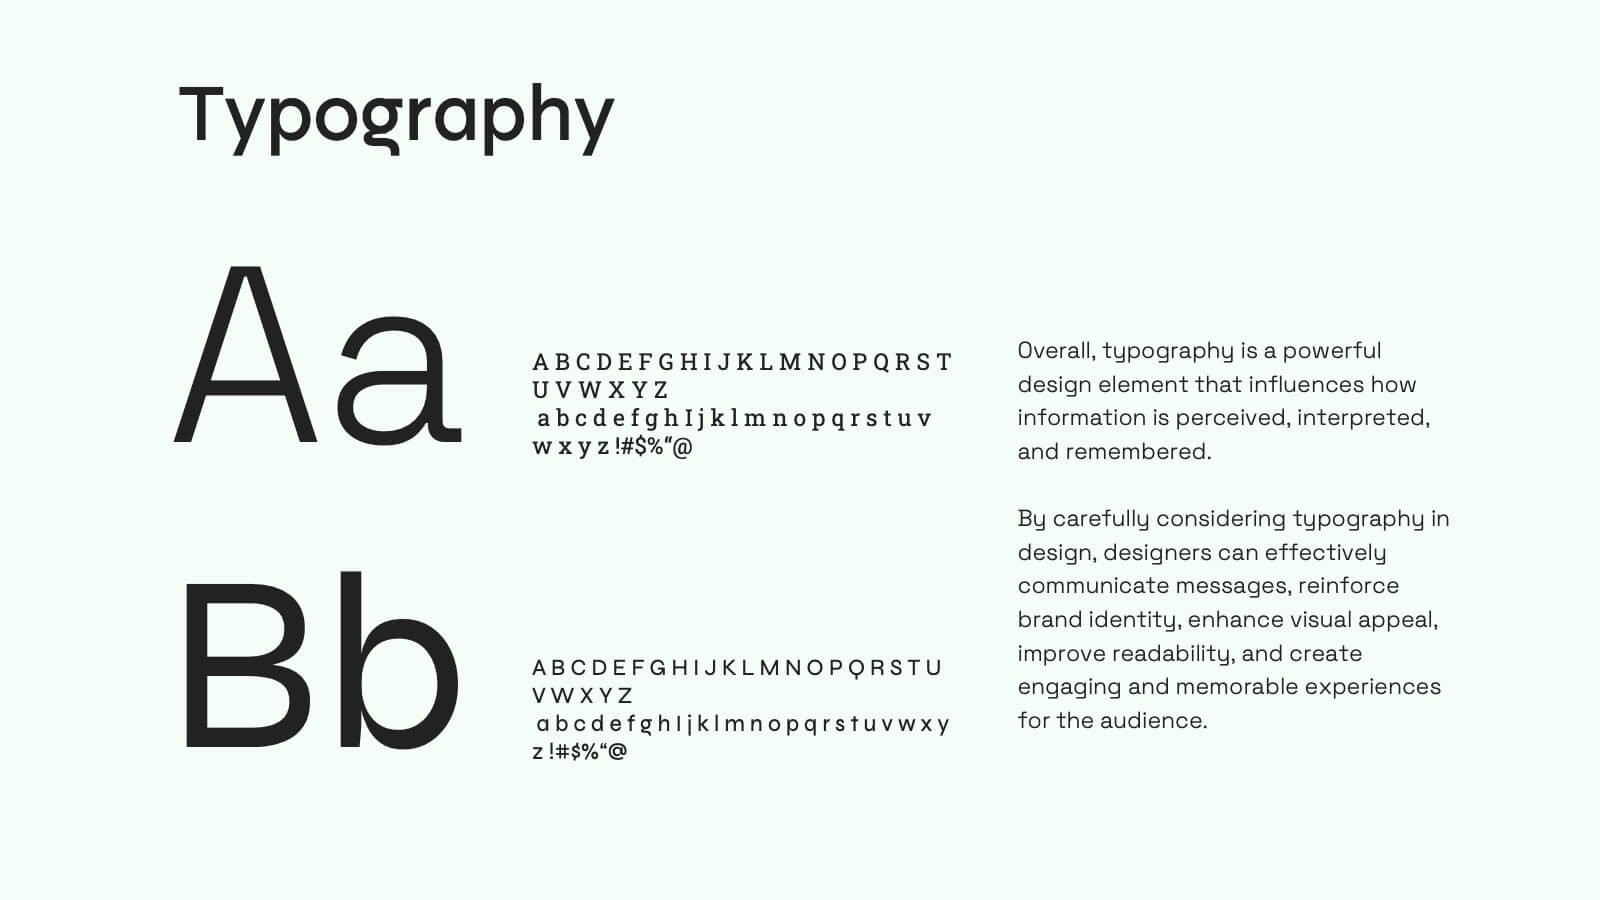
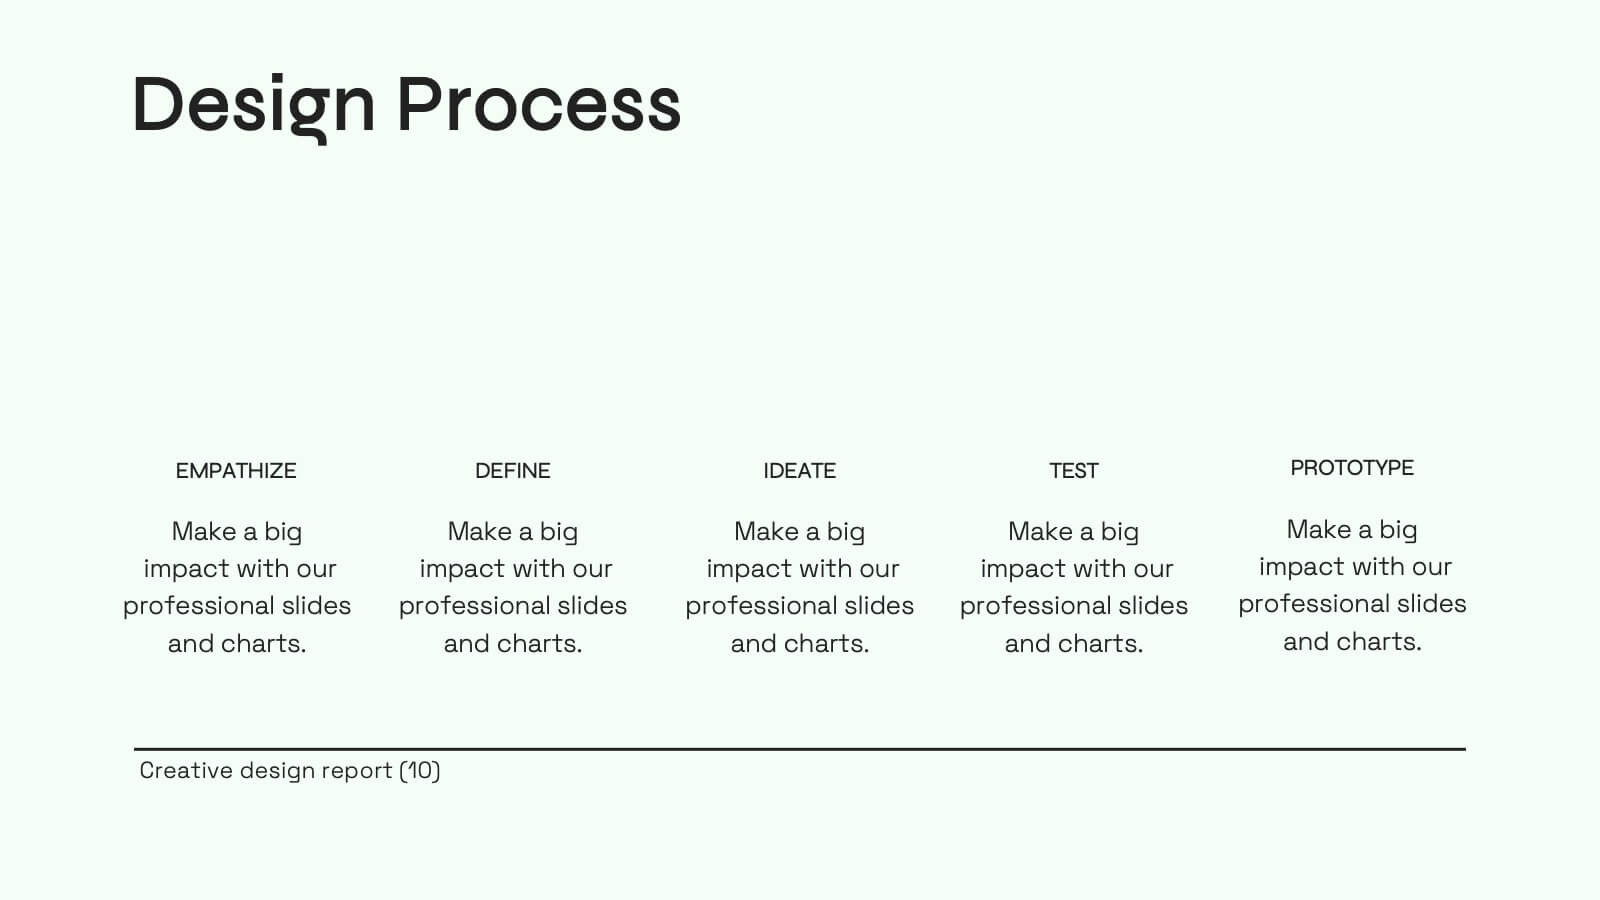
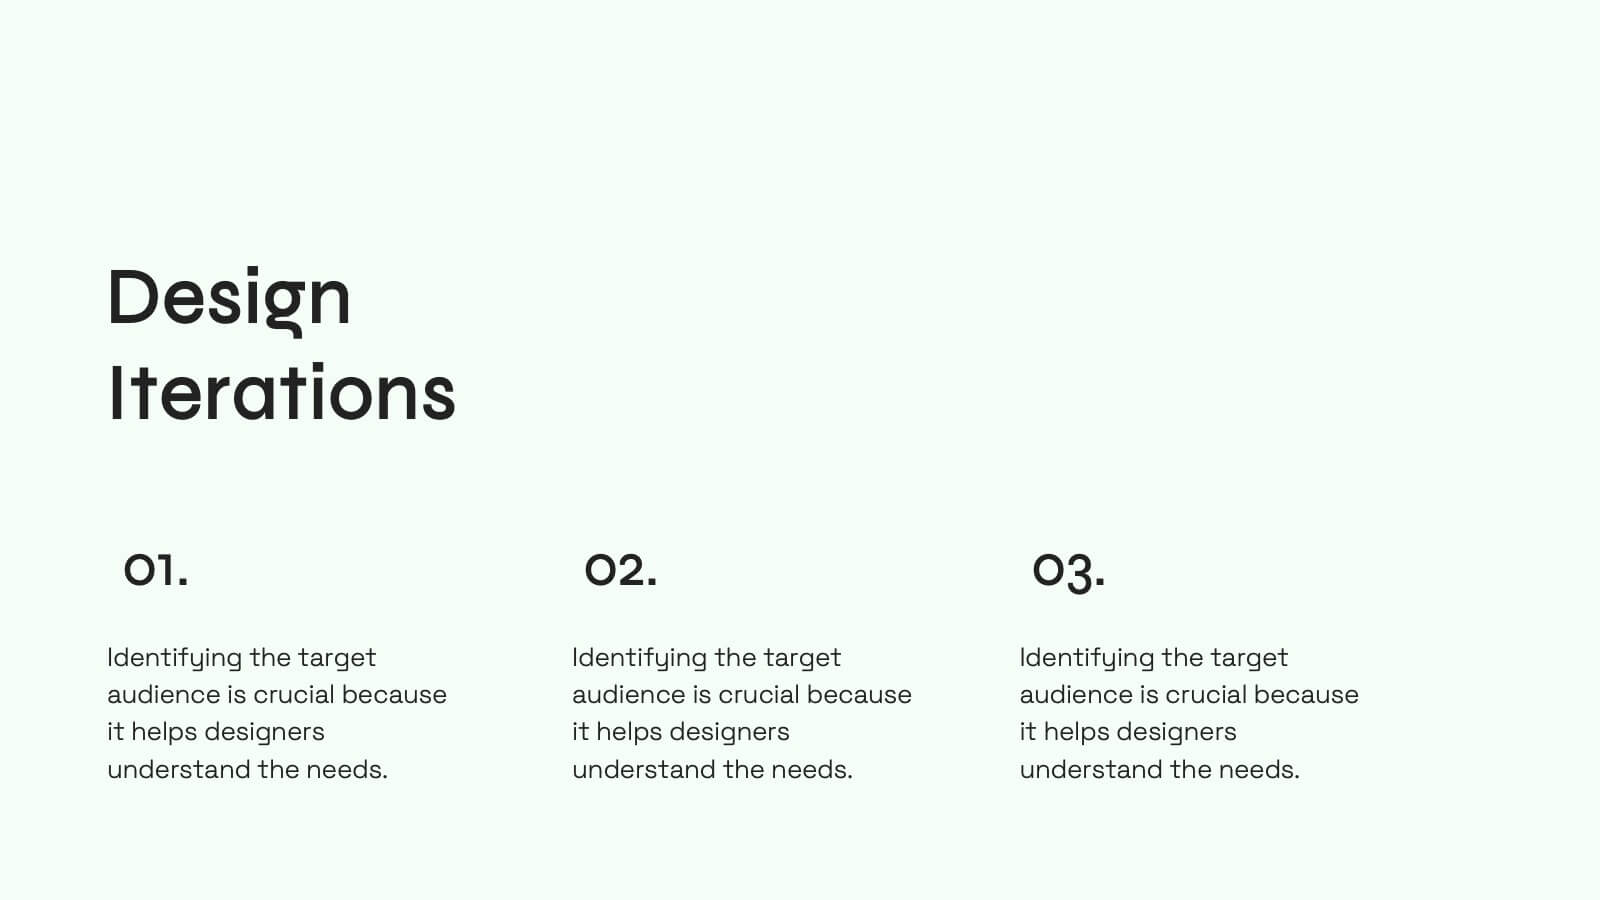
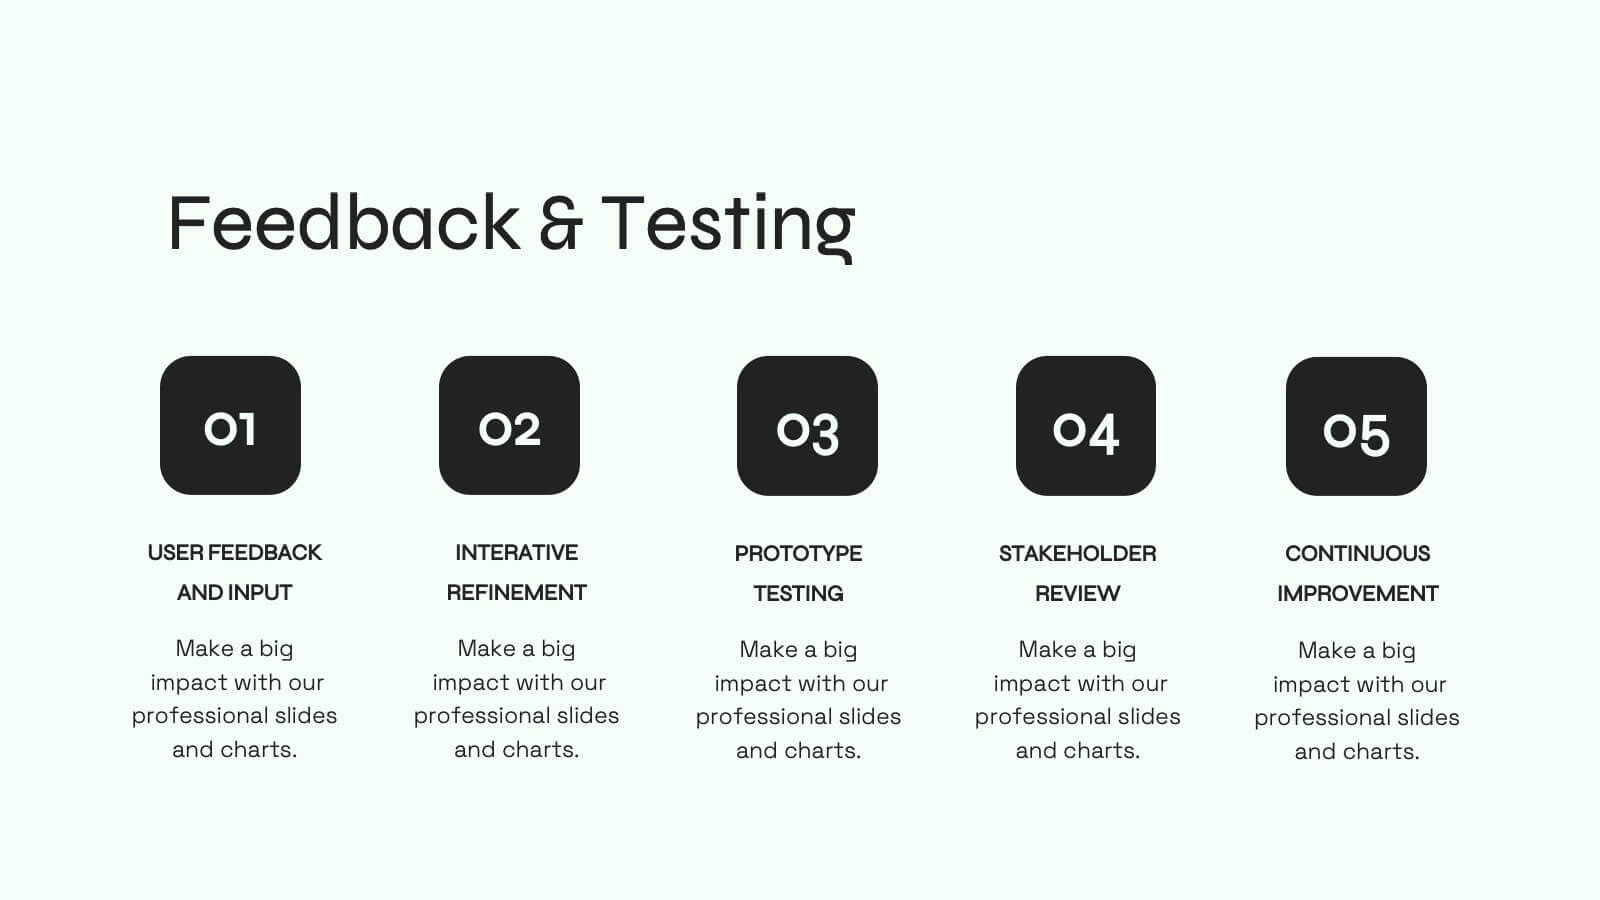
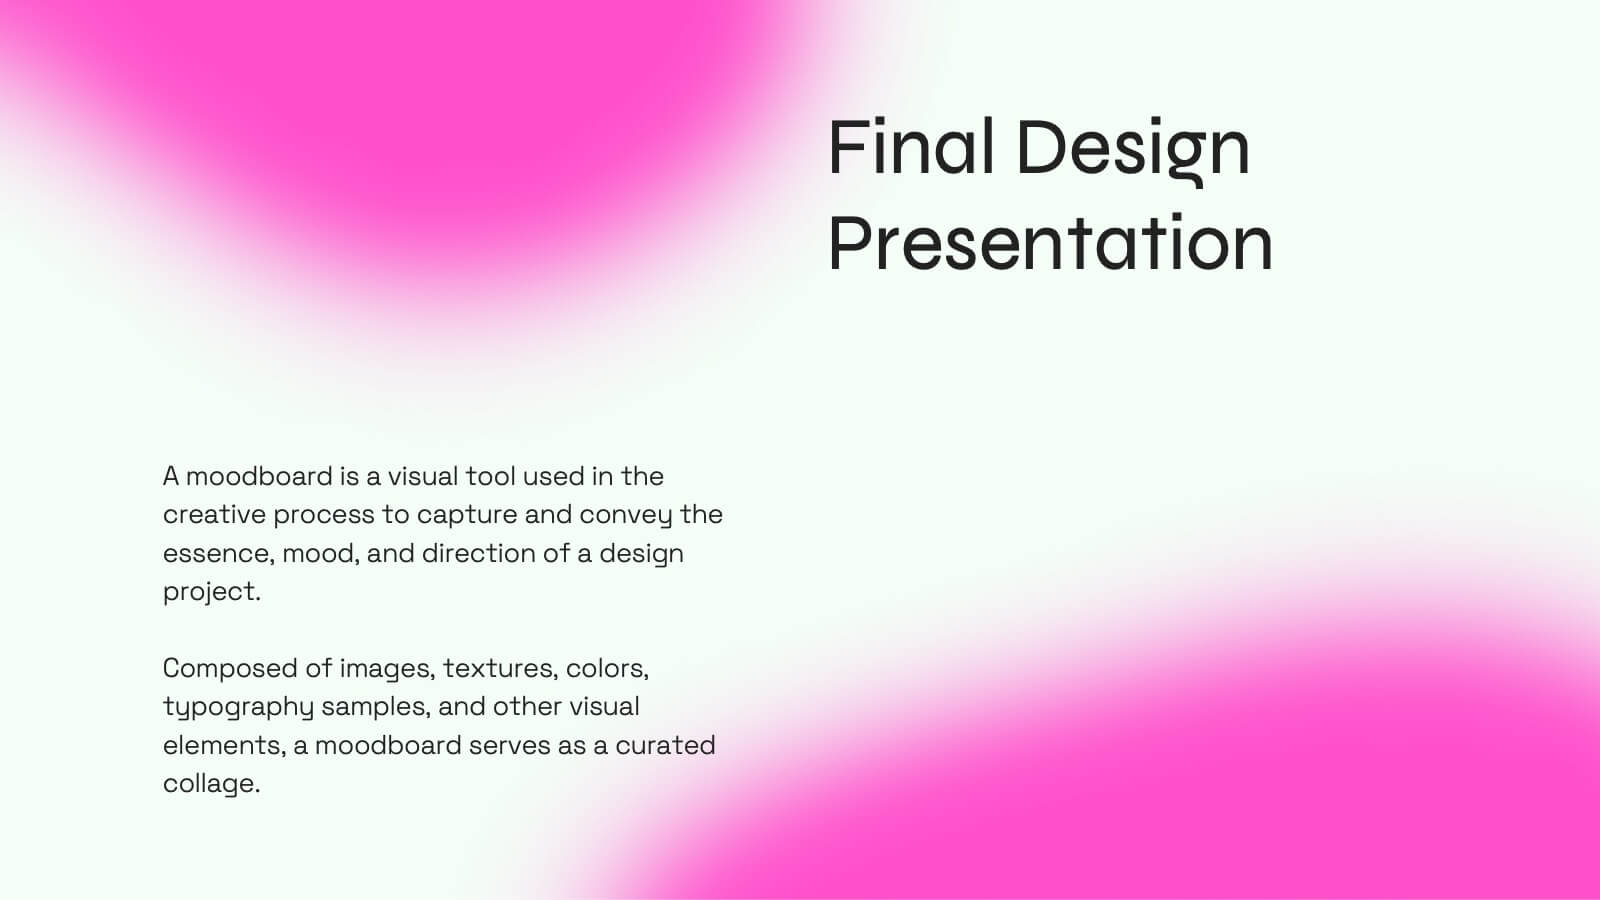
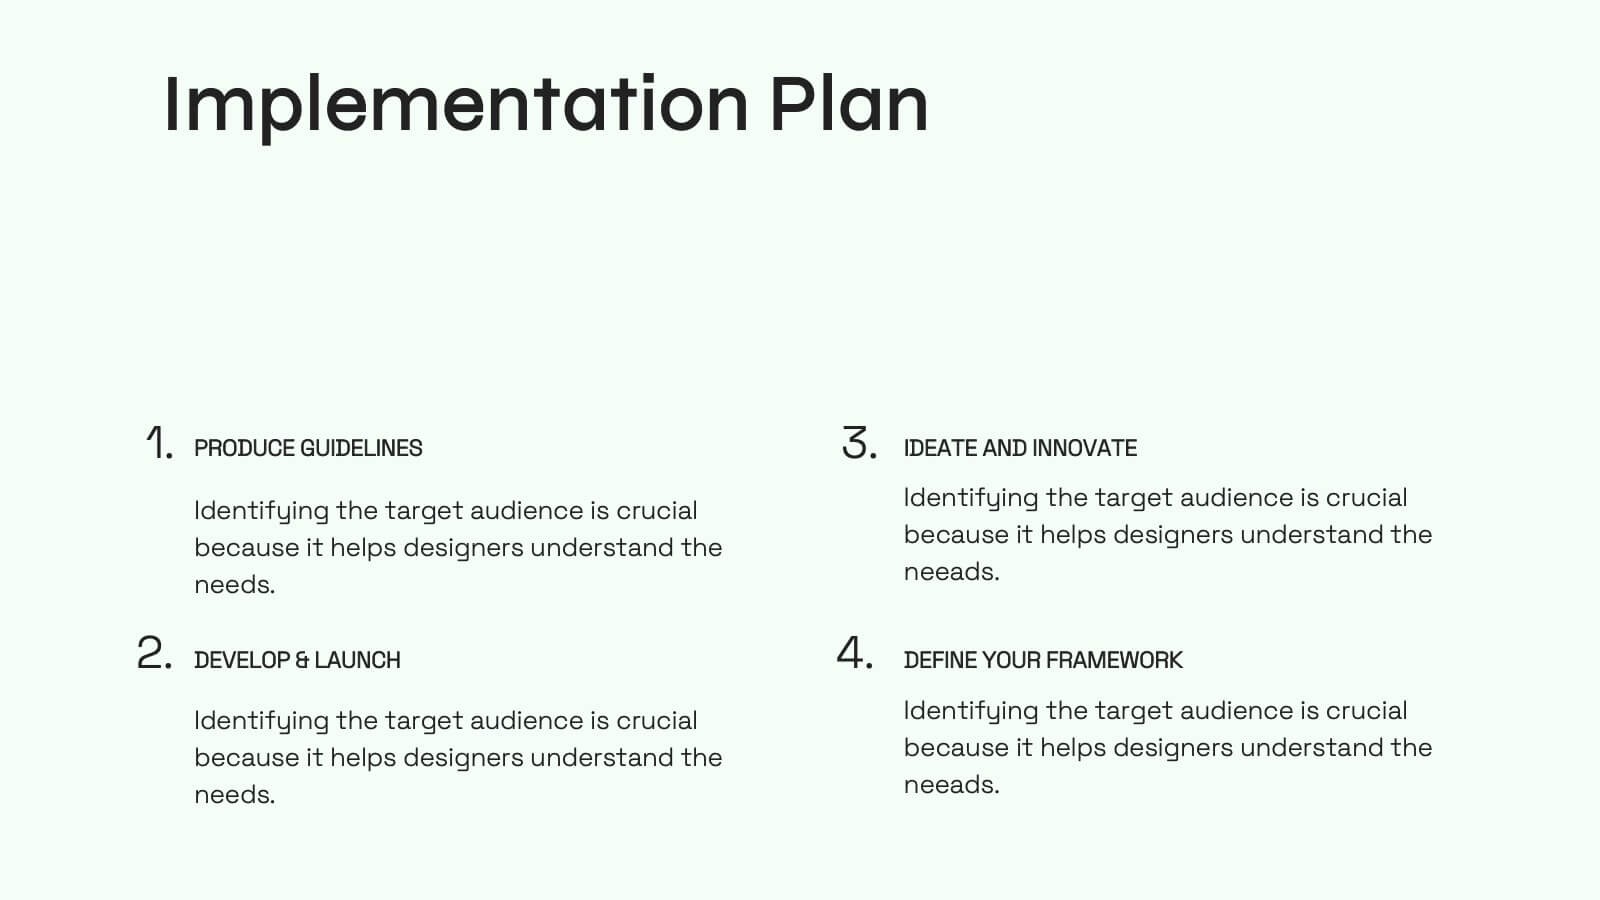
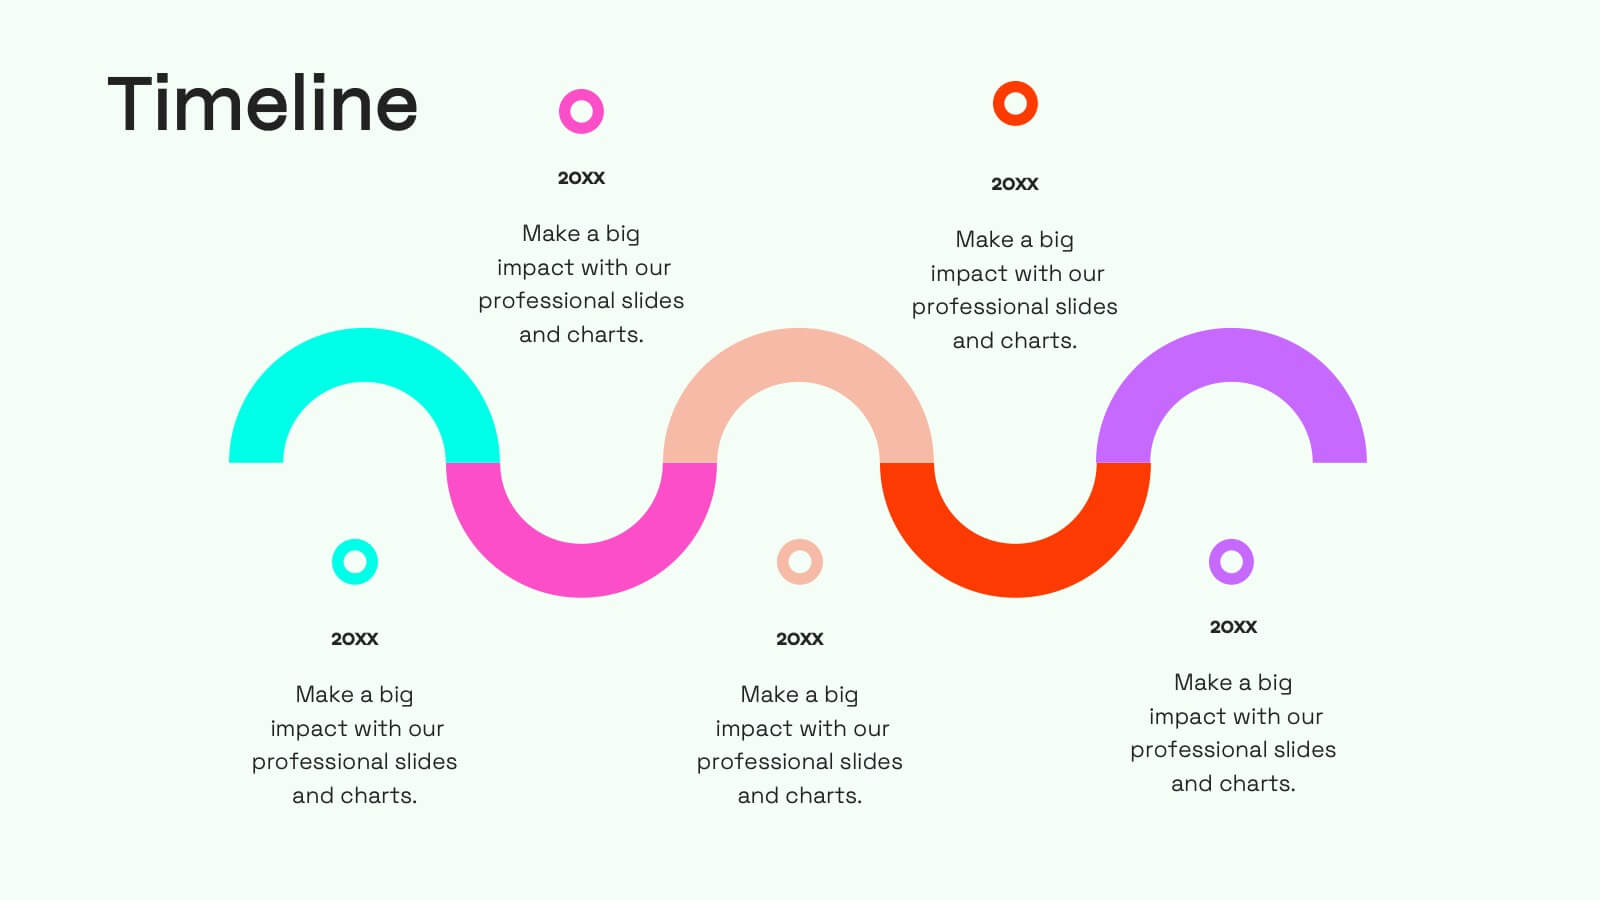
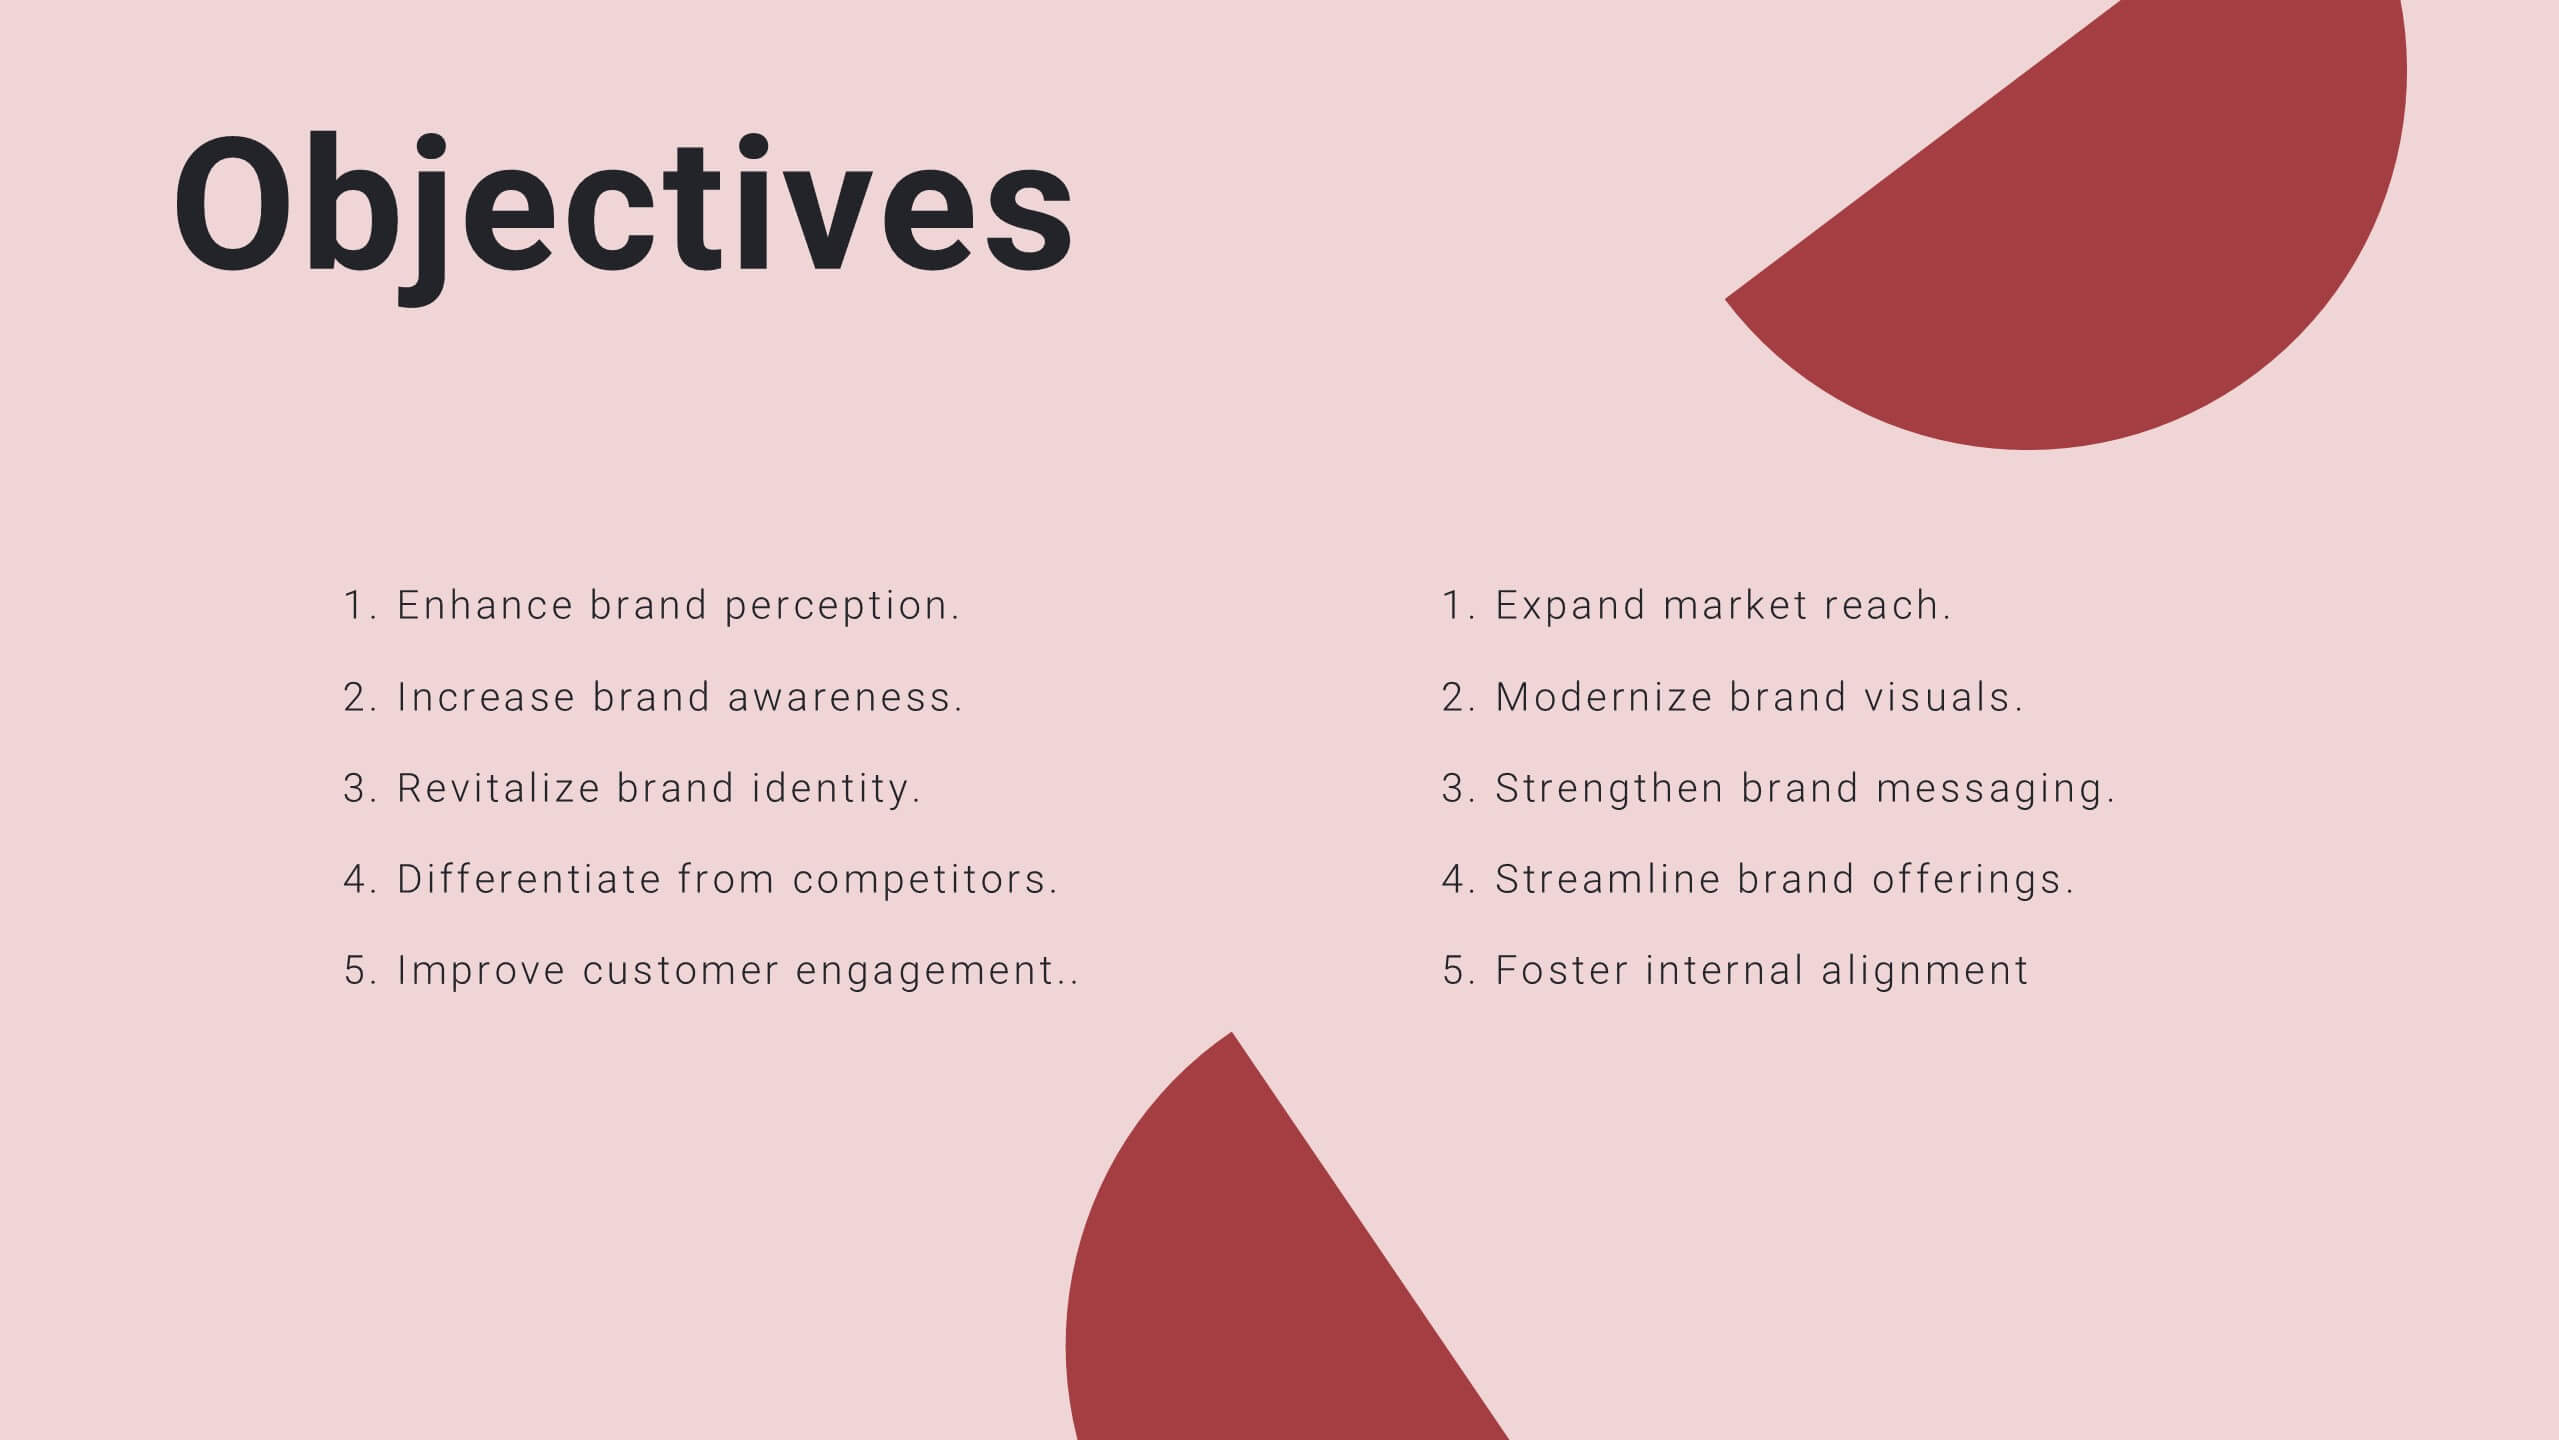
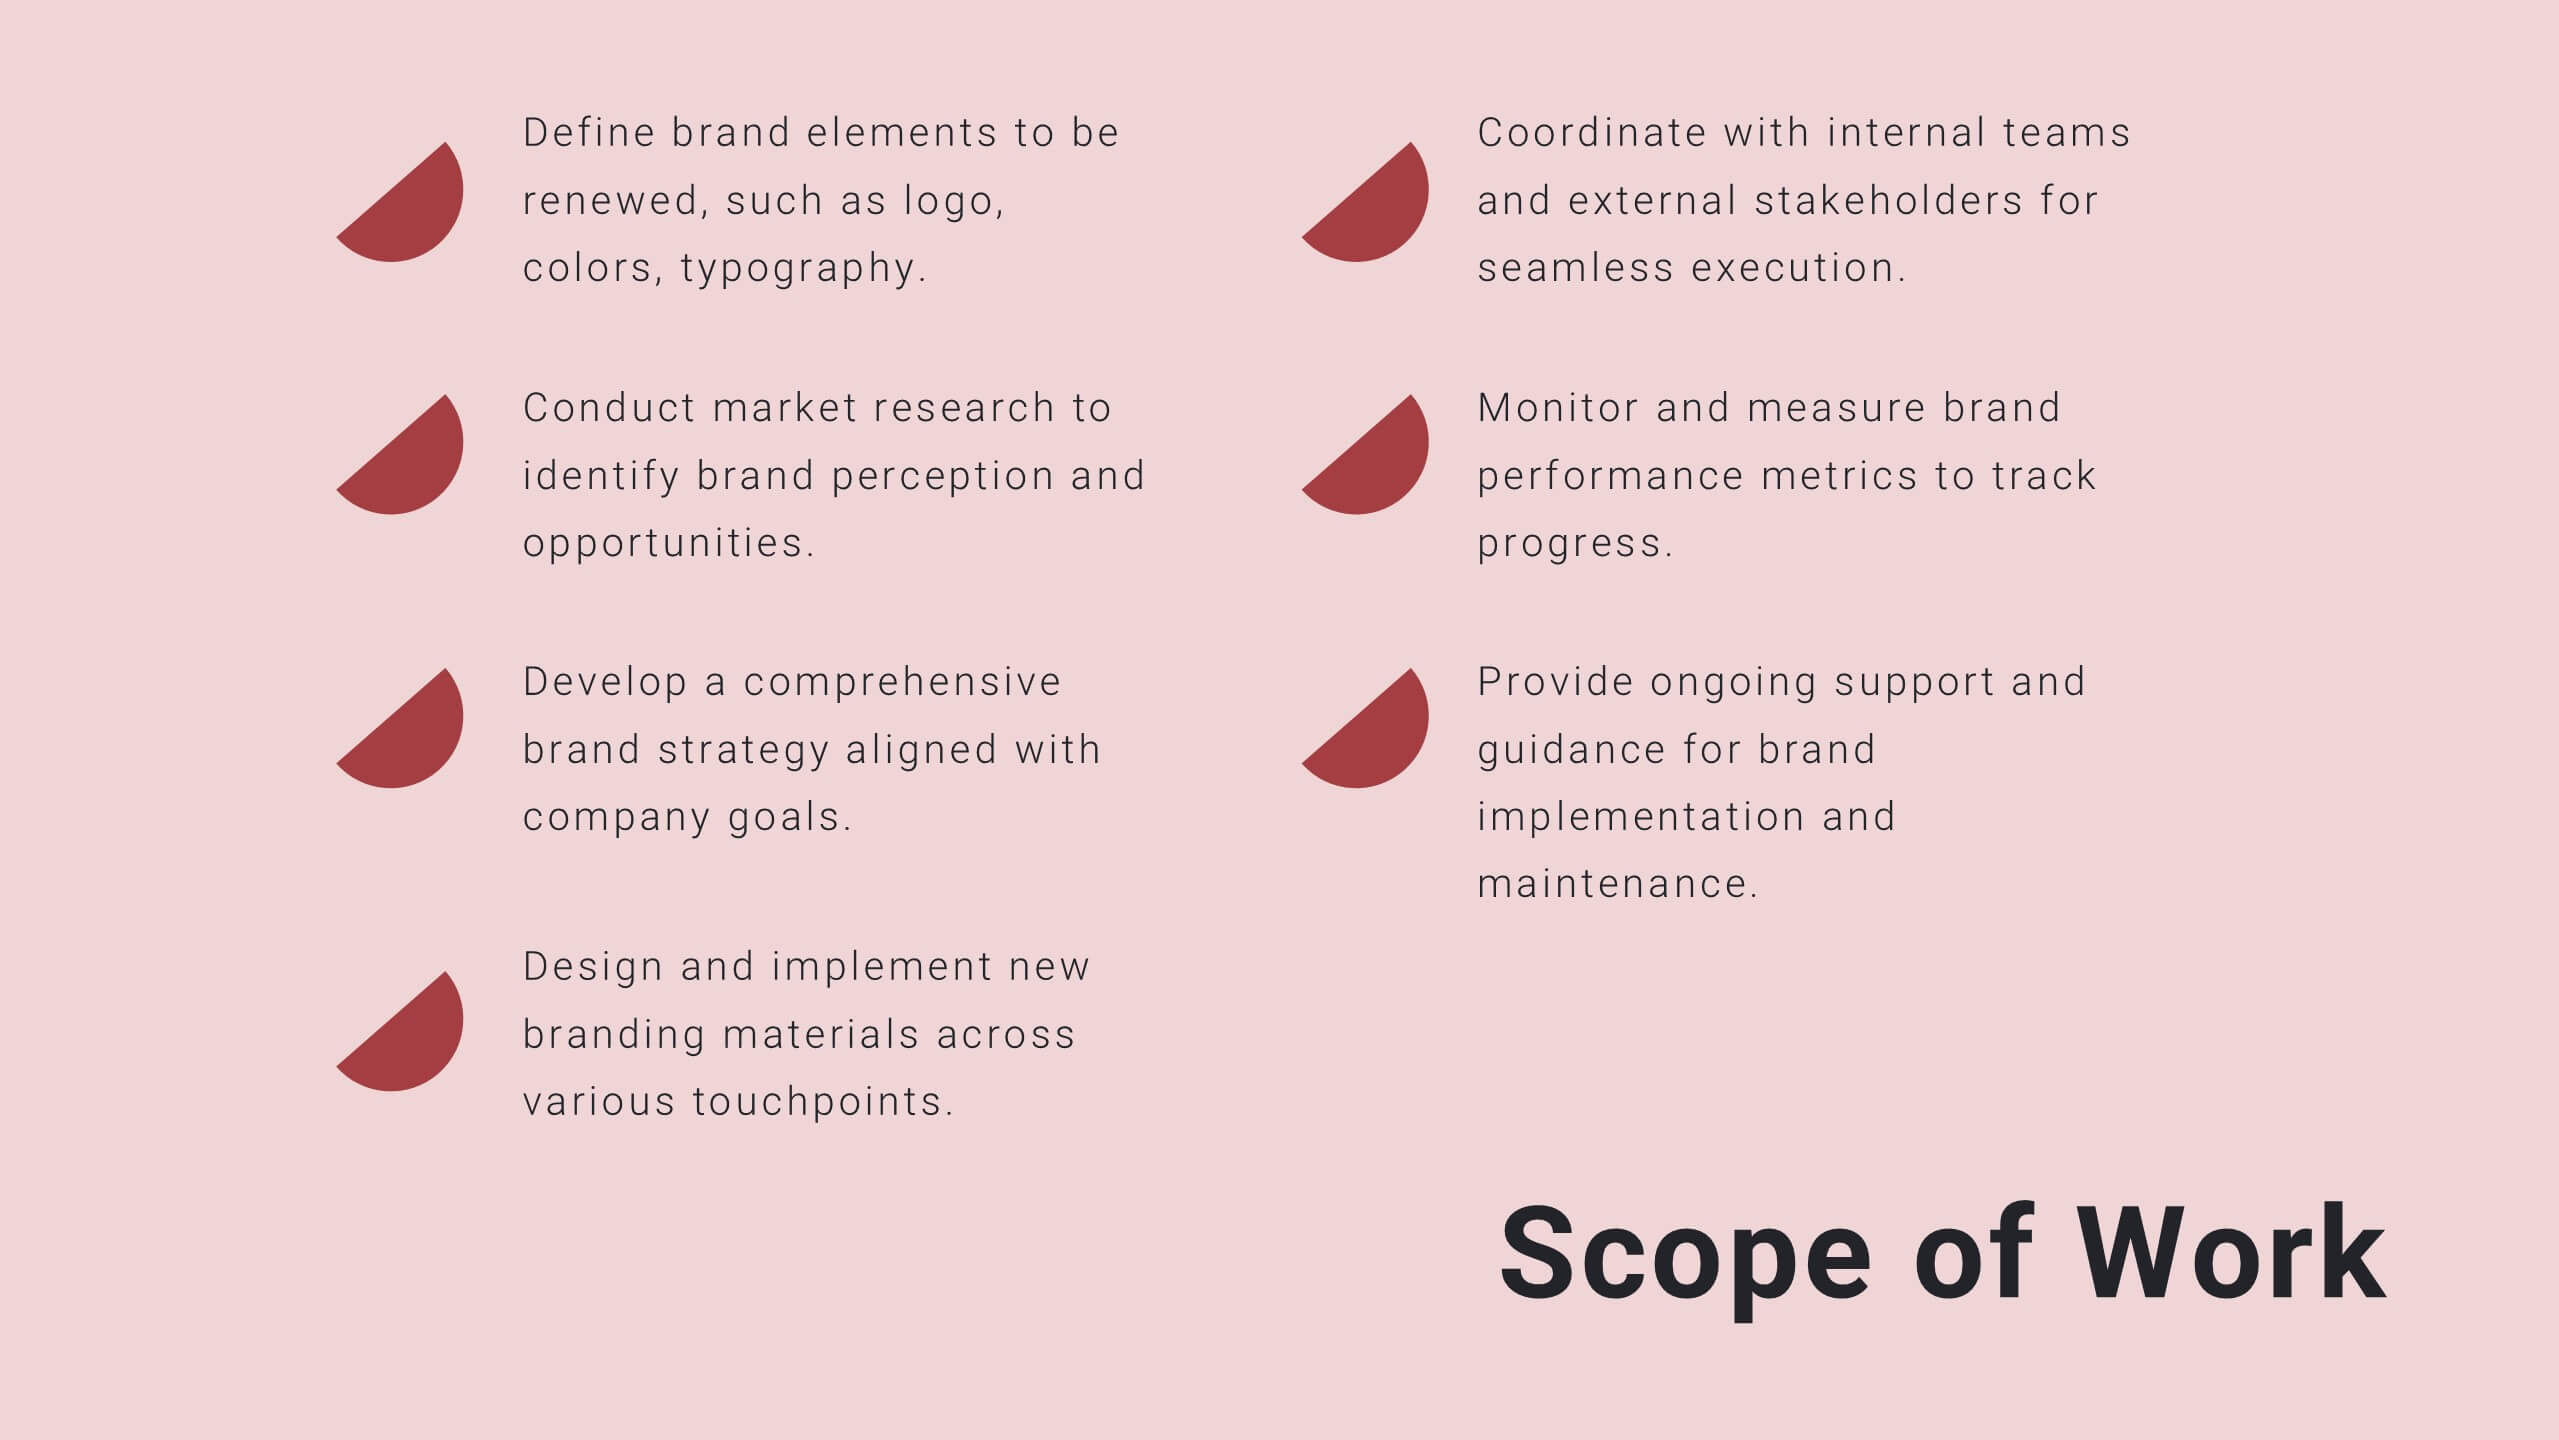
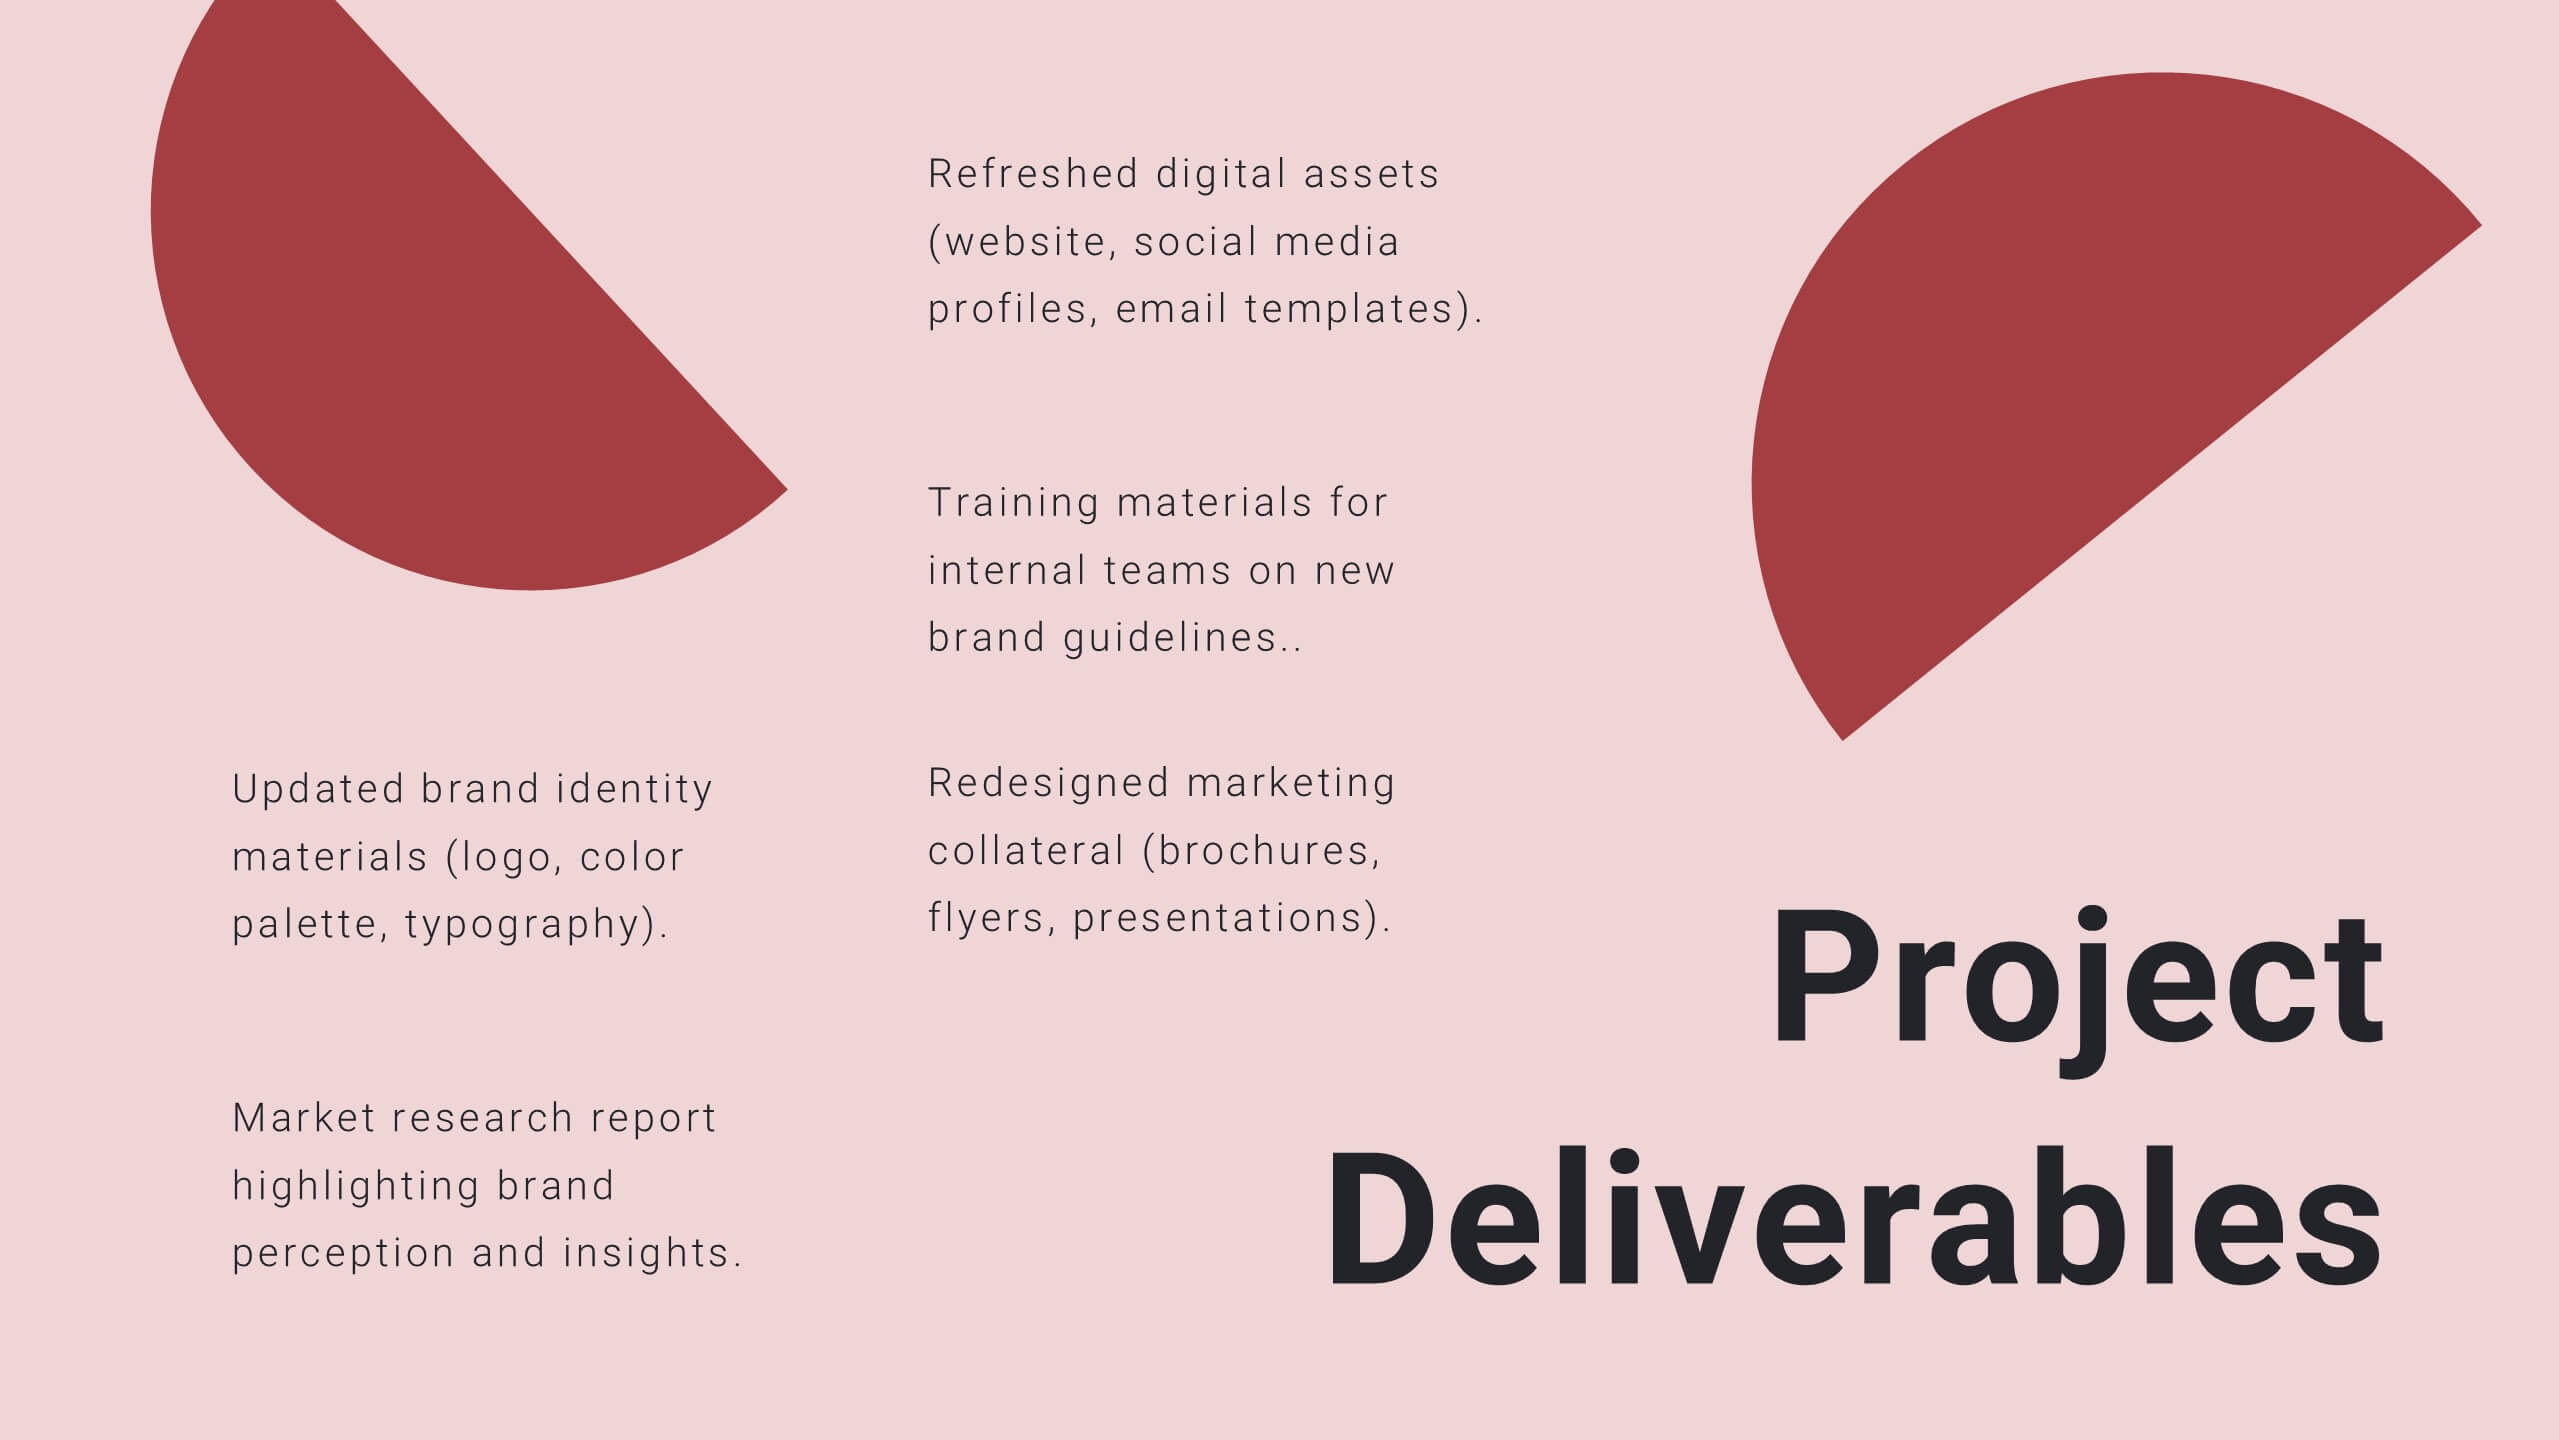
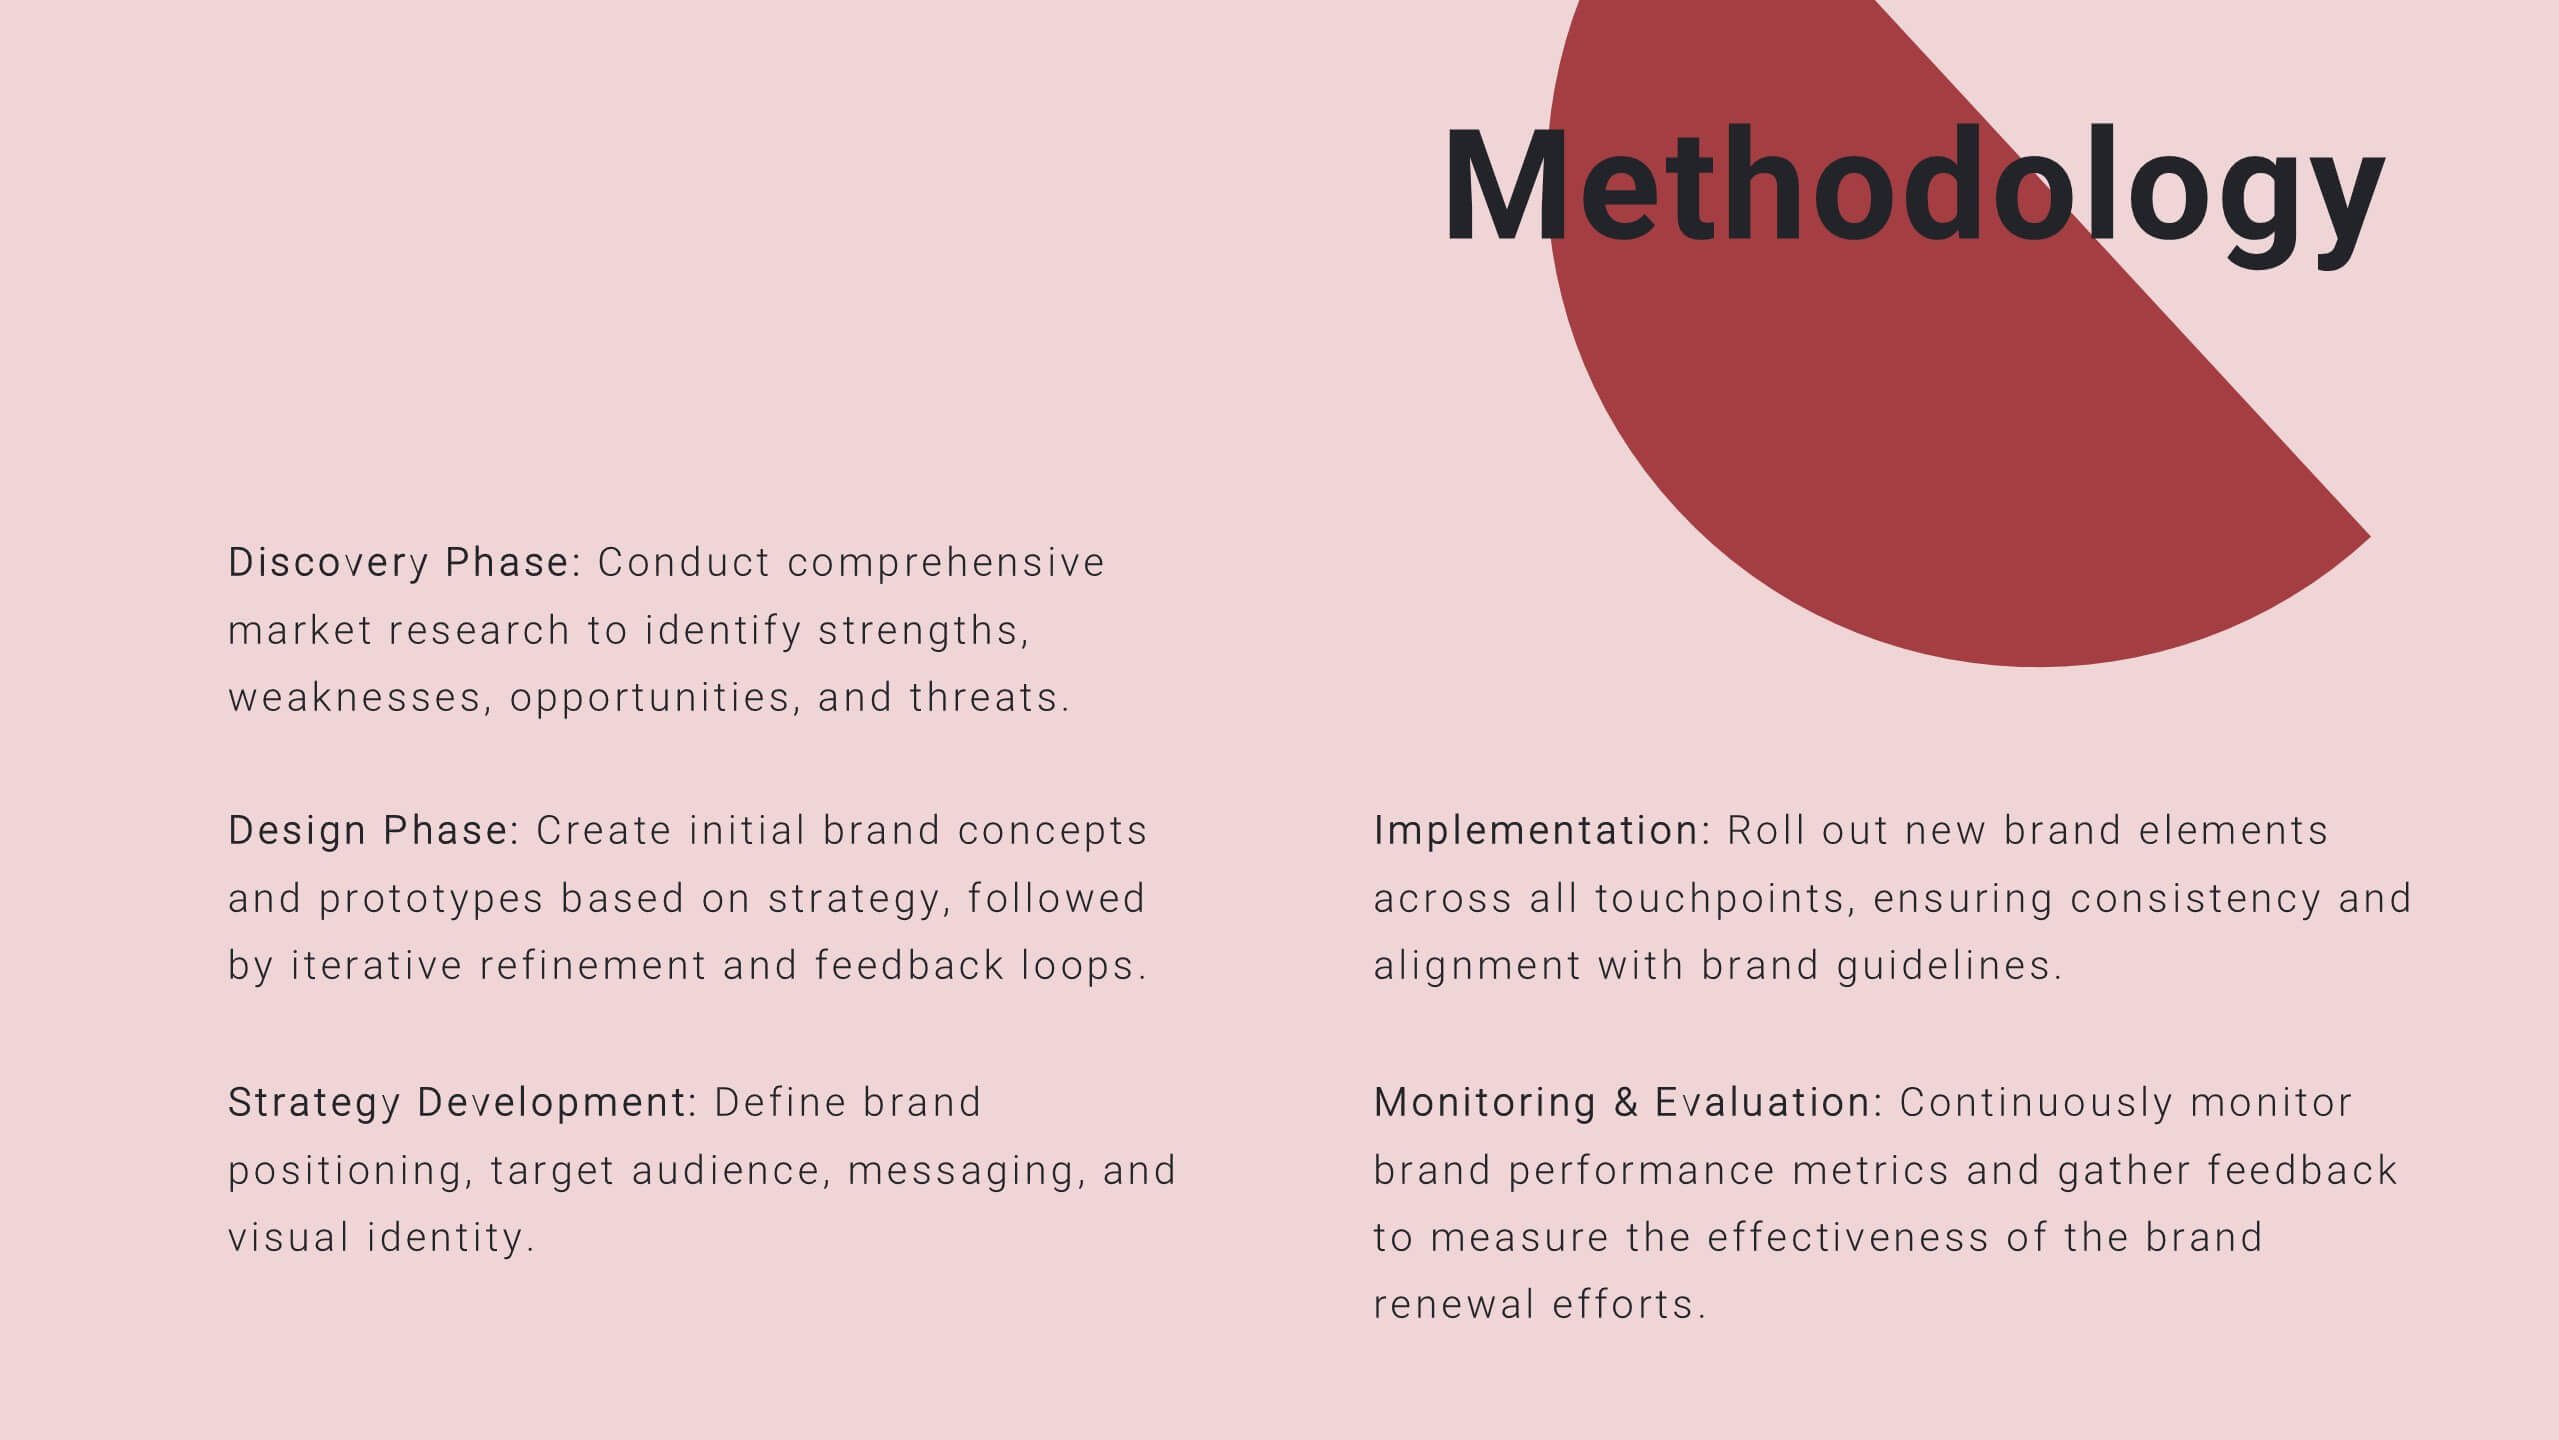
Jade Creative Design Report Presentation
Transform your design report into a captivating visual experience with this elegant jade-themed presentation template! Ideal for showcasing your creative projects, it effectively highlights key concepts, methodologies, and outcomes in a polished format. With its striking design, your work will impress clients and stakeholders alike. Compatible with PowerPoint, Keynote, and Google Slides.


5 diapositivas
5G Wireless Technology Infographics
5G technology refers to the fifth generation of wireless communication technology. These infographic templates are designed to showcase the key features, benefits, and impact of 5G technology. These are perfect for technology enthusiasts, professionals, educators, or anyone looking to explain the concept and advancements of 5G. Educate and inform your audiences about the concept, benefits, and applications of 5G technology with these infographics. It is fully customizable and has attention-grabbing design elements making it easy to create a compelling presentation about the advancements and potential of 5G technology.


5 diapositivas
Project Task Ownership Matrix Presentation
Bring your workflow to life with a clean, engaging slide that maps out who owns what. This presentation helps clarify roles, streamline communication, and keep every task fully aligned. Perfect for teams that need structure without complexity. Fully compatible with PowerPoint, Keynote, and Google Slides.


21 diapositivas
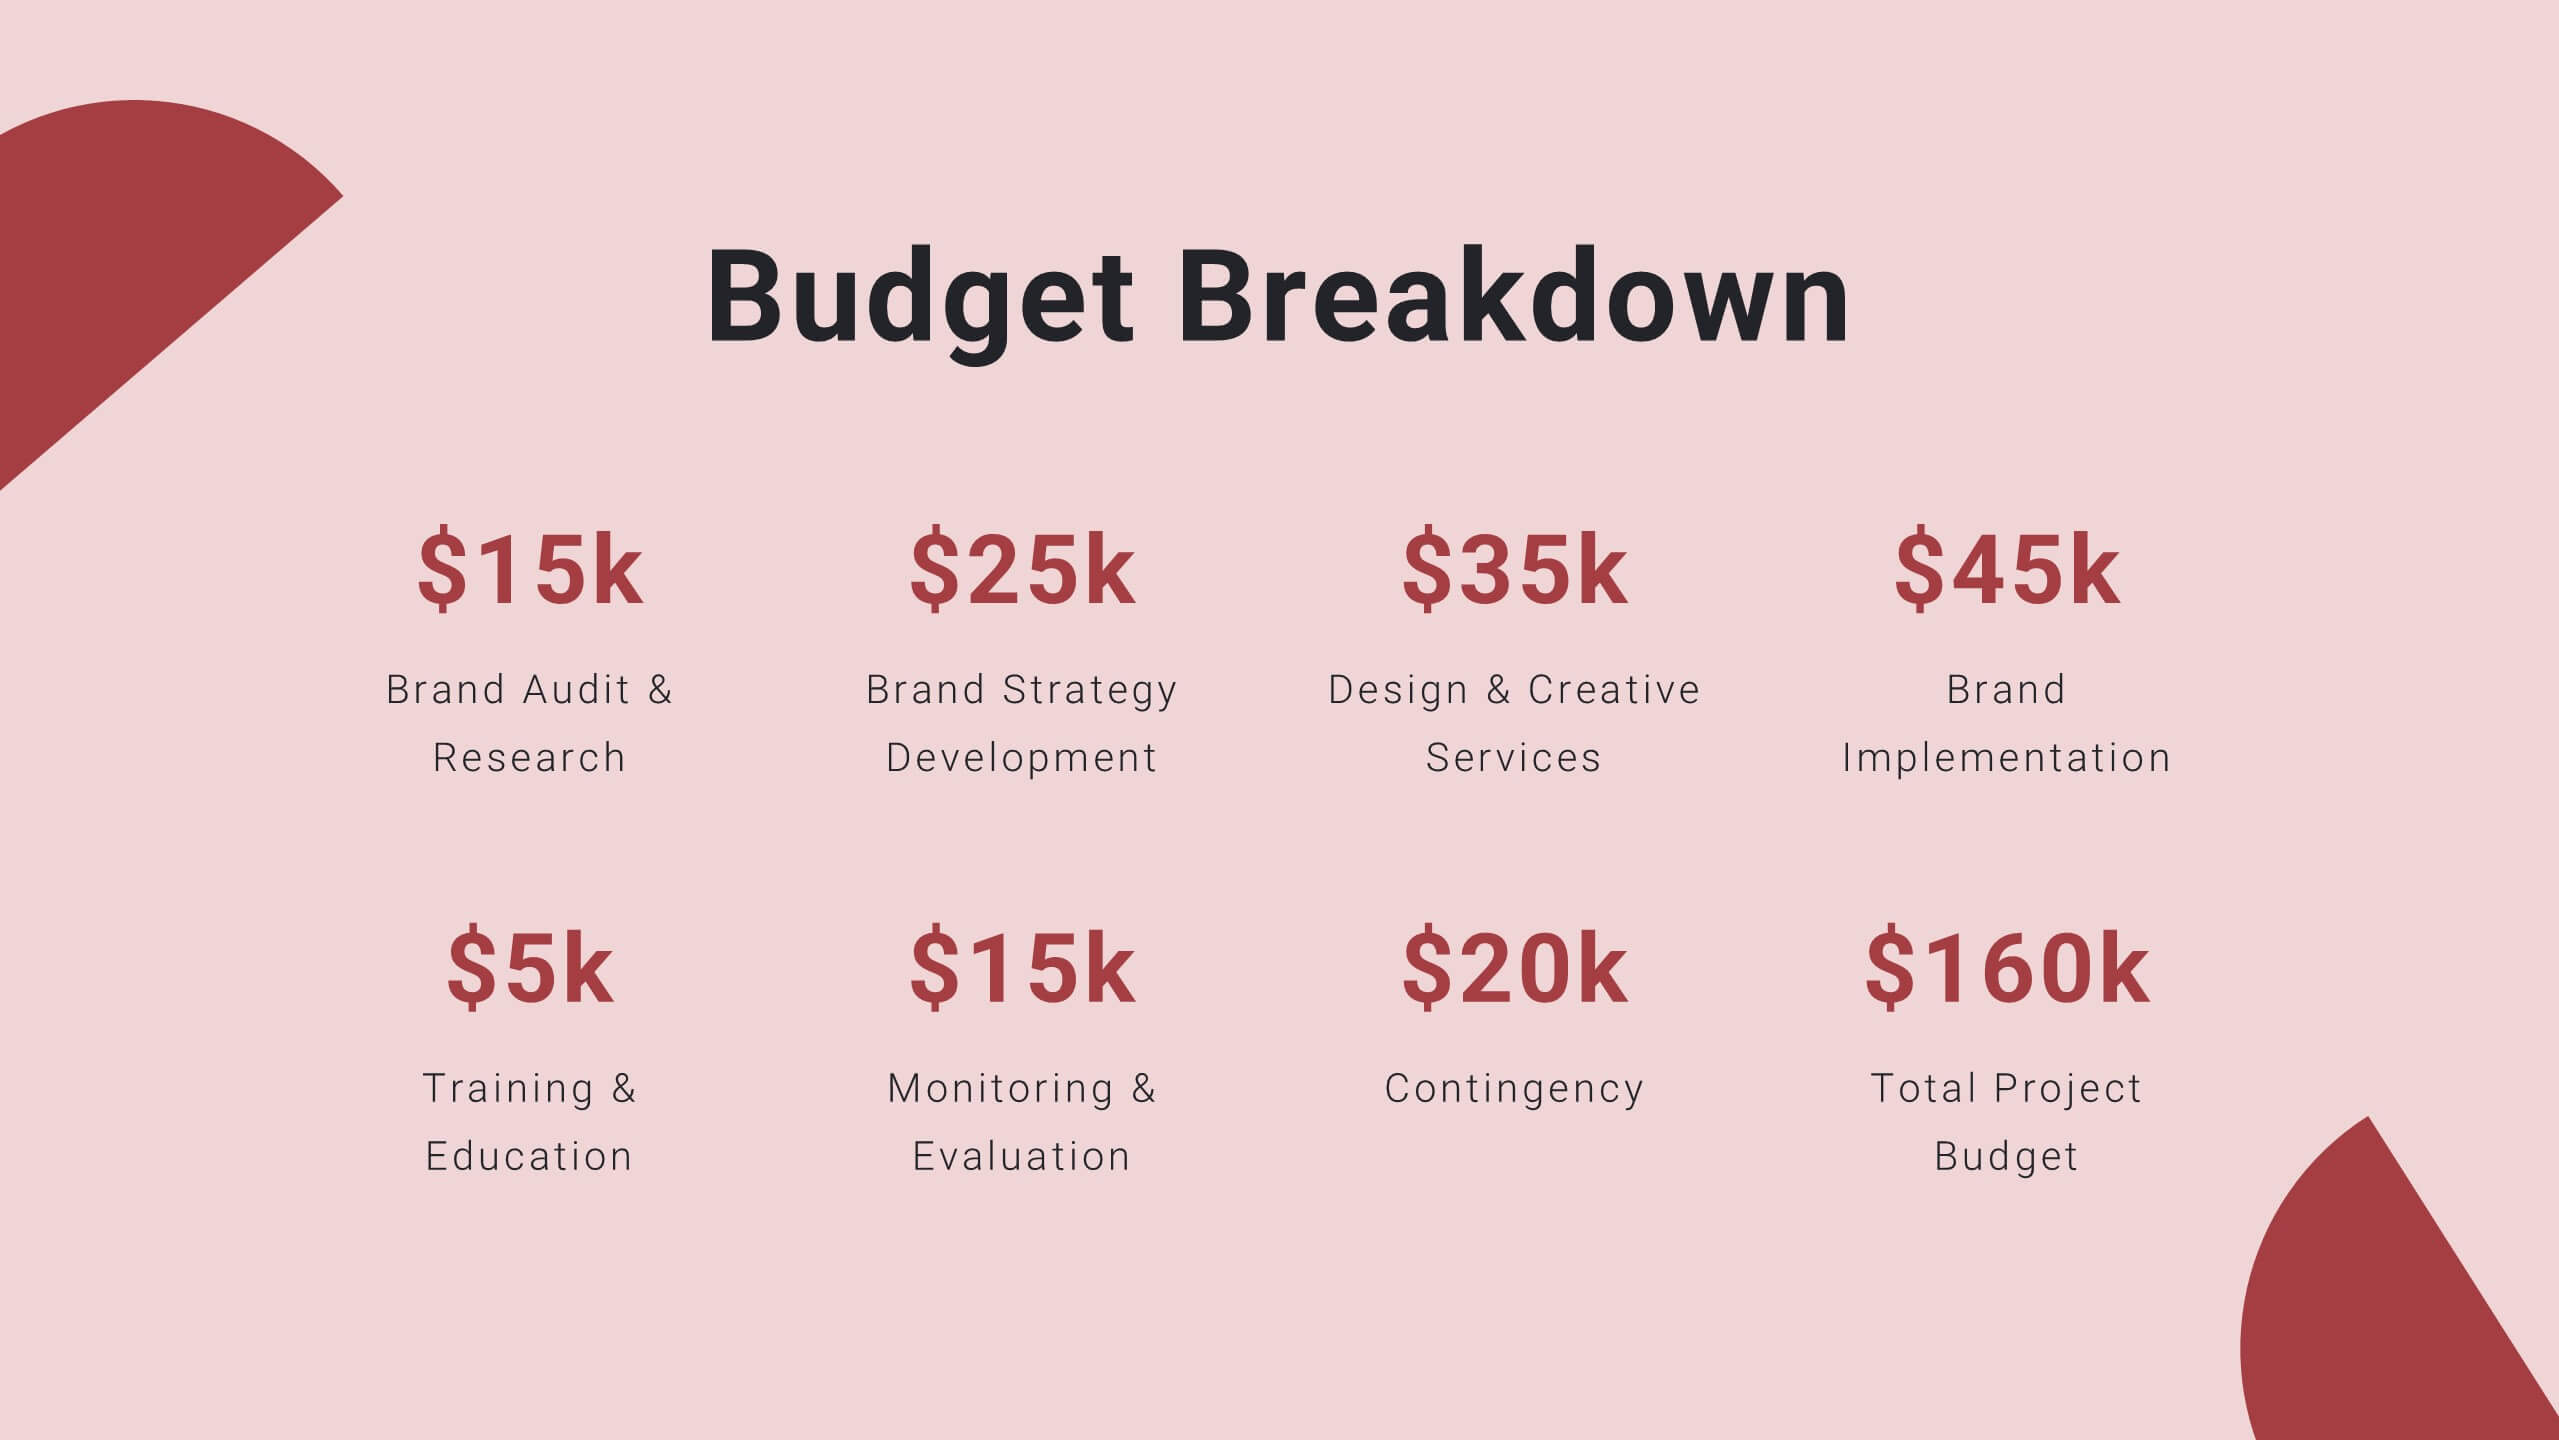
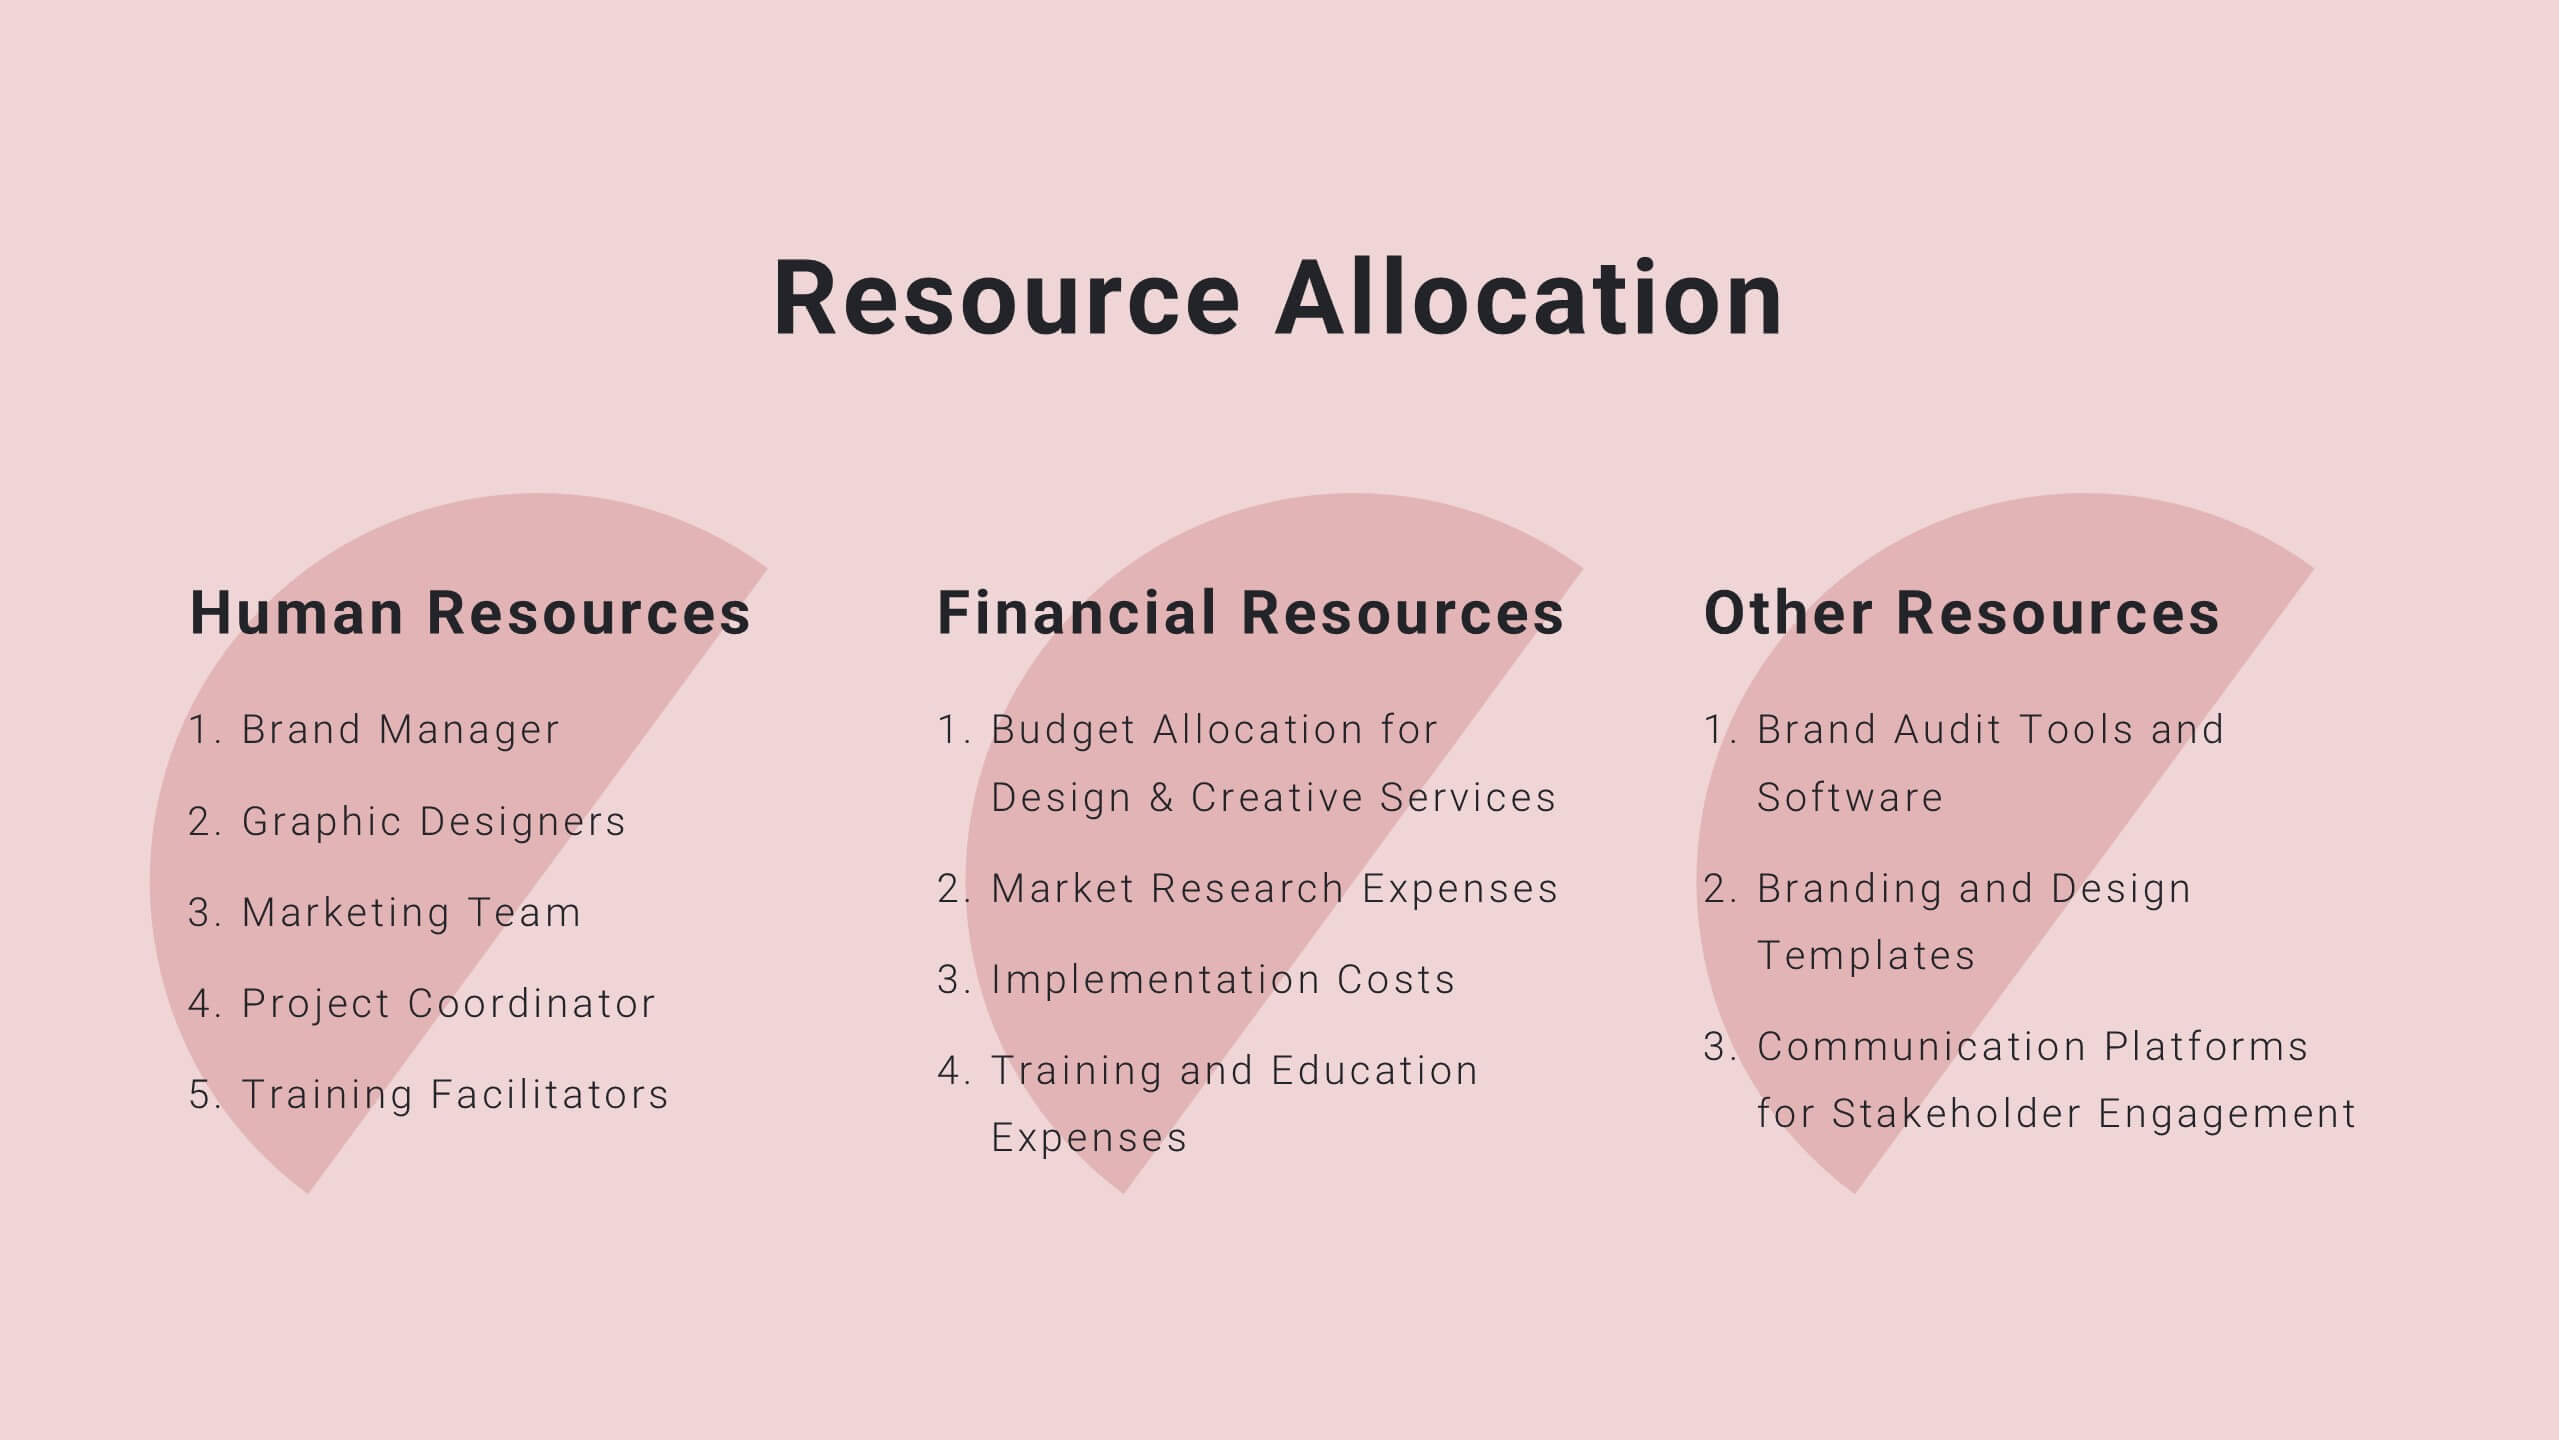
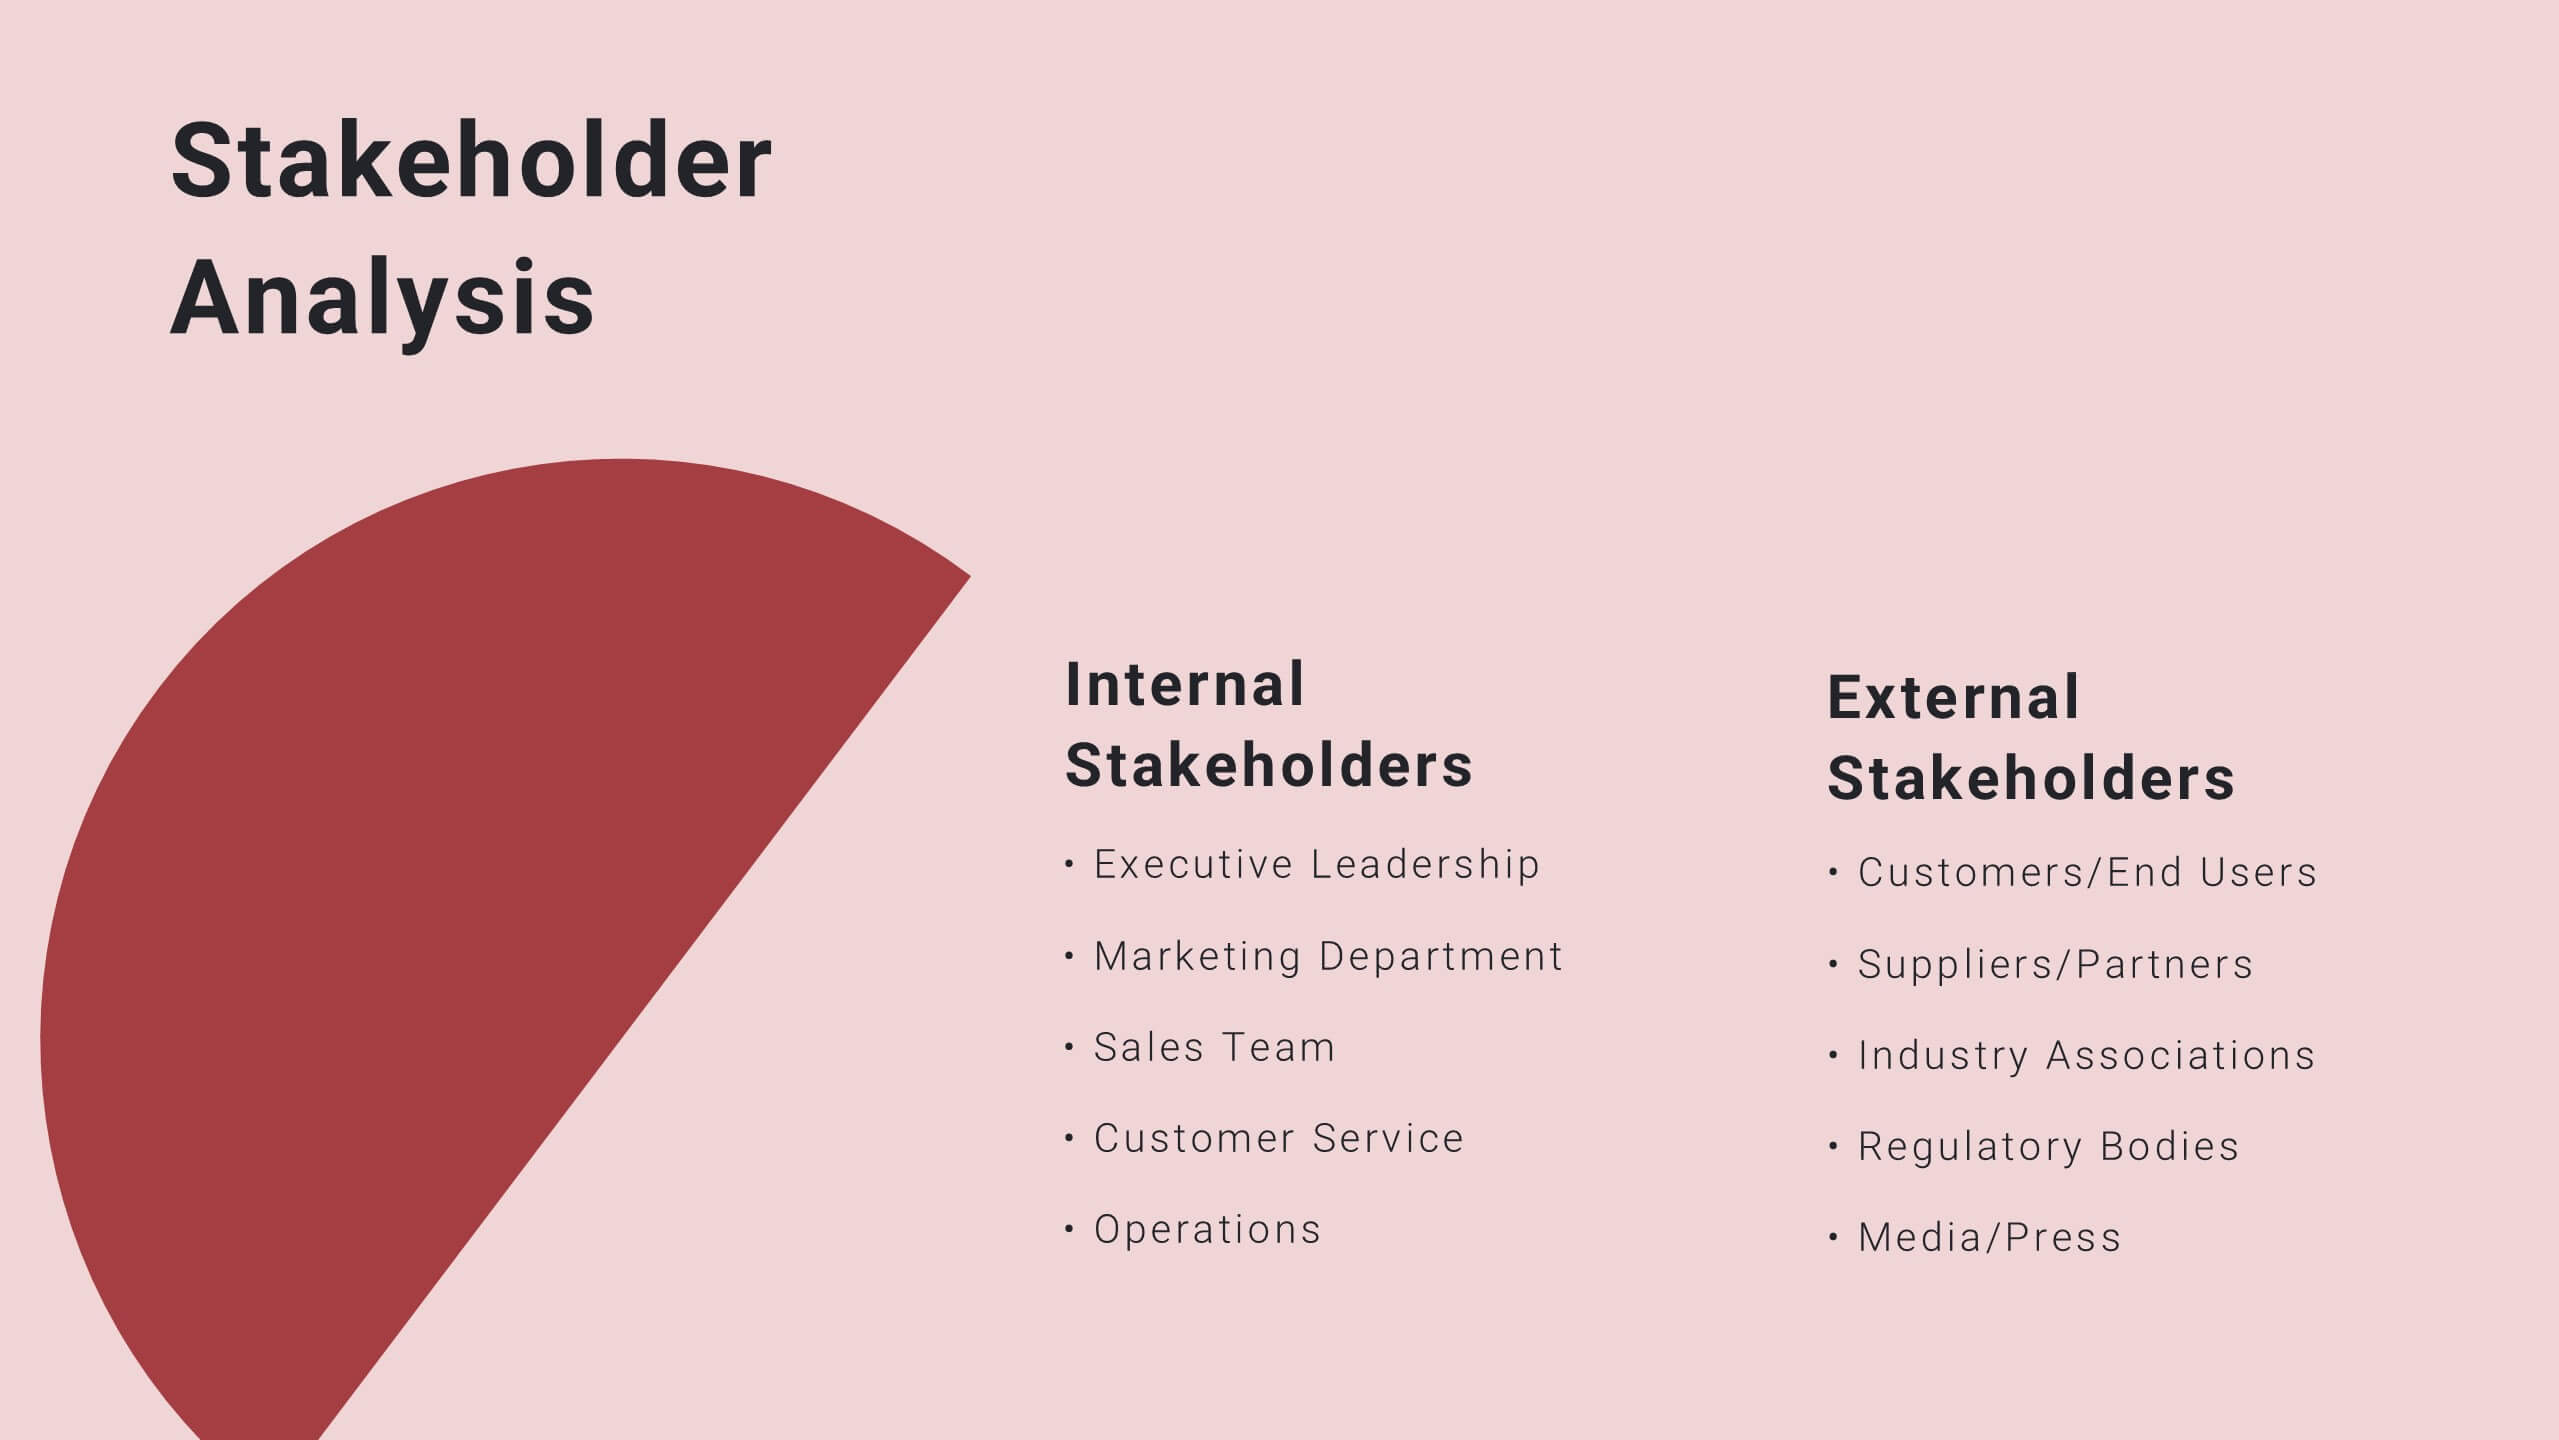
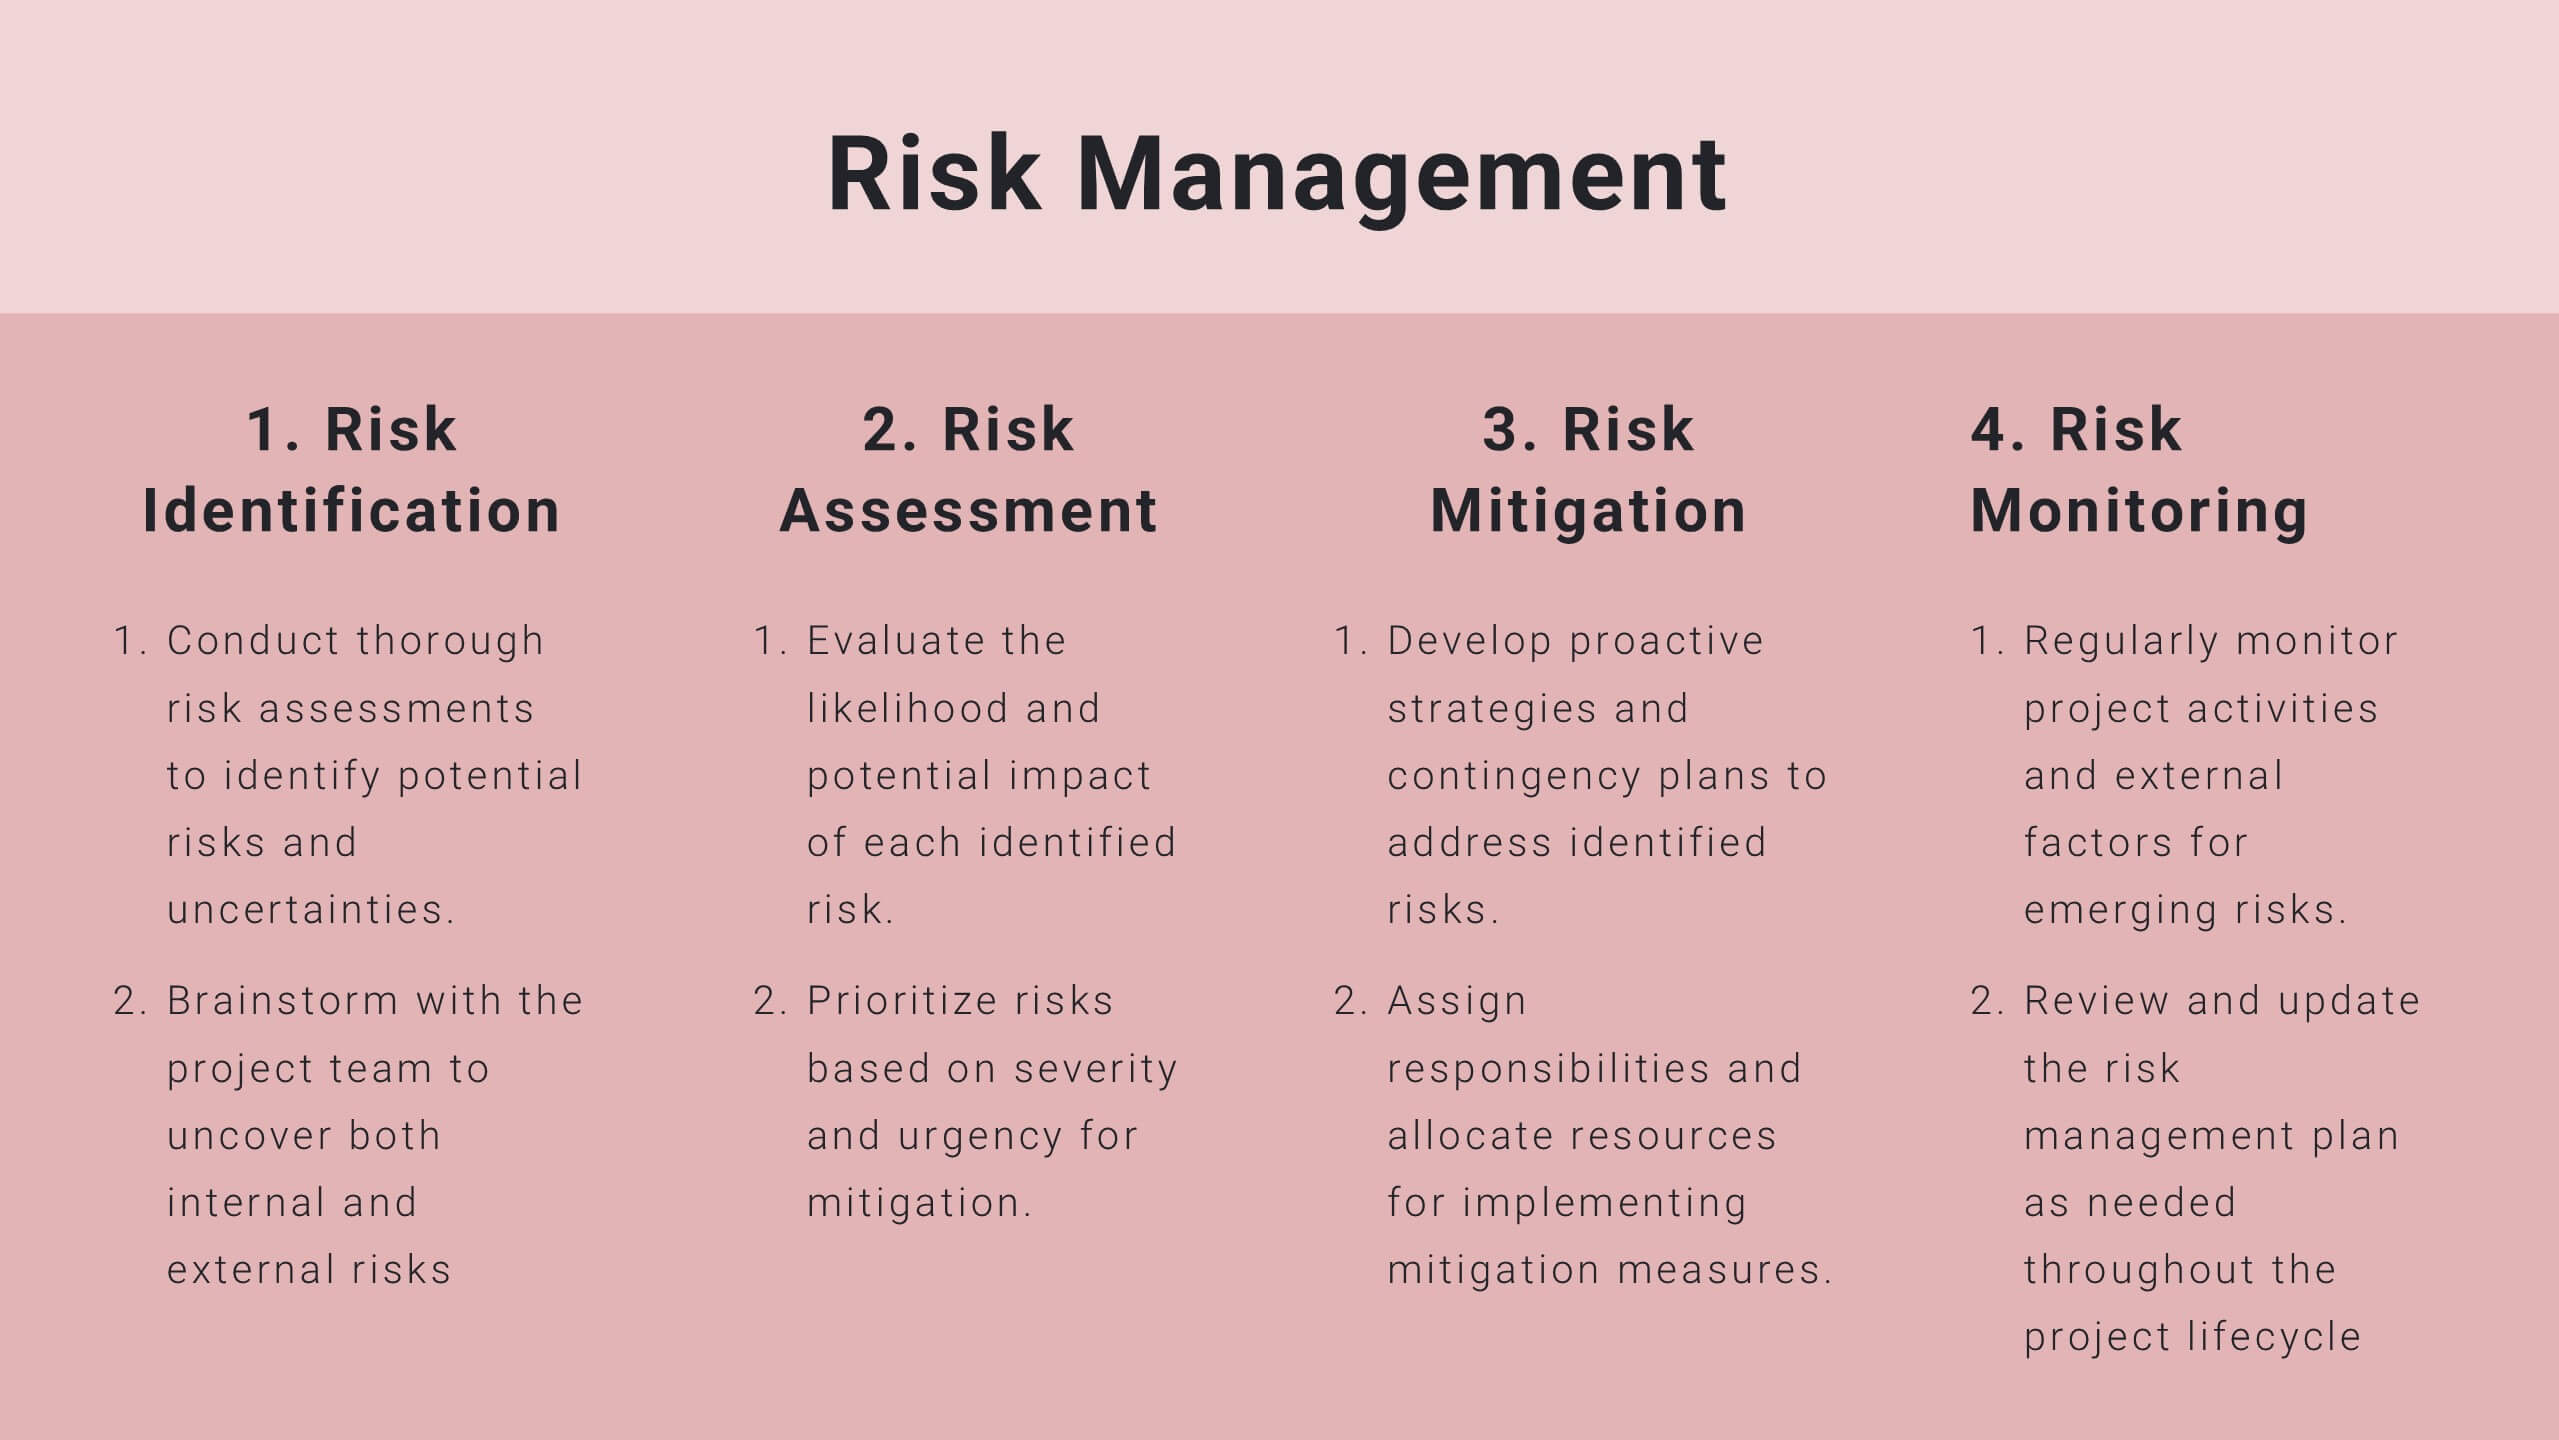
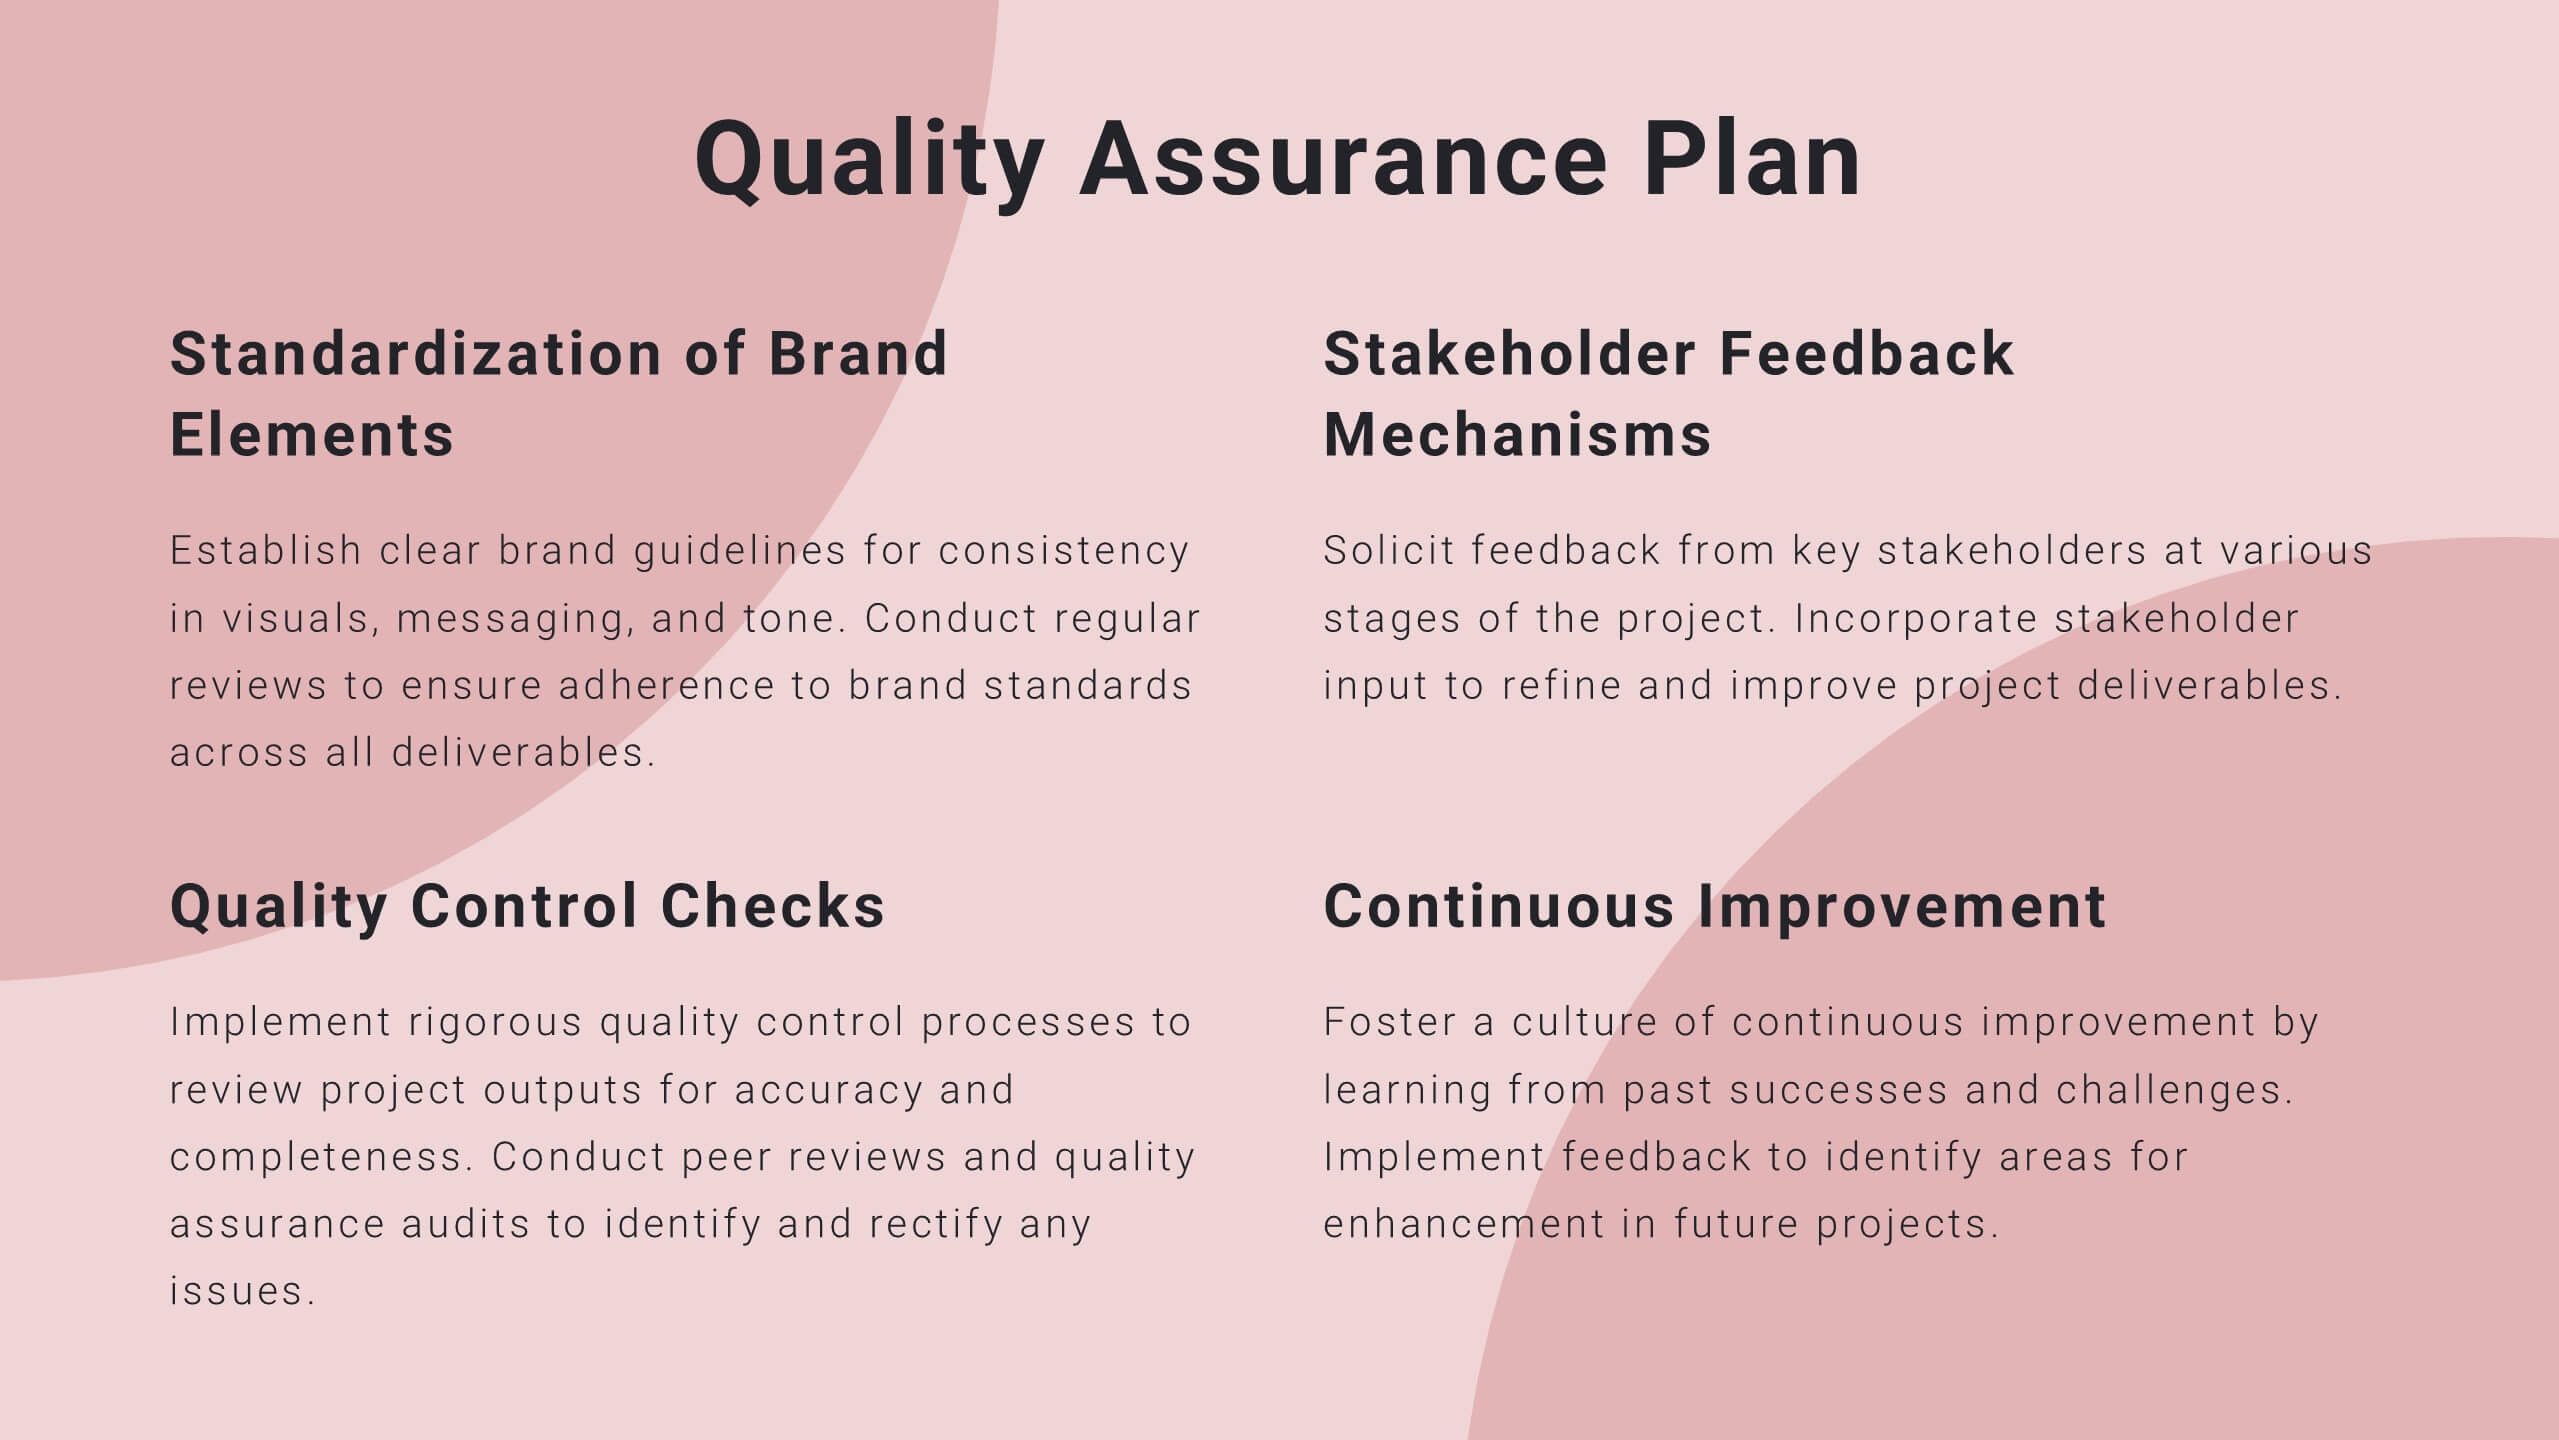
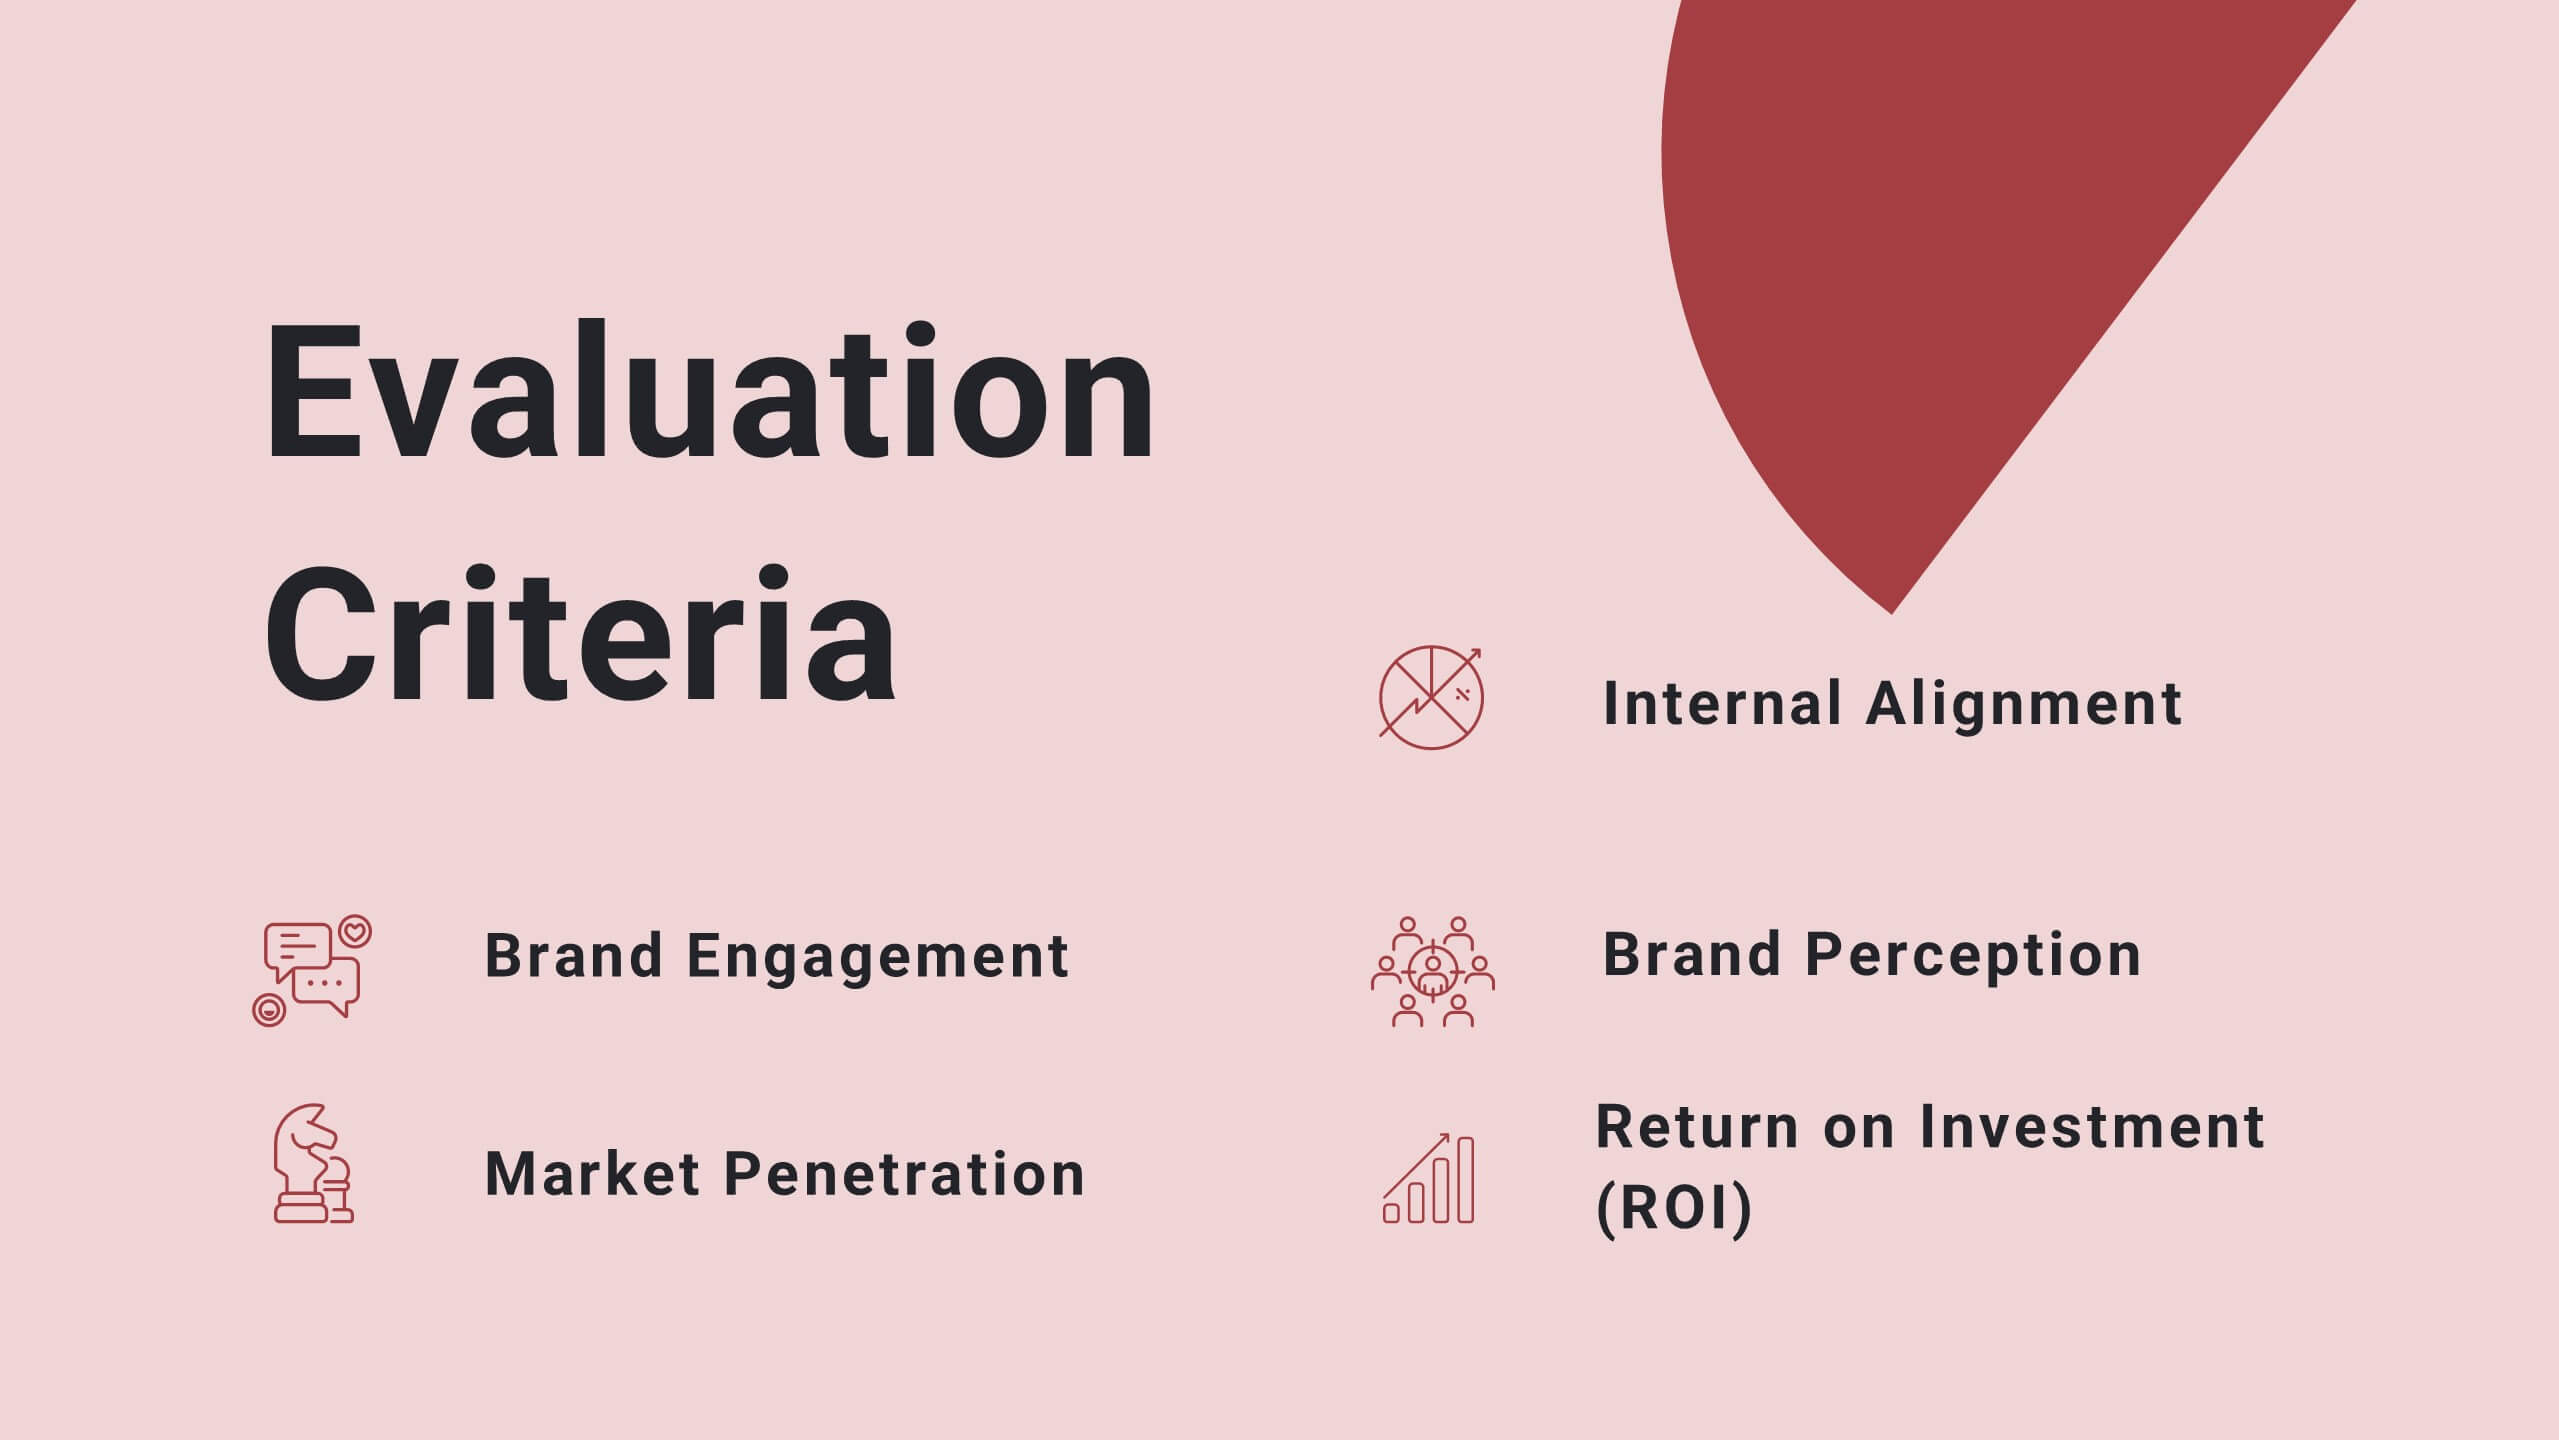
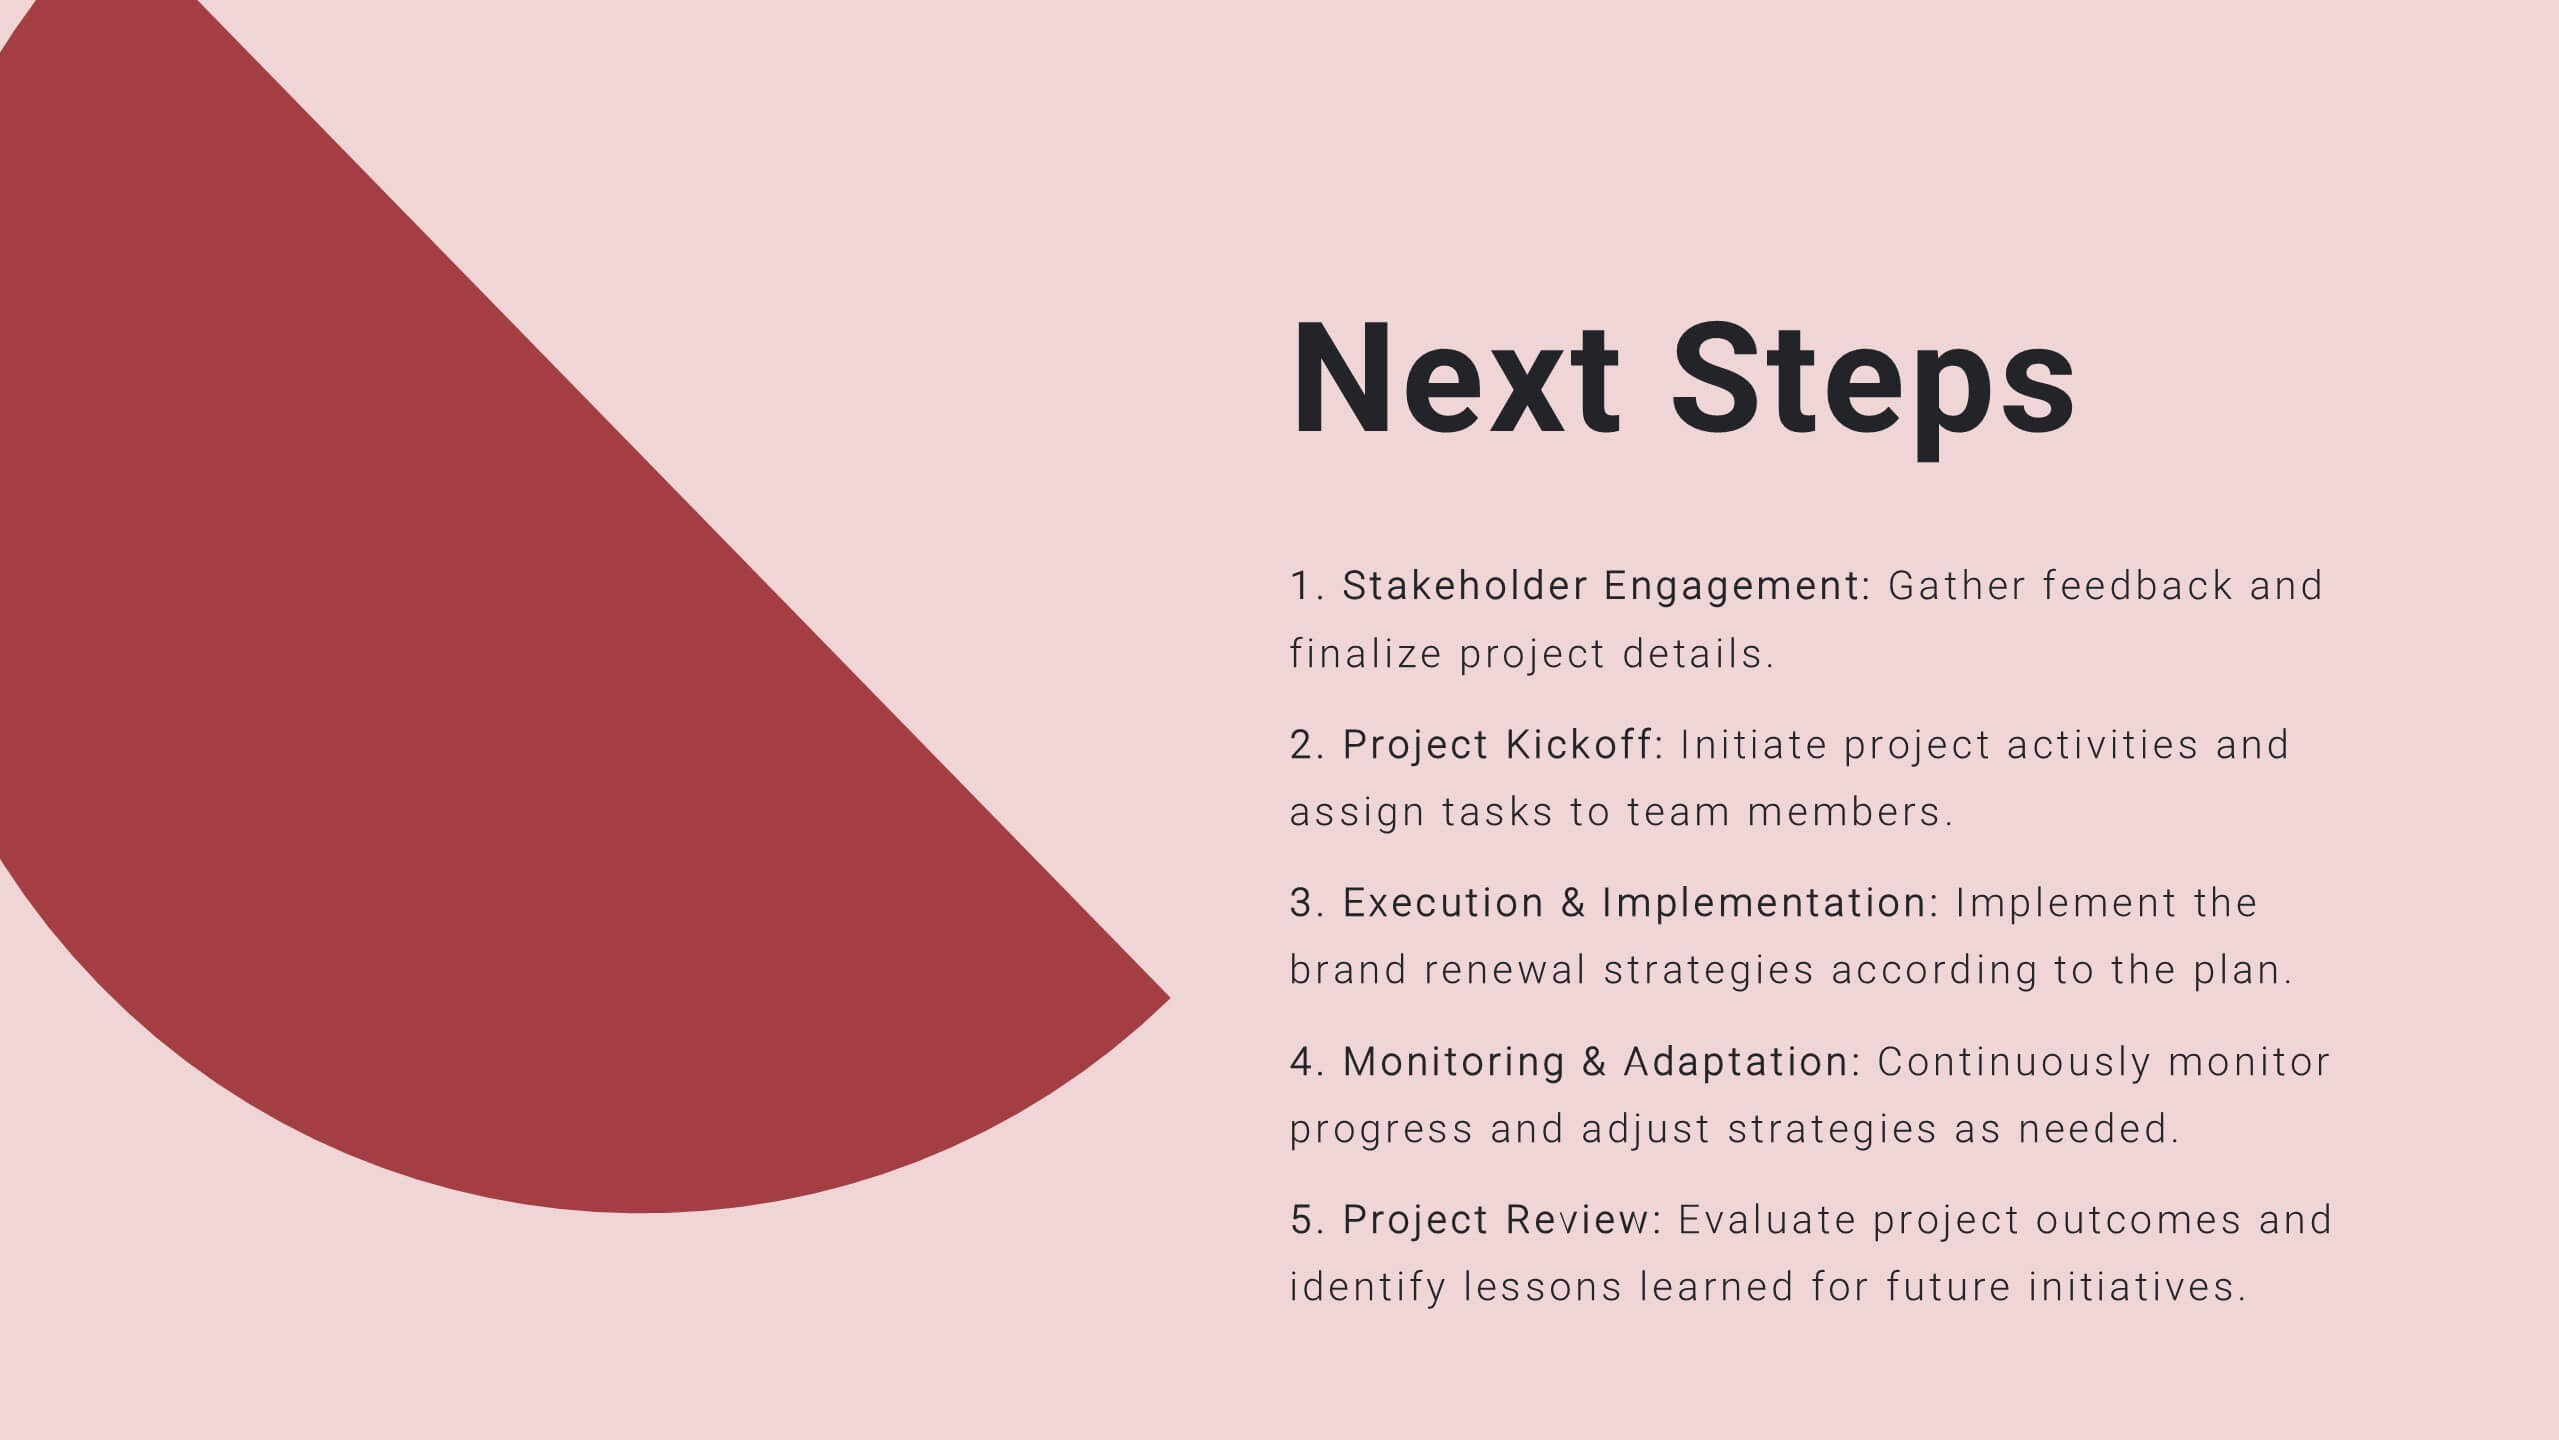
Illume Detailed Project Execution Plan Presentation
Get ready to wow your audience with this dynamic Project Execution Plan template! Bursting with sleek design, it transforms your project timelines, deliverables, and stakeholder analysis into a stunning visual journey. Keep everyone engaged while you showcase your strategy with flair and finesse. Perfect for PowerPoint, Keynote, and Google Slides!


6 diapositivas
Evolution of an Industry Through Time Presentation
Visualize industry transformation with the Evolution of an Industry Through Time Presentation. This timeline-style layout is perfect for highlighting key milestones, technological shifts, or growth stages across decades. Ideal for consultants, educators, or corporate strategists. Fully editable in Canva, PowerPoint, Keynote, and Google Slides for easy adaptation.


2 diapositivas
Elegant Thank You Slide Presentation
Leave a lasting impression with this elegant thank-you slide template! Perfect for closing presentations with professionalism, this design features a modern layout with space for contact details and branding. Ideal for business meetings, pitches, and corporate events. Fully customizable and compatible with PowerPoint, Keynote, and Google Slides for seamless editing.


7 diapositivas
Business Strategy Plan Infographic
A Business Strategy Infographic shows you how to create a business plan that will help you achieve your goals. This infographic is designed to help you understand how your company and competitors are going to win in the marketplace by showing how all of their moves fit together. This template is a beautiful combination of data visualization, charts, and graphics to help you see what's going on in your business. This is the perfect tool for anyone who wants to understand the current state of their operations and make informed decisions about how to move forward. Fully customizable and compatible with Powerpoint, Keynote, and Google Slides.


8 diapositivas
Legal Framework for Corporations
Visualize corporate compliance and governance structures with this balanced legal framework slide. Featuring a scale diagram with adjustable sections, it’s perfect for explaining regulations, policies, and corporate ethics. Ideal for law firms, corporate teams, and compliance officers. Fully editable and compatible with PowerPoint, Keynote, and Google Slides.


5 diapositivas
Project Task Management Presentation
Stay on top of your workflow with this visually organized project task management slide. It features a clear table layout with editable fields for subject, priority level, due date, task status, progress percentage, and last modified date. Ideal for teams managing multiple tasks and deadlines. Use color-coded status bars and icons to communicate task progress at a glance. Perfect for project managers and team leaders. Compatible with PowerPoint, Keynote, and Google Slides.


21 diapositivas
Twilight Project Milestones Report Presentation
Present your project milestones and plan with clarity using this sleek project proposal template! It includes sections for objectives, timelines, budget breakdowns, and risk management. Perfect for organizing and presenting complex project plans, it’s fully customizable and compatible with PowerPoint, Keynote, and Google Slides, ensuring a professional presentation every time.


7 diapositivas
Oceania Population Infographic Presentation
An Oceania map infographic is a visual representation of the Oceania region, which includes Australia, New Zealand, and the many small islands and archipelagos in the Pacific Ocean. This informative template highlights the geography, population, culture, history, and other relevant information about the region. This Oceania map infographic can be designed in a variety of styles and formats, including a political map, topographic map, population density map, and climate map. This template is compatible with Powerpoint, Keynote and Google Slides making it very easy to edit and include your data.


8 diapositivas
Structured Table of Content for Reports Presentation
Create clarity and flow in your professional reports with this Structured Table of Content for Reports slide. Featuring a sleek column design with three main sections, each block offers space for a title, description, and a matching icon. Ideal for business reviews, strategy documents, and formal proposals. This layout ensures your audience knows exactly what to expect. Fully customizable in PowerPoint, Keynote, and Google Slides.


23 diapositivas
Nightspire Strategic Planning Report Presentation
Streamline your strategic planning process with this professionally designed presentation template. Covering key areas such as market analysis, SWOT assessment, milestones, and resource allocation, this template is ideal for businesses and project teams. Fully editable and compatible with PowerPoint, Keynote, and Google Slides.