


Características


¿Tienes alguna pregunta?
Recomendar


4 diapositivas
Editable Table Chart Presentation
Simplify side-by-side evaluations with the Editable Table Chart Presentation. Designed for clear comparisons, this layout uses checkmarks, icons, and a clean structure to display features or data across multiple categories. It's perfect for showcasing product options, service tiers, or strategic alternatives. Fully customizable and compatible with PowerPoint, Keynote, and Google Slides.

21 diapositivas
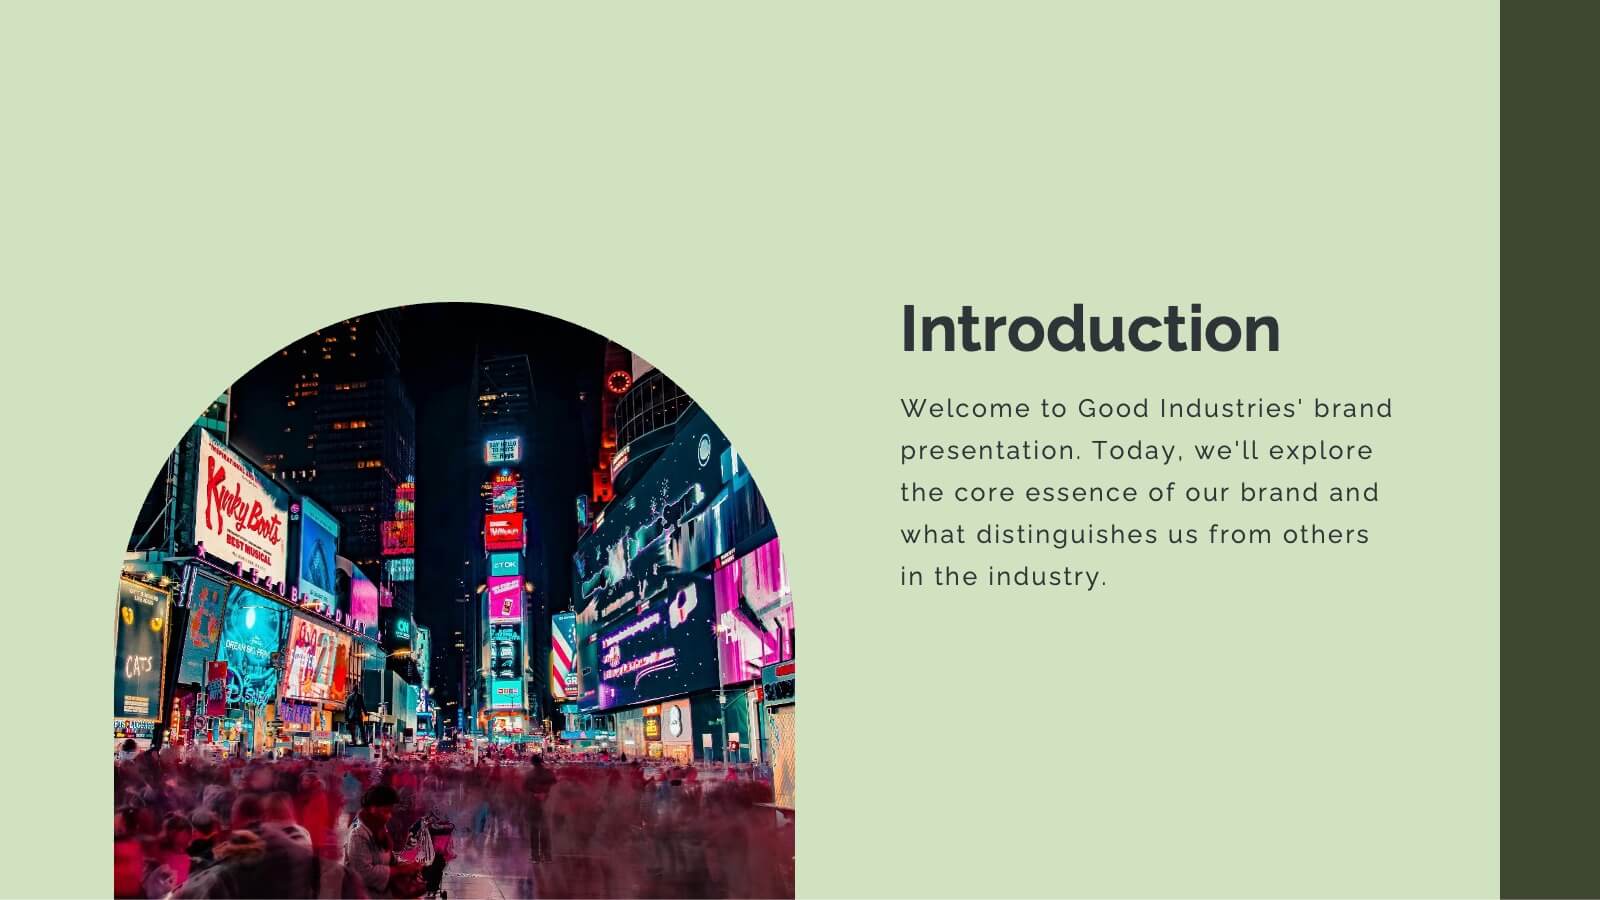
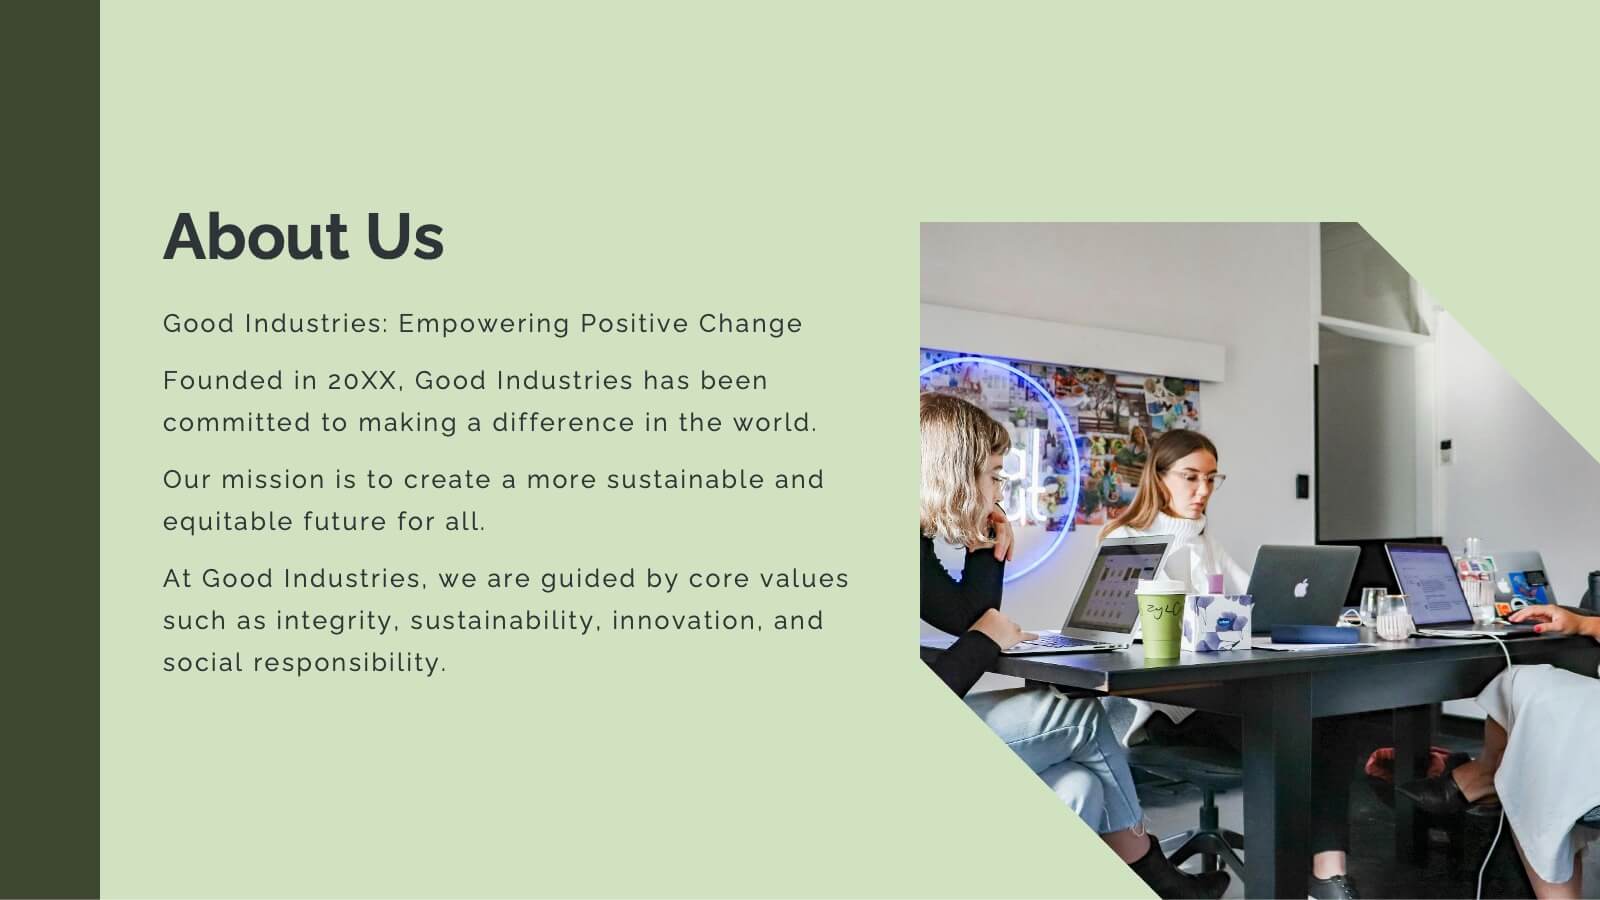
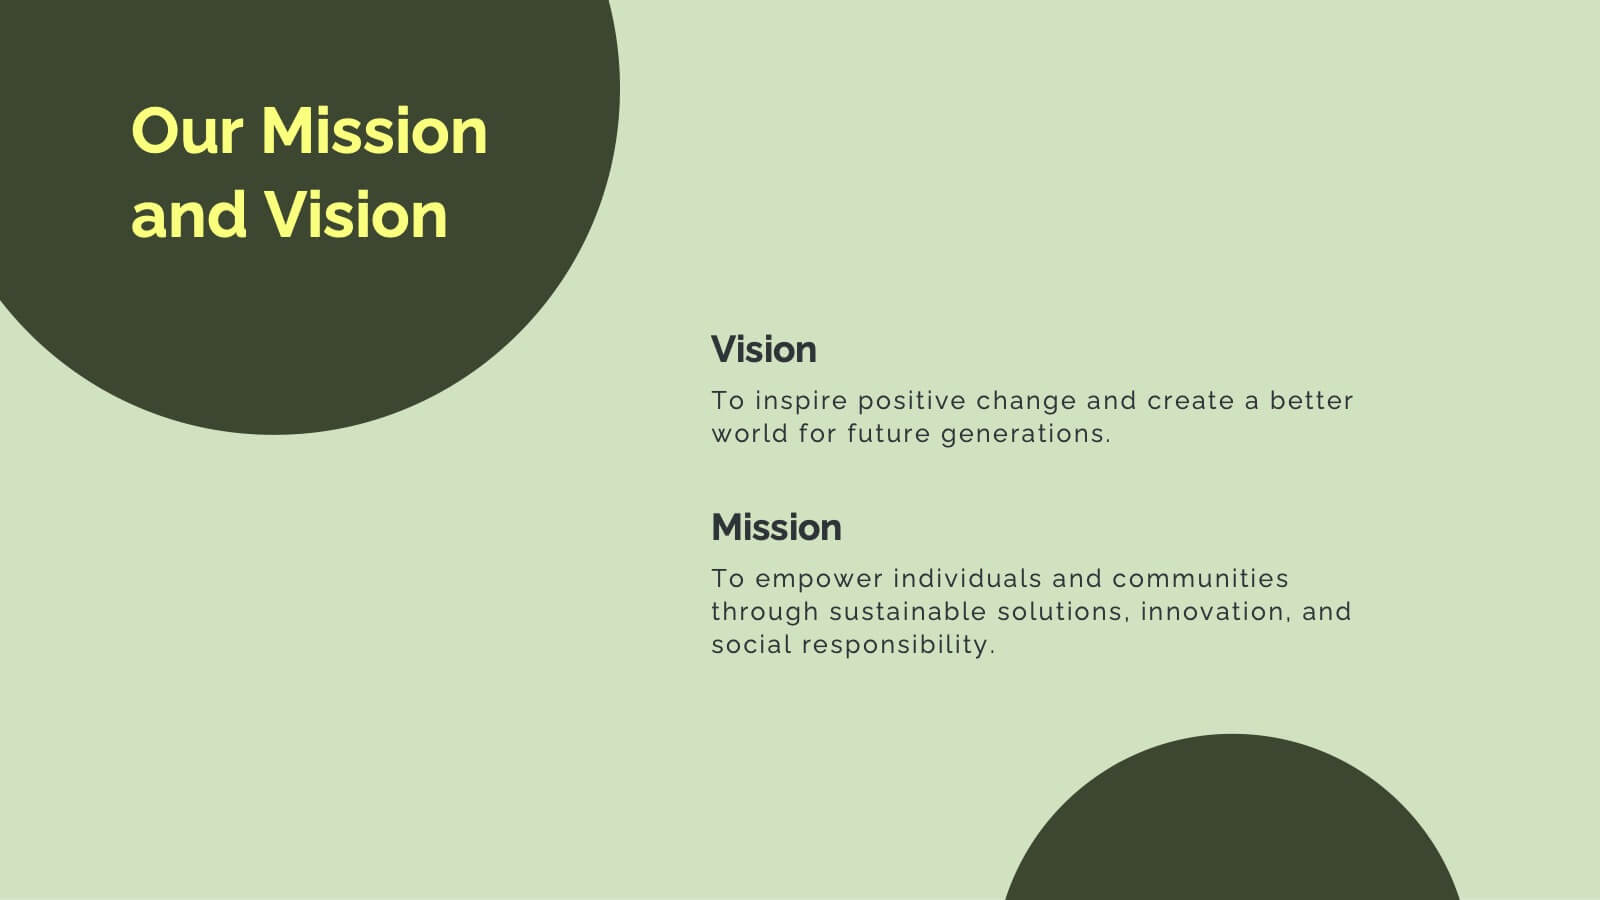
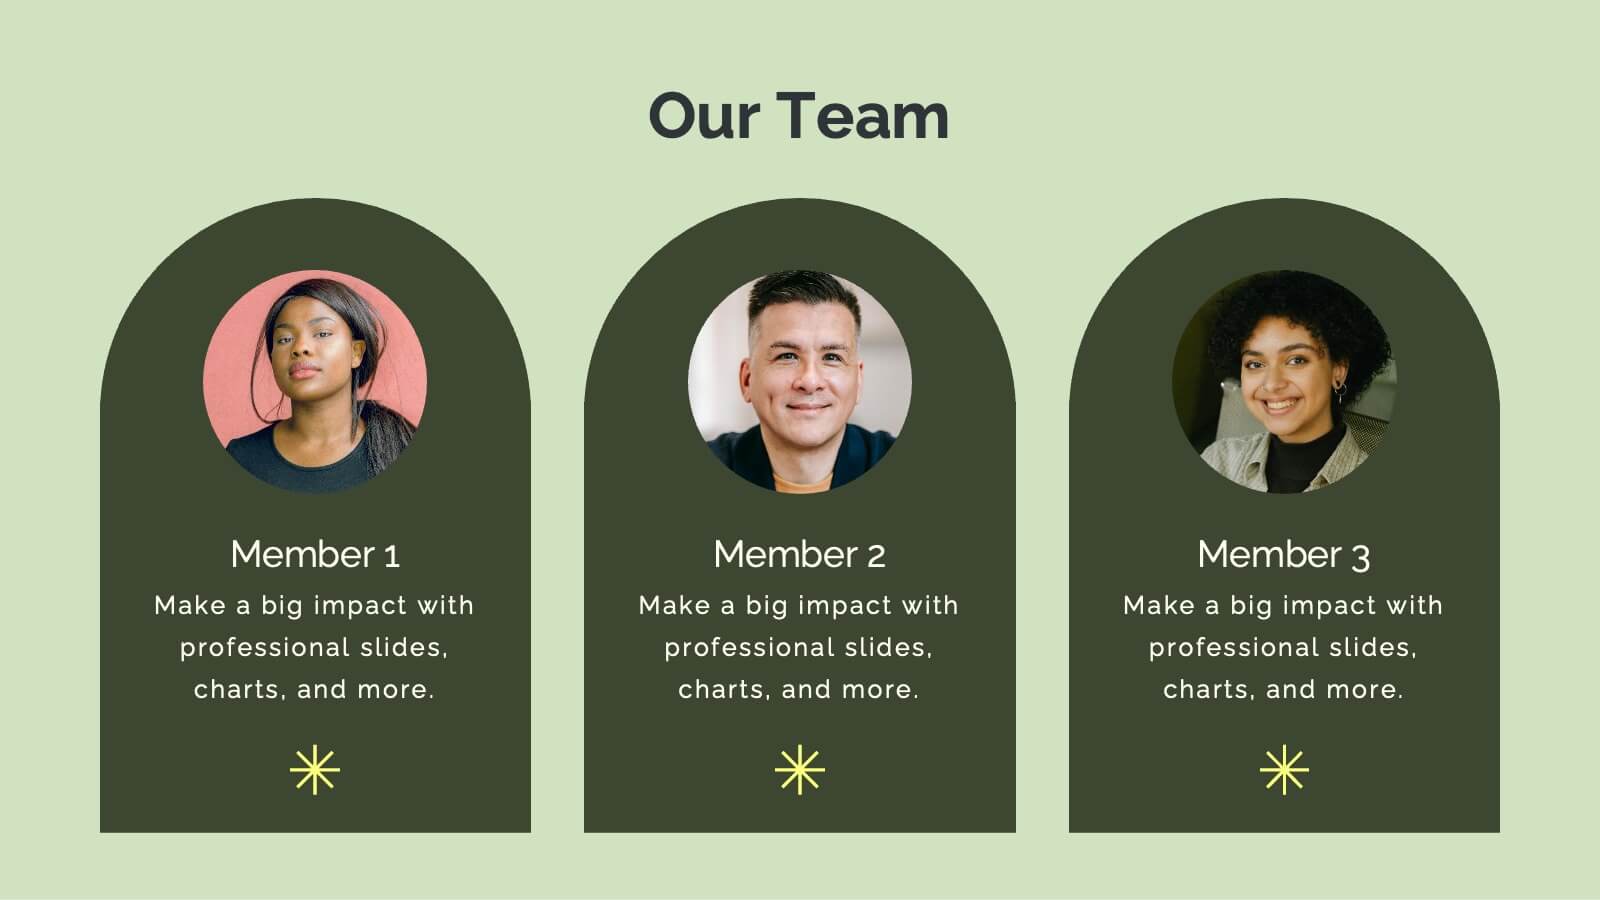
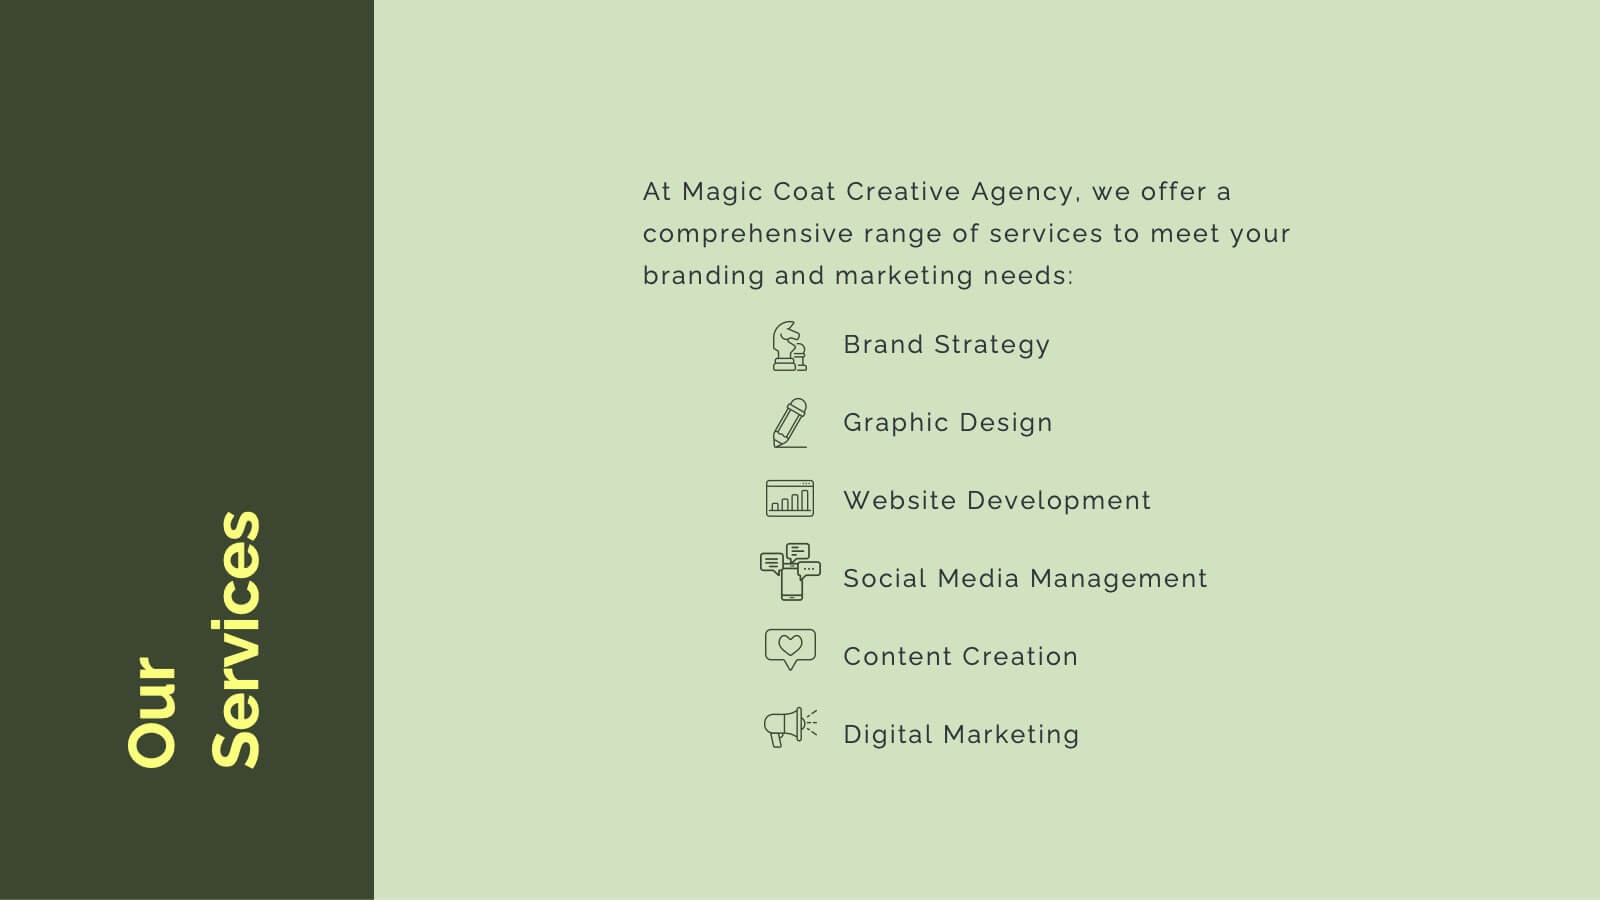
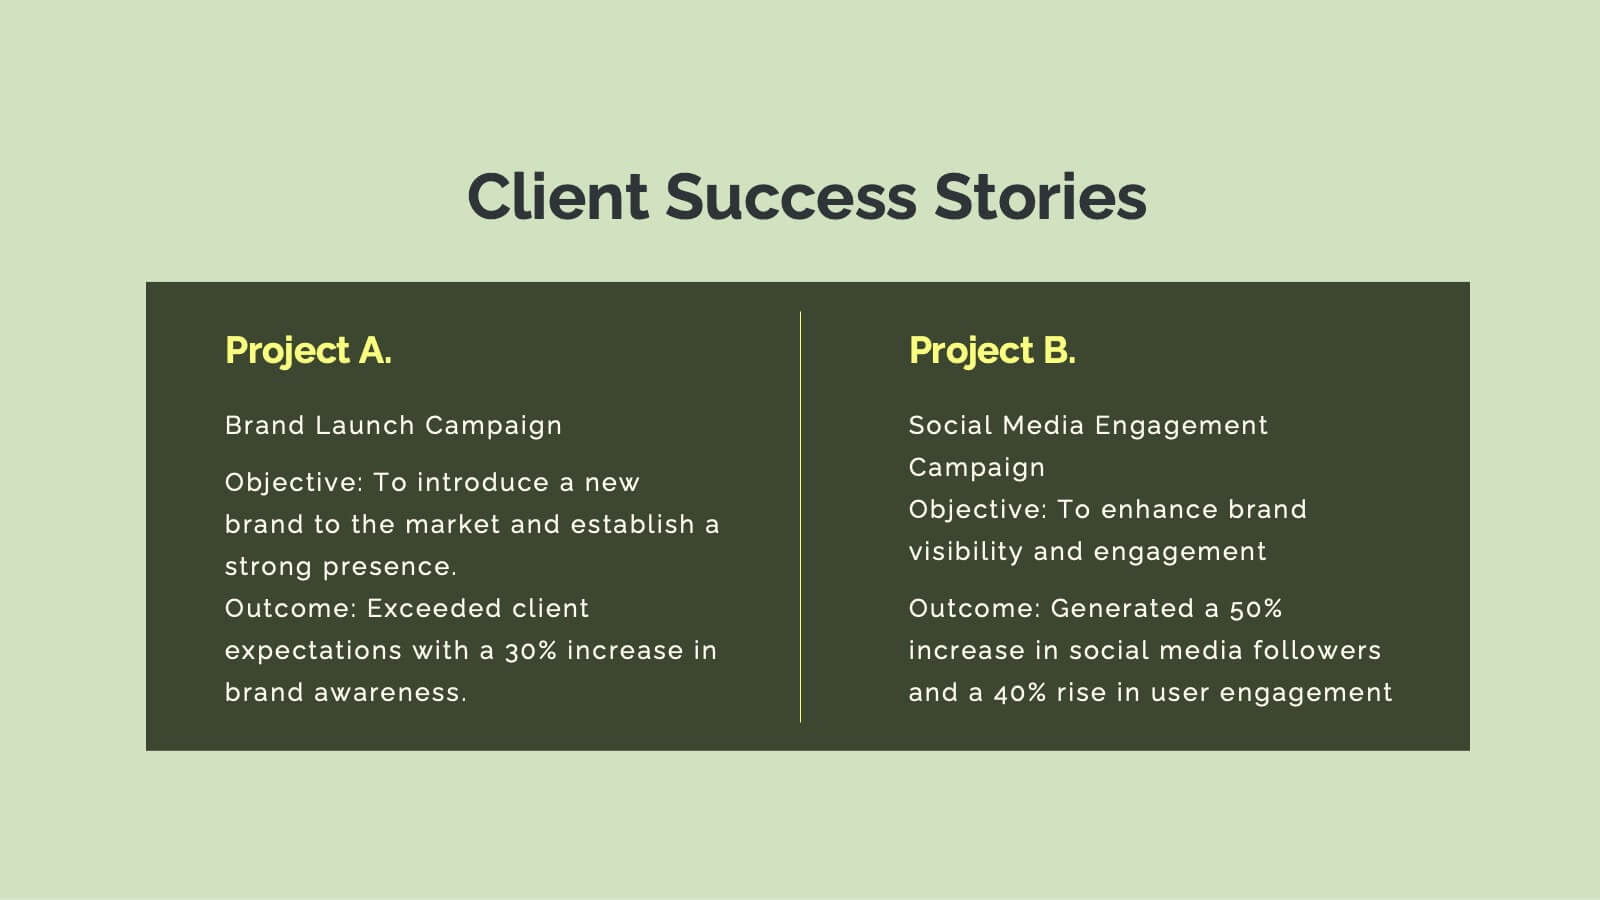
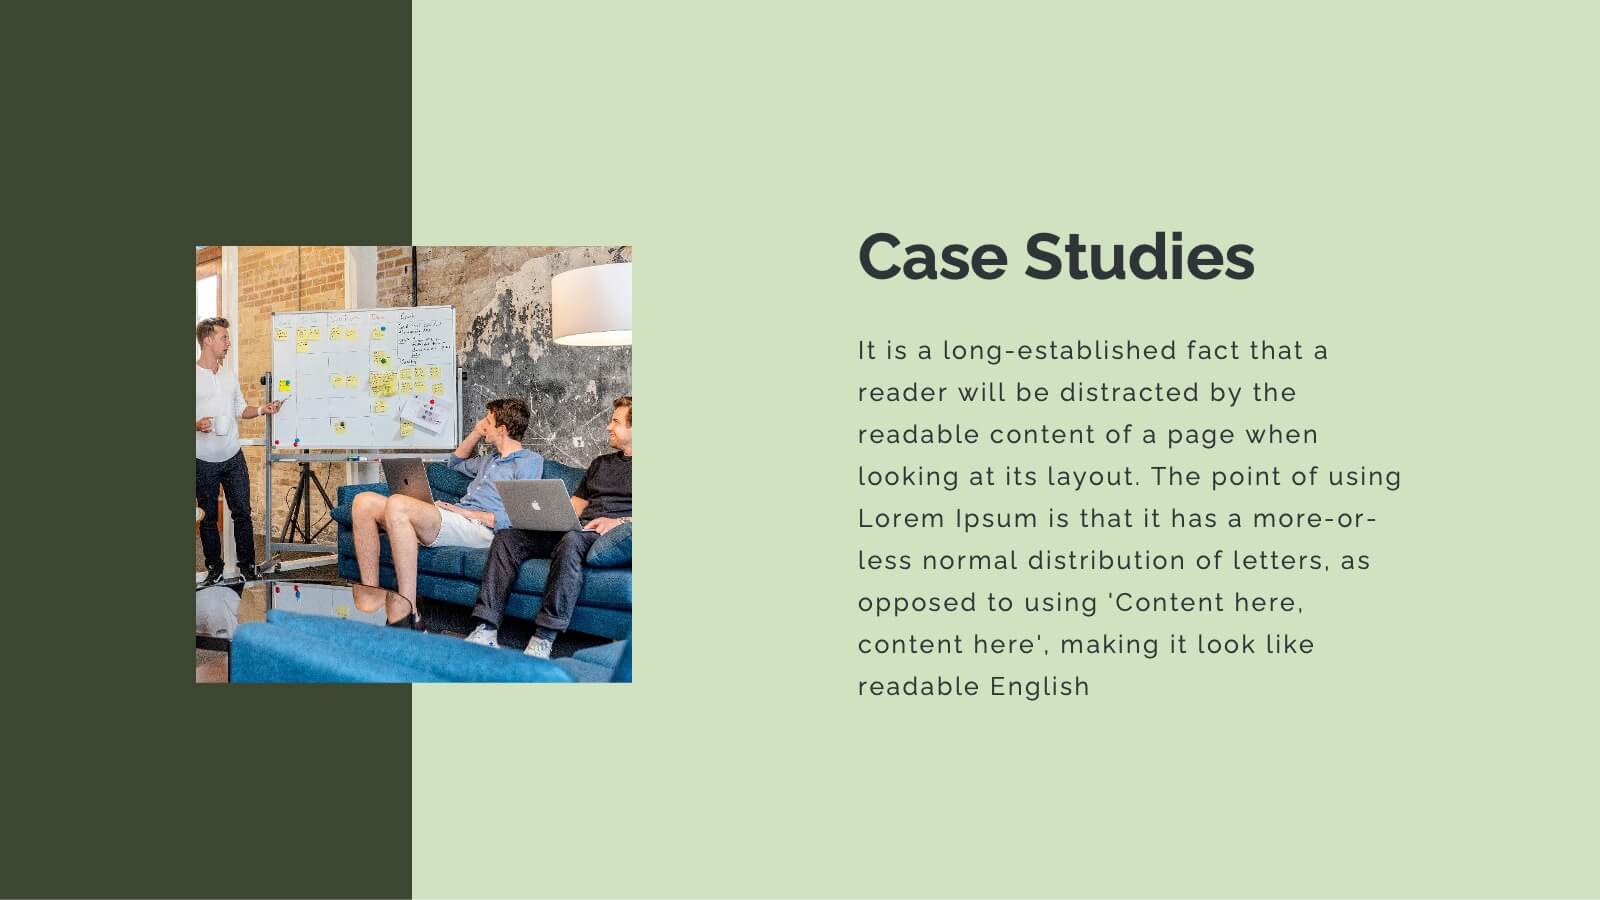
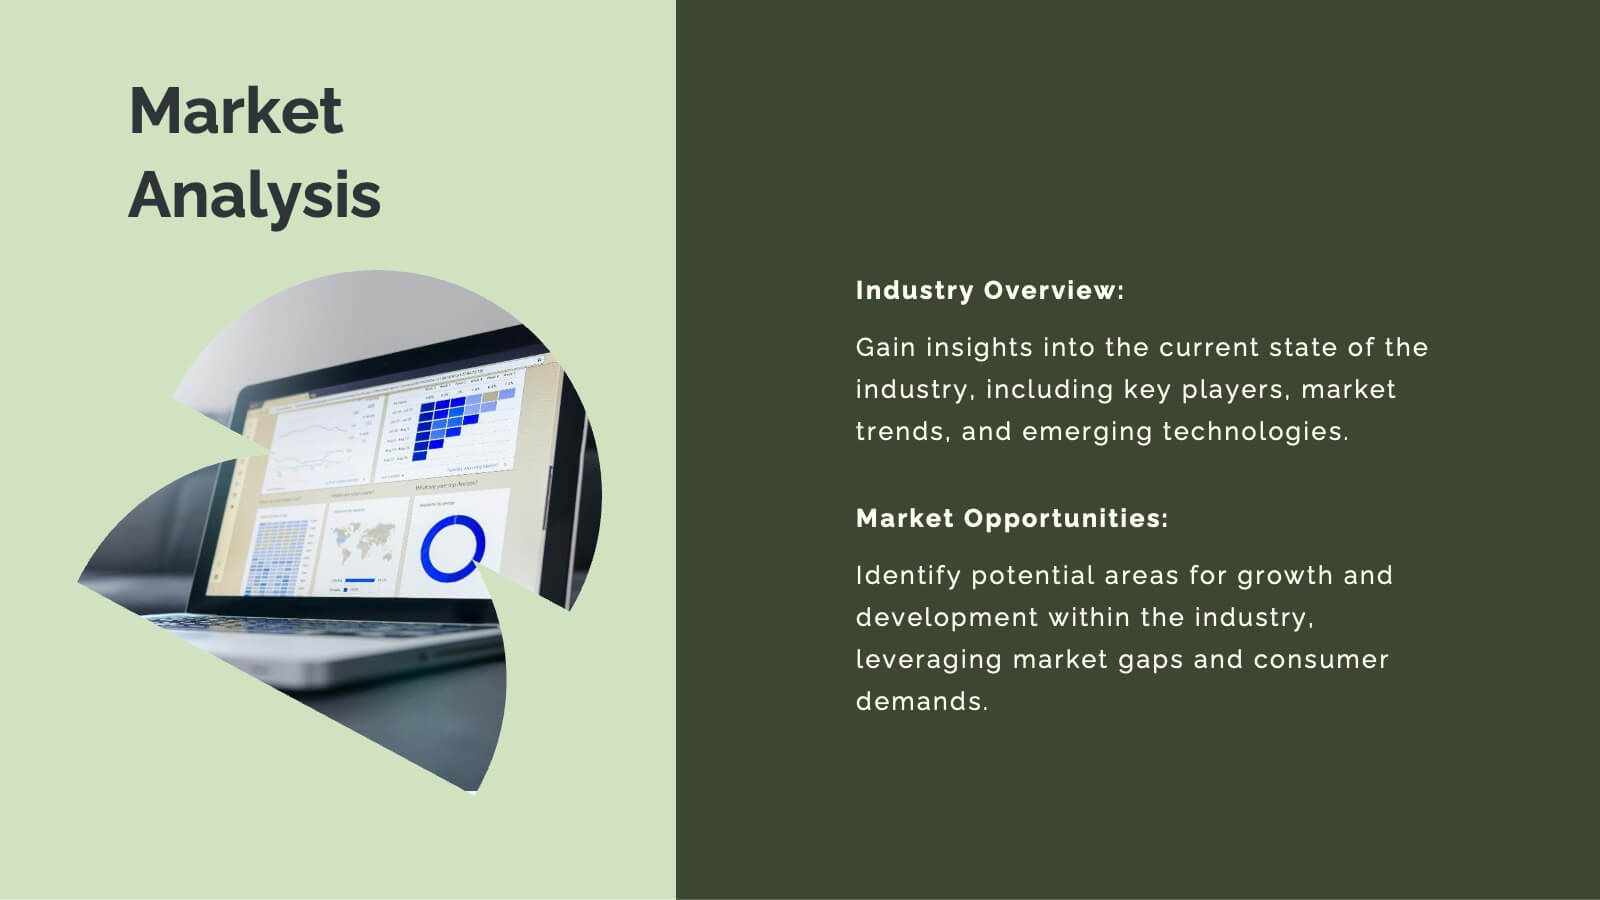
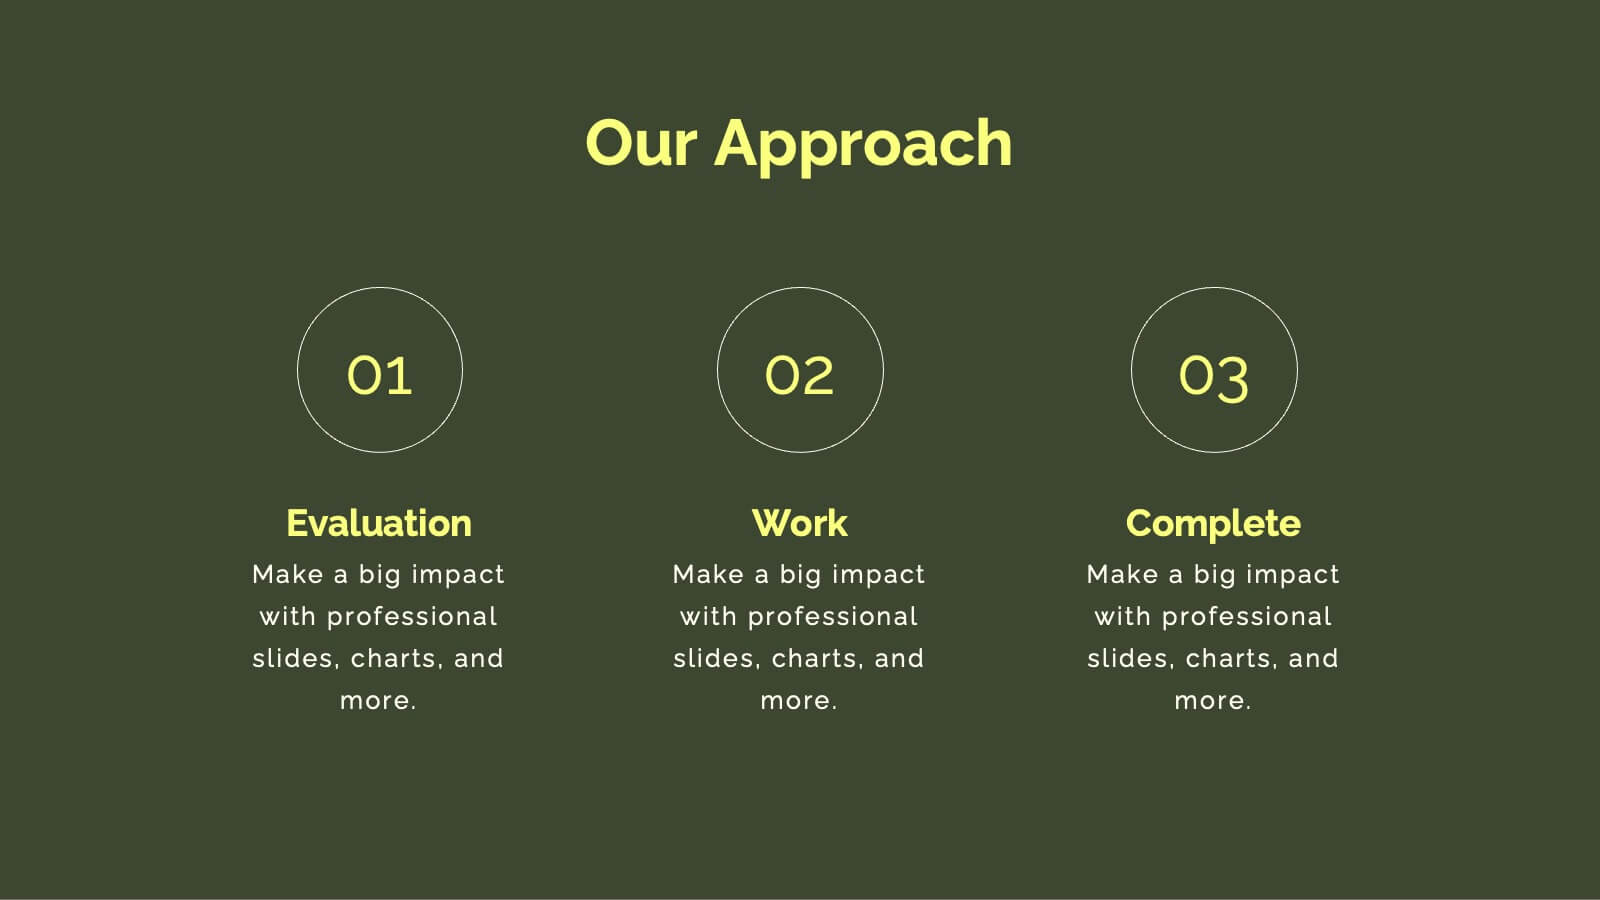
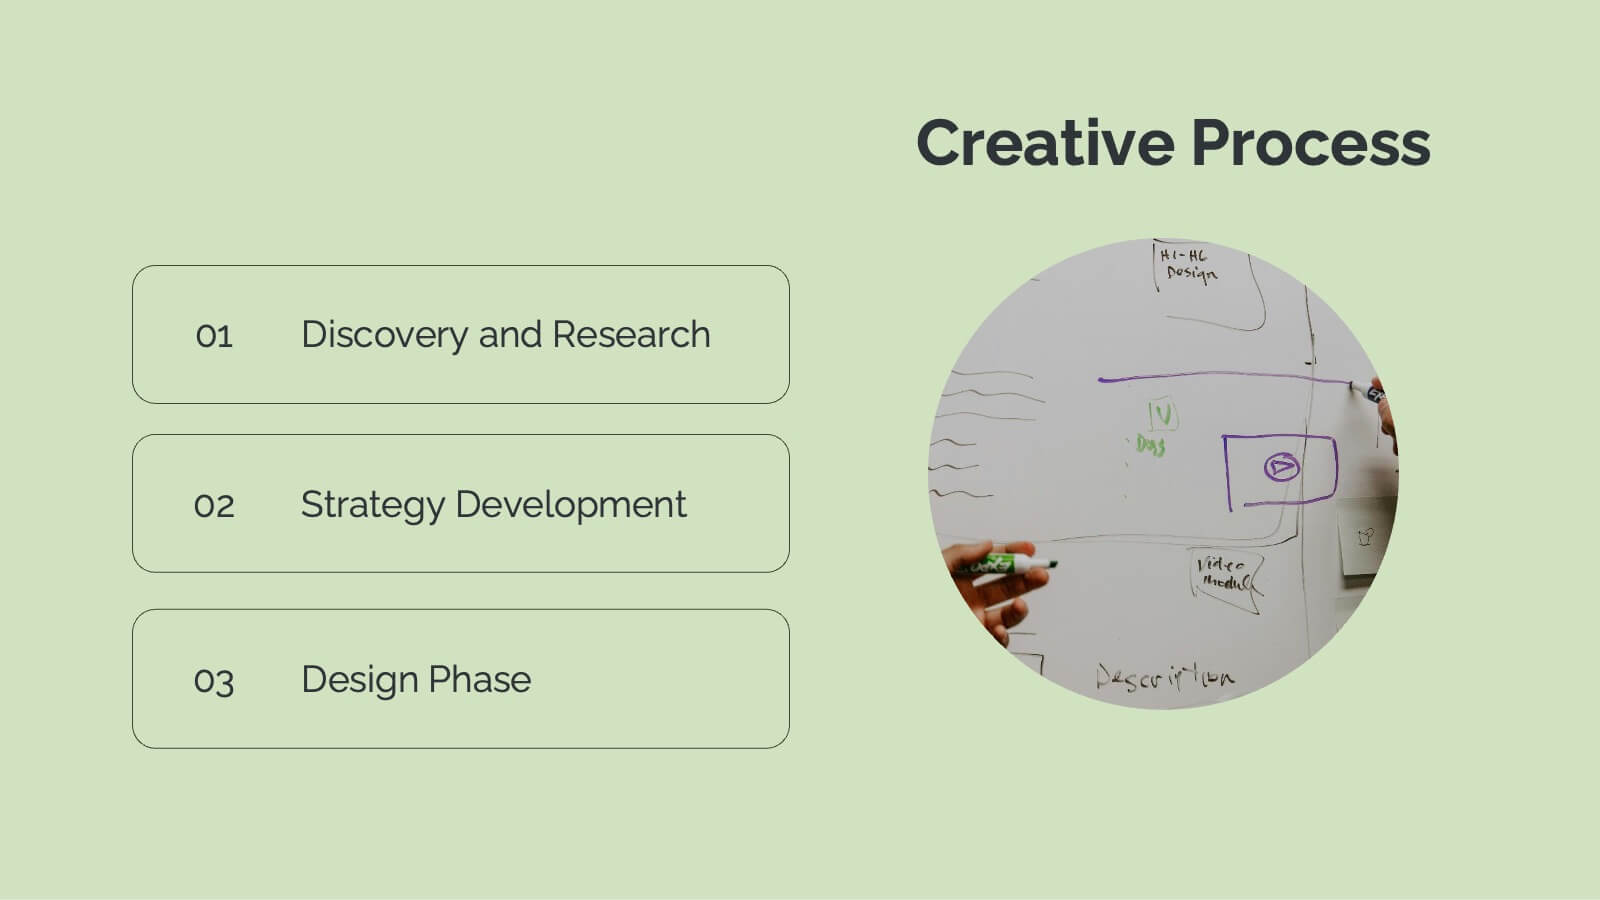
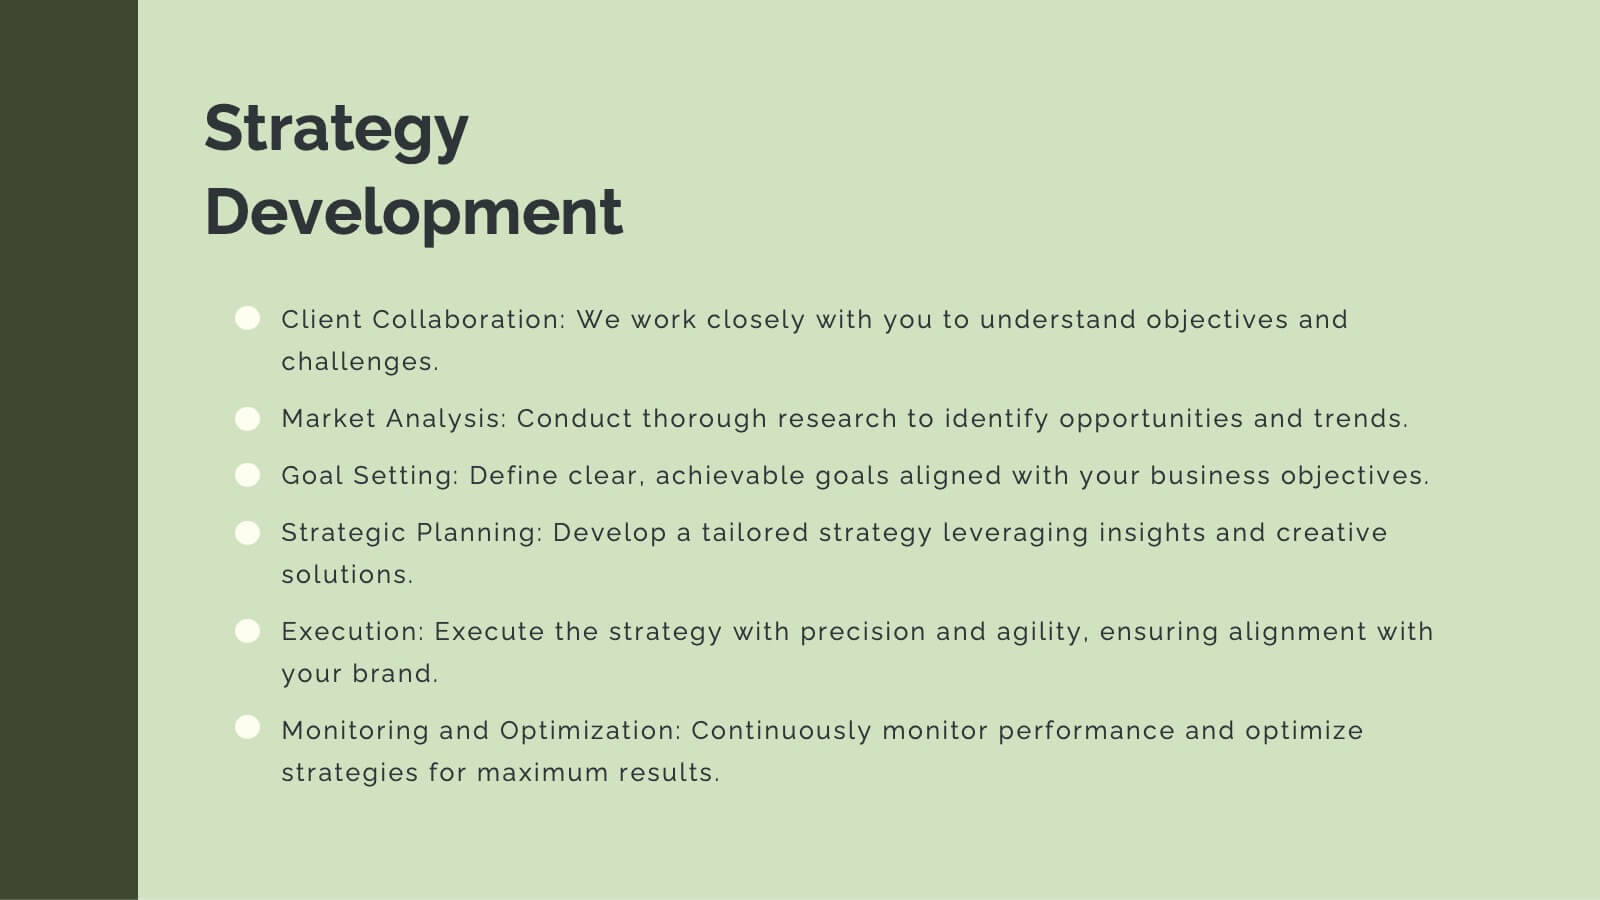
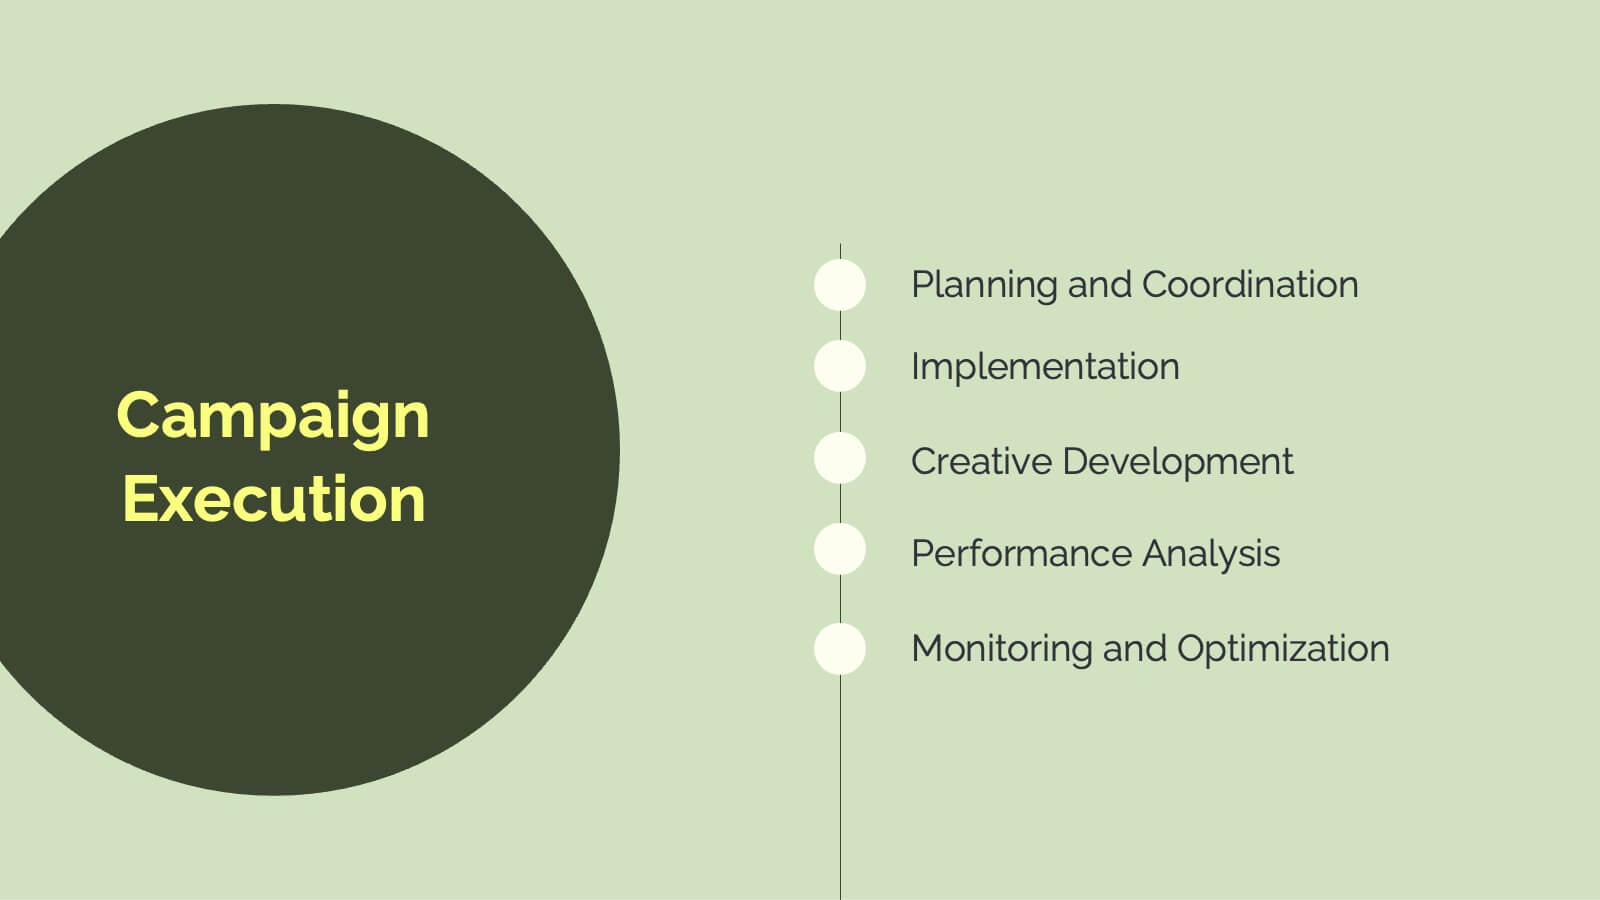
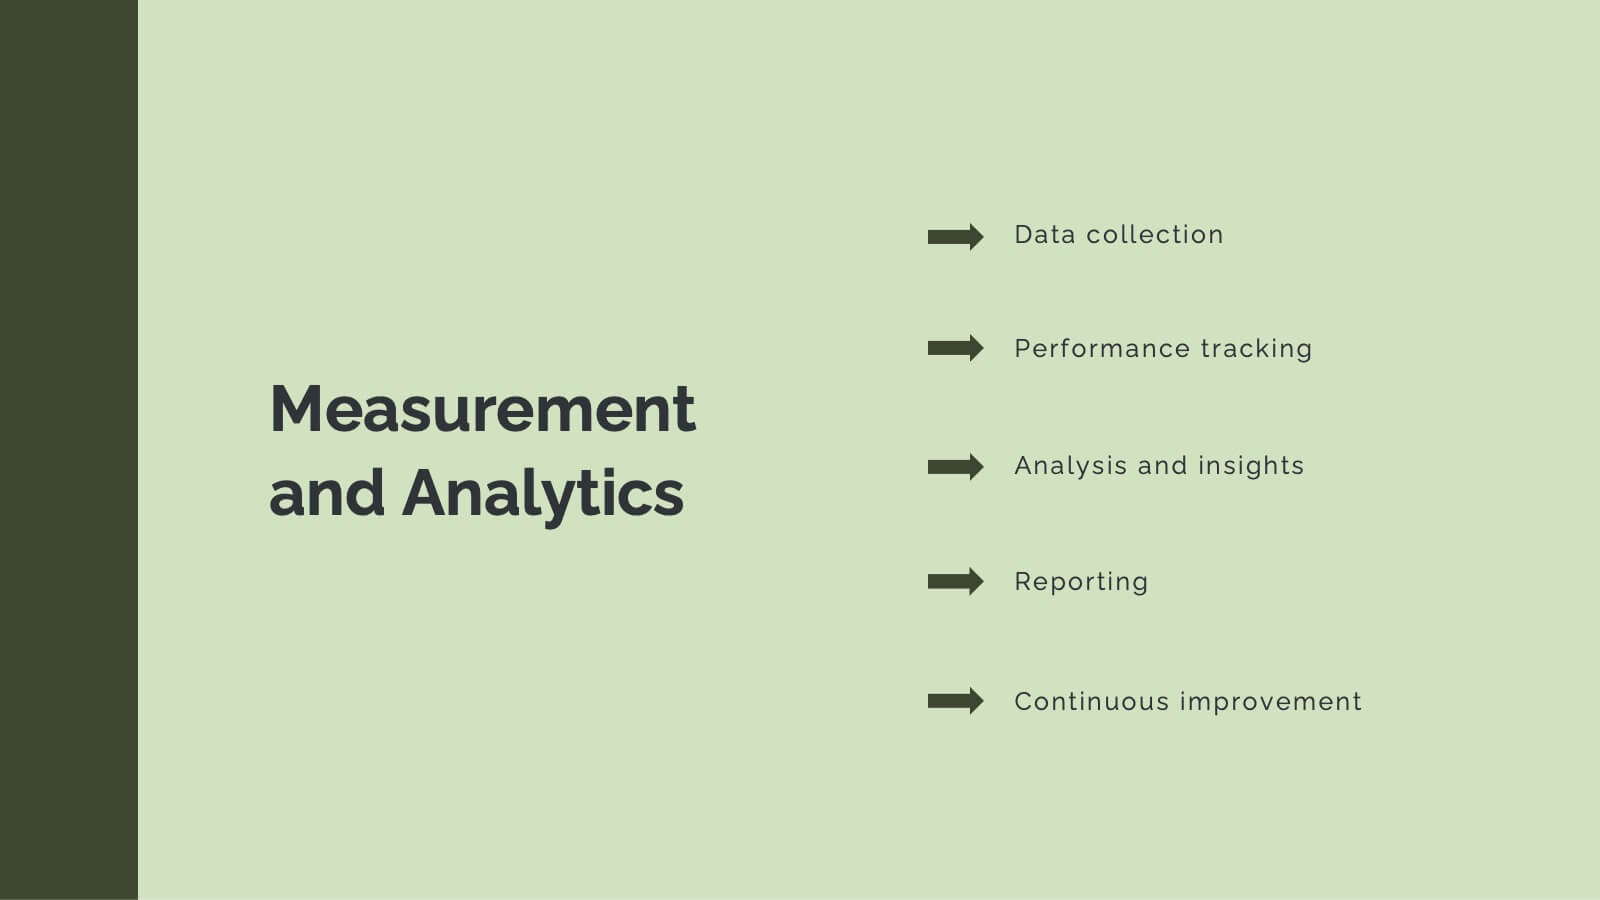
Horizon Advertising Agency Proposal Presentation
Elevate your advertising impact with this comprehensive agency proposal template. It’s meticulously designed to showcase your agency’s capabilities from strategic planning to creative execution, ensuring a persuasive presentation of services like market analysis, campaign strategies, and client success stories. Each slide is formatted to facilitate understanding and engagement, making it perfect for highlighting your team's expertise and unique approach. Compatible with major presentation platforms like PowerPoint, Google Slides, and Keynote, this template supports your efforts to secure new clients and projects seamlessly across various devices.


7 diapositivas
Geometric Steps Infographic
Unveil complex processes or hierarchies in a visually striking manner with the geometric steps infographic. Utilizing a blend of white, purple, yellow, red, and blue, this infographic captures attention through its distinct geometric shapes. This template design is an asset for educators, project managers, or business professionals aiming to detail a step-by-step guide or a layered approach in their presentations. Its compatibility across PowerPoint, Keynote, and Google Slides ensures a smooth integration into your deck, amplifying the comprehensibility and appeal of your content.


7 diapositivas
Food Infographic Presentation Template
A Food Infographic is a visual representation of information and data related to food. It can be used to educate people on various aspects of food such as its nutritional value, cooking methods, and recipes. This template can be presented in a variety of ways, including charts, graphs, illustrations, and images you can customize with your information. The goal of this Food Infographic is to make complex information about food more accessible and easy to understand for the general public. This template works with Powerpoint, Keynote, and Google Slides, so you can use it on any device.


3 diapositivas
Designing a Loyalty Program Presentation
Build stronger customer connections with a sleek, modern layout that highlights how reward systems drive retention and engagement. This design is perfect for visualizing loyalty strategies, program tiers, and user benefits with clarity and style. Fully editable and compatible with PowerPoint, Keynote, and Google Slides for effortless customization.


5 diapositivas
Pets Paradise Infographics
"Pets Paradise" is used to refer to a place or concept that revolves around providing a perfect and delightful environment for pets. These vertical infographics are designed to celebrate the wonderful world of pets and provide essential information for pet owners and enthusiasts. This infographic template covers a wide range of topics related to pets, showcasing their impact on human lives and the importance of responsible pet ownership. The templates present fascinating statistics about pet ownership worldwide. These infographics are fully customizable, allowing users to modify colors, fonts, and layout to align with their personal preferences.


5 diapositivas
Business Success Case Study Presentation
Showcase impactful results with the Business Success Case Study Presentation template. This structured layout highlights key milestones, challenges, and solutions in a visually engaging format, making it perfect for demonstrating business achievements and growth strategies. Fully editable and compatible with PowerPoint, Keynote, and Google Slides, it’s ideal for case studies, reports, and business reviews.


10 diapositivas
Financial Money Management Strategies Presentation
Break down your key financial strategies with this clear, wheel-style diagram. Perfect for outlining budgeting principles, savings goals, or investment methods, each segment includes space for titles and concise text. Ideal for financial advisors, consultants, or internal team planning. Fully customizable in PowerPoint, Keynote, and Google Slides.


7 diapositivas
Sports Training Camp Schedule Deck Presentation
Plan and present weekly training programs with this Sports Training Camp Schedule Deck. Featuring a clean, color-coded layout for Monday to Saturday, this slide helps coaches organize sessions clearly. Ideal for team meetings, camp planning, or fitness schedules. Fully editable in PowerPoint, Keynote, and Google Slides for easy customization.


4 diapositivas
Emerging AI Applications in Business
Showcase innovation with clarity using the Emerging AI Applications in Business Presentation. This sleek 4-step layout features modern icons and a profile-style AI illustration, perfect for outlining use cases such as automation, data insights, machine learning, or cloud-based AI solutions. Ideal for tech-driven strategy decks, startup pitches, or digital transformation briefings. Fully editable in PowerPoint, Keynote, and Google Slides.

21 diapositivas
Trident Product Development Plan Presentation
Present your product development strategy with this sleek, professional template! Highlight company overview, product features, and unique selling proposition. Ideal for showcasing market analysis, pricing strategy, and production process. Perfect for developers and project managers. Compatible with PowerPoint, Keynote, and Google Slides.


5 diapositivas
Space Science Infographics
Space science, also known as astronomy, is the scientific study of celestial objects, phenomena, and the physical universe beyond Earth. These infographic templates explore various aspects of space science and astronomy. They are designed to present complex concepts and data in a visually engaging format, making it accessible to a wide range of audiences. These infographics incorporate stunning cosmic illustrations and visuals to represent celestial bodies, space phenomena, and scientific concepts related to space science. They covers a range of key topics in space science, such as black holes, the solar system, space exploration, and more.


2 diapositivas
Breast Cancer Awareness Infographics Presentation
Empower your message with a bold, meaningful design that spreads awareness and inspires action. This impactful layout uses visual balance and clear data points to highlight key statistics, health information, or campaign goals. Fully editable and compatible with PowerPoint, Keynote, and Google Slides for effortless customization and professional presentations.


5 diapositivas
Contemporary History Timeline Infographics
Immerse your audience in a visual journey through time with the contemporary history timeline infographics template. Rendered in a sophisticated blue and white palette, this resource is designed to add a creative twist to historical chronology, making it an educational yet captivating. History educators, academic students, and researchers will find this vertical-style infographic ideal for distilling complex timelines into engaging visual narratives. Compatible with Powerpoint,Keynote, and Google Slides. This template is equipped with sleek graphics, thematic icons, and dedicated image placeholders specifically tailored for historical content.


6 diapositivas
World Market Presence and Expansion Map Presentation
Showcase your company’s global footprint with this World Market Presence and Expansion Map. Visually highlight key regions, market activity, or strategic territories. Perfect for investor decks, global overviews, or international growth strategies. Fully editable in PowerPoint, Keynote, and Google Slides for seamless integration into your professional presentation workflow.


7 diapositivas
Scrum Sprints Planning Presentation
Kick off your workflow with a dynamic visual that maps out every phase of your team’s process in a clean, structured layout. This presentation helps explain planning cycles, task sequencing, and collaborative decision-making in a clear, engaging format. Fully compatible with PowerPoint, Keynote, and Google Slides.


5 diapositivas
Elegant Abstract Watercolor Layout Presentation
Add artistic flair to your message with the Elegant Abstract Watercolor Layout Presentation. Featuring hand-drawn brush elements and delicate color drops, this design blends creativity with clarity. Ideal for storytelling, brand values, or conceptual visuals. Fully editable in PowerPoint, Keynote, and Google Slides for stylish and customizable presentations.