


Características


¿Tienes alguna pregunta?
Recomendar


6 diapositivas
Travel Tips Infographic
By following travel tips, you can enhance your travel experience, mitigate potential challenges, and make the most of your adventures. This infographic template is designed to provide travelers with essential tips and guidelines for a successful and enjoyable trip. Whether you're planning a vacation, business trip, or backpacking adventure, this infographic offers valuable information to help you make the most out of your travel experience. This template is a valuable tool for enhancing travel experiences and ensuring a smooth and memorable trip. Compatible with Powerpoint, Keynote, and Google Slides.


6 diapositivas
Iceberg Business Infographic
Delve beneath the surface with our Iceberg Business Infographic, perfect for Powerpoint, Google Slides, and Keynote. This infographic is designed to illustrate the underlying factors that impact an organization's success. The iceberg metaphor visually represents the concept that only a small part of a company's situation is visible above the surface, while much more is hidden below. The customizable segments can be used to detail various aspects of business operations, risks, and opportunities that are not immediately apparent. By employing this Iceberg Business infographic, you can effectively communicate the complexities of business strategies.


4 diapositivas
Interactive Learning Models Presentation
Illustrate step-by-step learning journeys with this creative, hand-drawn infographic layout. Ideal for training modules, course planning, or educational workflows, this slide highlights three key insights with interactive appeal. Fully editable in PowerPoint, Keynote, and Google Slides—perfect for educators, trainers, and instructional designers looking to boost engagement.


7 diapositivas
Feedback Control Infographic
Feedback is information, reactions, or comments given to individuals or entities regarding their performance, actions, products, services, or behaviors. This infographic template is an educational odyssey through the world of precision and control, guiding you through the principles and applications of feedback mechanisms. Compatible with Powerpoint, Keynote, and Google Slides. This template displays a target icon with decreasing error rings, illustrating the goal of minimizing errors through feedback control for optimal performance. Display icons representing sensors and actuators, emphasizing their pivotal roles in feedback control systems.


5 diapositivas
Types of Coffee Infographics
There are many different types of coffee, with varying tastes and brewing methods. This template features unique vertical Infographics as visual representation of different types of coffee that are popular in various parts of the world. These are designed to provide information on the different types of coffee, their origins, brewing methods, and taste profiles. You can also provide information on the ingredients used to make the coffee, such as the milk, cream, and sugars. These infographics are very visually pleasing, the icons, images, and color schemes are associated with coffee. Include your statistics on the popularity of different types of coffee and how they are consumed!


5 diapositivas
Skills Gap Assessment Presentation
Spot talent strengths and uncover hidden weaknesses with a clean, visual layout that makes workforce insights easy to understand. This presentation helps teams evaluate current abilities, identify missing competencies, and plan targeted development. Ideal for HR, training, and leadership reviews. Fully compatible with PowerPoint, Keynote, and Google Slides.


6 diapositivas
Green Innovation and Eco Impact Presentation
Present your sustainability initiatives with this circular eco infographic. Ideal for showcasing six stages of environmental impact, green innovation, or lifecycle analysis. Features clean, modern icons and color-coded segments. Fully editable in PowerPoint, Keynote, and Google Slides—perfect for corporate ESG updates, eco campaigns, or environmental project planning.


6 diapositivas
Decision-Making Using Tree Diagrams Presentation
Clarify complex decisions with the Decision-Making Using Tree Diagrams Presentation. This slide design features a clear, hierarchical structure that helps visualize choices, outcomes, and decision paths step by step. Perfect for business strategy, risk analysis, or logic-based planning. Fully editable in PowerPoint, Keynote, and Google Slides.


6 diapositivas
Employee Welcome and Orientation Guide Presentation
Welcome new hires with clarity using the Employee Welcome and Orientation Guide Presentation. Featuring a timeline-style layout with flag icons, this design helps outline key onboarding stages—from introductions and training to policies and first-week expectations. Easy to customize in Canva, PowerPoint, Keynote, or Google Slides for a smooth employee experience.


5 diapositivas
Business Model Canvas Overview Presentation
Streamline your business strategy with the Business Model Canvas Overview Presentation. Designed for entrepreneurs, startups, and strategists, this template visualizes key partners, activities, value propositions, customer segments, revenue streams, and more. Fully editable for PowerPoint, Keynote, and Google Slides, ensuring a structured and professional business plan presentation.


5 diapositivas
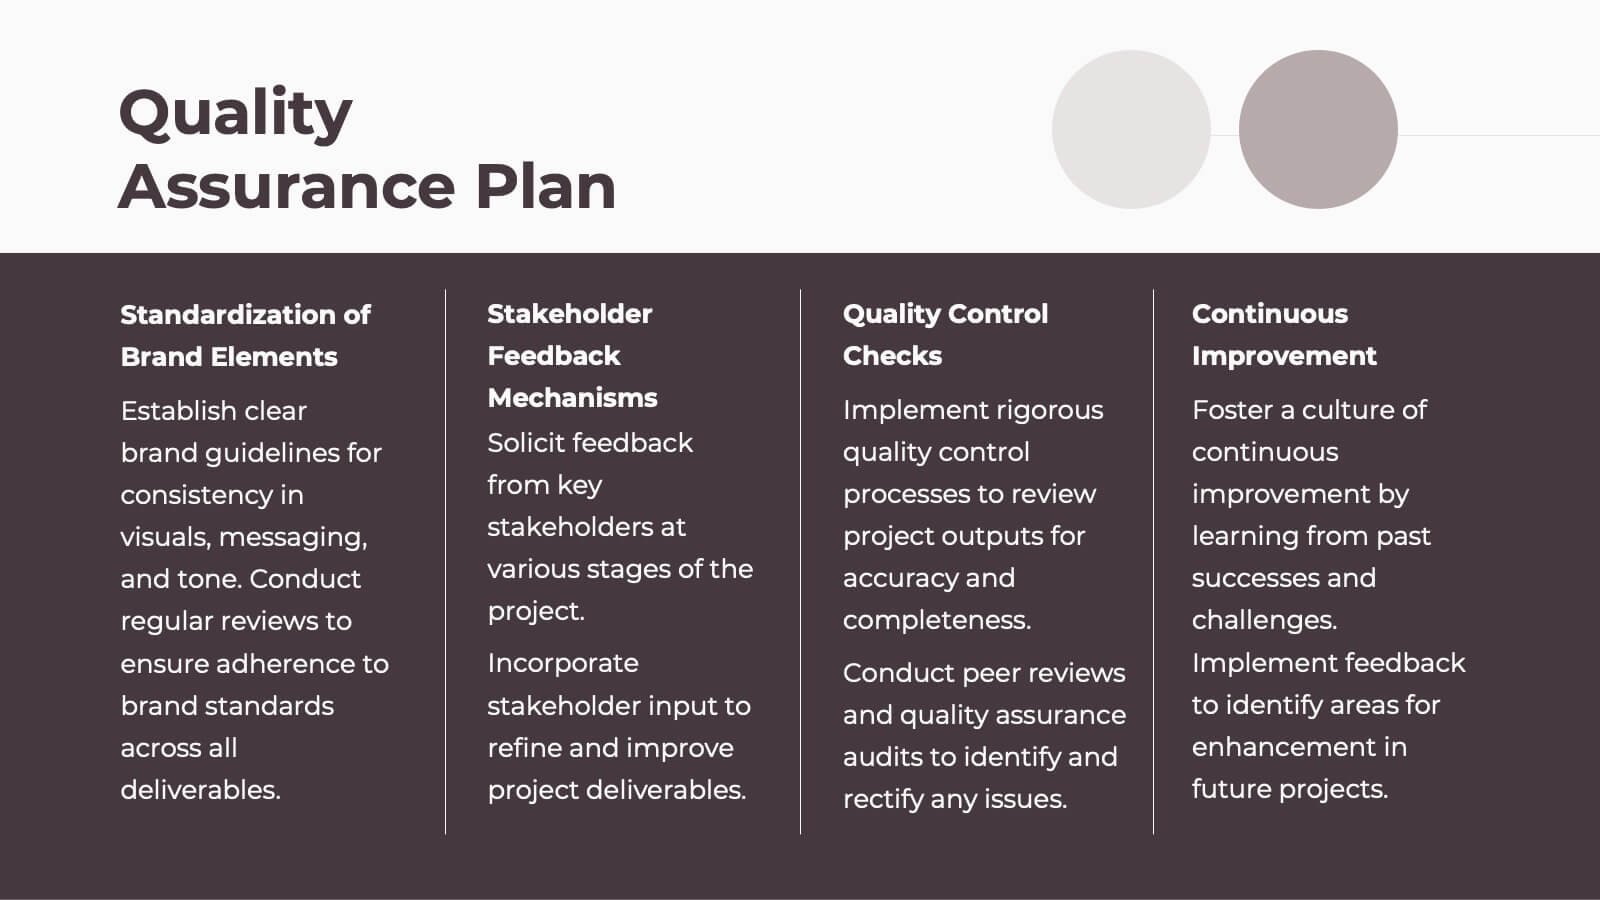
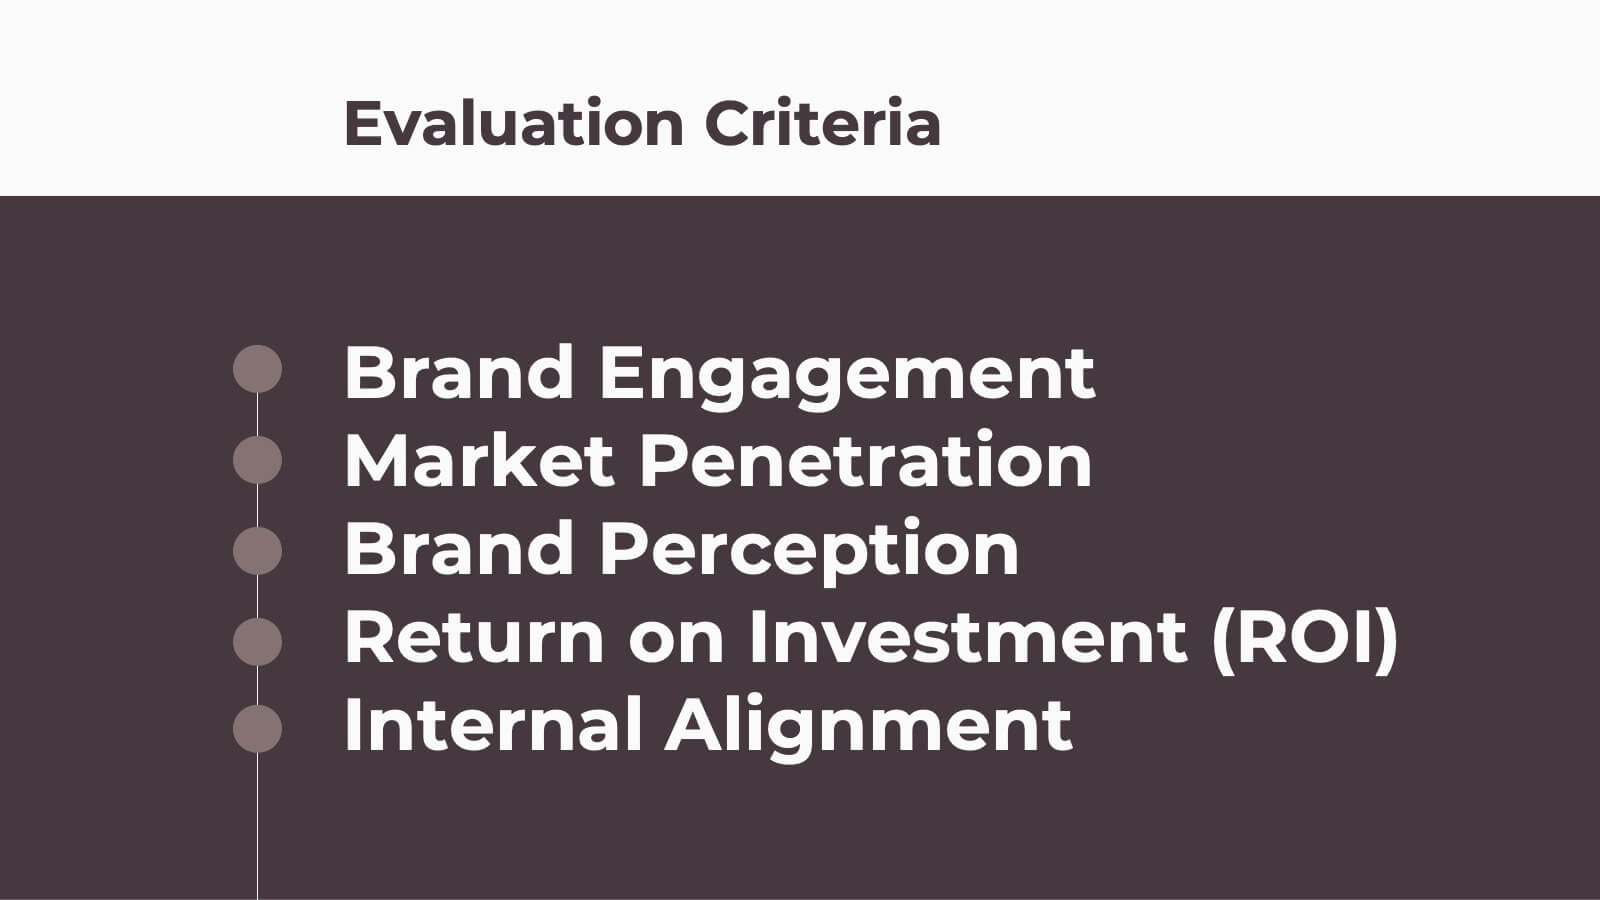
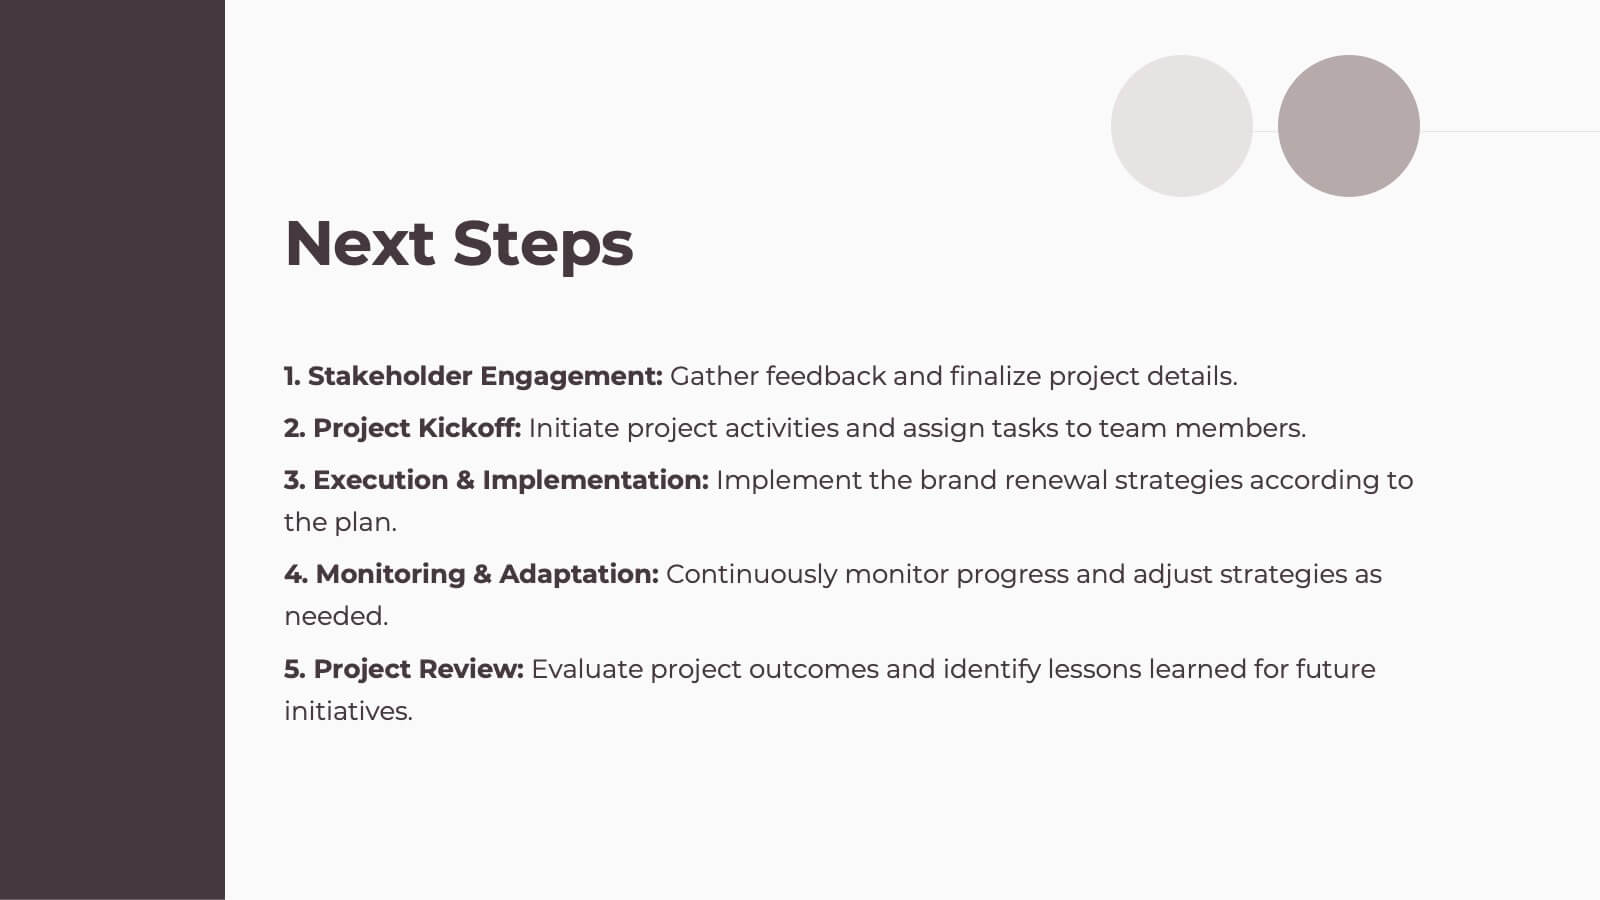
Brief Overview of Key Insights Presentation
Present essential information at a glance with this Brief Overview of Key Insights slide. Designed around a bold key graphic, this layout highlights up to four major takeaways with icons and concise descriptions. Ideal for summaries, analysis highlights, or recommendations. Fully editable in Canva, PowerPoint, or Google Slides.


6 diapositivas
Framework Version Infographic
A framework infographic is a visual representation that outlines a structured approach, model, or framework for understanding a concept, solving a problem, or making decisions. This infographic template involves visually presenting different versions of a software or system framework along with their features and benefits. Summarize the improvements and benefits introduced by each framework version. This template provides a clear overview of the evolution of the framework and how each version brought value to users. By using icons, graphics, and concise descriptions, you can make the information easily digestible and engaging for your audience.


5 diapositivas
Agile Workflow and Role Breakdown Presentation
Visualize Agile processes with this streamlined workflow and role breakdown diagram. Perfect for Scrum teams and project leads, this layout maps out five stages using arrows, icons, and a circular feedback loop. Easily editable in PowerPoint, Keynote, and Google Slides to fit any development cycle or team structure.


21 diapositivas
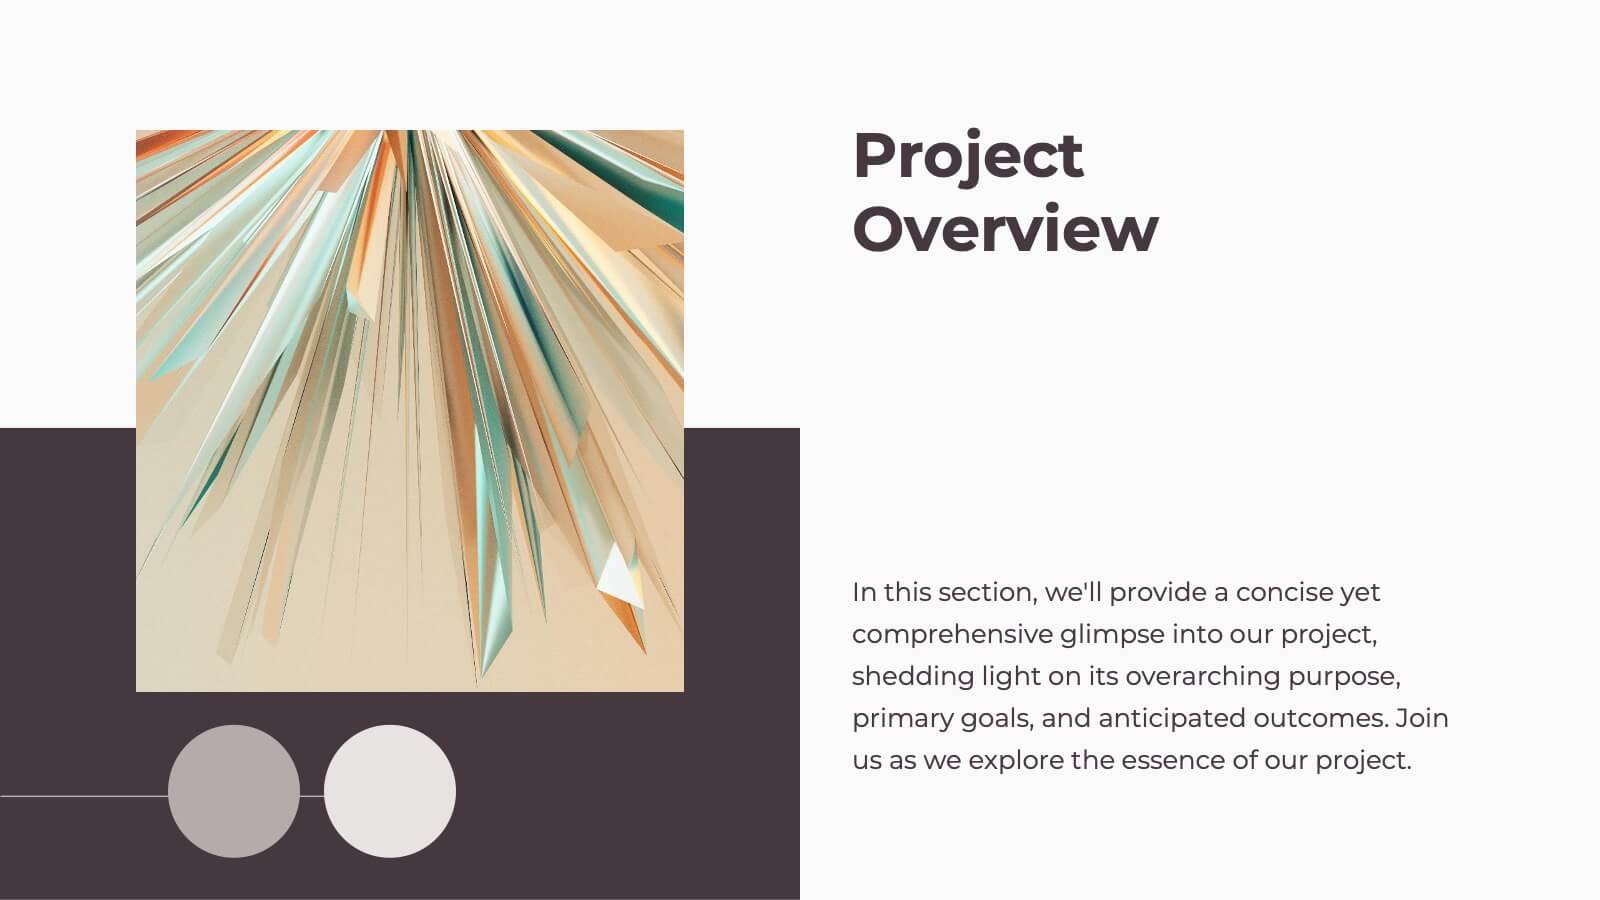
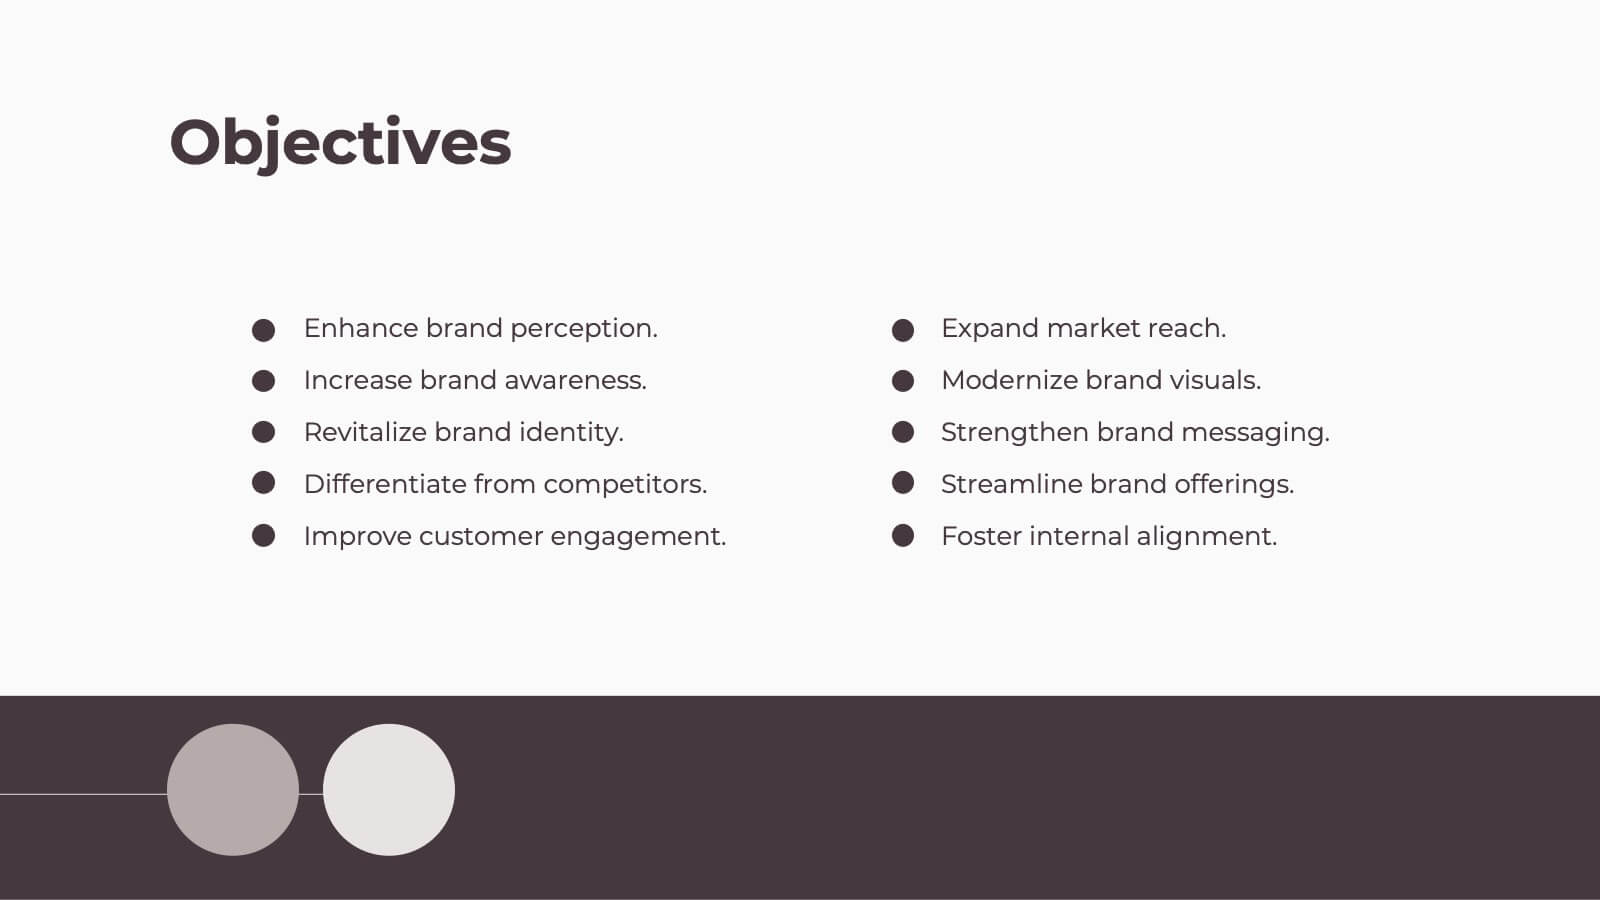
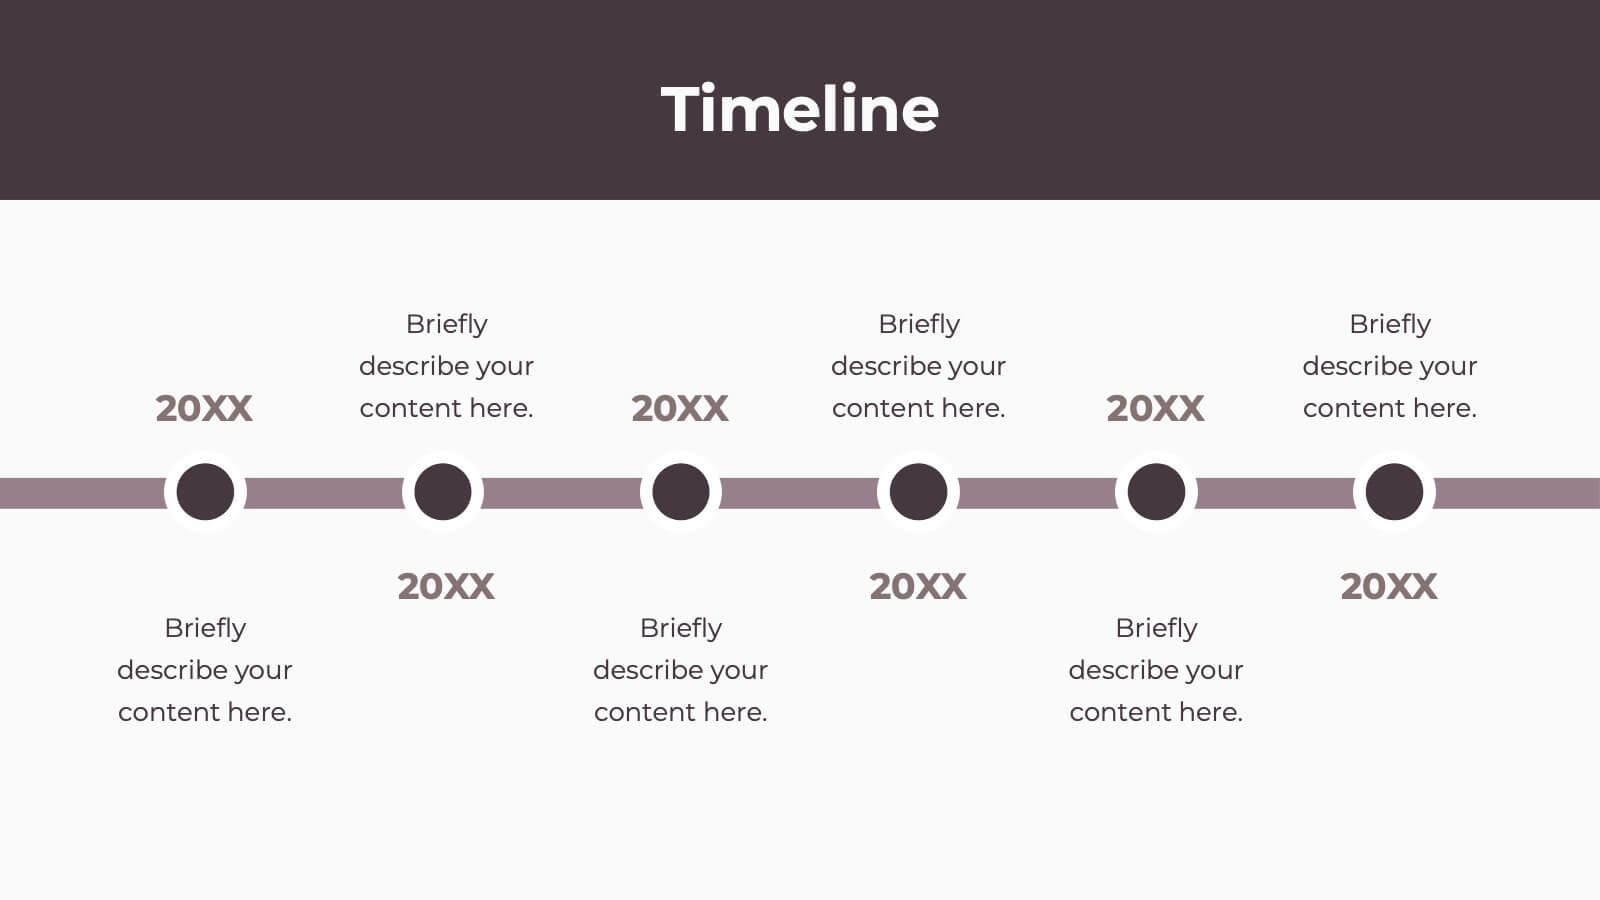
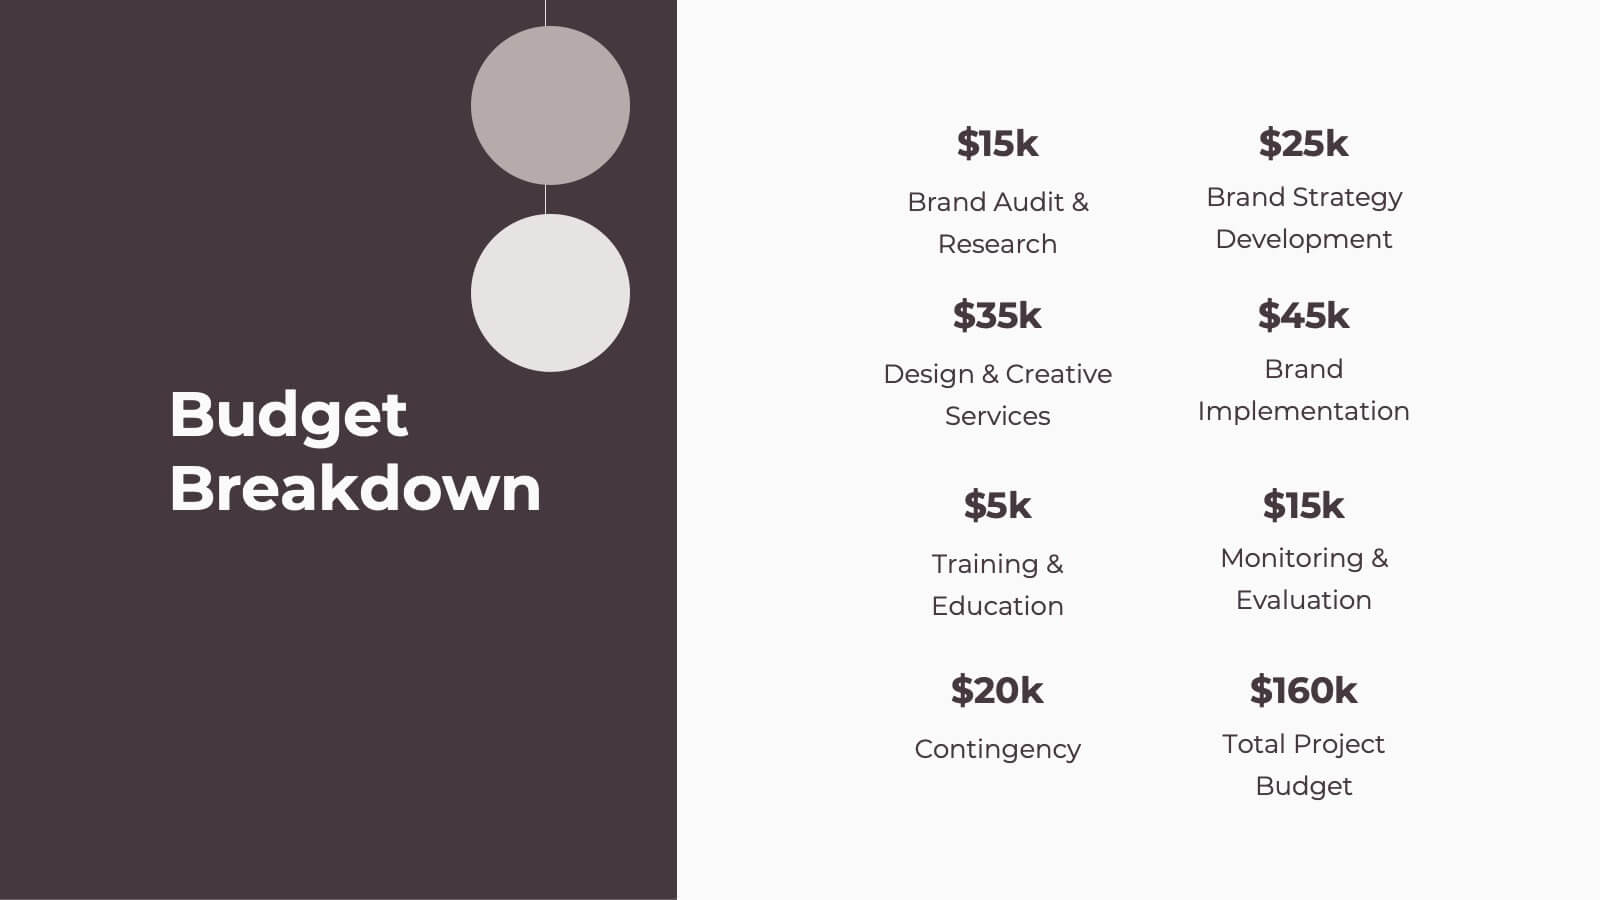
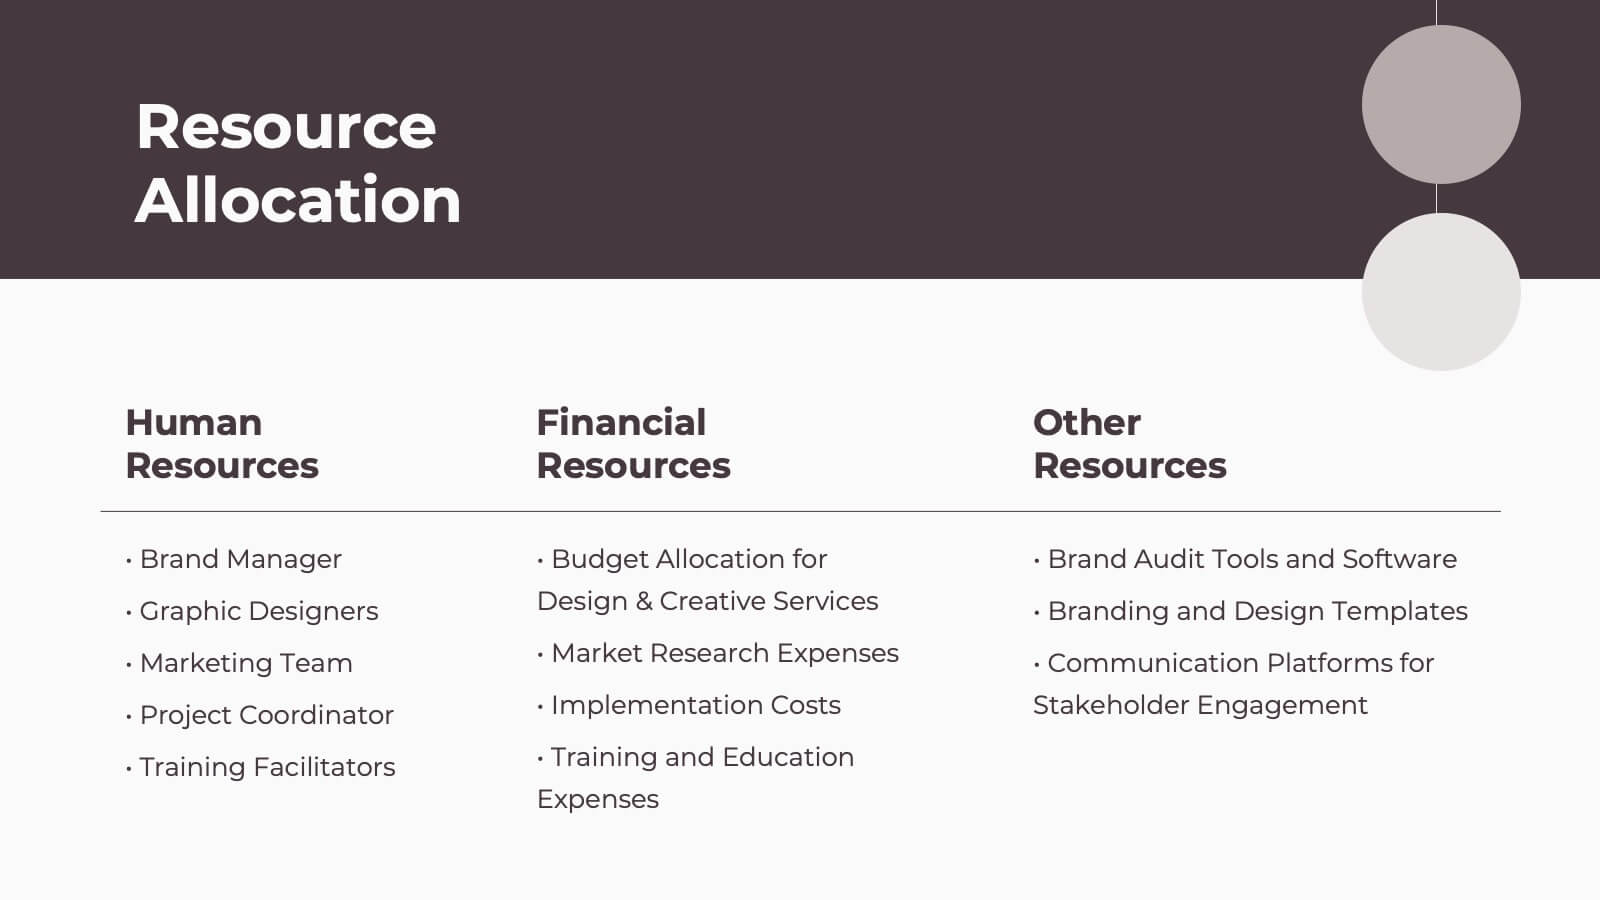
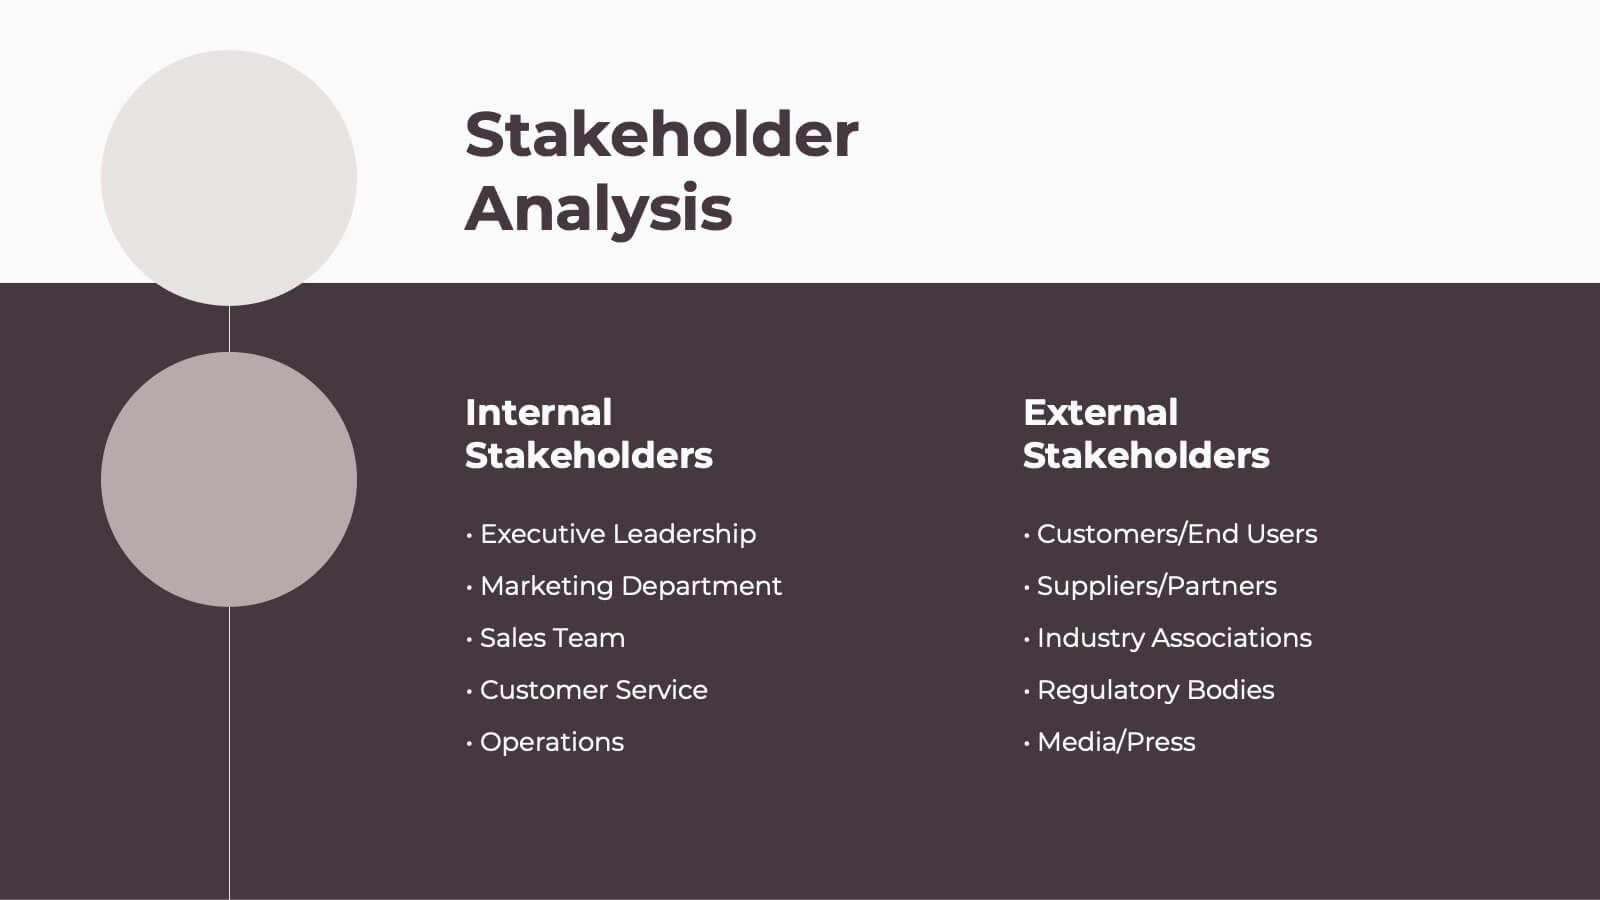
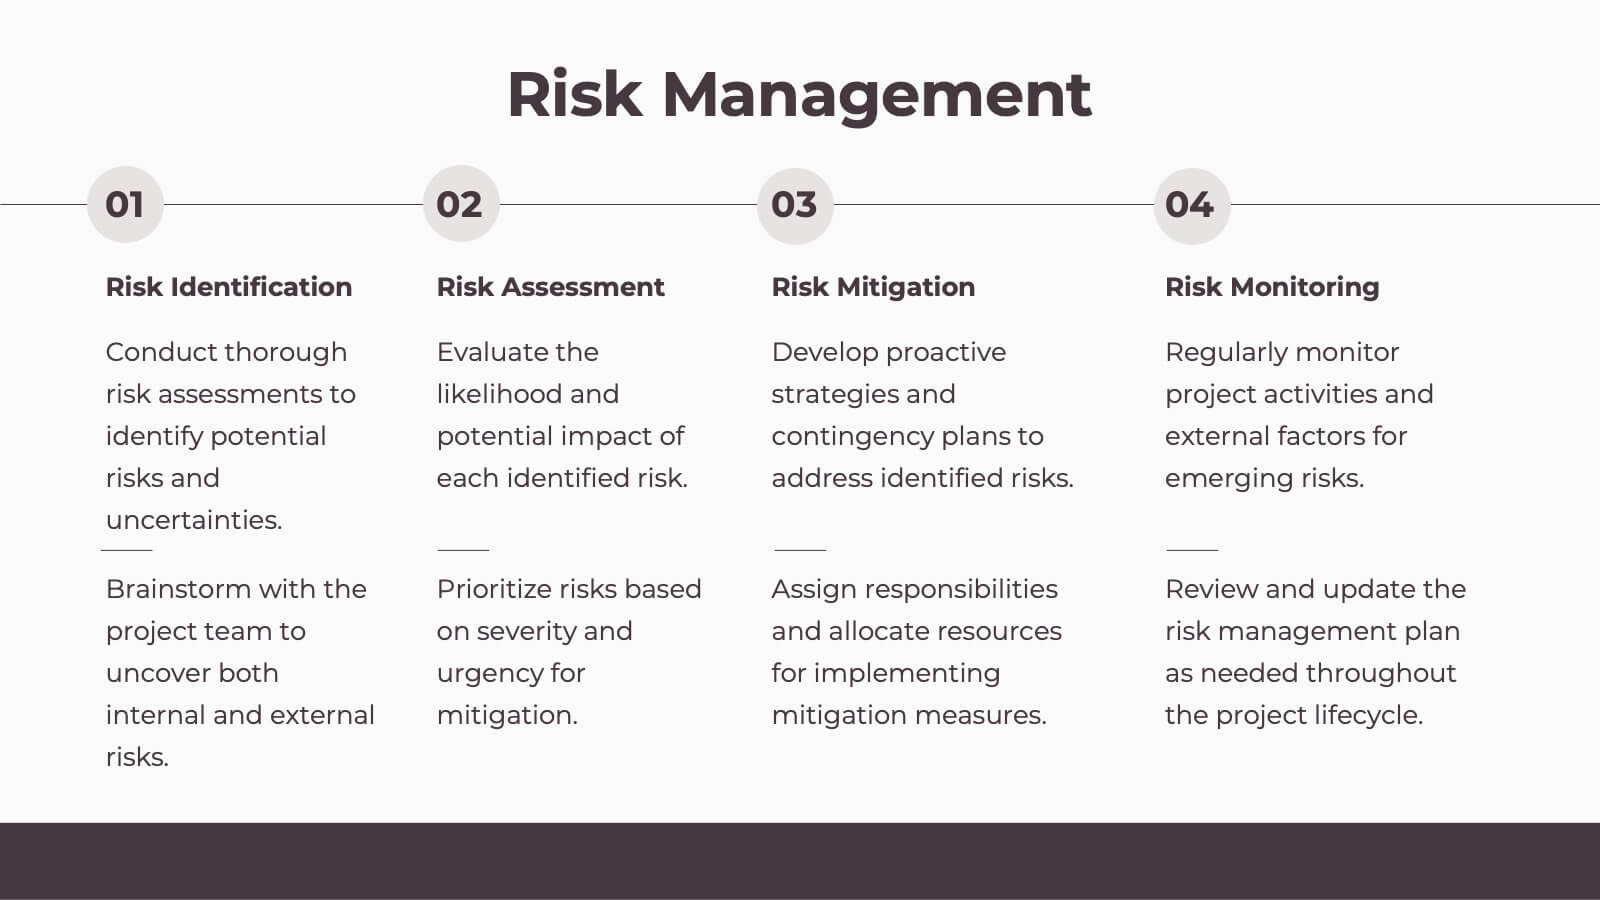
Spectrum Project Timeline Presentation
Plan and execute your projects with precision using this detailed project plan template! Perfect for outlining objectives, timelines, and resource allocation. Ideal for project managers and teams aiming to ensure successful project delivery. Compatible with PowerPoint, Keynote, and Google Slides, this template keeps your project organized, clear, and on track. Ensure project success!


6 diapositivas
Customer Value Proposition Framework Presentation
Clarify your business offering with the Customer Value Proposition Framework Presentation. This template is designed to help you align your products or services with customer needs through a side-by-side visual of the Value Proposition Canvas. Highlight pain points, customer gains, and how your solution uniquely addresses them. Fully customizable in PowerPoint, Keynote, and Google Slides. Perfect for marketers, product managers, and strategic planning teams.


6 diapositivas
Product Development Roadmap Presentation
Visualize your innovation journey with this Product Development Roadmap template. Perfect for outlining each stage from concept to launch, it keeps teams aligned on goals and timelines. Ideal for startups, tech teams, or product managers. Fully editable in PowerPoint, Keynote, and Google Slides for flexible, streamlined use.


4 diapositivas
Comparison Table Slide Presentation
Quickly highlight the differences between options with the Comparison Table Slide Presentation. This layout features a clean, structured table with checkmarks and Xs to visually compare features, services, or product tiers. Ideal for pricing plans, feature breakdowns, or side-by-side evaluations. Each column is color-coded for clarity and impact. Fully customizable in PowerPoint, Keynote, and Google Slides.