


Características


¿Tienes alguna pregunta?
Recomendar


5 diapositivas
Product Life Cycle Strategy Framework Presentation
Bring structure and clarity to your business strategy with this clean circular infographic design. Ideal for showcasing product evolution, performance metrics, and planning stages, it helps visualize complex data in a professional, easy-to-follow format. Fully editable and compatible with PowerPoint, Keynote, and Google Slides for seamless customization.


5 diapositivas
A to Z Slide Concept Presentation
Bring your ideas to life with a bold, block-style visual that makes complex concepts feel simple and structured. This slide is perfect for breaking down processes, frameworks, or step-by-step explanations in a clear, memorable way. Fully editable and compatible with PowerPoint, Keynote, and Google Slides.


8 diapositivas
Root Cause Visual via Ishikawa Method
Clarify root causes and drive actionable solutions with the Root Cause Visual via Ishikawa Method Presentation. This fishbone-style infographic layout uses six categorized nodes mapped directly to a streamlined fish silhouette, ideal for visualizing complex problems. Easily editable in PowerPoint, Keynote, and Google Slides.


6 diapositivas
Population Pyramid Infographic
A population pyramid, also known as an age-gender pyramid, is a graphical representation of the distribution of a population by age and gender. This infographic is a visually captivating presentation designed to illustrate the age and gender distribution of a population. It provides an easy-to-understand representation of the population structure, allowing viewers to grasp demographic patterns at a glance. Present your population data and demographic trends with this template. This enables viewers to grasp demographic patterns quickly and facilitates the key insights about a population's composition and changes over time.


8 diapositivas
Medical Case Study Presentation
Elevate your medical presentations with our "Medical Case Study Presentation" template. This infographic is expertly designed to outline medical case studies or healthcare data, showcasing a central image flanked by related statistics and information. Each segment is linked to a visually distinct icon, representing different health metrics or case points, making it easier to digest complex medical information. This template is perfect for medical professionals, educators, and healthcare analysts, providing a structured way to present findings, research, or patient data effectively. Compatible with PowerPoint, Keynote, and Google Slides, it ensures your medical data is communicated clearly and professionally.


4 diapositivas
Project Milestone Path Roadmap Presentation
Bring your project plan to life with a clean, colorful layout that makes every milestone easy to follow across each quarter. This presentation helps you organize tasks, timelines, and progress in a clear visual path that supports smarter planning and team alignment. Fully compatible with PowerPoint, Keynote, and Google Slides.


5 diapositivas
Value Chain Business Model Presentation
Spark fresh insight into how your organization creates value with this clean, arrow-based layout that makes every step feel intuitive and action-ready. This presentation breaks down key activities, support processes, and improvement opportunities in a clear visual flow perfect for strategy discussions. Fully compatible with PowerPoint, Keynote, and Google Slides.


4 diapositivas
E-Learning Course Design Overview Presentation
Spark curiosity from the very first slide with a clean, modern layout that explains how effective online learning experiences are planned and delivered. This presentation walks through key elements of course structure, content flow, and learner engagement in a simple, visual way. Fully compatible with PowerPoint, Keynote, and Google Slides.


6 diapositivas
Construction Project Management Infographic
Construction project management is the process of planning, organizing, and overseeing construction projects from inception to completion. This infographic template is designed to showcase the essential elements and processes involved in managing a construction project. It is a concise and easy-to-understand visual representation of key aspects that play a vital role in successful project execution. This provides an overview of the project's key elements, progress, and success factors. This visually appealing infographic helps in effective communication, decision-making, and project monitoring throughout the construction process.


5 diapositivas
Key Data and Performance Numbers Slide
Visualize data with impact using the Key Data and Performance Numbers Slide Presentation. This infographic-style layout features a central pie chart and five bold percentage callouts, making it ideal for presenting insights, progress, or KPIs. Easily customize the colors, titles, and text in PowerPoint, Keynote, or Google Slides.


5 diapositivas
Identifying and Mitigating Risks Presentation
Master risk management with the Identifying and Mitigating Risks template, designed to deliver clear and impactful presentations that outline key risk factors and mitigation strategies. It features easily customizable icons representing various aspects of risk assessment. This template allows professionals to effectively communicate risk mitigation strategies, ensuring essential information is concise and understandable. Additionally, it is compatible with PowerPoint, Keynote, and Google Slides.


2 diapositivas
Thank You Message and Contact Info Presentation
End your presentation on a polished note with the Thank You Message and Contact Info Presentation slide. This clean, professional layout features space for your name, company details, and contact information—plus a photo to humanize your brand. Includes light and dark theme options. Fully editable in Canva, PowerPoint, Keynote, and Google Slides.


7 diapositivas
Communication Skills Infographics
Effective communication skills are essential in every aspect of life, including personal relationships, professional relationships, and societal interactions. This template provides you with a great resource for presenting your communication skills. This can help you present your ideas in an effective way. This template features customizable slide designs and graphics allowing you plenty of room to add your own content. The format makes this presentation easy to follow and understand visually as it focuses on what are the most important aspects of delivering effective communication skills.


5 diapositivas
Healthcare Innovations and Medical Trends Presentation
Showcase breakthroughs and progress with the Healthcare Innovations and Medical Trends Presentation. This slide features a stylized heart icon with segmented color highlights tied to four labeled icons—perfect for visualizing trends, solutions, or stages in care. Fully editable in Canva, PowerPoint, Keynote, and Google Slides for easy customization.


6 diapositivas
Personal and Business Insurance Plans Presentation
Compare and Present Insurance Options effortlessly with this Personal and Business Insurance Plans Presentation template. Designed to clearly illustrate different insurance plans, this slide helps in comparing coverage options, benefits, and key features for both personal and business policies. Ideal for insurance agencies, financial consultants, and corporate presentations, this template is fully customizable and compatible with PowerPoint, Keynote, and Google Slides for seamless editing.


21 diapositivas
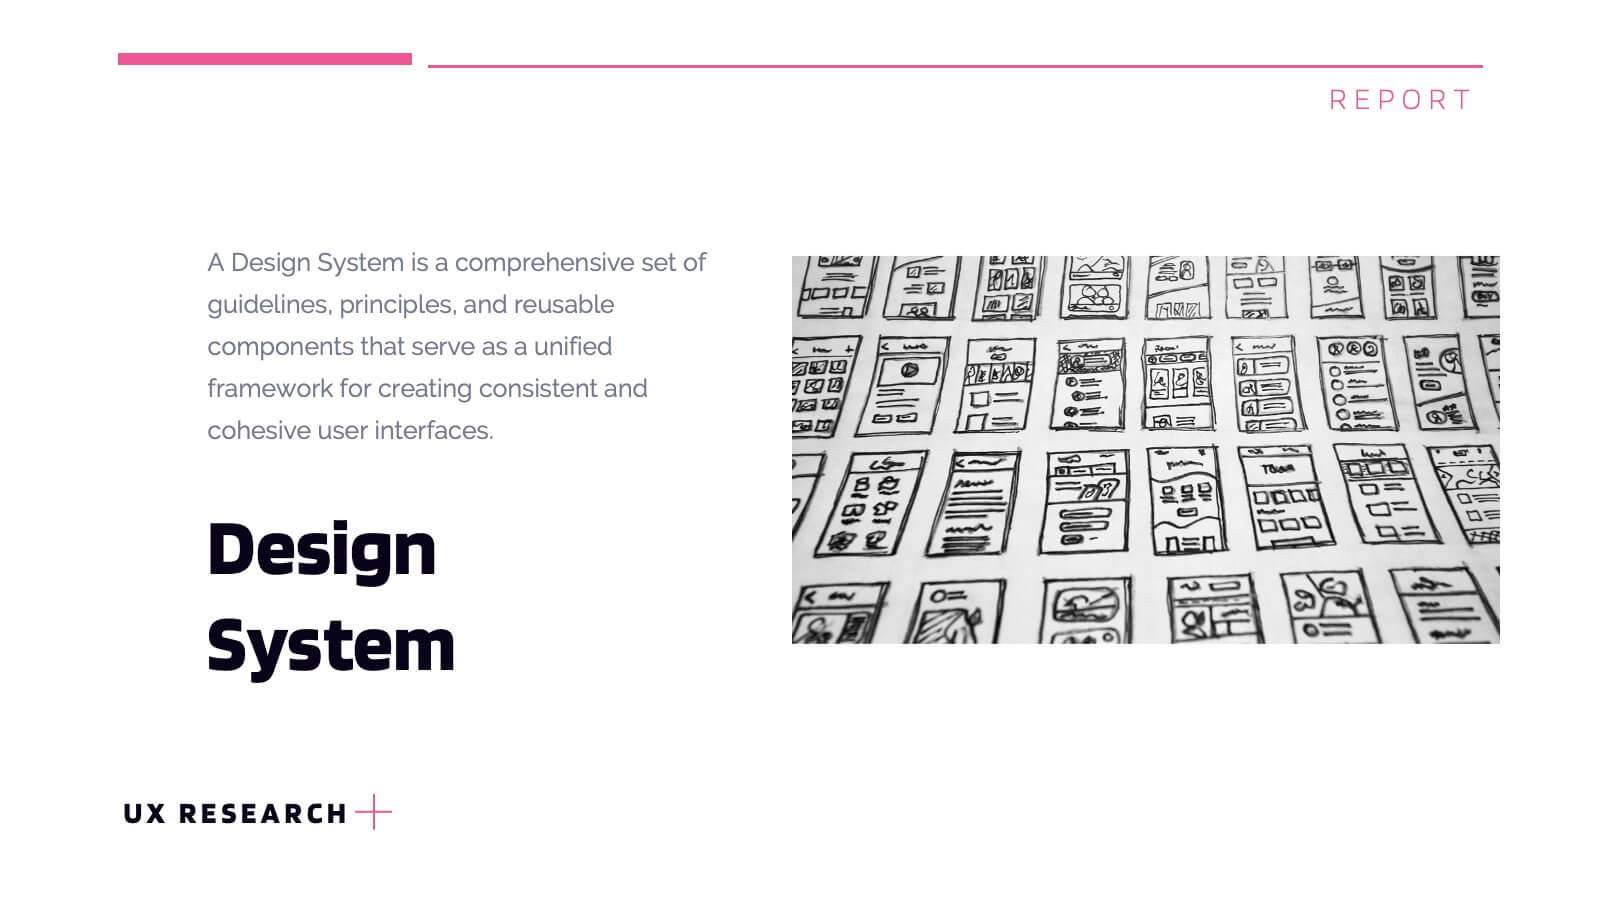
Lumascend UX Research Report Presentation
Present your UX research findings with clarity using this engaging and organized template! Covering key areas like user personas, wireframes, testing, and interaction design, it ensures all aspects of your design process are communicated effectively. Perfect for UX teams, stakeholders, or client presentations, this template works seamlessly with PowerPoint, Keynote, and Google Slides.


5 diapositivas
Business Performance Dashboard Presentation
Bring your data to life with a crisp, unified view of metrics that matter. This presentation helps you track performance, compare results, and visualize progress through charts and KPIs that keep teams aligned. Clean, modern, and easy to adapt. Fully compatible with PowerPoint, Keynote, and Google Slides.