


Características


¿Tienes alguna pregunta?
Recomendar


26 diapositivas
Managing Work-Life Balance Presentation
Find harmony between career and personal life with this insightful presentation on managing work-life balance. Covering key strategies like time management, stress reduction, remote work efficiency, and self-care practices, this template helps promote productivity and well-being. Fully customizable and compatible with PowerPoint, Keynote, and Google Slides for a seamless and engaging presentation experience.


26 diapositivas
Olympus Brand Guidelines Proposal Presentation
The Olympus Brand Identity Presentation is a sleek and modern template designed to help you showcase your brand's unique identity and strategy. This template kicks off with a clean and engaging slide that sets the stage for the entire presentation. It guides you through various aspects of brand identity, including brand components, target audience, and unique selling proposition (USP). The template also dives into brand positioning, strategy, and guidelines, ensuring that your brand's message is consistent and compelling. Additionally, it covers brand experience, recognition, and recall, offering a comprehensive view of your brand's impact. With dedicated sections for performance metrics, brand success stories, and future development, this template provides a complete toolkit for effectively communicating your brand's strengths and vision. Fully compatible with PowerPoint, Keynote, and Google Slides, the Olympus template is perfect for any brand-focused presentation.


6 diapositivas
Cultural Ecology Infographics
The "Cultural Ecology" infographic template is an insightful and captivating tool, expertly tailored for PowerPoint, Keynote, and Google Slides. This template is a valuable resource for anthropologists, environmentalists, and educators aiming to showcase the intricate relationship between human cultures and their environments in a visually compelling way. This template elegantly maps out the principles of cultural ecology, illustrating how cultural practices, societal developments, and environmental factors are interwoven. It highlights key concepts such as adaptation, sustainability, and the impact of human activities on ecosystems. The layout is designed to facilitate a deep understanding of the ways in which human cultures shape and are shaped by their natural surroundings. The design is as rich and diverse as the field it represents, with a color scheme that echoes the vibrancy of different cultures and the richness of various ecosystems. This not only makes the presentation visually striking but also reinforces the interconnectedness of culture and ecology. Whether used in academic lectures, environmental conferences, or cultural exhibitions, this template ensures that the complex and fascinating world of "Cultural Ecology" is presented in an engaging, educational, and visually arresting manner.


5 diapositivas
Marketing Strategy Wheel Diagram Presentation
Visualize your marketing framework in a clear and engaging way with this Marketing Strategy Wheel Diagram. Designed to highlight key components like audience targeting, communication channels, and campaign goals, this circular format brings strategy to life. Fully customizable and compatible with PowerPoint, Keynote, and Google Slides. Ideal for marketers, agencies, and branding professionals.


4 diapositivas
Multi-Stage Process Hexagon Infographic Presentation
Showcase your workflows clearly with the Multi-Stage Process Hexagon Infographic Presentation. This template features a sleek chain of hexagons, ideal for visualizing linear steps, sequential planning, or project phases. Each stage is editable, color-coded, and easy to customize in PowerPoint, Keynote, or Google Slides—perfect for teams, educators, or project managers.


22 diapositivas
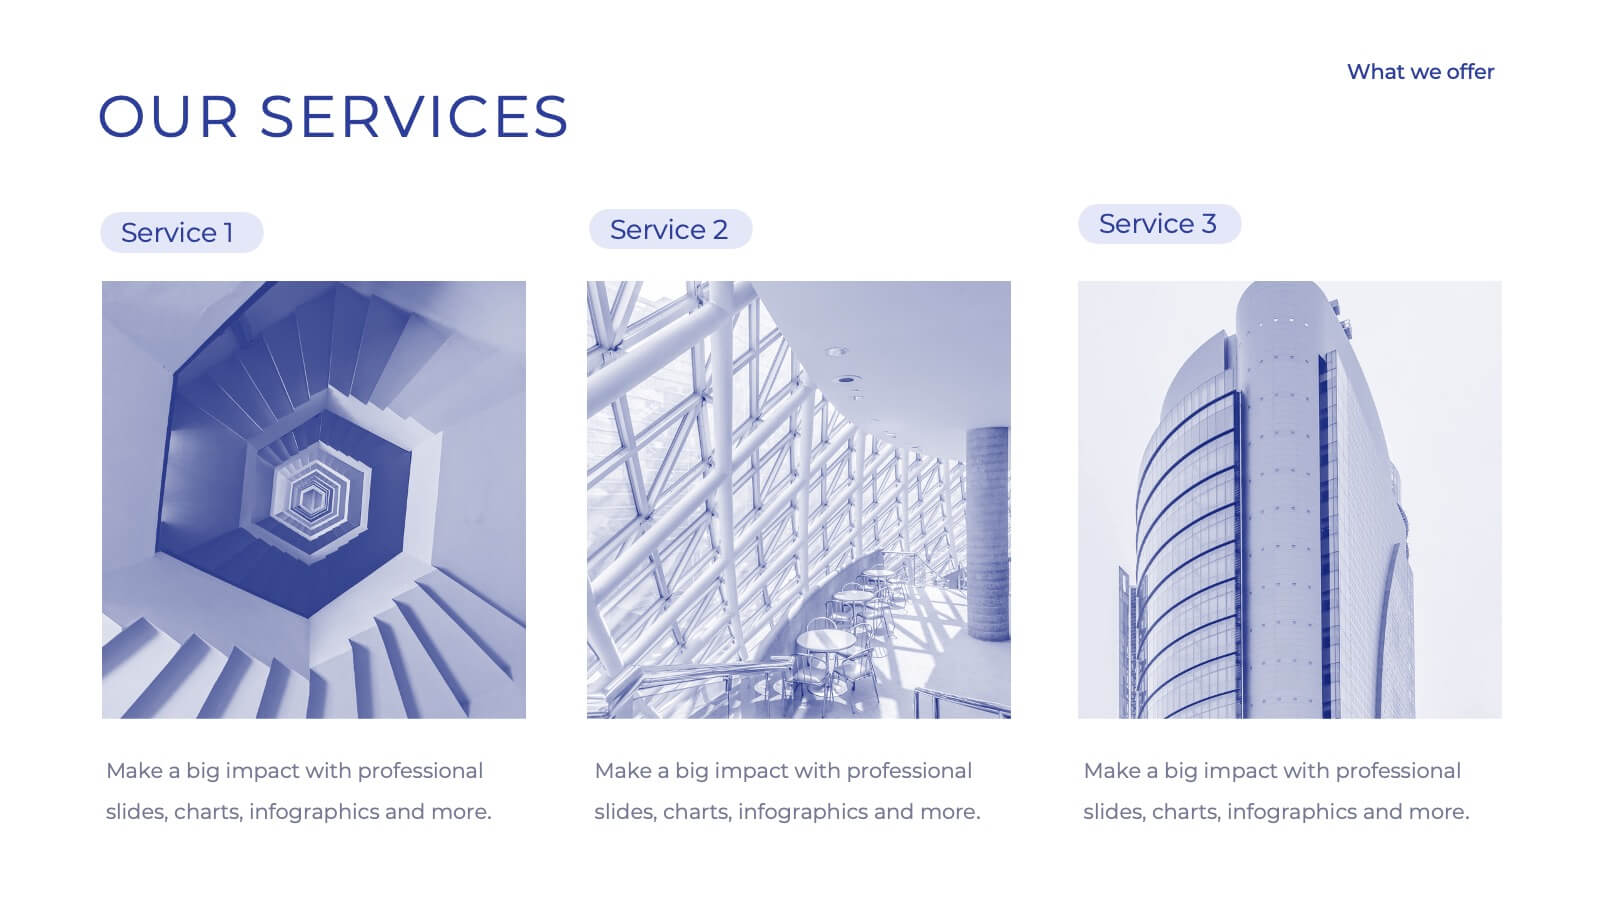
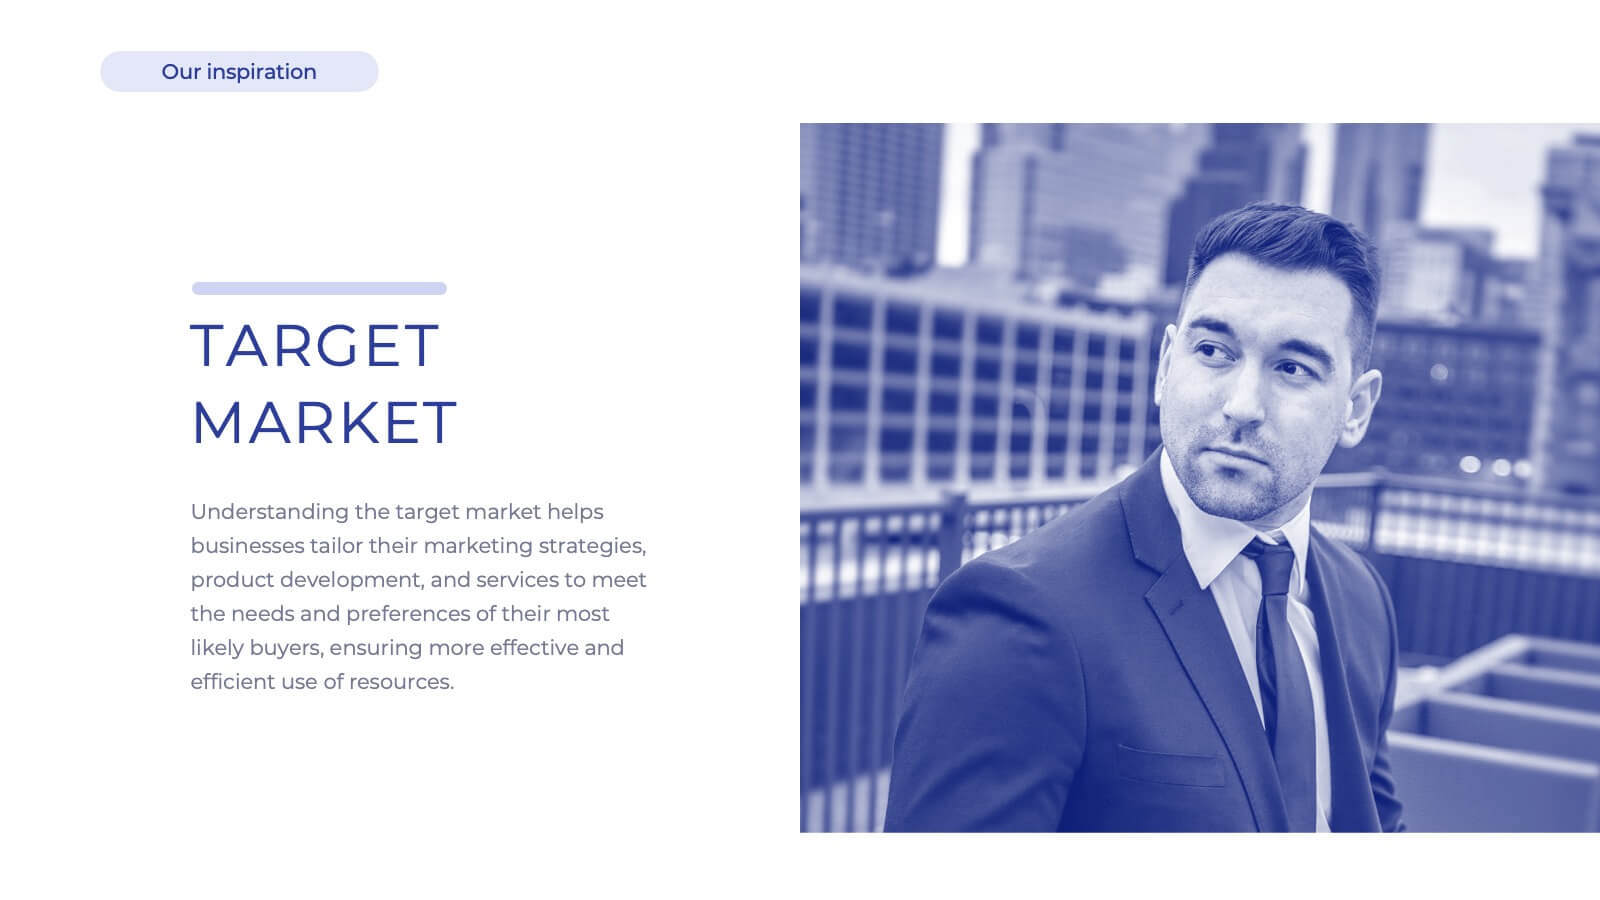
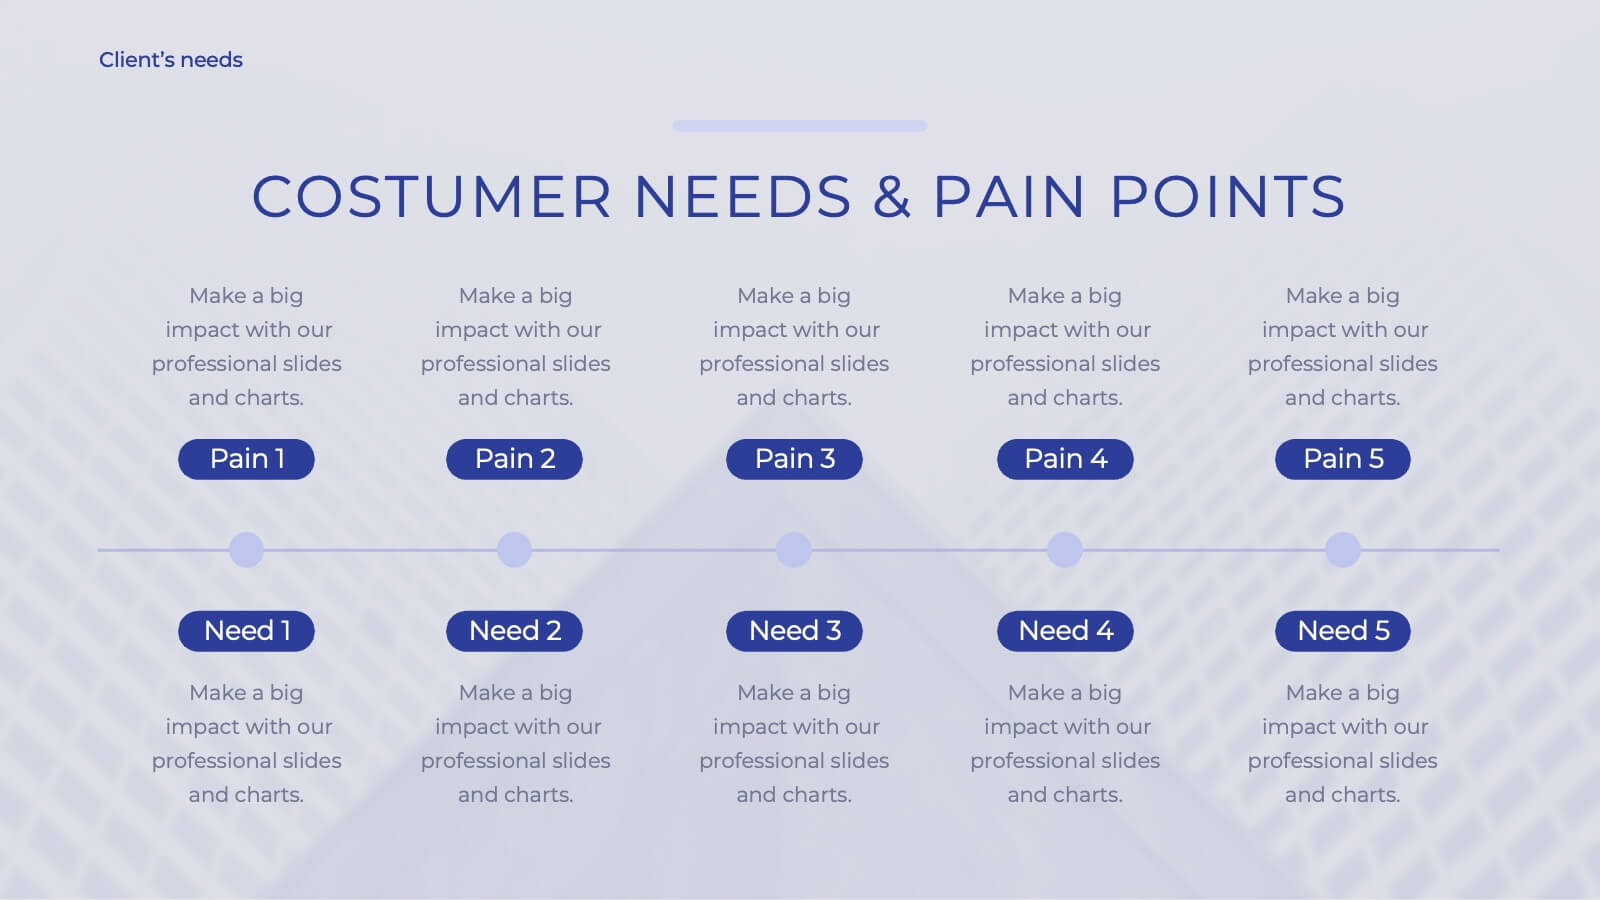
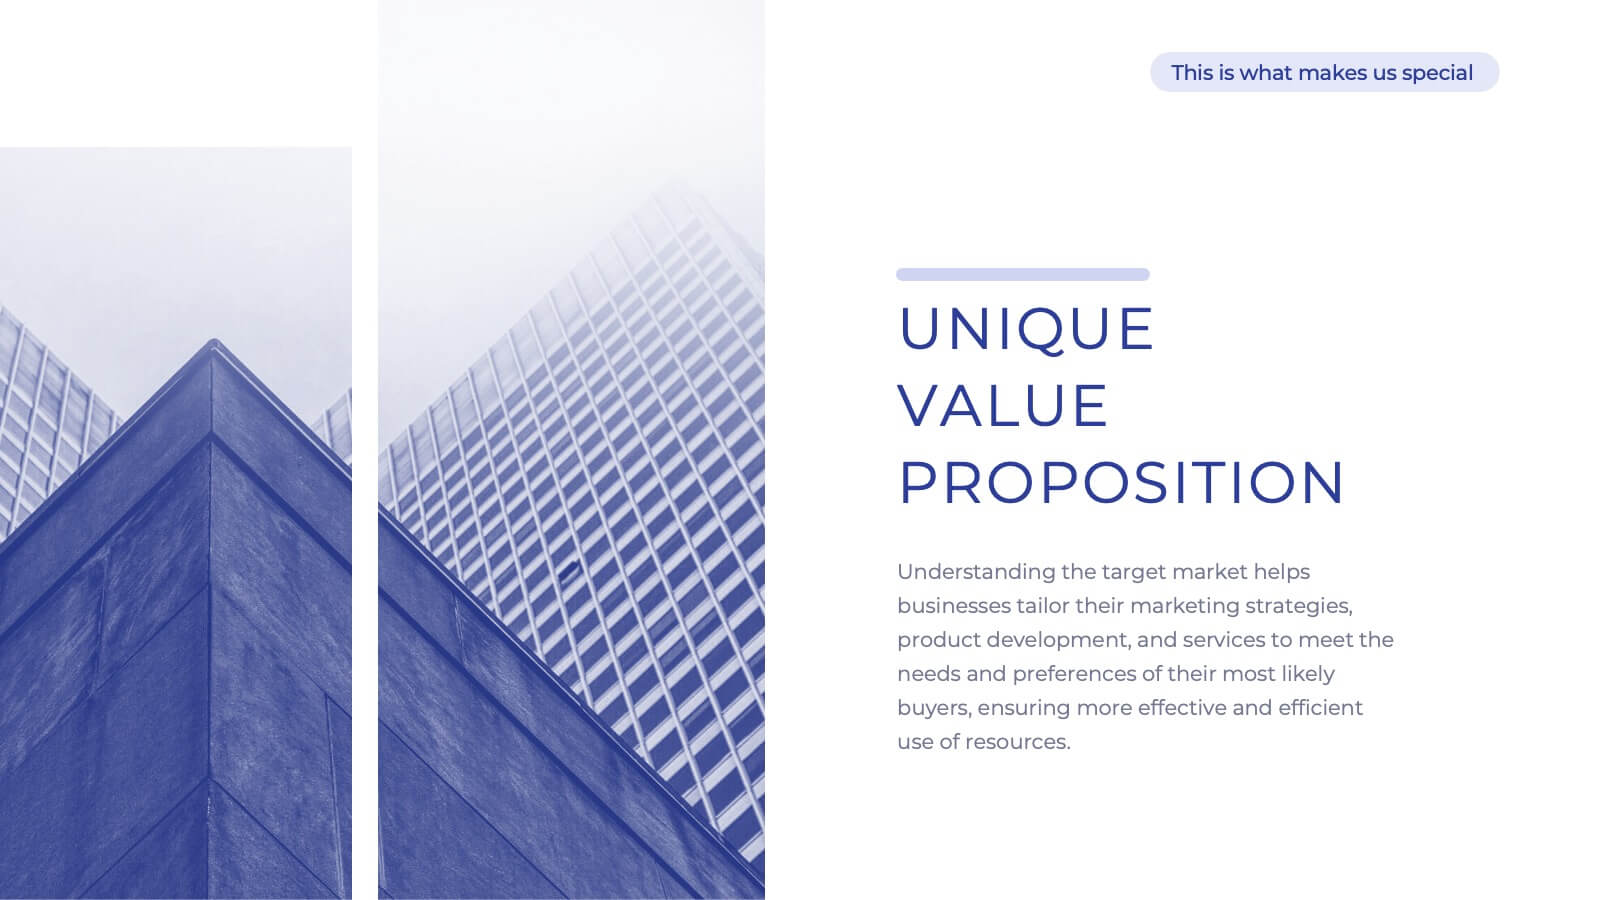
Shield Digital Agency Strategy Plan Presentation
Embark on a journey to elevate your digital agency with this comprehensive and sleek presentation template! Perfect for showcasing your agency’s strengths, strategies, and successes, this template covers everything from market analysis to client testimonials. It’s designed to make your agency’s strategy plan stand out. Compatible with PowerPoint, Keynote, and Google Slides for seamless use.
20 diapositivas
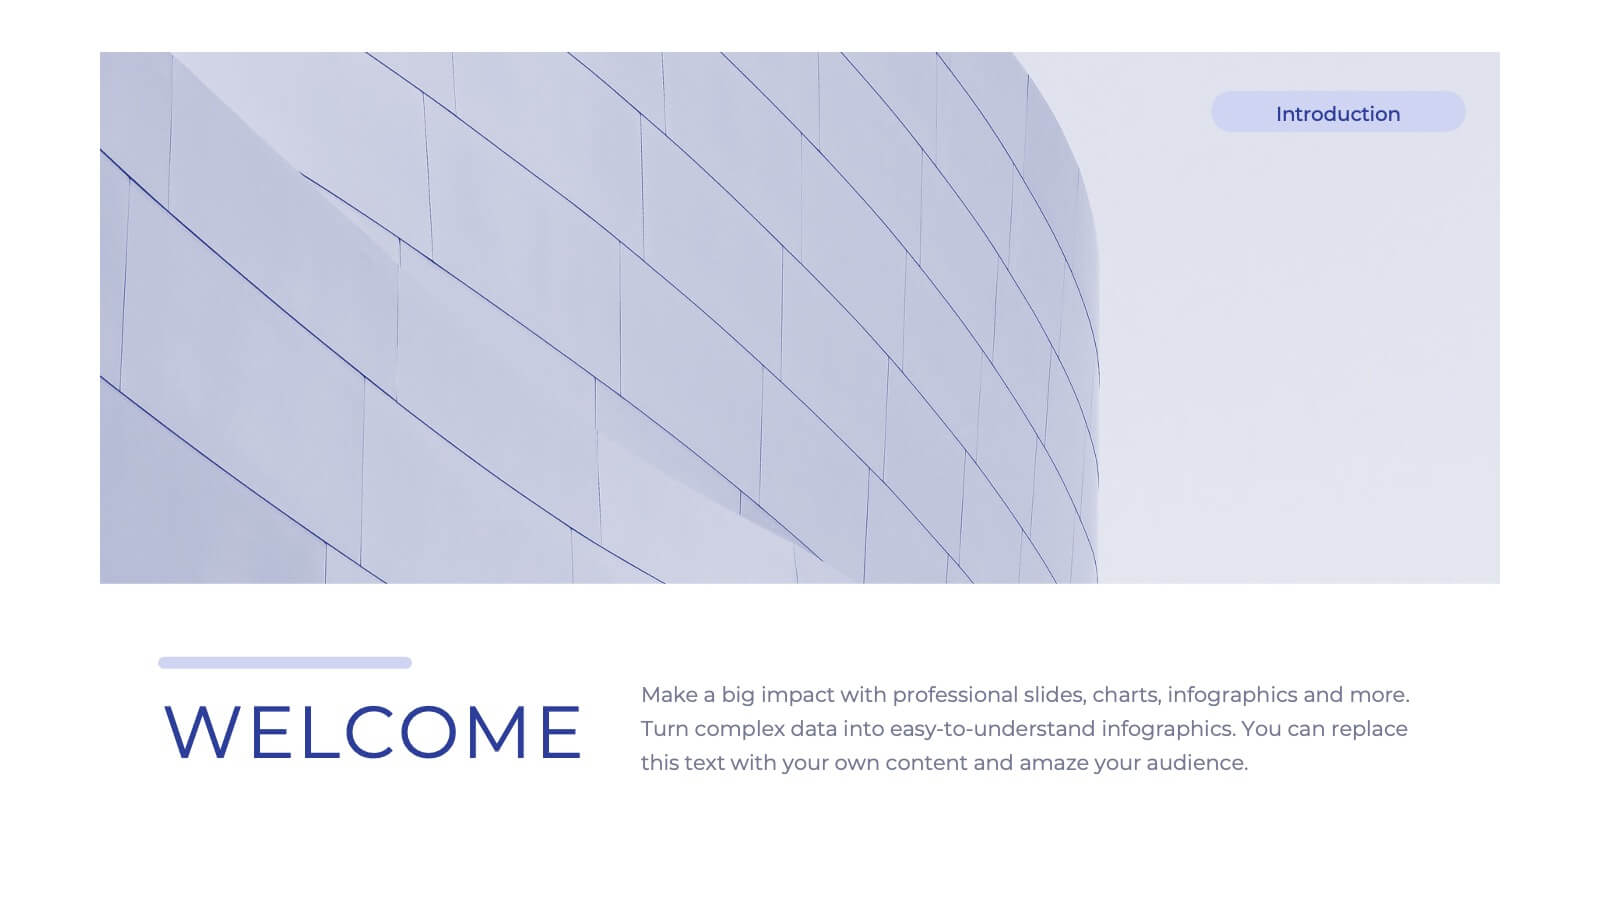
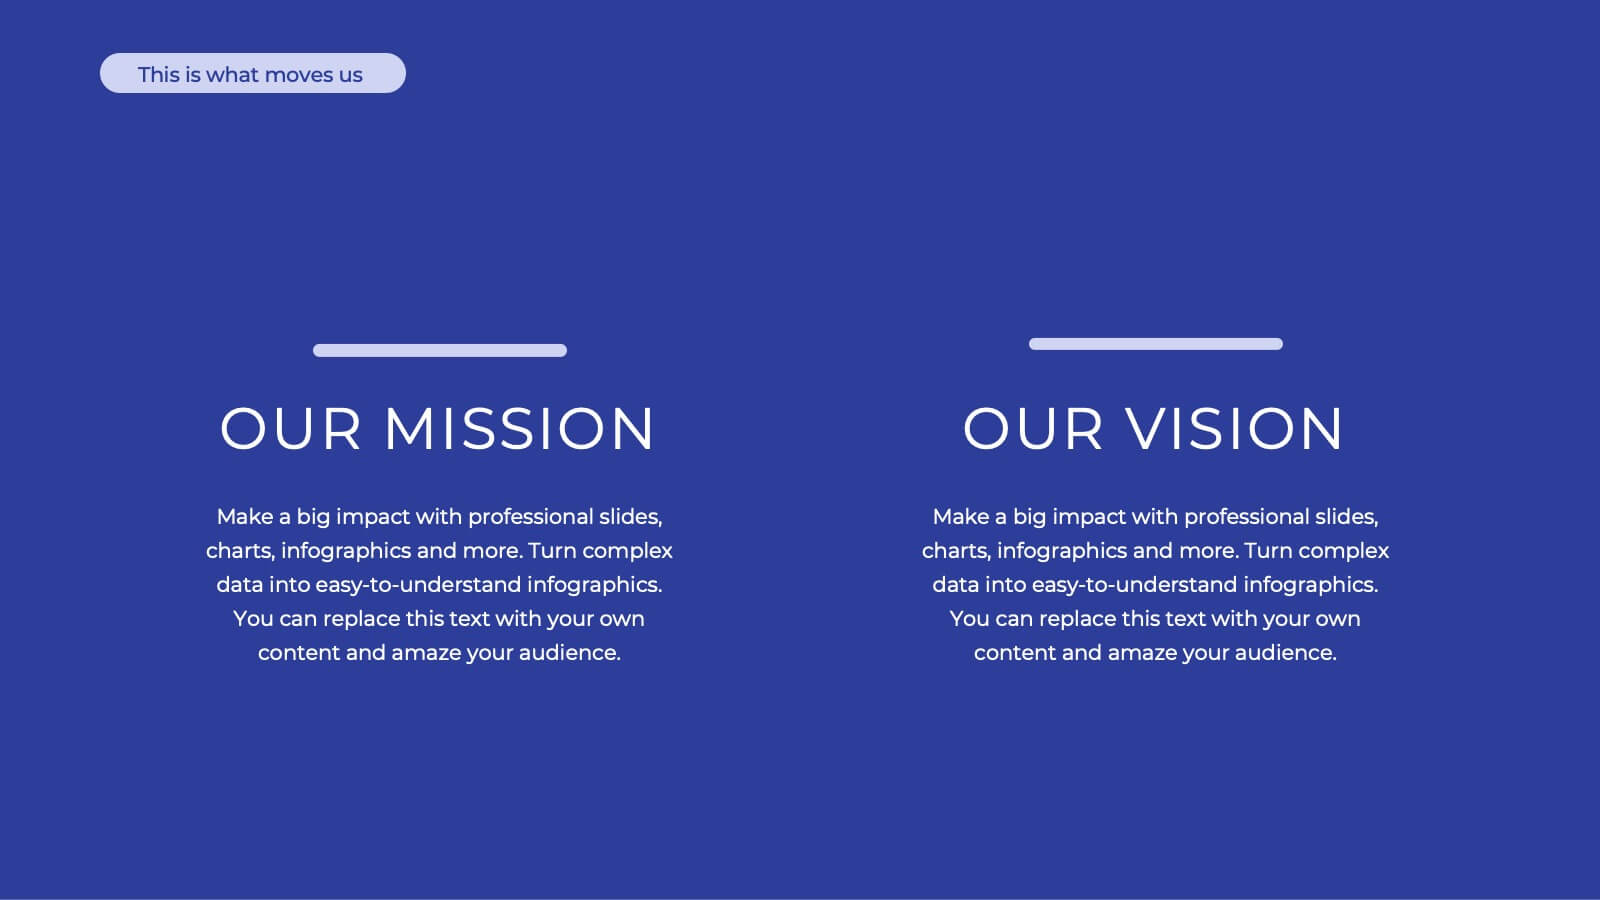
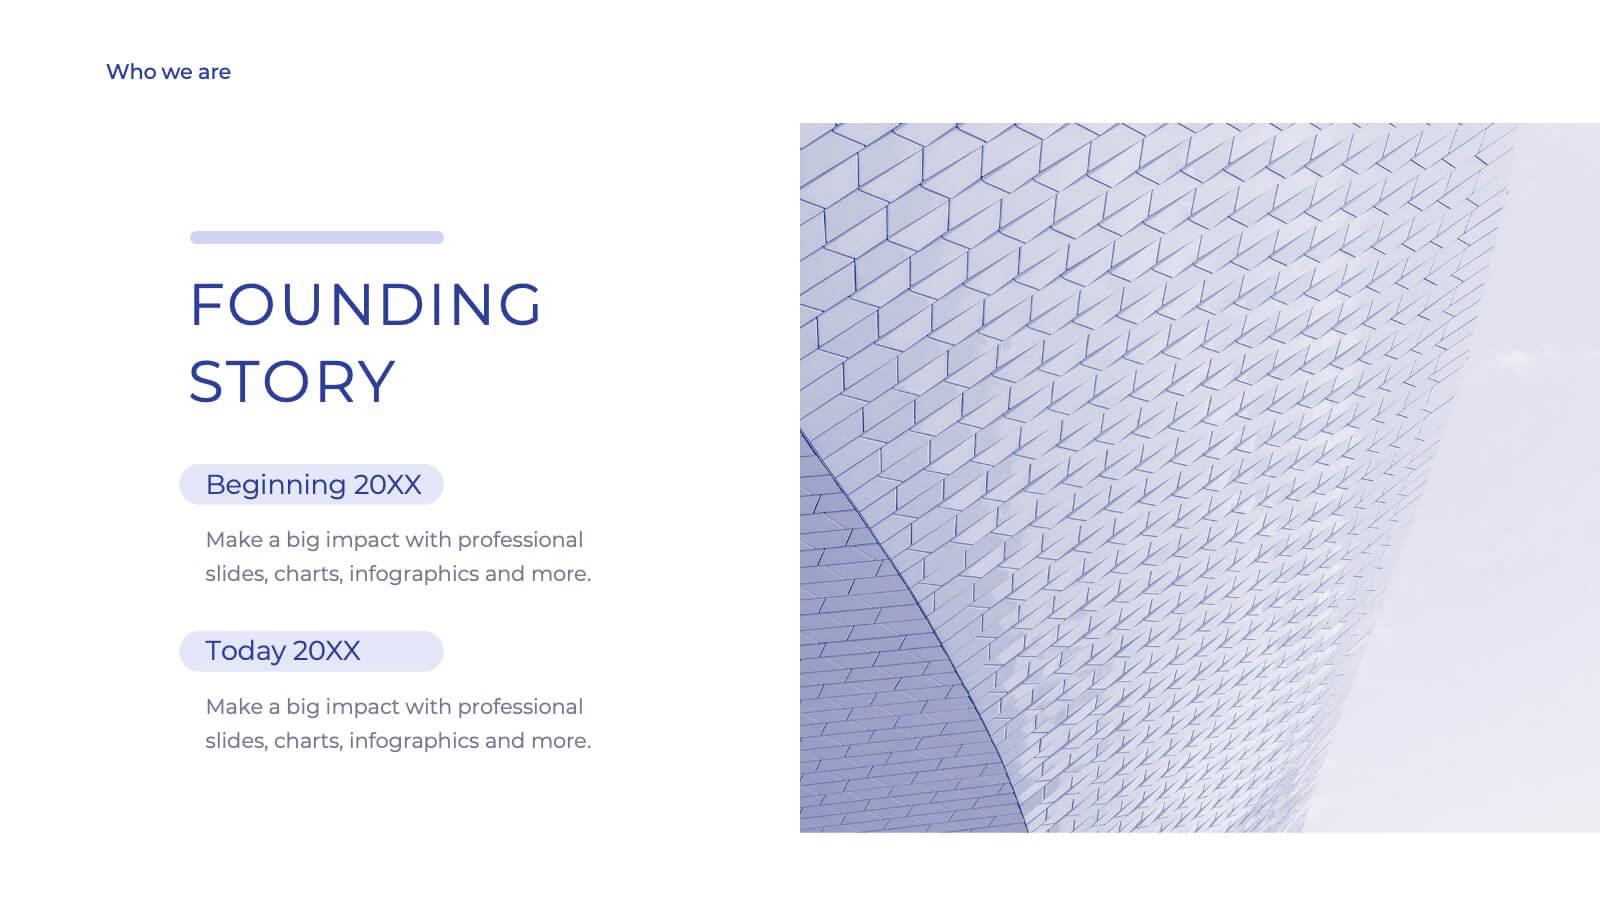
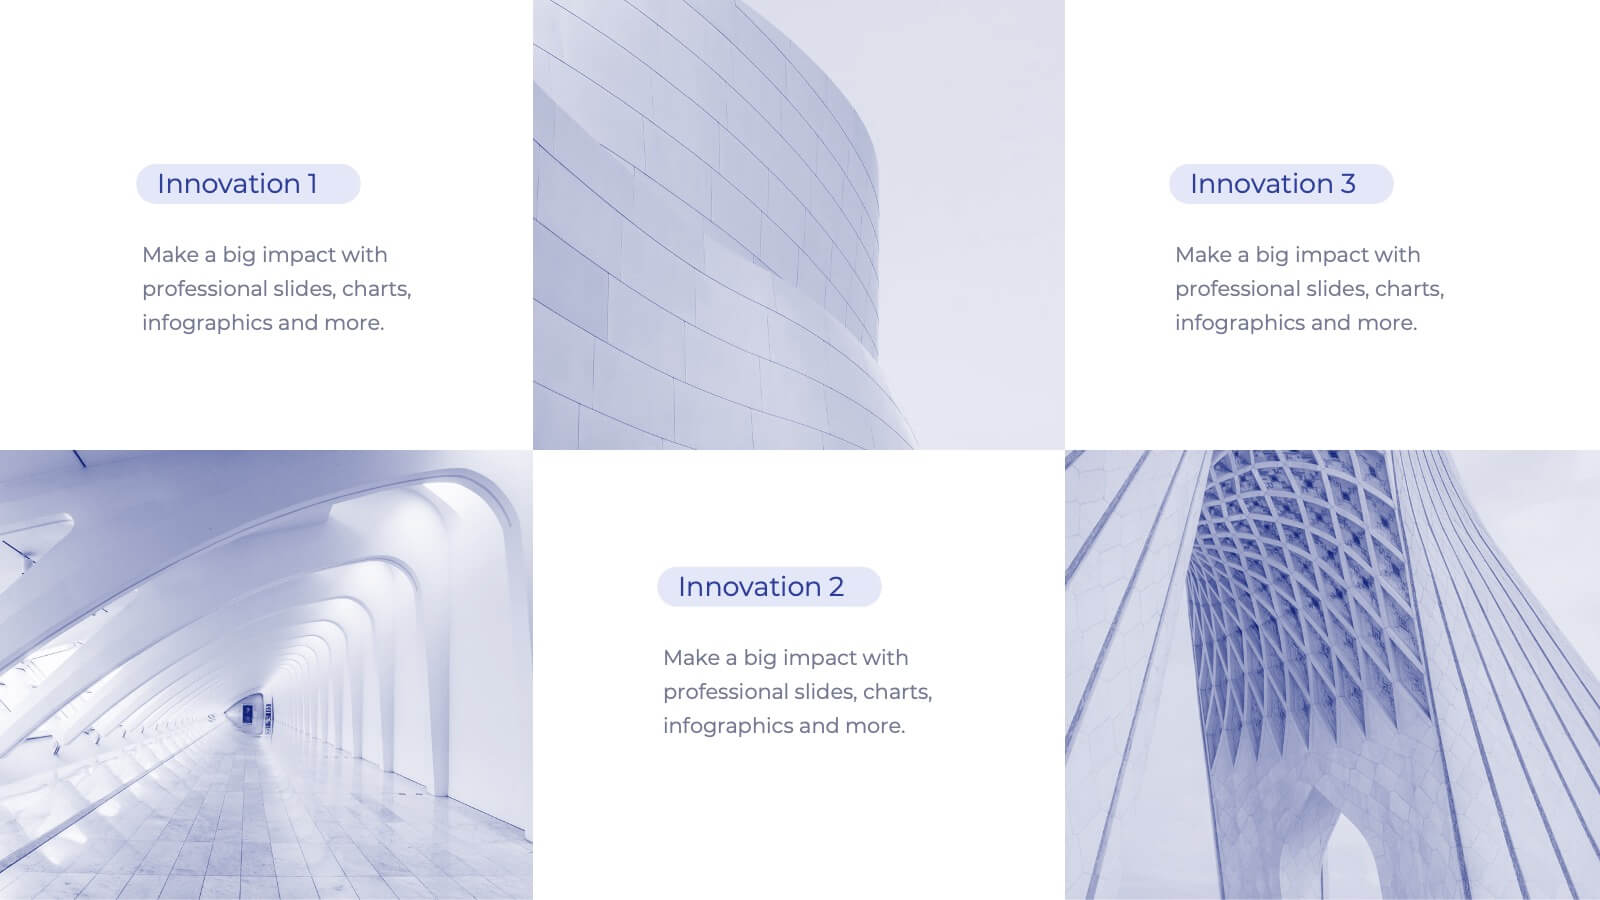
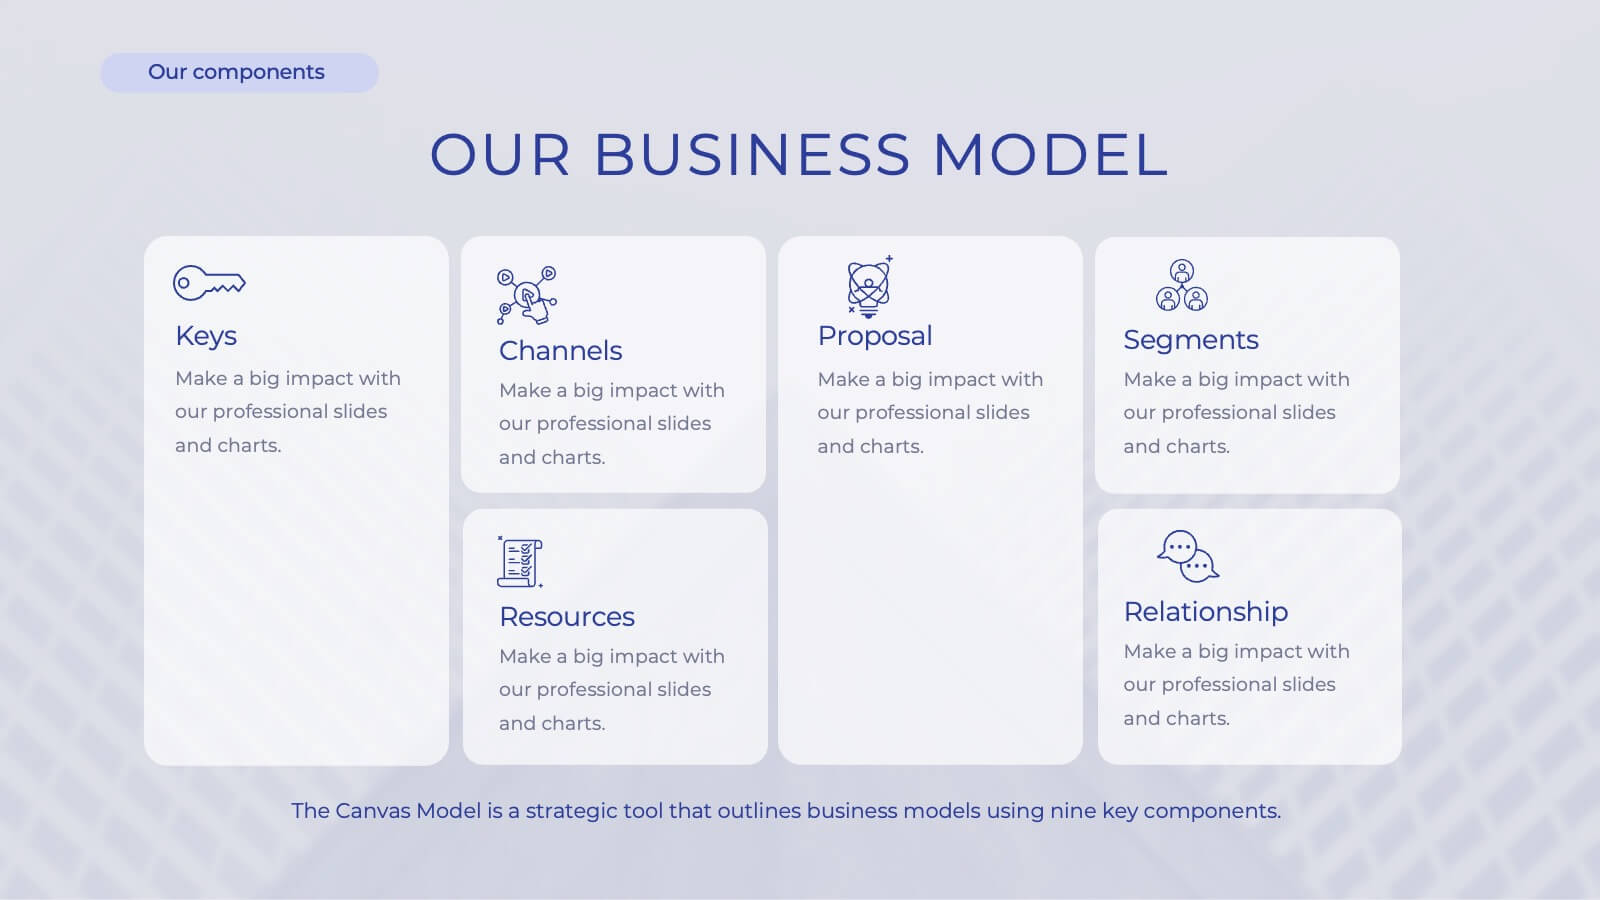
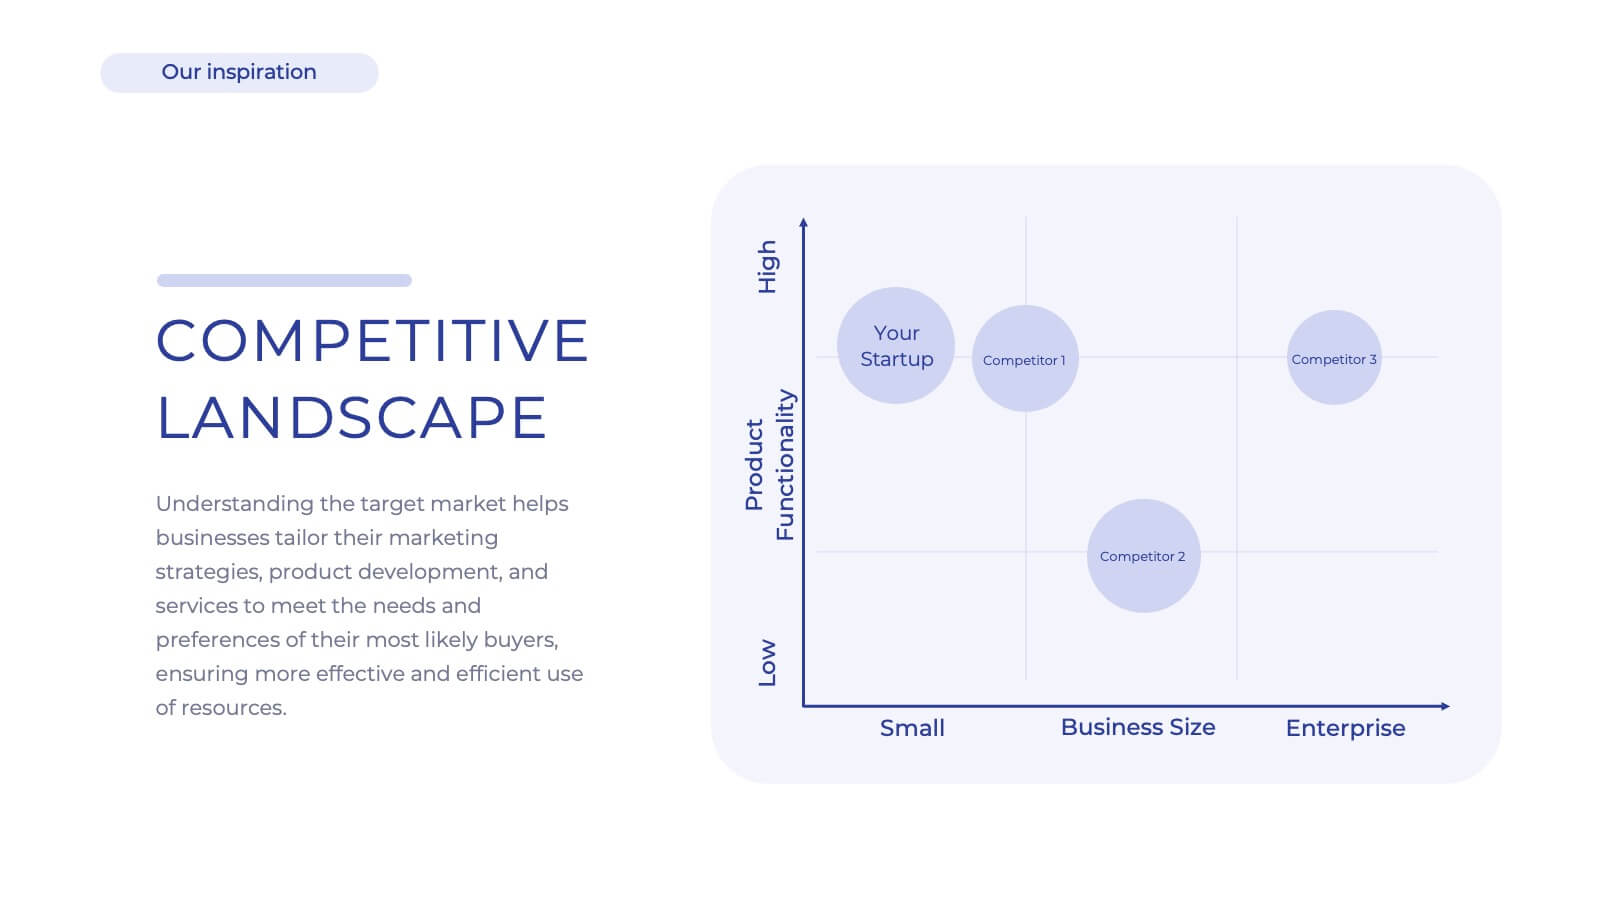
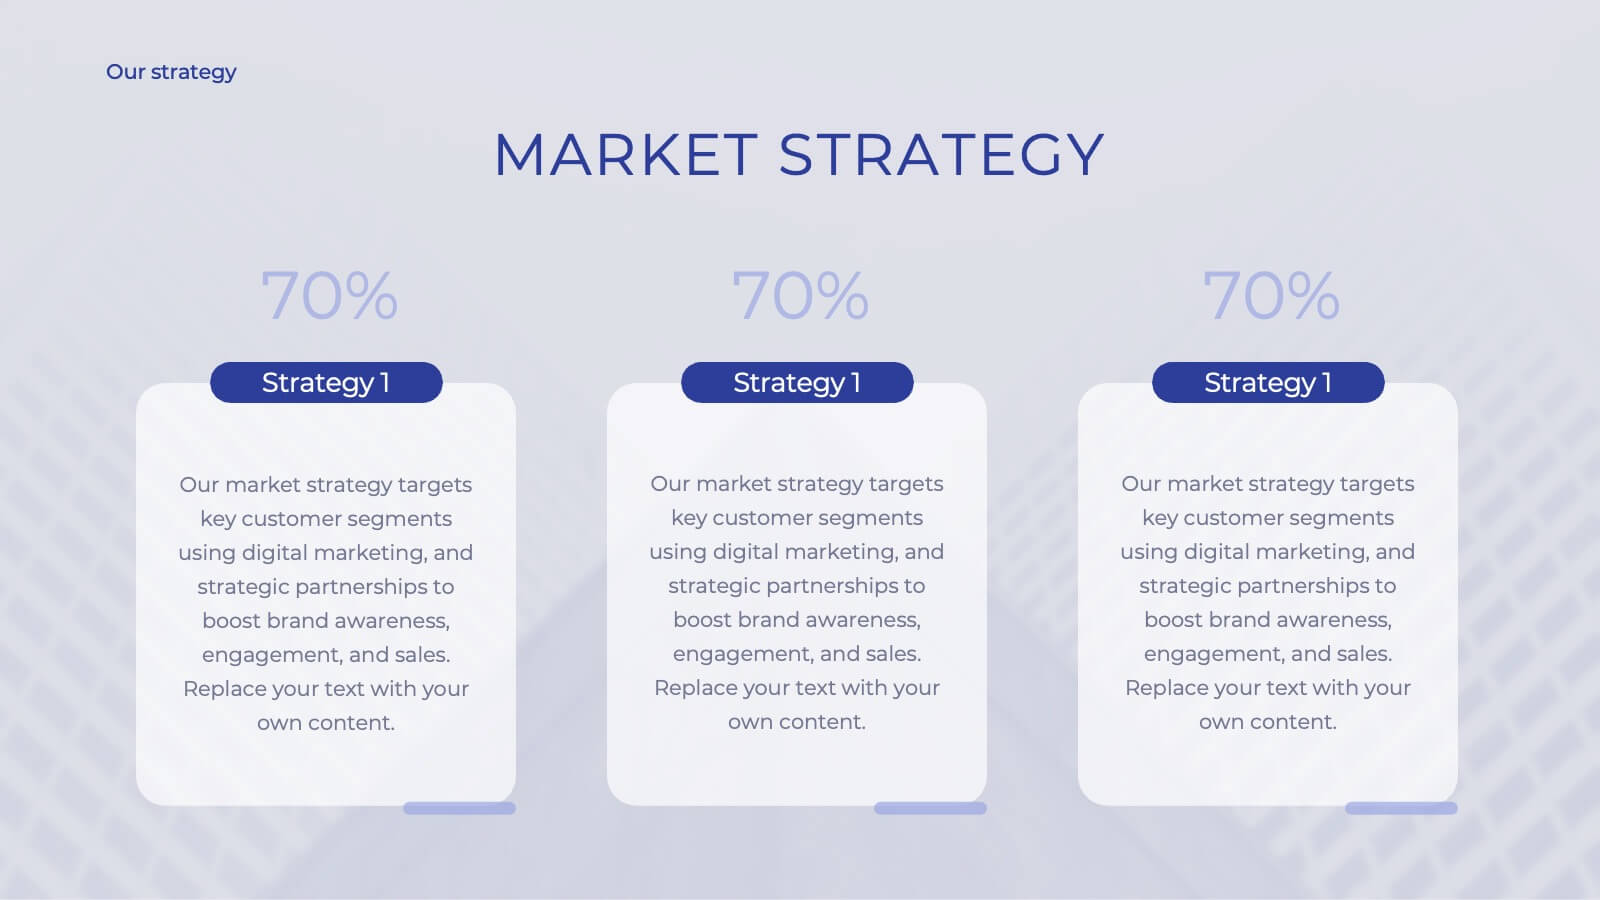
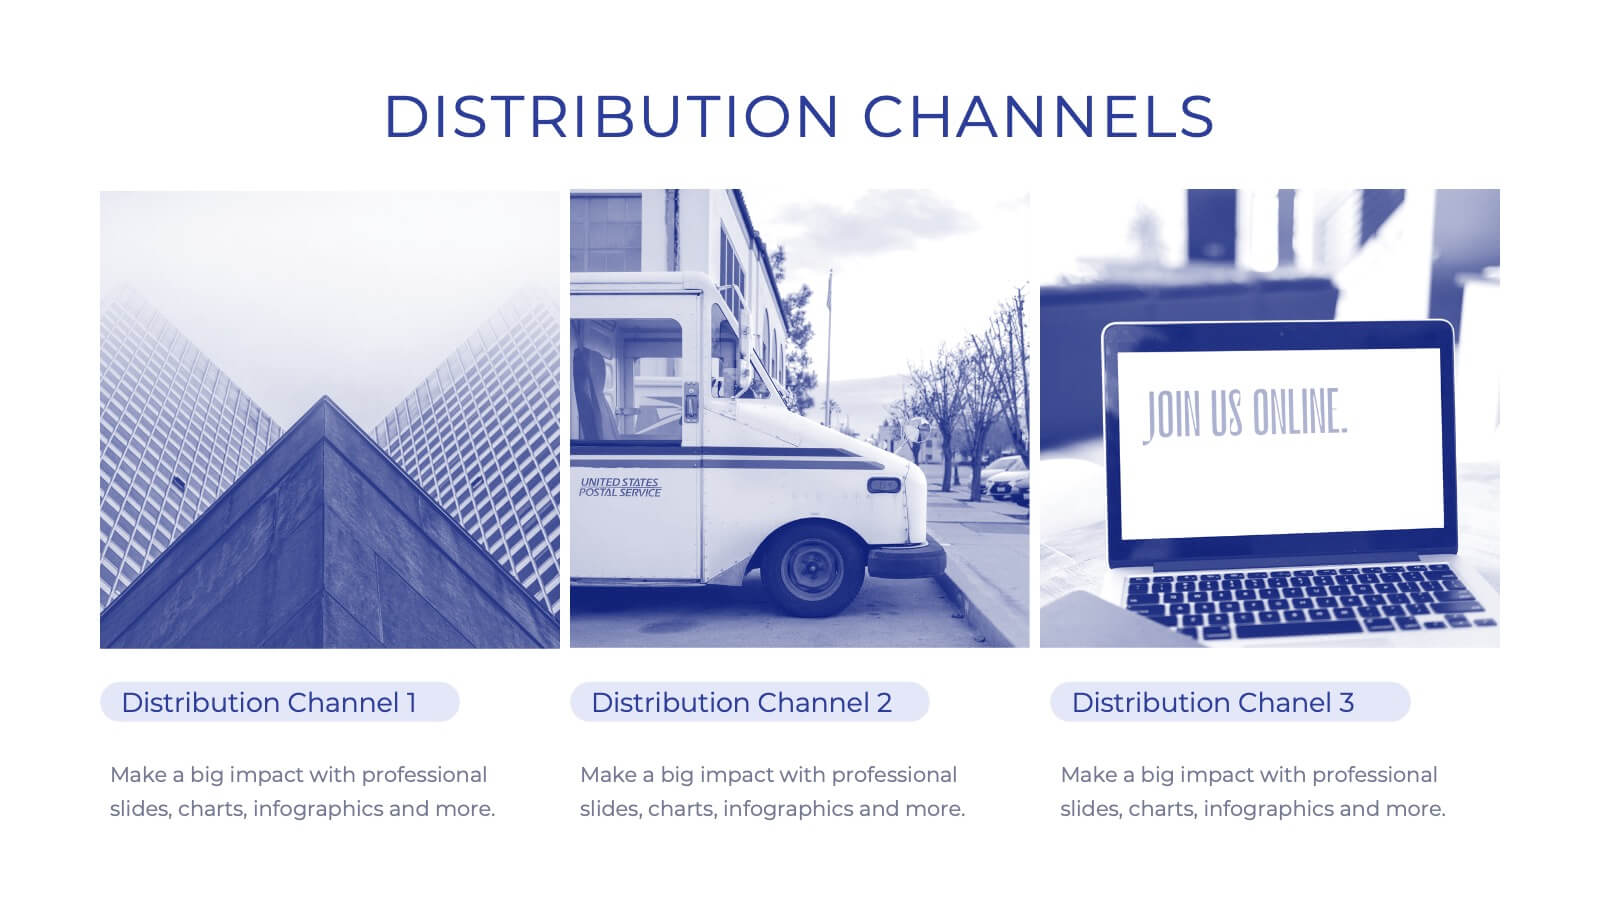
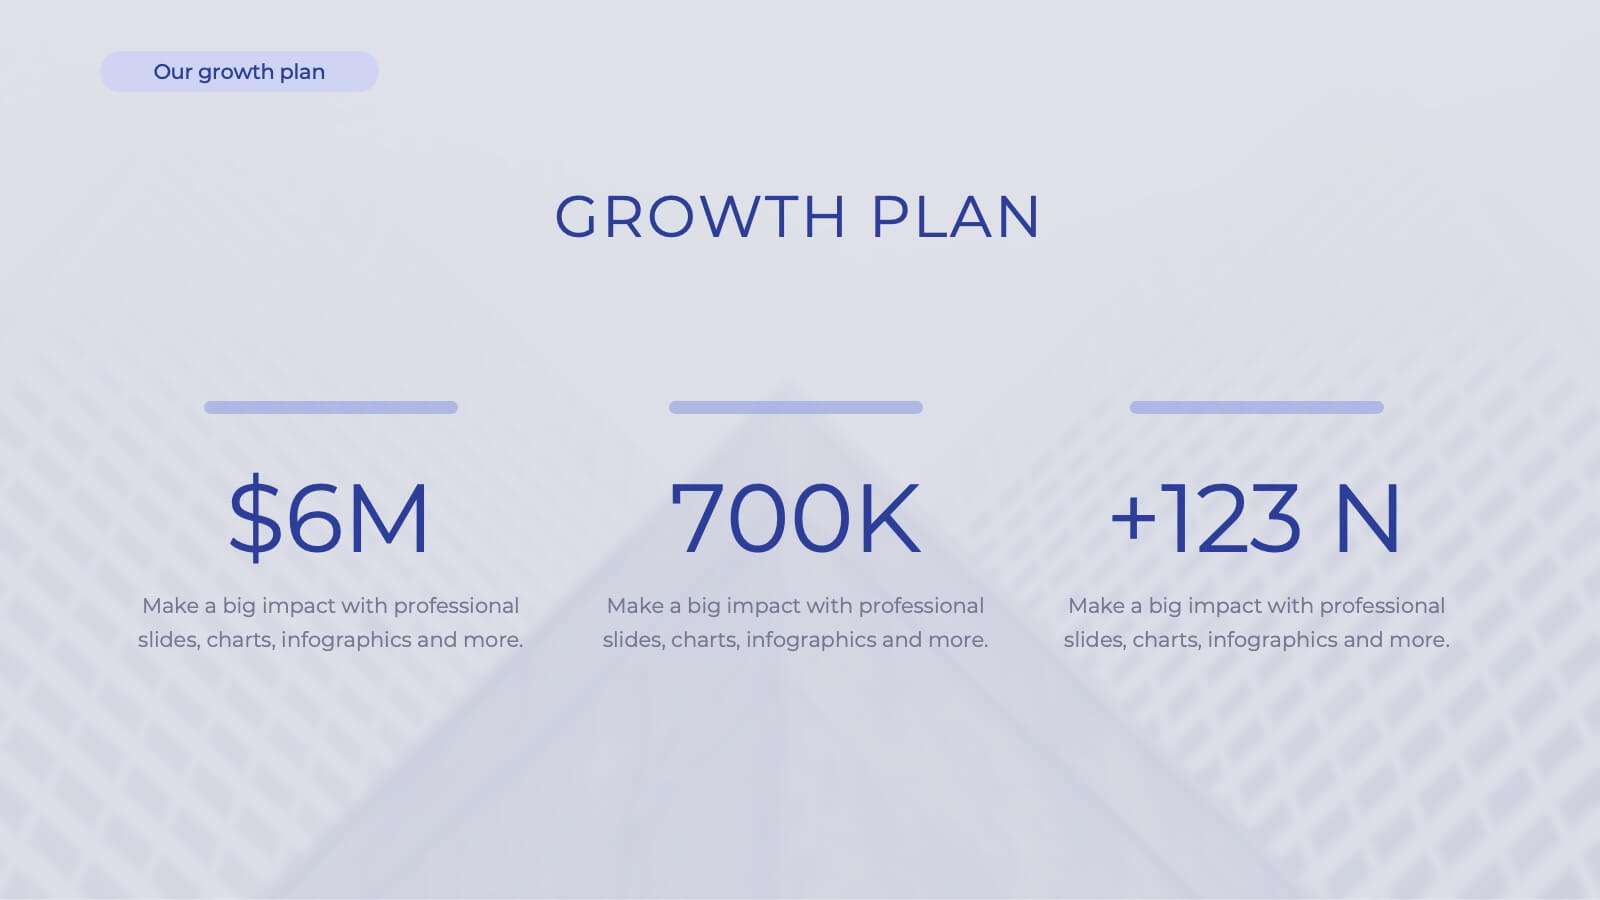
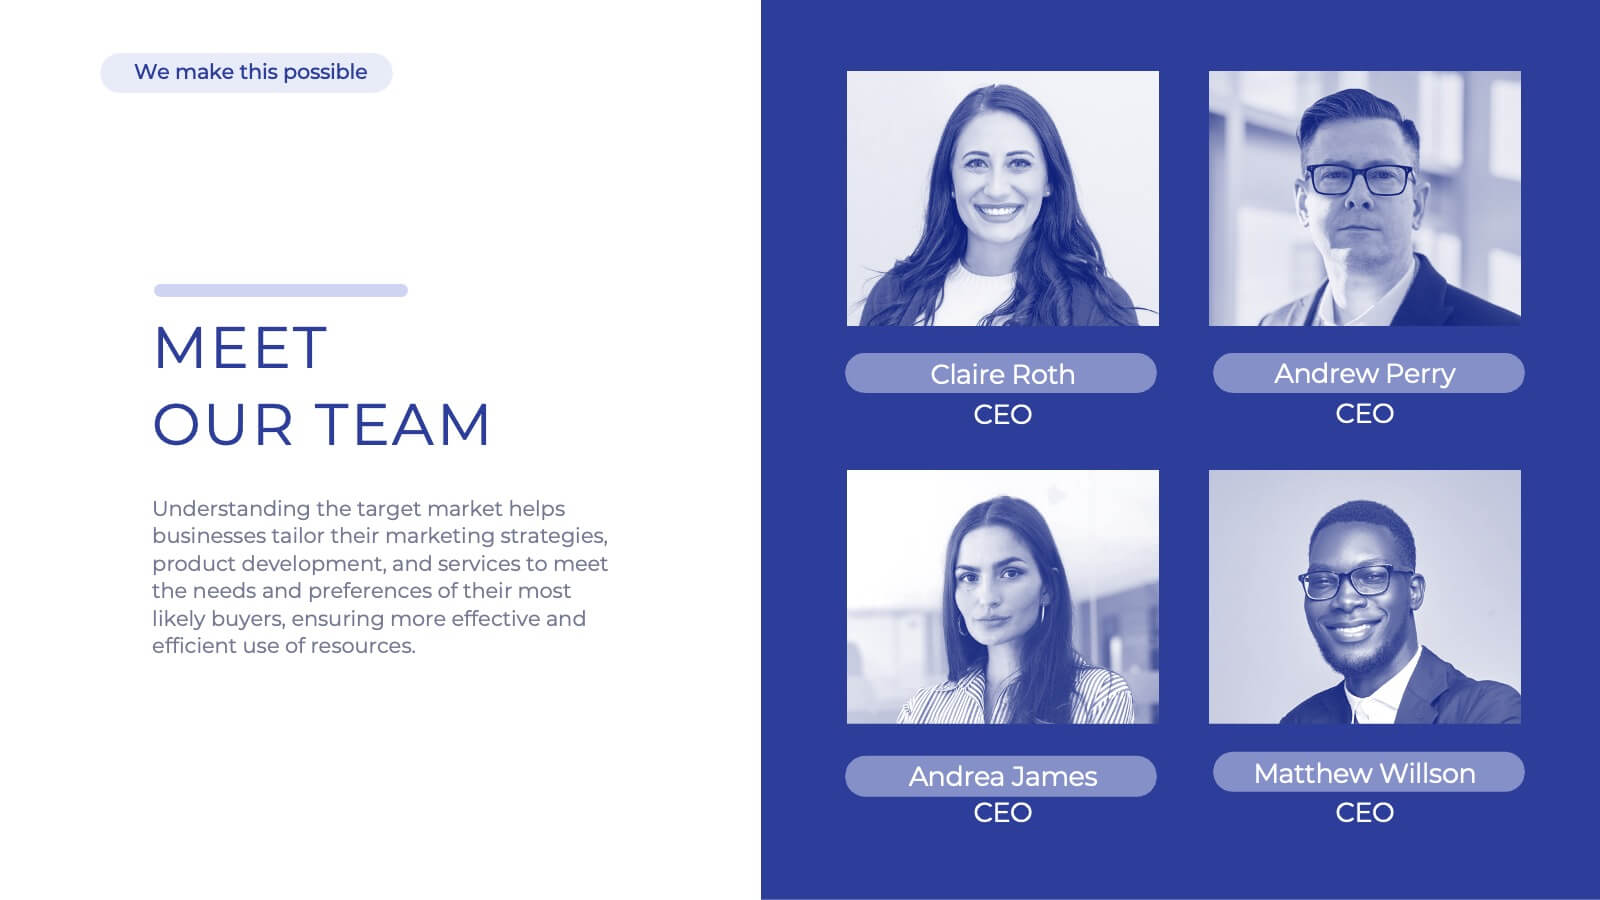
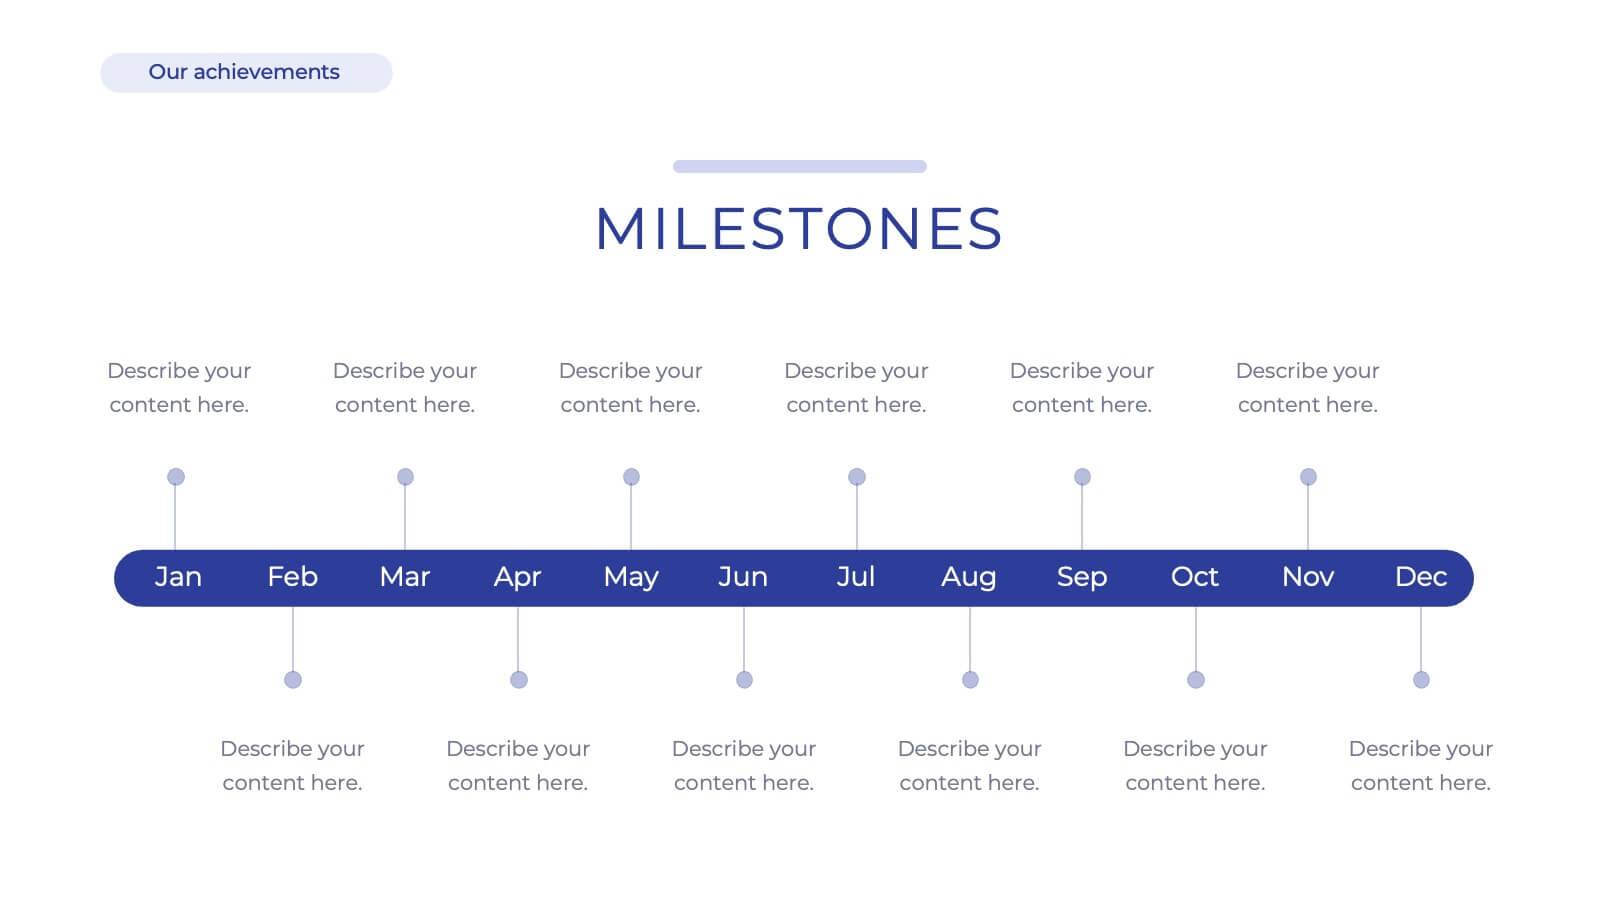
Iconic Startup Business Plan Presentation
Introducing our comprehensive corporate business plan template! Perfect for showcasing your company’s mission, vision, and services. Highlight your market strategy, competitive landscape, and growth plan in a professional design. Ideal for executives and entrepreneurs. Compatible with PowerPoint, Keynote, and Google Slides.


4 diapositivas
Sustainable Farming Practices Presentation
Explore the essentials of sustainable farming with our visually engaging presentation template. Perfect for educational and advocacy purposes, it outlines key practices that promote environmental sustainability in agriculture. This template features easy-to-understand graphics and placeholders for comprehensive discussions on eco-friendly farming techniques.


4 diapositivas
Innovation with Design Thinking Framework Presentation
Drive innovation with the Design Thinking Framework presentation. This visually engaging layout structures ideas, processes, and solutions into a clear and adaptable design. Perfect for brainstorming sessions, business strategy meetings, and creative problem-solving. Fully customizable and compatible with PowerPoint, Keynote, and Google Slides for a seamless workflow.


5 diapositivas
Environment News Infographics
Dive into the pressing issues of our times with environment news infographics. Crafted in shades of a serene blue palette, this collection is designed for environmental activists and journalists. It stands out with its creative, vertical style, making it perfect for detailed storytelling and comprehensive data representation related to environmental news and studies. Compatible with Powerpoint, Keynote, and Google Slides. The template features innovative graphics, icons, and image placeholders, all customizable to highlight ecological statistics, climate change advancements, or conservation efforts, making complex information accessible and engaging.


6 diapositivas
Eco-Initiatives and Sustainability Efforts Presentation
Highlight your green strategy with the Eco-Initiatives and Sustainability Efforts Presentation. This template features a clean, icon-based layout to showcase up to six key eco-friendly actions or goals. Ideal for CSR reports, environmental planning, or internal sustainability updates. Fully editable in PowerPoint, Google Slides, and Canva.


4 diapositivas
Patient Management in Medical Practice Presentation
Present medical processes with clarity using this lung-inspired diagram. Ideal for outlining patient care stages, treatment protocols, or clinical workflows. With four editable points, this design supports healthcare presentations in pulmonology, internal medicine, or hospital administration. Fully compatible with PowerPoint, Keynote, and Google Slides for easy customization.


3 diapositivas
Workflow Optimization Flow Chart Presentation
Streamline your processes with this Workflow Optimization Flow Chart presentation. Designed to help teams identify inefficiencies, visualize task flows, and improve decision-making. Featuring clearly labeled paths and decision points, it's ideal for process audits, operations planning, or training sessions. Fully editable in PowerPoint, Canva, and Google Slides.


7 diapositivas
Break Even Analysis Infographics Presentation Template
Break Even Analysis is a type of cost accounting, It's a critical tool for all businesses from start-ups to established firms. It allows you to evaluate how changes in the level of sales affect your total profit, or the number of purchases that must be made before the company or product makes a profit. This is also known as a break even point. Use this template to analyze your break-even point, the volume and price at which you will begin to earn a profit. This template comes with graphs and charts that will allow you to track the volume of your sales, monthly revenues, and variable expenses.


10 diapositivas
Financial Money Management Strategies Presentation
Break down your key financial strategies with this clear, wheel-style diagram. Perfect for outlining budgeting principles, savings goals, or investment methods, each segment includes space for titles and concise text. Ideal for financial advisors, consultants, or internal team planning. Fully customizable in PowerPoint, Keynote, and Google Slides.


4 diapositivas
Team Alignment and Discussion Summary Presentation
Foster collaboration and keep everyone on the same page with the Team Alignment and Discussion Summary presentation. This template highlights discussion points, action items, and key takeaways alongside a professional image layout—perfect for recaps, team syncs, and leadership updates. Fully editable in PowerPoint, Keynote, and Google Slides.


12 diapositivas
Risk Management and Security Compliance Presentation
Enhance your organizational resilience with the 'Risk Management and Security Compliance' presentation template. This intuitive design helps you communicate complex compliance standards and risk mitigation strategies effectively. Ideal for training sessions, board meetings, and compliance audits, ensuring your team stays informed and proactive in managing risks.