


Características


¿Tienes alguna pregunta?
Recomendar


4 diapositivas
Risk vs Impact Matrix Layout Presentation
Visualize risk levels clearly with the Risk vs Impact Matrix Layout Presentation. This customizable template helps you assess and categorize potential risks based on their likelihood and impact, using a clear 3x3 color-coded grid. Ideal for project managers, risk analysts, and strategy teams. Compatible with PowerPoint, Keynote, Google Slides, and Canva.


8 diapositivas
Air Travel Safety and Operations Presentation
Capture your audience’s attention with this aviation window-inspired layout, designed to visualize safety protocols or operational steps in air travel. Featuring four distinct segments arranged like a view through a plane window, it’s ideal for airline safety briefings, operational workflows, or compliance overviews. Fully editable in PowerPoint, Keynote, and Google Slides.


5 diapositivas
Climate Change Effects Infographics
Climate Change refers to long-term shifts in weather patterns and average temperatures on Earth. These infographic templates aim to raise awareness about the urgent need for climate action and illustrate the consequences of environmental changes. These can serve as impactful tools for discussing the consequences of climate change. Whether used in educational settings, environmental campaigns, or climate conferences, this template effectively communicates the urgency of the situation and encourages individuals and communities to take action to mitigate the impacts of climate change. Compatible with Powerpoint, Keynote, and Google Slides.


21 diapositivas
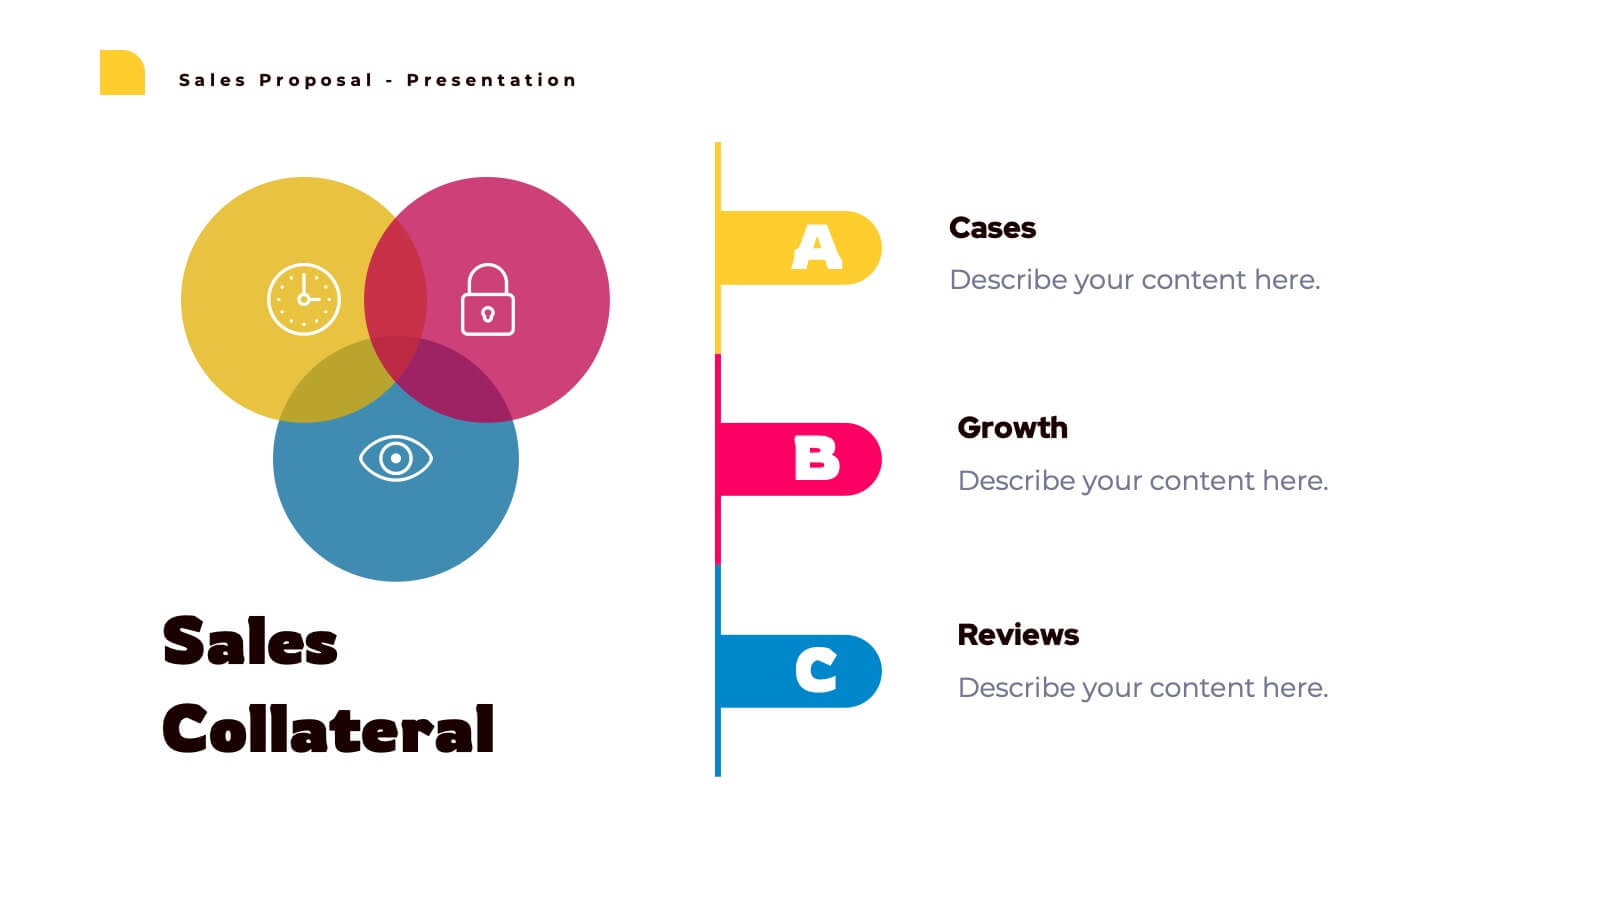
Lunaris Sales Proposal Presentation
An engaging and professional presentation designed to showcase sales proposals effectively. It features slides for objectives, market analysis, pricing strategies, team introductions, and performance metrics. The vibrant design ensures impactful communication with stakeholders. Fully editable and compatible with PowerPoint, Keynote, and Google Slides for seamless customization and presentation delivery.


4 diapositivas
Statistical Analysis Charts Presentation
Present your data with clarity using this Statistical Analysis Charts Presentation Template. Designed with overlapping bubble visuals and percentage indicators, it’s ideal for displaying survey results, statistical breakdowns, or demographic segments. Clean, modern, and fully editable in PowerPoint, Keynote, and Google Slides.


6 diapositivas
Hospital Management System Presentation
Bring structure and efficiency to your healthcare operations with this professional presentation. Designed to simplify complex hospital workflows, it helps visualize patient management, service coordination, and system processes with clarity. Ideal for administrators and consultants, it’s fully editable and compatible with PowerPoint, Keynote, and Google Slides for seamless customization.


19 diapositivas
Haze Sales Forecast Presentation
Elevate your sales strategy with this stunning Sales Forecast template! Designed to highlight your objectives, team, pricing strategies, and future opportunities, it presents data in a sleek and professional manner. Impress your audience with clear visuals and a modern aesthetic. Perfect for PowerPoint, Keynote, and Google Slides presentations!


4 diapositivas
Logistics Chain and Delivery Map Presentation
Navigate global supply chains with ease using this dynamic shipping and delivery slide. Designed around a cargo ship visual, this infographic helps teams outline each stage of their logistics journey—from origin to destination. Ideal for supply chain updates, shipping plans, or logistics strategy meetings. Fully compatible with PowerPoint, Keynote, and Google Slides.


6 diapositivas
4 Stage Roadmap Template
Navigate your projects with clarity using our "4 Stage Roadmap Template." This engaging presentation template offers a unique, pathway-like design to outline the progression of any project through four distinct stages. Each step is visually differentiated, making it easy to follow and understand the sequence and dependencies of tasks. Perfect for project managers and teams, this template ensures your strategic milestones are visually aligned and easy to communicate. Compatible with PowerPoint, Keynote, and Google Slides, it's an essential tool for effective project visualization and management.


6 diapositivas
Cloud IT Infrastructure Design Presentation
Transform the way you explain cloud systems with this modern, data-driven presentation. Ideal for outlining infrastructure layers, deployment strategies, or network operations, it uses a clean, cloud-inspired layout for clarity and impact. Fully customizable and compatible with PowerPoint, Keynote, and Google Slides for a smooth, professional presentation experience.


6 diapositivas
Data-Driven Decision Making Presentation
Showcase your data-to-action process with this clean, step-by-step layout. Ideal for illustrating analytics workflows, this template features five connected stages with modern icons and clear labeling. Perfect for business, tech, or strategy presentations. Fully editable in Canva, PowerPoint, and Google Slides to match your branding and communication needs.


6 diapositivas
Business Success Case Study
Showcase your brand's impact with this clean, image-forward case study slide. Designed for storytelling, it outlines the Problem, Solution, and Approach alongside a product image—perfect for client wins, pitch decks, and brand storytelling. Fully customizable in PowerPoint, Keynote, and Google Slides.


8 diapositivas
Investor Business Plan Presentation
The "Investor Business Plan Presentation" template is innovatively designed to illustrate the balance and interdependence of various business elements critical for attracting investors. Utilizing a seesaw mechanism as a metaphor, this template vividly demonstrates how key aspects like Partners, Resources, Activities, and Channels contribute to maintaining a stable and functional business model. Each section of the seesaw is colored differently to distinguish between the categories, providing a clear visual hierarchy. This presentation format is excellent for startups and existing businesses preparing to pitch to investors, highlighting how each strategic component is vital for overall success and stability in the market.


7 diapositivas
Customer Service Profile Infographic Presentation
A Customer Profile infographic is a visual representation of a target customer or customer segment that provides important information about their demographics, behavior, preferences, and needs. This template can help businesses and organizations understand their customers better, tailor their products or services to meet their needs, and develop effective marketing strategies. This template can be used for various purposes, such as to guide product development, to inform marketing campaigns, or to improve customer service. This template is compatible with Powerpoint, keynote and google slides.


21 diapositivas
Sapphire Graphic Design Project Plan Presentation
Make your next project plan sparkle with this sleek, sapphire-inspired presentation design! This template is perfect for showcasing your graphic design project, helping you organize key milestones, timelines, and objectives. With its modern layout and clean aesthetics, your ideas will stand out beautifully. Compatible with PowerPoint, Keynote, and Google Slides.


4 diapositivas
Top Priorities and Checklist Format Presentation
Stay focused and aligned with the Top Priorities and Checklist Format Presentation. This clear, checklist-based design is ideal for highlighting action items, goals, or key project deliverables. Visually guide your team with structured sections and a checklist illustration that reinforces accountability. Fully editable in PowerPoint, Keynote, and Google Slides.


5 diapositivas
History of Photography Infographics
The History of Photography traces back to the early 19th century when the concept of capturing and preserving images through a camera was first realized. These infographic templates provide a visually stunning format to showcase the key milestones, influential photographers, and technological advancements that shaped the history of photography. The template consists of vertical infographics, making it easy to present information in a visually appealing and organized manner. It is compatible with Powerpoint, Keynote, and Google Slides, ensuring seamless customization and adaptability to your specific needs.