


Características


¿Tienes alguna pregunta?
Recomendar


6 diapositivas
McKinsey Strategy Implementation Model Presentation
Visualize organizational alignment with the McKinsey 7S Model slide. Featuring a clean circular layout, it highlights Strategy, Structure, Systems, Shared Values, Style, Staff, and Skills. Ideal for consulting, planning, or leadership presentations. Fully editable and compatible with PowerPoint, Google Slides, and Keynote for easy customization and branding.


4 diapositivas
Project Milestone Path Roadmap Presentation
Bring your project plan to life with a clean, colorful layout that makes every milestone easy to follow across each quarter. This presentation helps you organize tasks, timelines, and progress in a clear visual path that supports smarter planning and team alignment. Fully compatible with PowerPoint, Keynote, and Google Slides.


3 diapositivas
Cost-Benefit Analysis and Strategic Outcomes Presentation
Present trade-offs with clarity using the Cost-Benefit Analysis and Strategic Outcomes Presentation. Designed with visual balance scales and segmented callouts, this layout helps you compare investments versus returns, making complex decisions easier to explain. Ideal for proposals, audits, or business strategy reviews. Fully editable in PowerPoint, Keynote, and Google Slides.


7 diapositivas
State-by-State Business Data Presentation
Break down insights with this State-by-State Business Data Presentation. Featuring a U.S. map segmented by regions, this slide is ideal for illustrating localized performance, regional statistics, or market segmentation. Customize text labels and highlight specific zones to match your business needs. Fully editable in PowerPoint, Keynote, and Google Slides.


7 diapositivas
Supply Chain Process Mapping Presentation
Streamline your logistics and operations presentations with the Supply Chain Process Mapping Presentation. Featuring a linked-chain visual, this editable template is ideal for outlining each step in your supply flow—from sourcing to delivery. Highlight dependencies, bottlenecks, or key stages with customizable color coding. Fully compatible with PowerPoint, Keynote, and Google Slides.


7 diapositivas
Cause and Consequence Bowtie Model Presentation
Turn complex risks into clear, visual logic with a balanced, intuitive diagram that connects causes to consequences. This presentation is perfect for showcasing preventive and corrective actions in business or project management. Fully customizable and compatible with PowerPoint, Keynote, and Google Slides for a professional, data-driven approach.


23 diapositivas
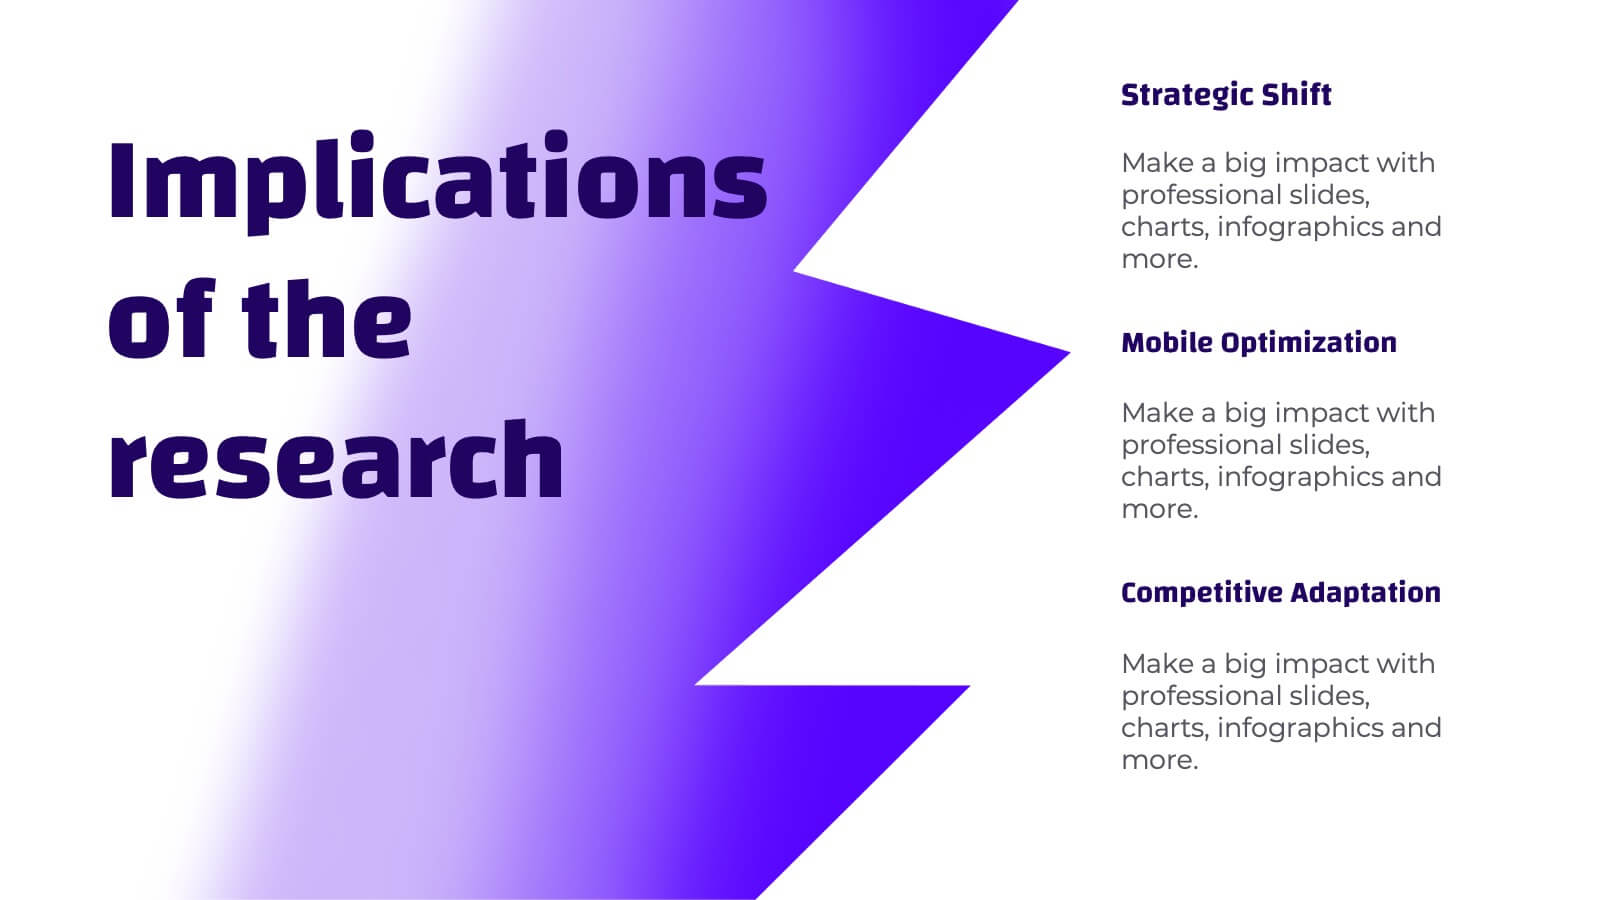
Naiad Qualitative Research Findings Presentation
Dive into your data with this refreshing, Naiad-inspired presentation template, perfect for sharing qualitative research findings! Designed to showcase insights, trends, and key conclusions with clarity, this visually appealing layout ensures your research captivates and informs. Make your data flow effortlessly. Compatible with PowerPoint, Keynote, and Google Slides for easy customization.


6 diapositivas
Mission and Values Overview Presentation
Your company's purpose deserves a visually stunning story! This infographic presentation template helps you clearly outline core values and mission statements with an engaging, structured design. Ideal for business strategy meetings, corporate presentations, and branding discussions, it keeps your content professional and impactful. Fully customizable and compatible with PowerPoint, Keynote, and Google Slides.


4 diapositivas
Financial Table Layout Presentation
Bring your numbers to life with a clear, colorful layout that makes financial details easy to compare at a glance. This presentation helps you organize pricing tiers, budget insights, or account summaries with clean structure and smooth readability. Fully compatible with PowerPoint, Keynote, and Google Slides.


5 diapositivas
Marketing Sales Funnel Presentation
Watch your customer journey come to life with a clean, visual flow that makes each stage easy to understand at a glance. This presentation breaks down your funnel into clear steps, helping you explain conversions, behaviors, and strategy with confidence. Fully compatible with PowerPoint, Keynote, and Google Slides.


6 diapositivas
Business Growth Metrics Butterfly Chart Presentation
Track growth and risk side by side with this butterfly chart template. Ideal for business performance analysis, it visually compares positive and negative metrics across six categories. Fully editable in PowerPoint, Keynote, or Google Slides, this layout makes it easy to highlight trends, evaluate risks, and support data-driven decisions.


5 diapositivas
Country Highlight Asia Map Presentation
Showcase your regional insights with a clean and modern map that brings focus to key countries across Asia. Ideal for displaying market reach, growth metrics, or strategic locations, this visual layout makes data storytelling simple and effective. Fully compatible with PowerPoint, Keynote, and Google Slides for easy customization.


6 diapositivas
Sports Training Program Presentation
Get ready to energize your audience with a slide that feels fast, motivating, and built for action. This presentation helps you outline key training steps, performance goals, and athletic milestones in a clean, visual way that keeps information clear and engaging. Fully compatible with PowerPoint, Keynote, and Google Slides.


23 diapositivas
Blade Corporate Strategy Proposal Presentation
Prepare to captivate your audience with the Blade Corporate Strategy Proposal template! This sleek and modern design is perfect for professionals looking to present their strategic objectives with clarity and impact. The template features a balanced color palette of blue and white, exuding professionalism while ensuring your content stands out. From analyzing the current landscape to outlining key challenges and growth opportunities, each slide is meticulously crafted to convey your strategic vision effectively. The clean layout ensures that complex data, such as SWOT analysis, performance metrics, and competitive analysis, is easily digestible. With dedicated sections for team roles, resource allocation, and timelines, this template helps you guide your audience through every step of your strategic plan. Fully compatible with PowerPoint, Keynote, and Google Slides, the Blade template is your go-to choice for delivering presentations that resonate with decision-makers and stakeholders alike.


5 diapositivas
Operational Structure Layout Presentation
Visualize team hierarchies and departmental flow with this operational structure layout. Ideal for displaying reporting lines, management roles, or project leads. Clean, minimal, and easy to edit in Canva, PowerPoint, or Google Slides—perfect for internal presentations, HR planning, or business development overviews. Keep your structure clear and professional.


4 diapositivas
Oceania Region Editable Map Slide Presentation
Highlight your insights across Australia and the Pacific with a clean, modern map layout designed for clarity and engagement. Ideal for visualizing market regions, travel data, or geographic comparisons, this slide combines style with precision. Fully compatible with PowerPoint, Keynote, and Google Slides for effortless customization and presentation.


21 diapositivas
Cerberus Project Timeline Presentation
Bring your project vision to life with a well-structured plan that flows effortlessly. This presentation covers everything from objectives and timelines to budget breakdowns, team introductions, and next steps, helping you communicate key details with clarity. Perfect for internal or client presentations, and fully compatible with PowerPoint, Keynote, and Google Slides.