


Características


¿Tienes alguna pregunta?
Recomendar


7 diapositivas
Brain Structure Infographic
Unlock the marvels of the human mind with our brain structure infographic. Resting on a pristine white canvas and enriched by the calming green, profound blue, and enlightening yellow, this template meticulously dissects the intricacies of brain anatomy. Adorned with detailed infographics, illustrative icons, and specific image placeholders, it dives deep into the regions and functions of the brain. Impeccably tailored for Powerpoint, Keynote, or Google Slides. An indispensable resource for neuroscientists, educators, medical students, or anyone with an intrigue for cerebral wonders. Venture with insight; let each slide be your guide through the labyrinth of the human brain.
7 diapositivas
Arrow Functions Infographic
Illuminate the nuances of arrow functions with our arrow functions infographic. Displayed on a sleek white backdrop, enhanced with purposeful green, analytical blue, and definitive black, our template articulates the mechanics and applications of arrow functions with utmost clarity. Fitted with lucid infographics, representative icons, and flexible image placeholders, it breaks down the technicalities into digestible insights. Immaculately adapted for Powerpoint, Keynote, or Google Slides. A quintessential tool for software developers, coding instructors, students, or any tech-savvy individual keen on deepening their understanding.


6 diapositivas
Territorial Presence Across the Globe Presentation
Visualize your worldwide footprint with this territorial presence map. Highlight key regions using color-coded markers linked to strategic points, teams, or operations. Ideal for corporate overviews, investor updates, and expansion plans. Fully editable and easy to customize in PowerPoint, Keynote, or Google Slides for impactful global presentations.


4 diapositivas
Device Mockup Display Slide Presentation
Showcase your digital products with this device mockup slide. Ideal for highlighting landing pages, dashboards, or app interfaces, the layout includes clean typography and vibrant shapes for visual balance. Fully editable in PowerPoint, Keynote, and Google Slides—customize text, colors, and images to fit your tech brand or presentation style.


5 diapositivas
Growth and Scale Indicators Overview Presentation
Highlight your company's upward momentum with the Growth and Scale Indicators Overview Presentation. This slide features a pyramid-style design to represent five progressive milestones or performance metrics, perfect for visualizing success benchmarks or key achievements. Fully customizable in Canva, PowerPoint, Keynote, and Google Slides for seamless integration into your presentations.


7 diapositivas
Network Infographics Presentation Template
Networking is a great way to meet people in your same field and gain valuable information. It's a great way to meet and connect with other professionals, find out about job opportunities, and keep up with what's new in your field. This template is perfect for becoming informed on the benefits of networking. Networking is a powerful way to expand your circle of contacts and get in touch with people who can help you advance in your career. This template includes a helpful infographic that explains the standard process, visualizations and diagrams, providing you with a great starting point.


5 diapositivas
Multi-Layer Concentric Diagram Presentation
Make a splash with your ideas using this layered ripple-style layout! Perfect for visualizing cascading strategies, phased impacts, or multi-tiered processes, this multi-layer concentric diagram turns complex data into clean, memorable visuals. Fully compatible with PowerPoint, Keynote, and Google Slides, it’s ready to elevate your next presentation.


6 diapositivas
Project Proposal Slide Deck Presentation
Make your next pitch unforgettable with a clean, structured layout that turns complex project ideas into a clear visual story. Ideal for presenting timelines, goals, or performance metrics, it helps you communicate your proposal with confidence and precision. Fully compatible with PowerPoint, Keynote, and Google Slides for effortless editing.


20 diapositivas
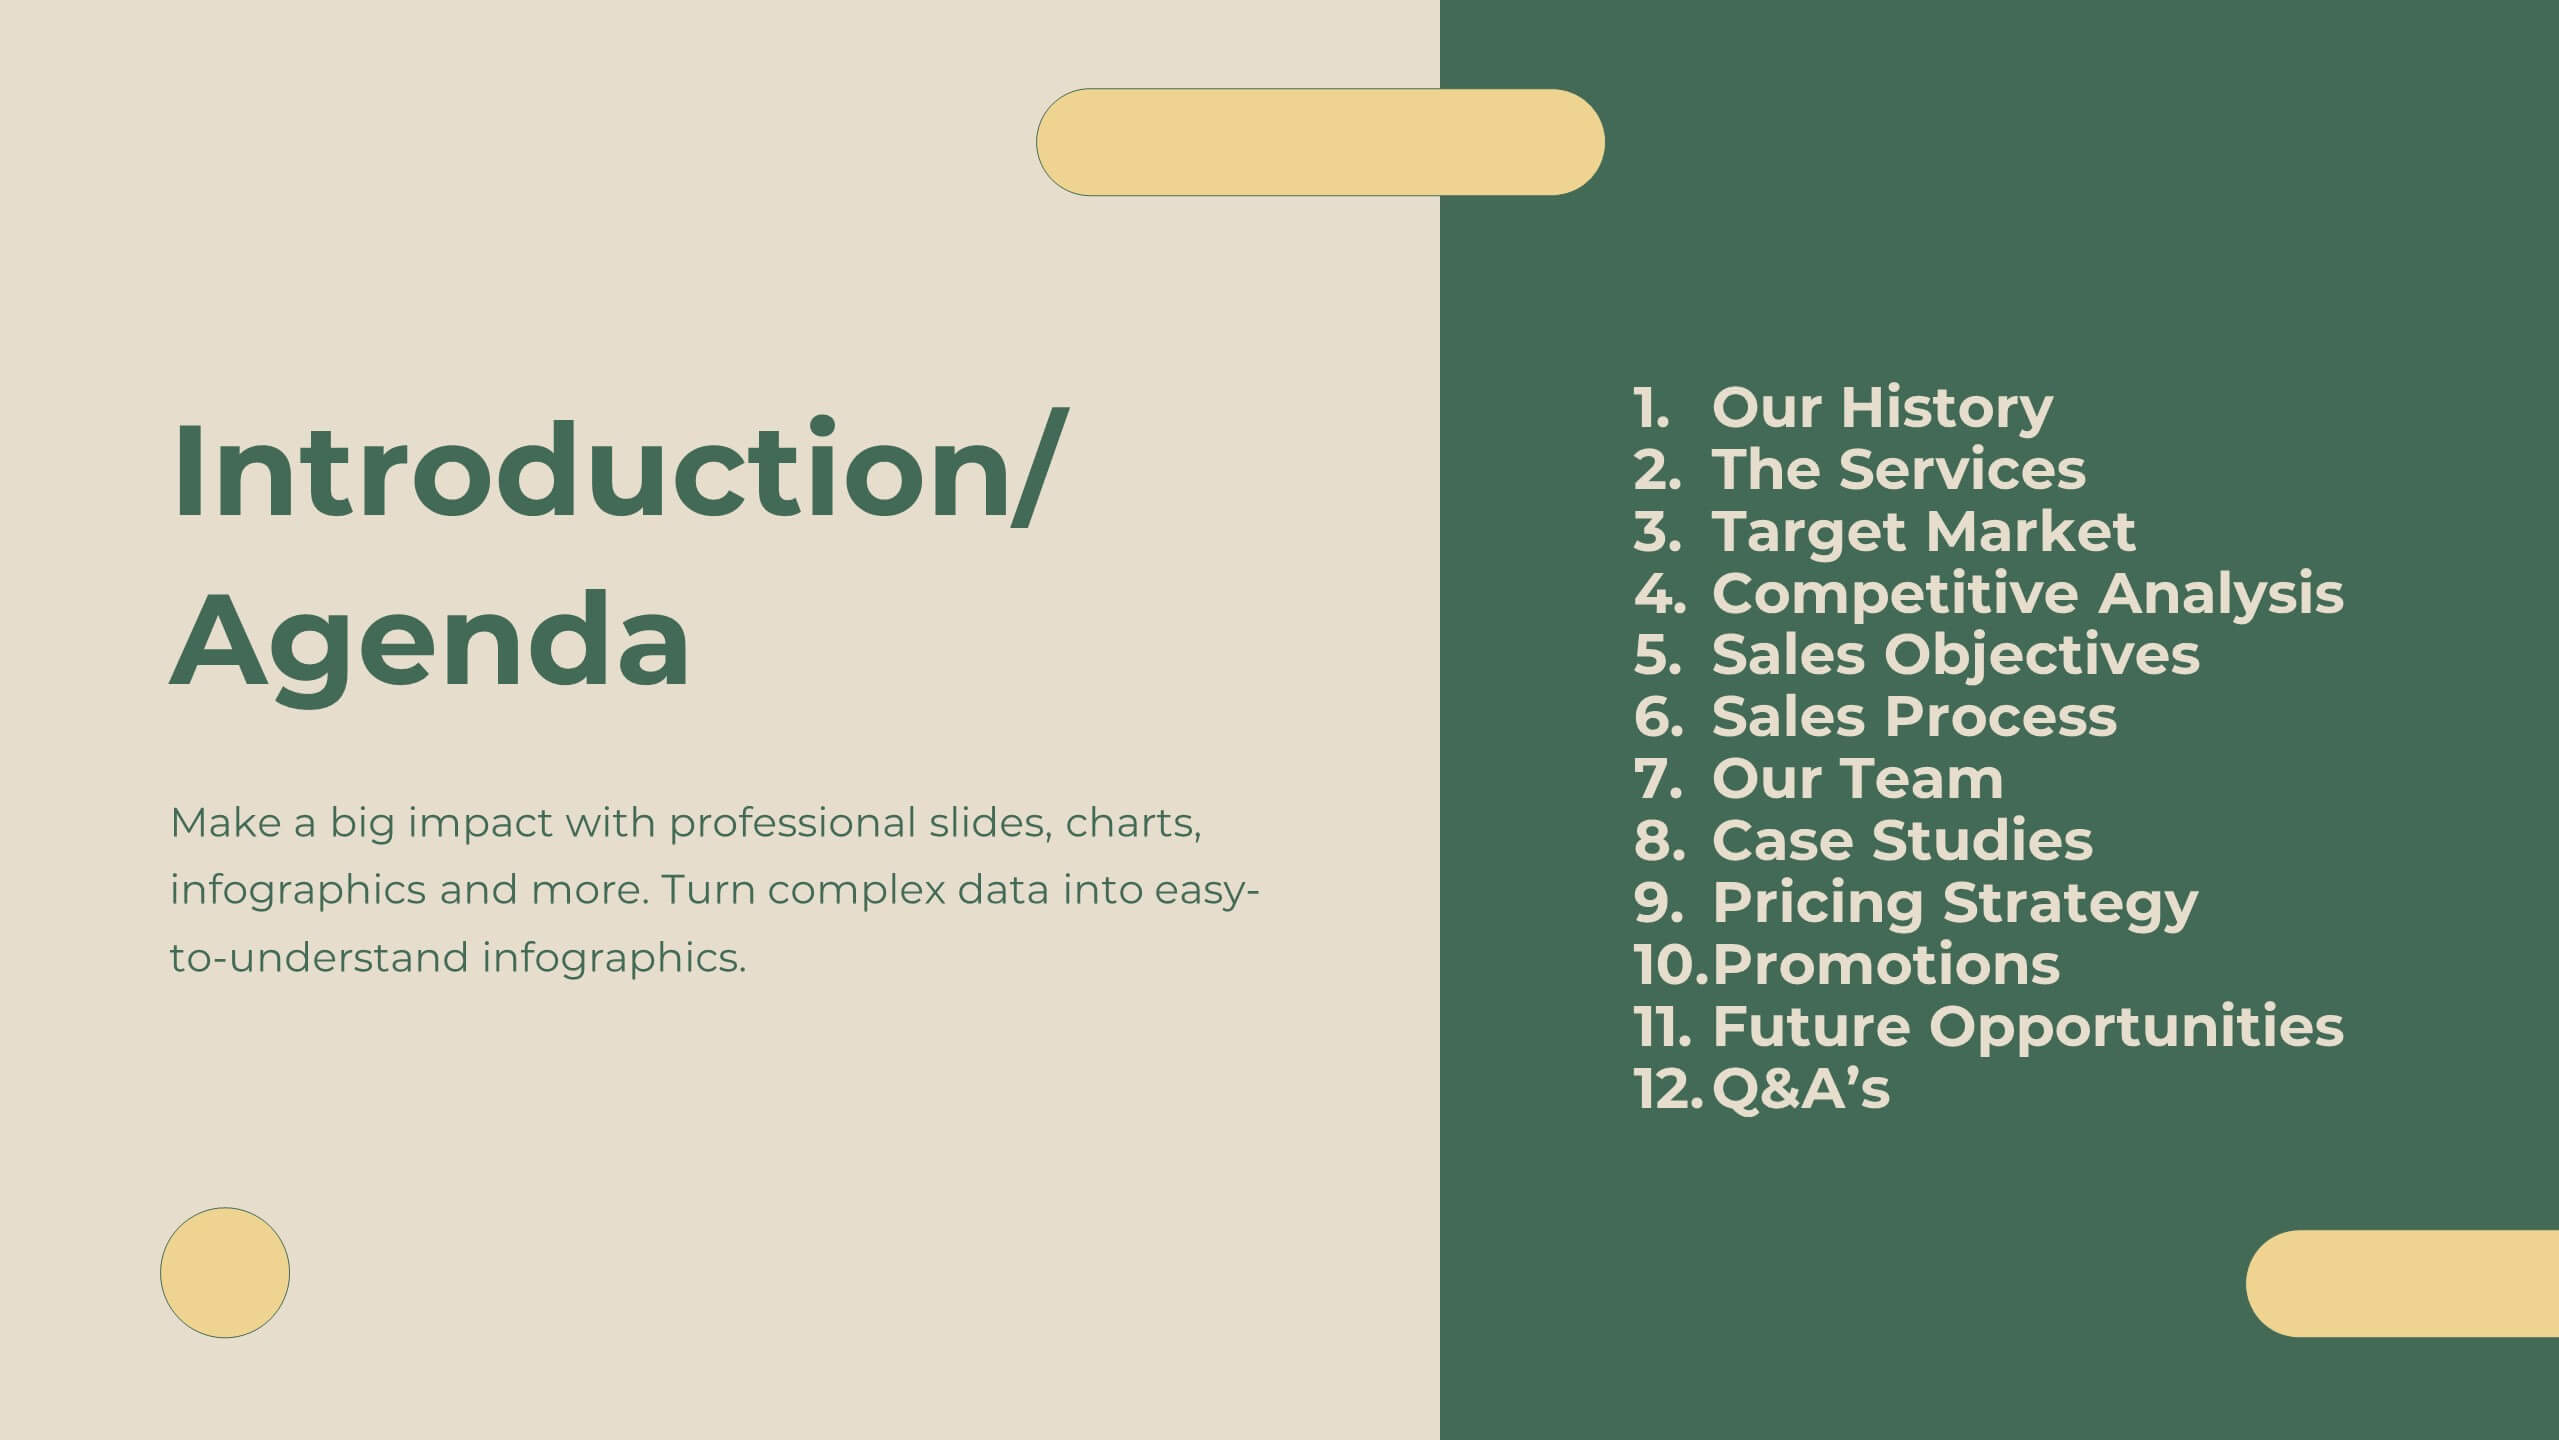
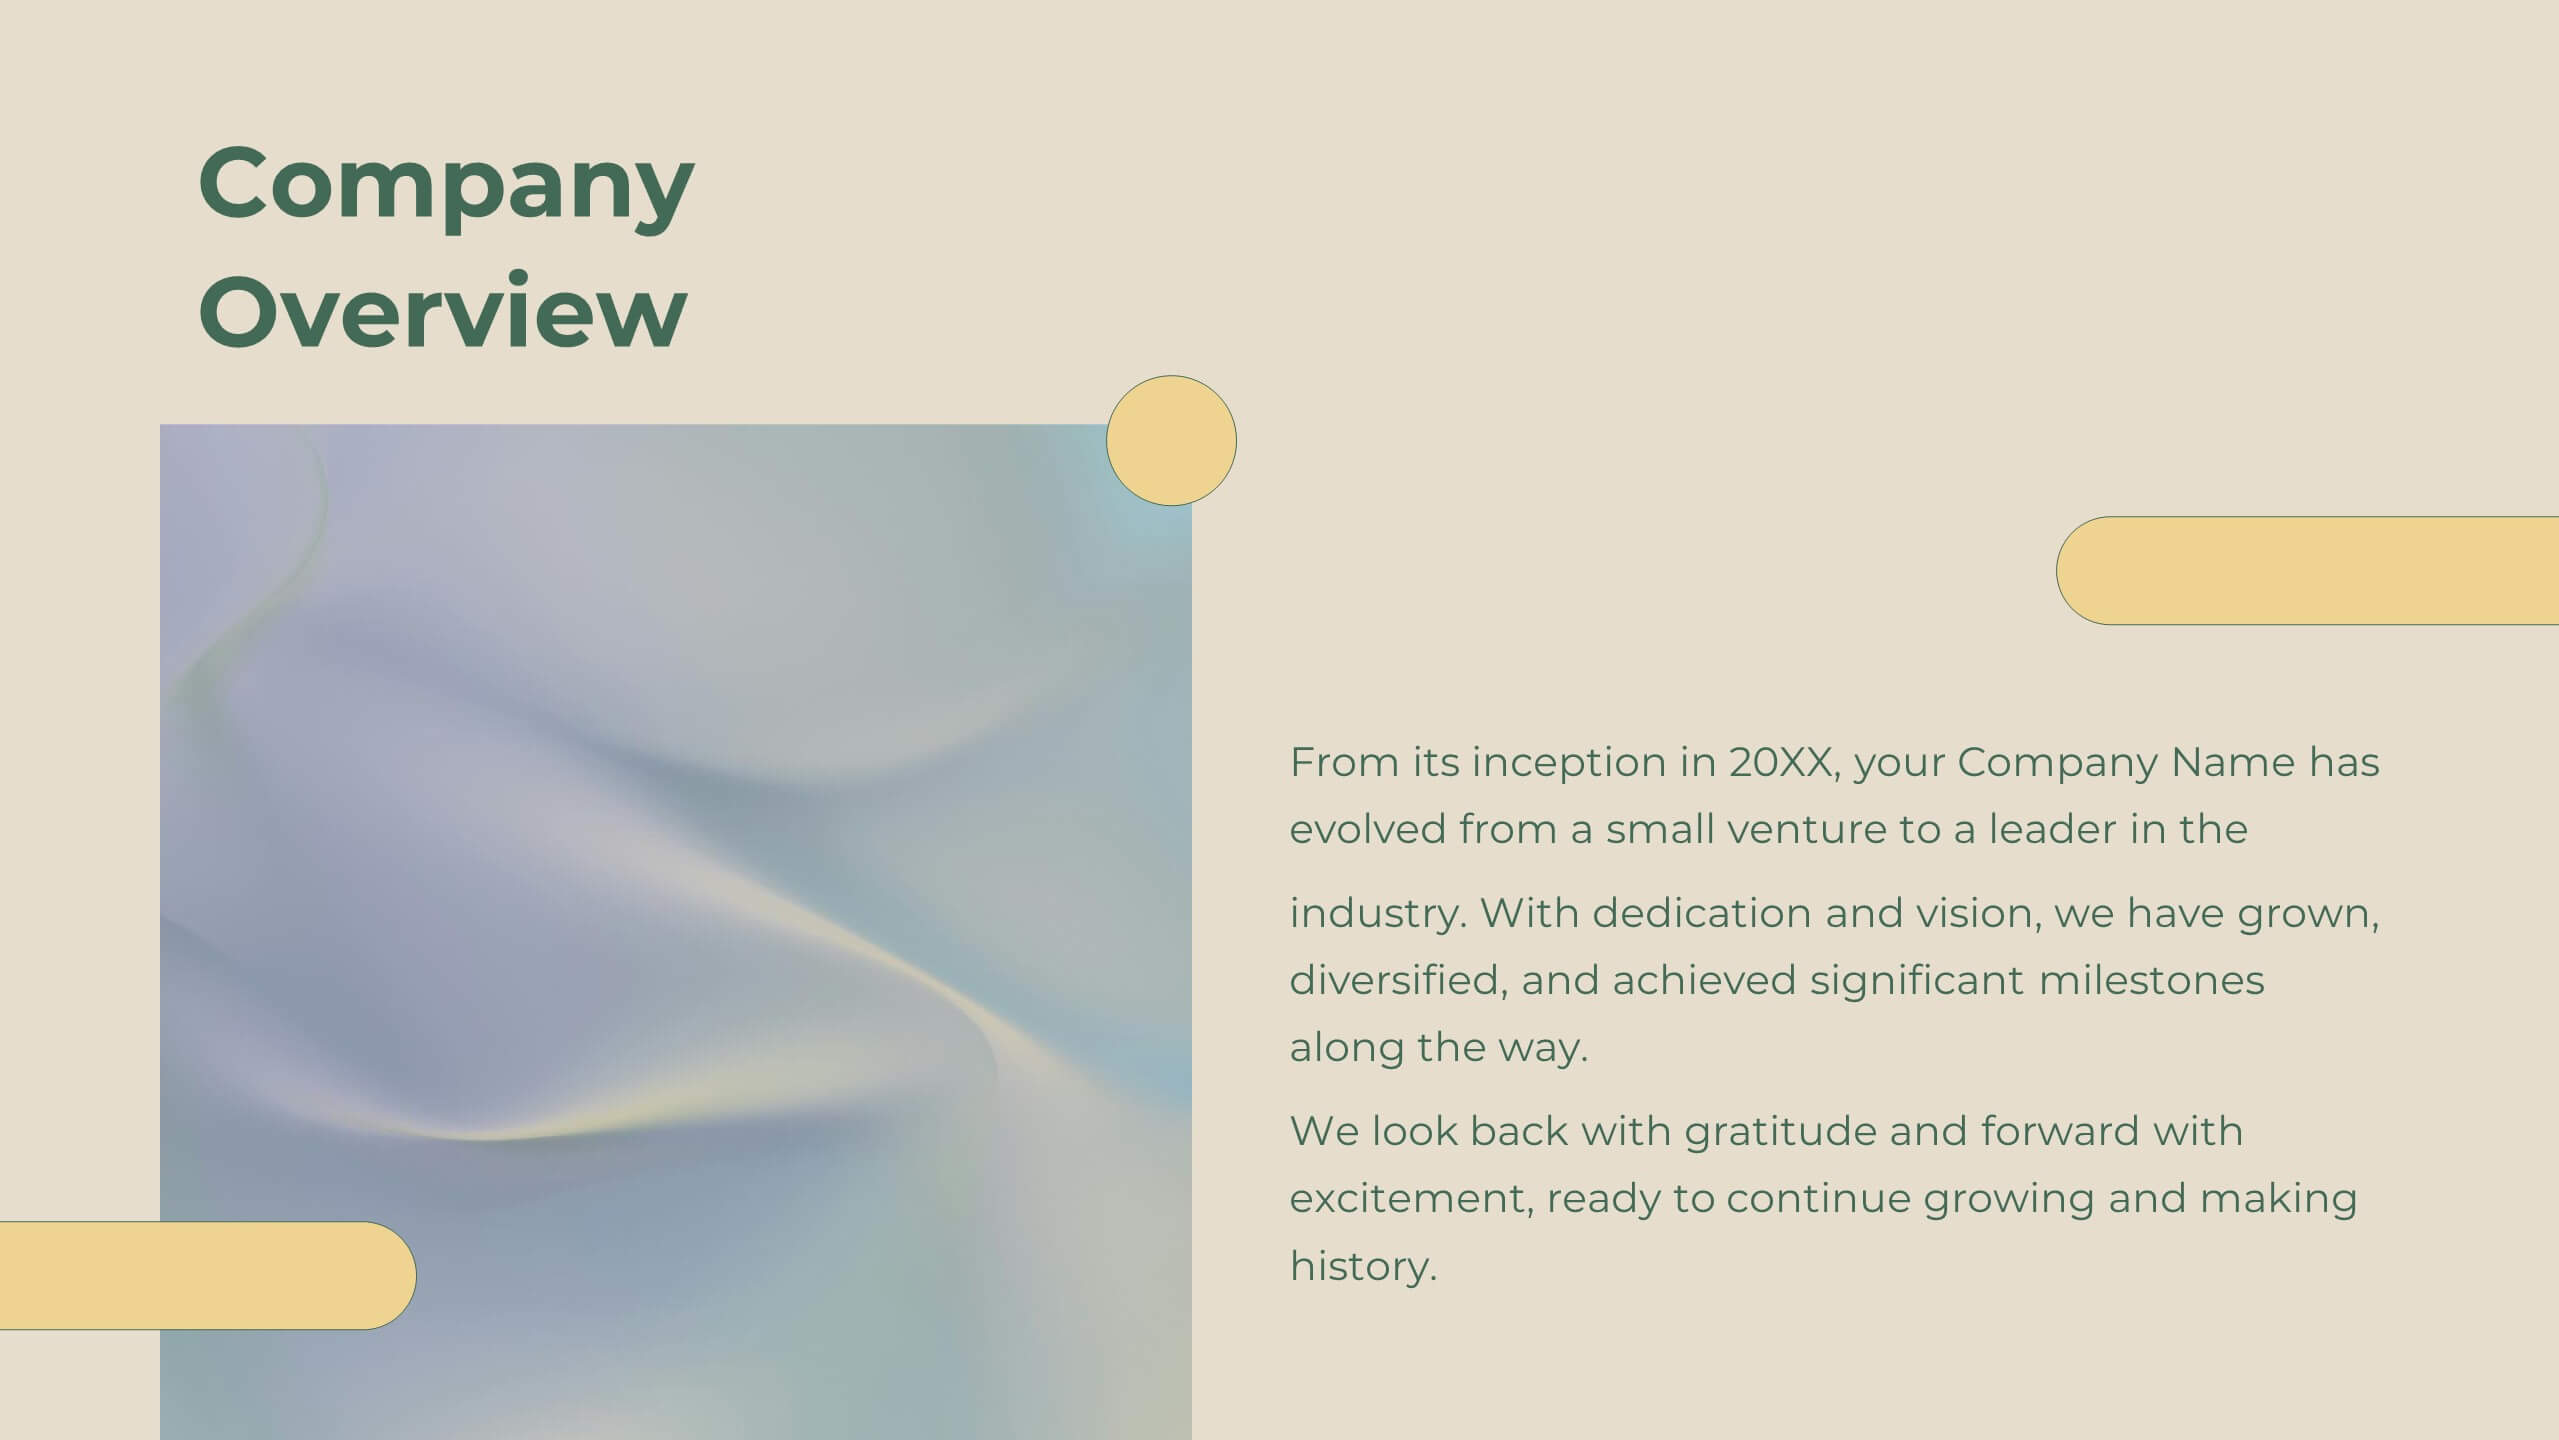
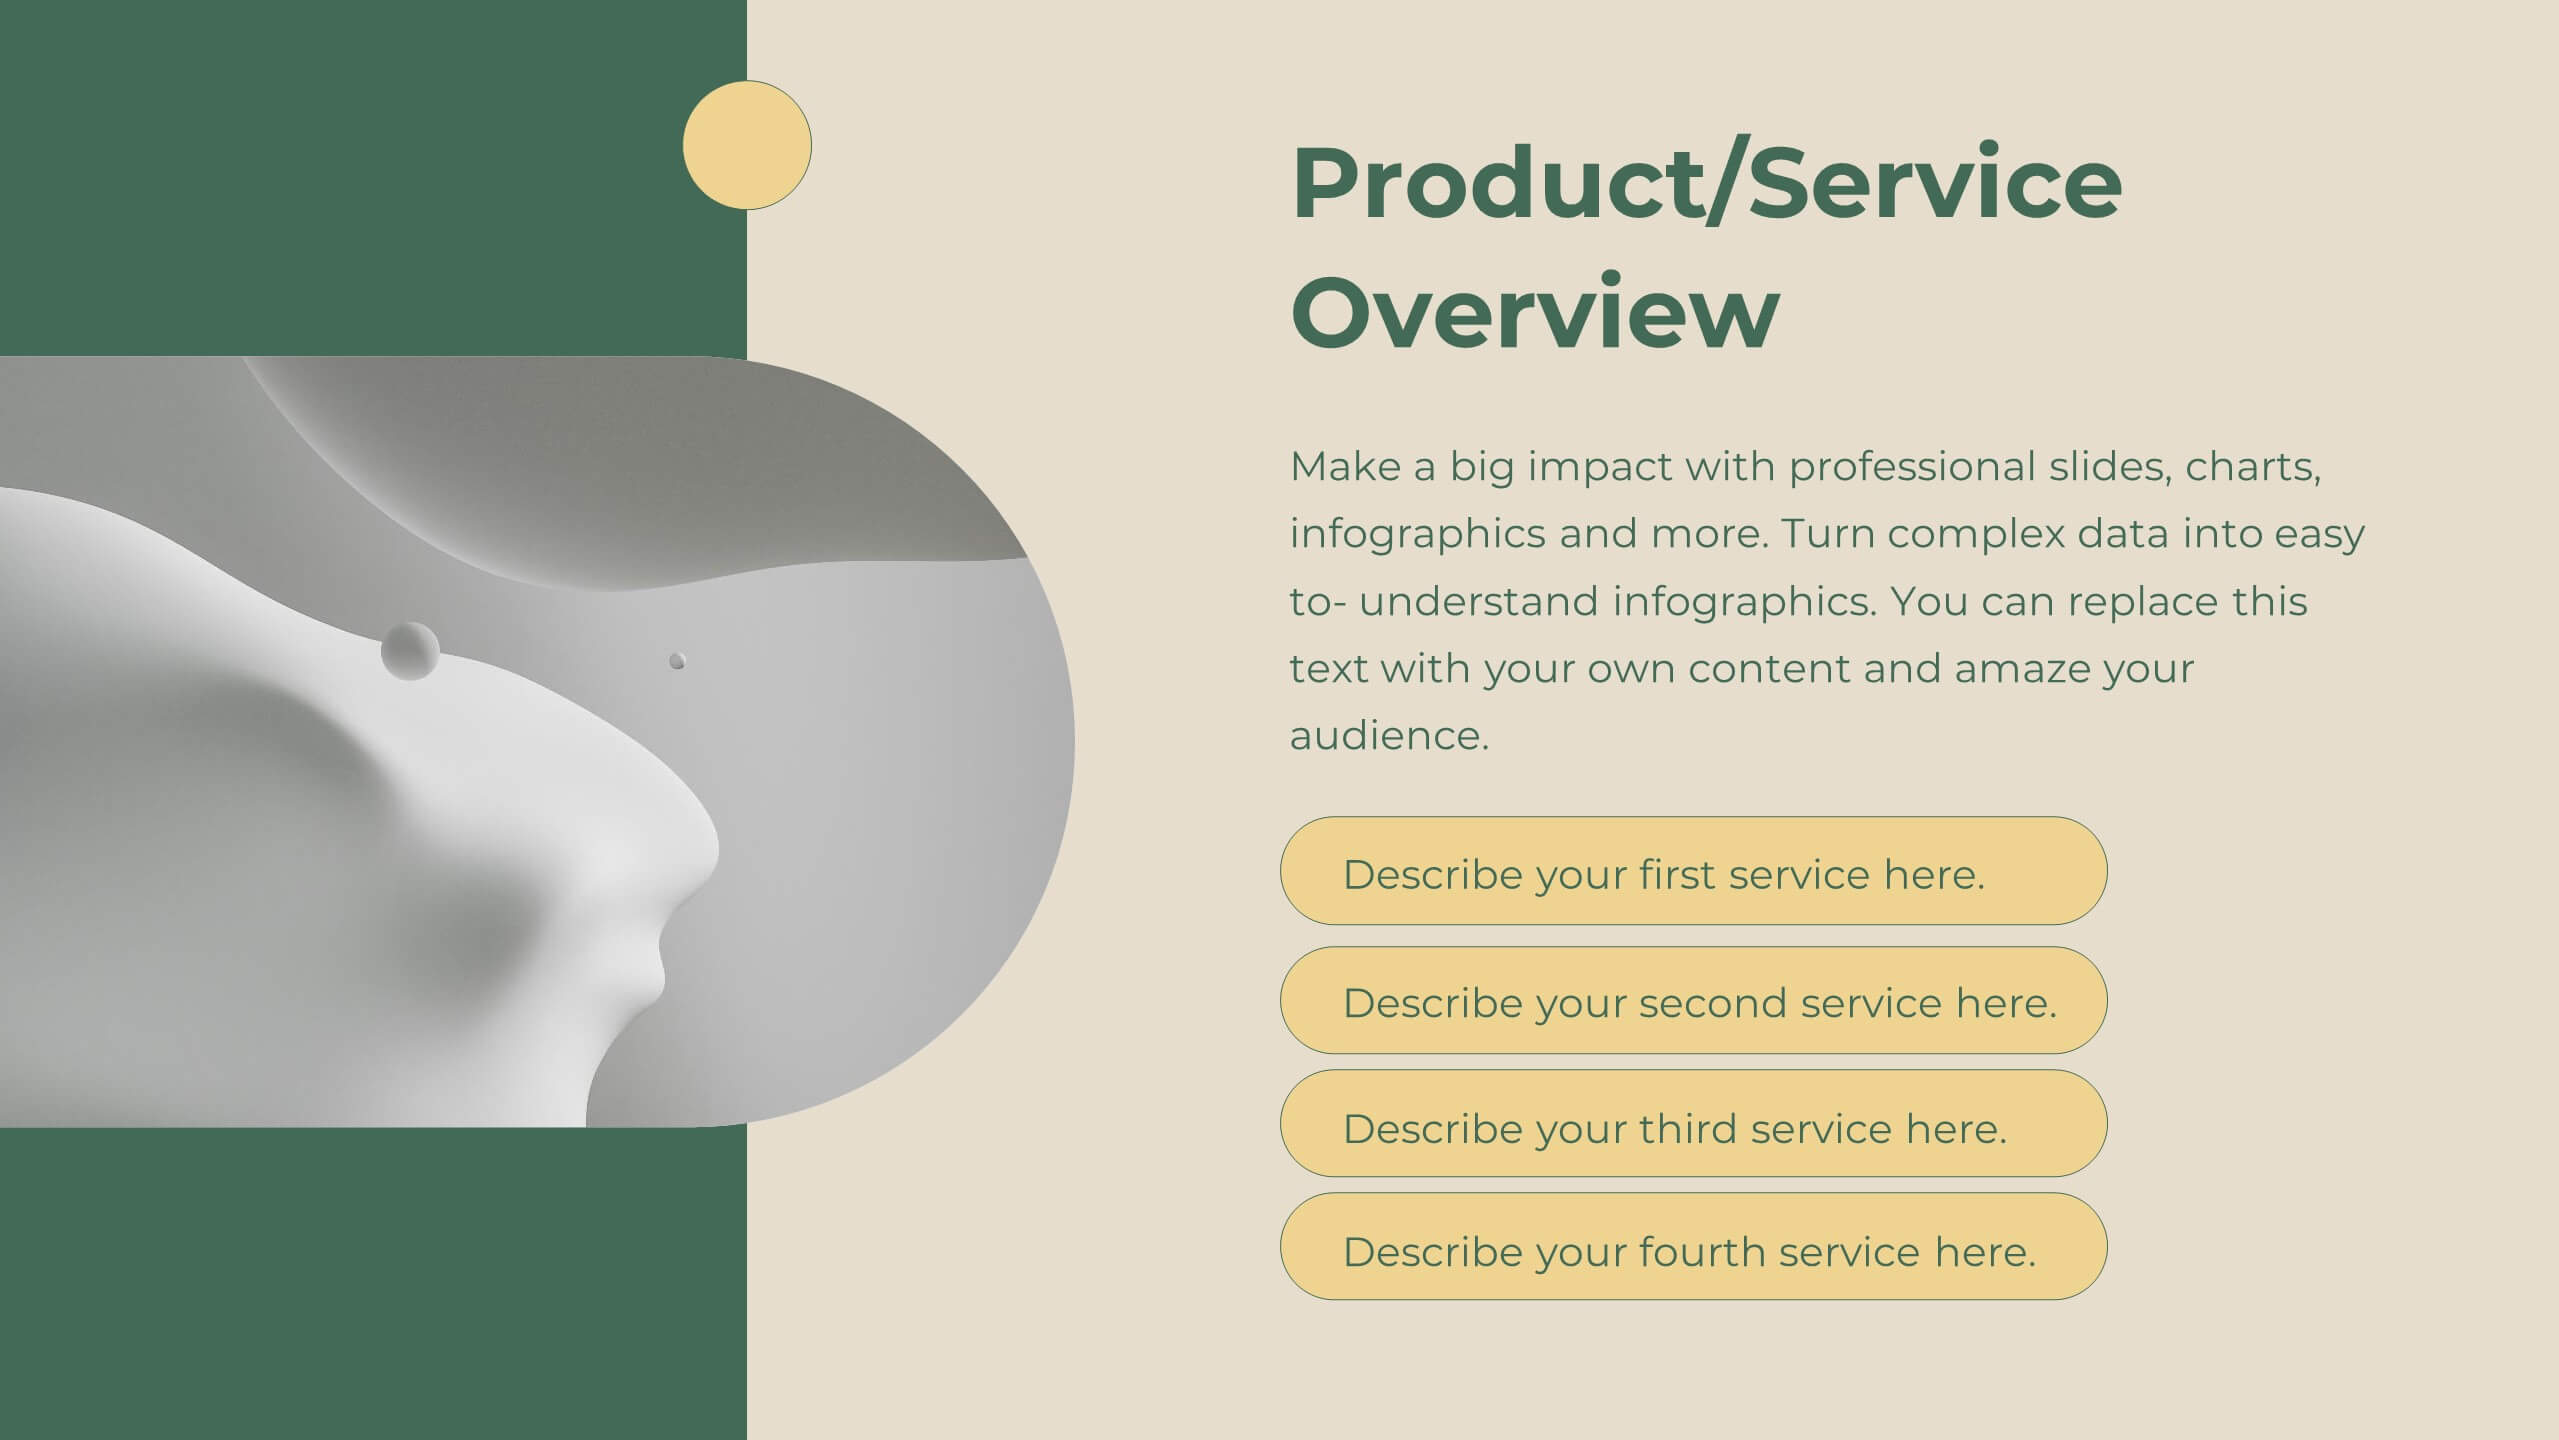
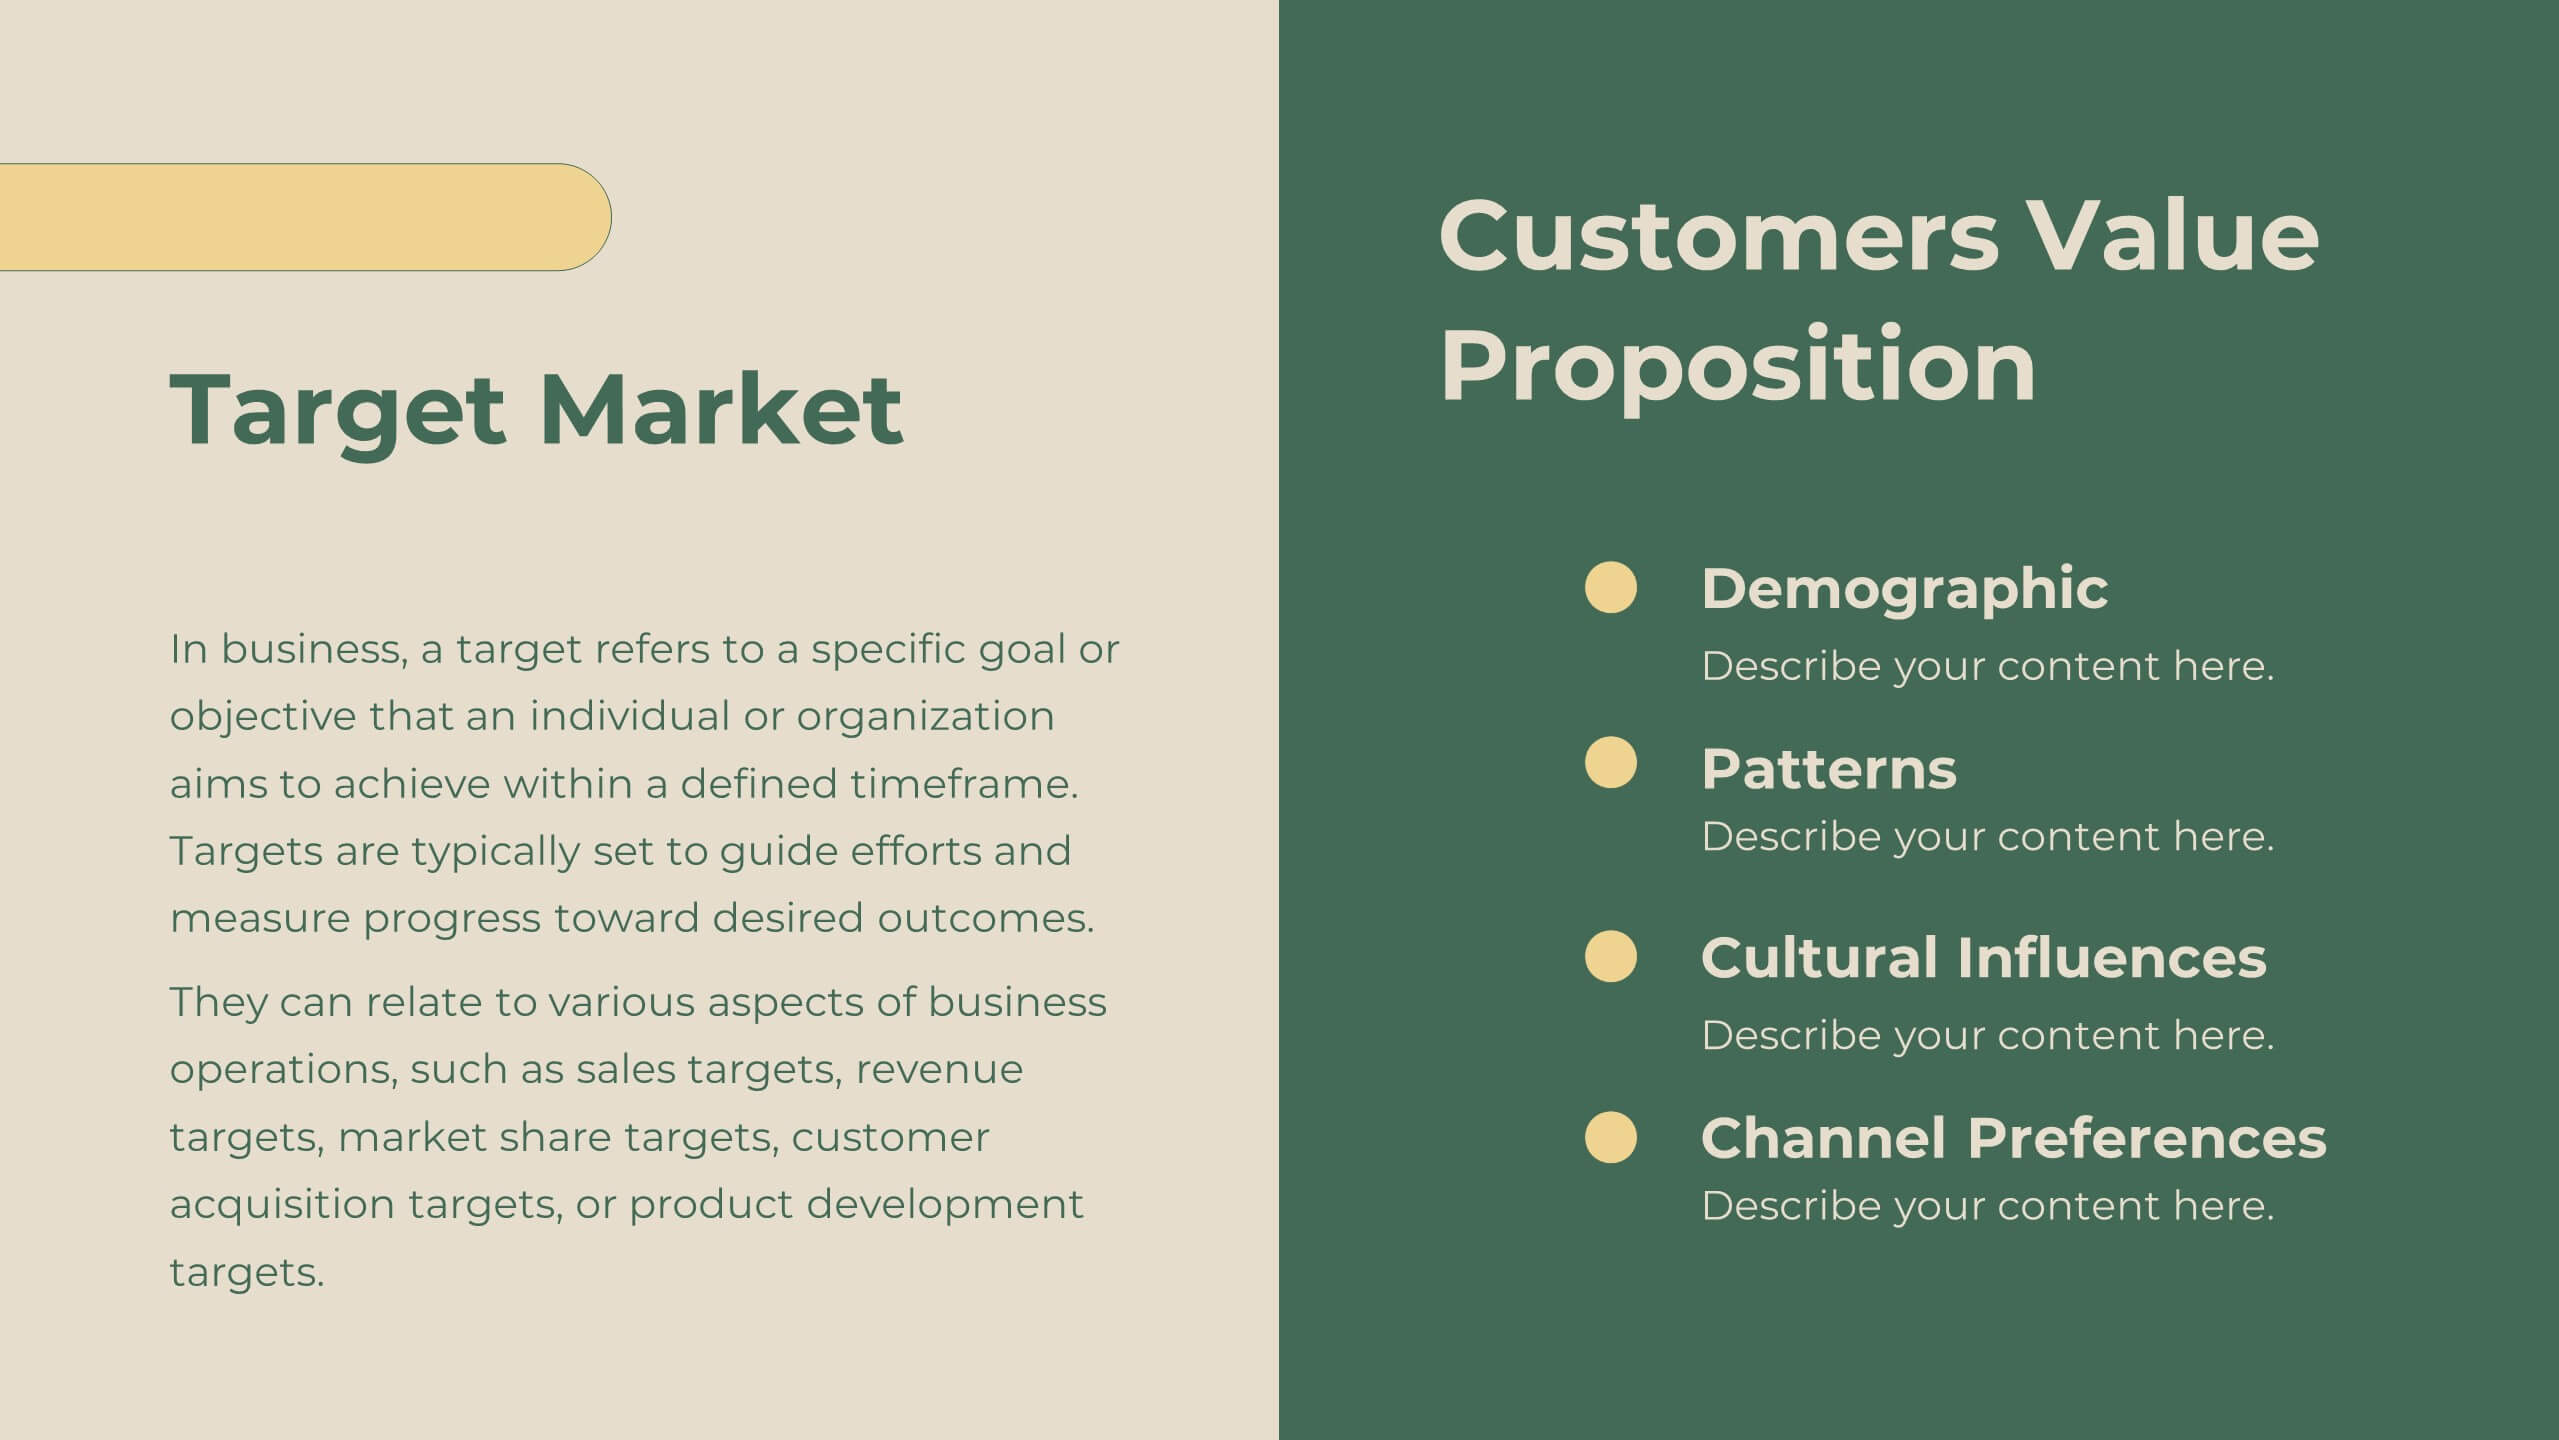
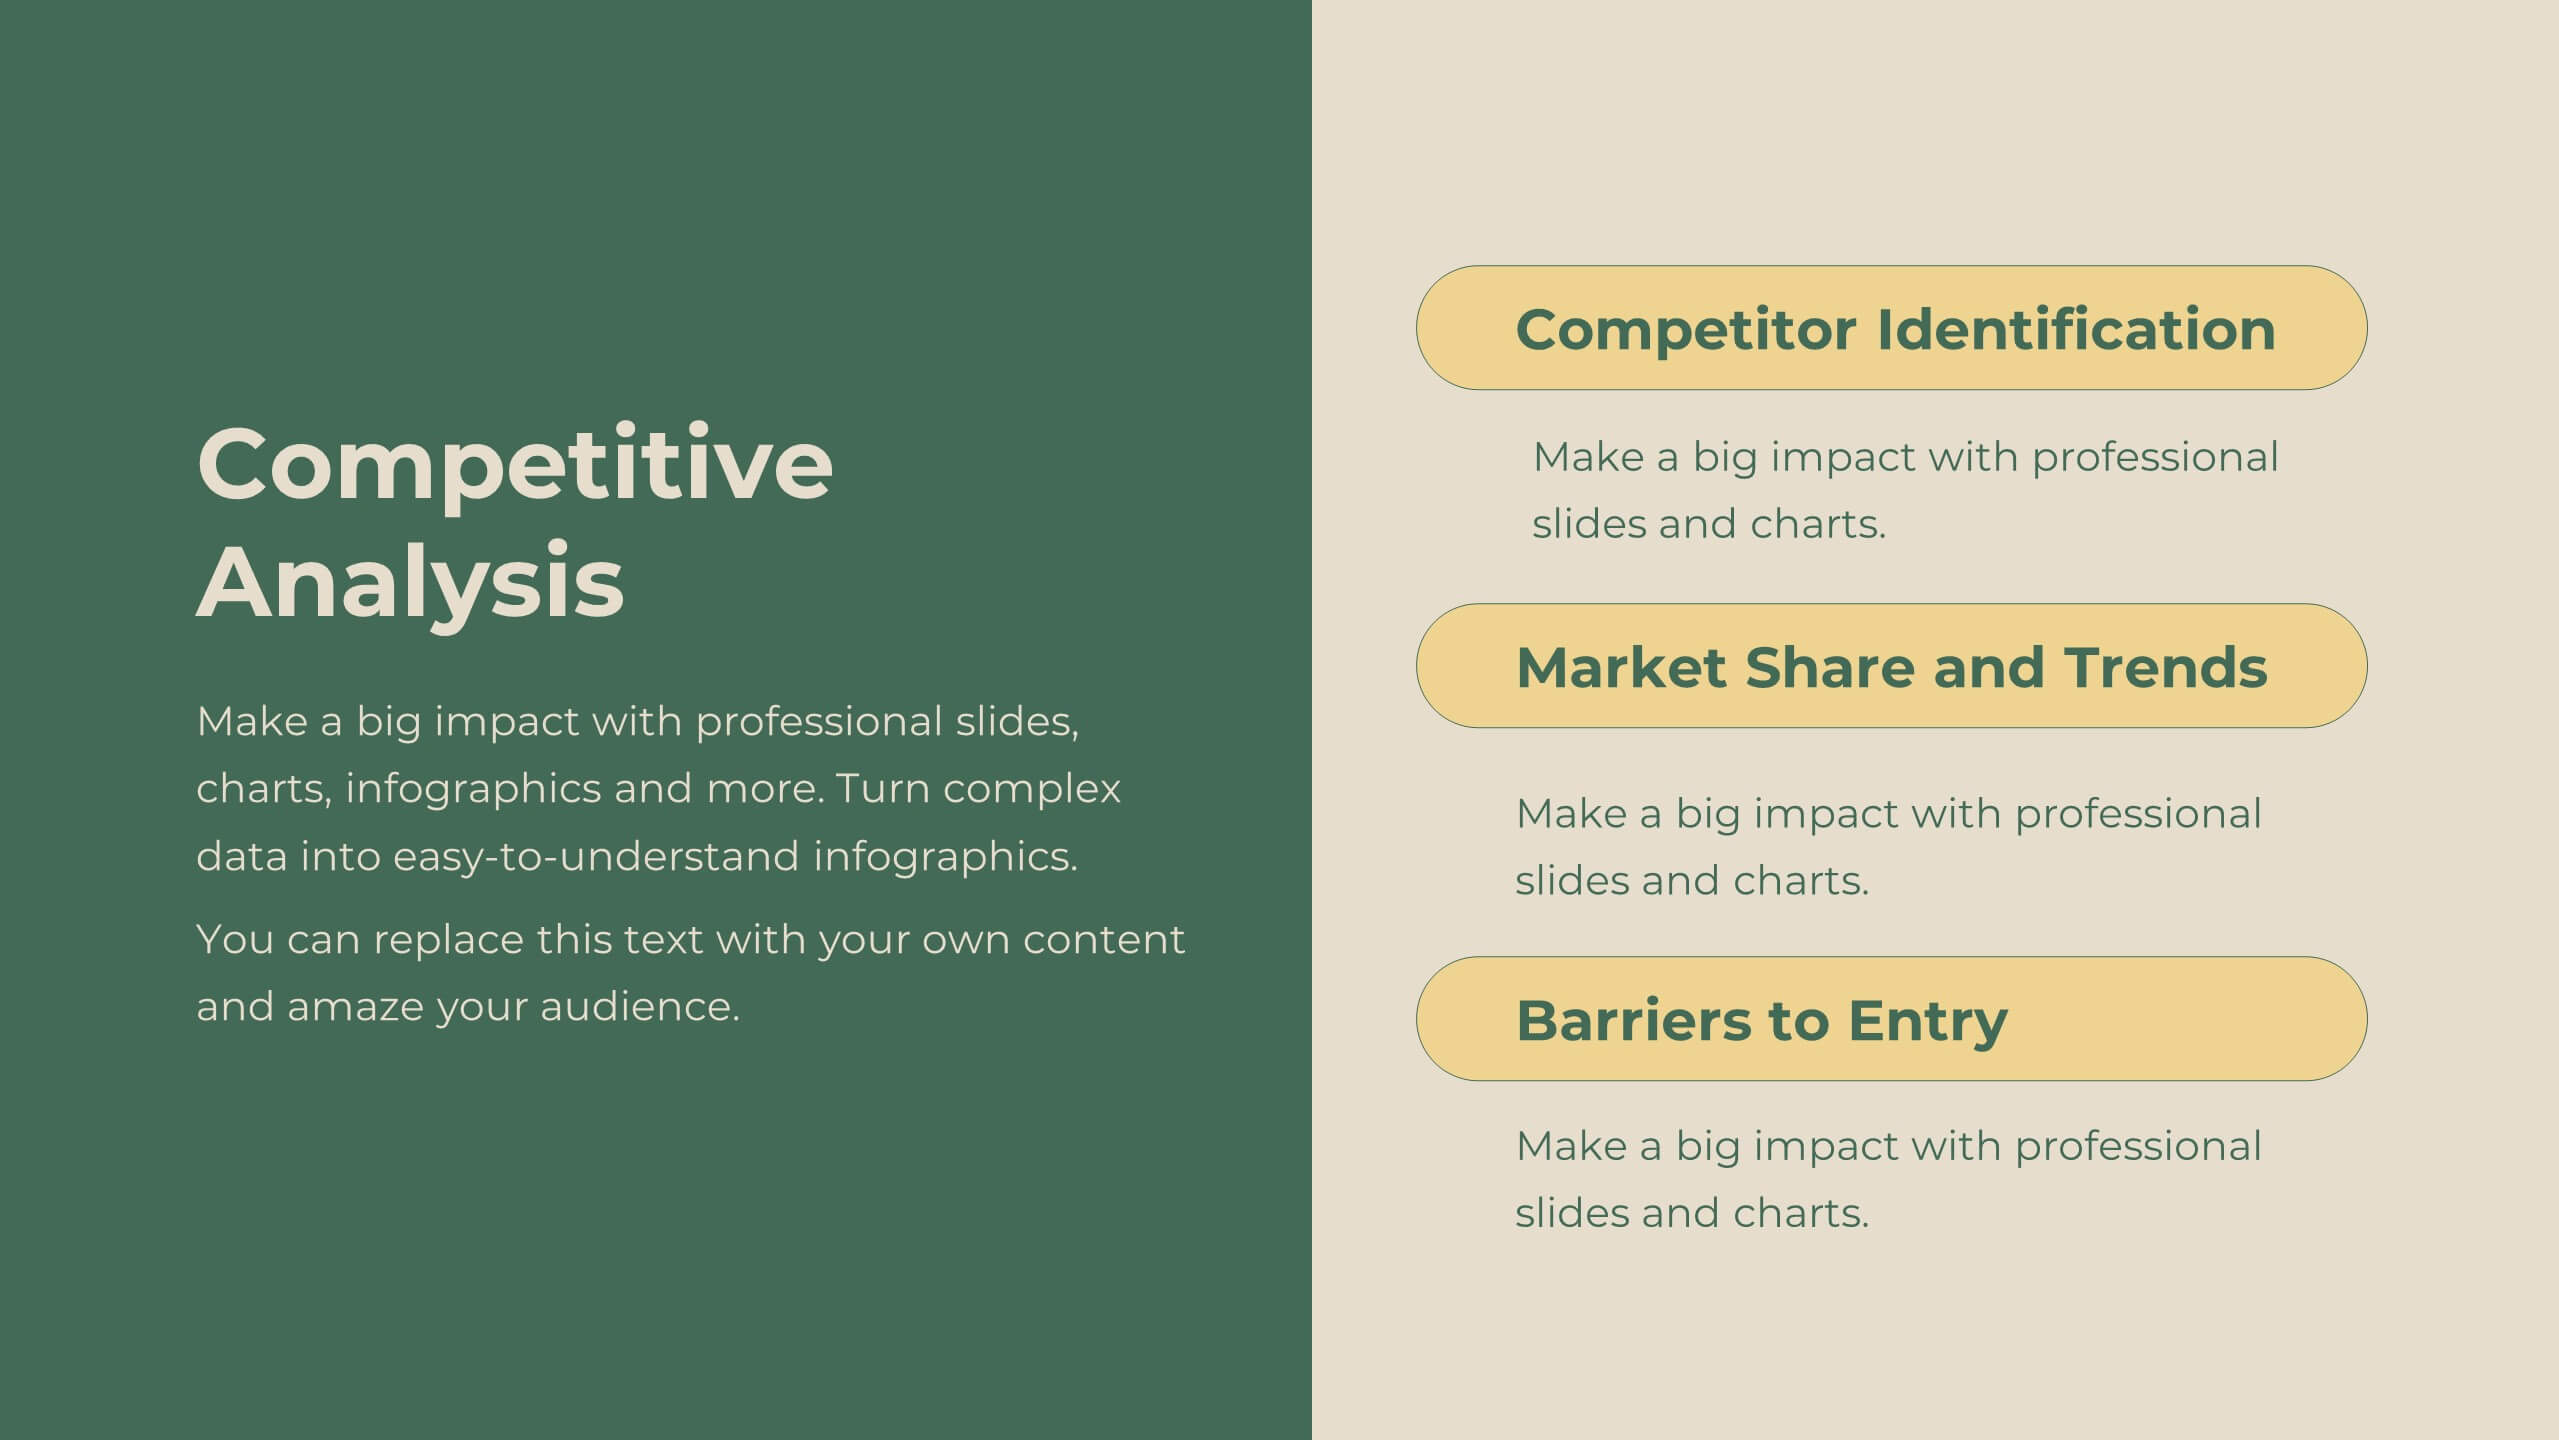
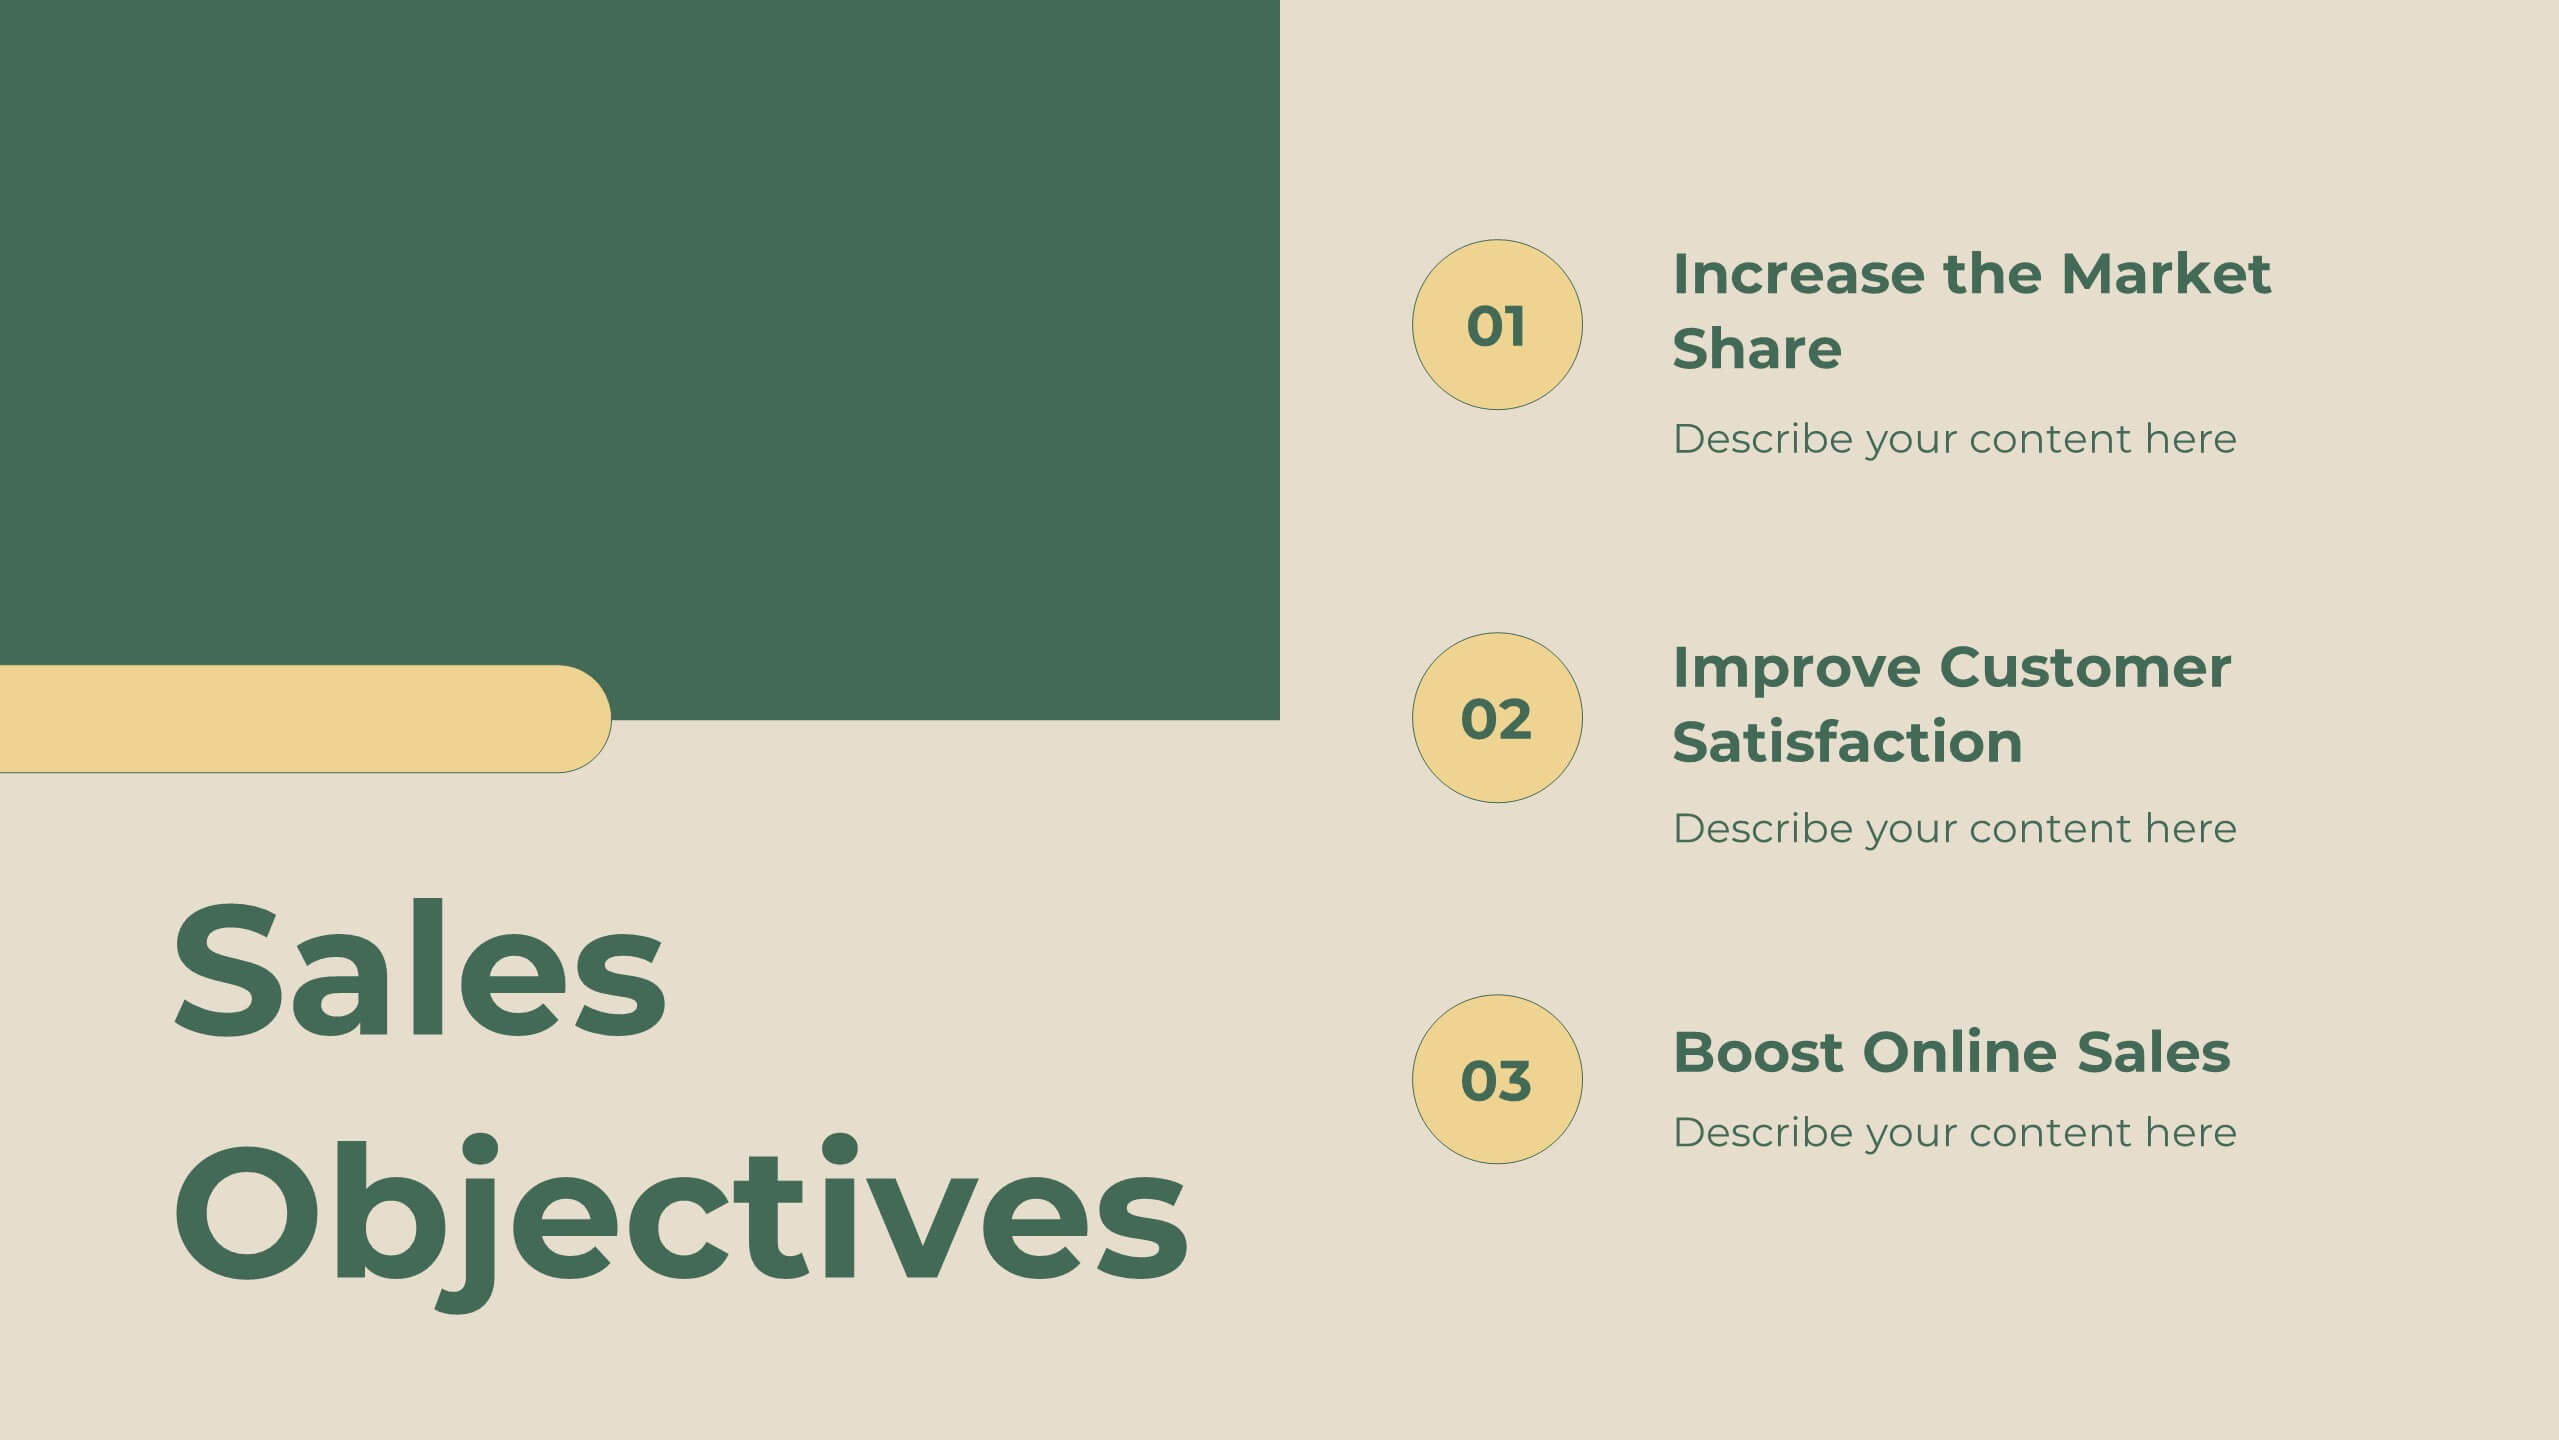
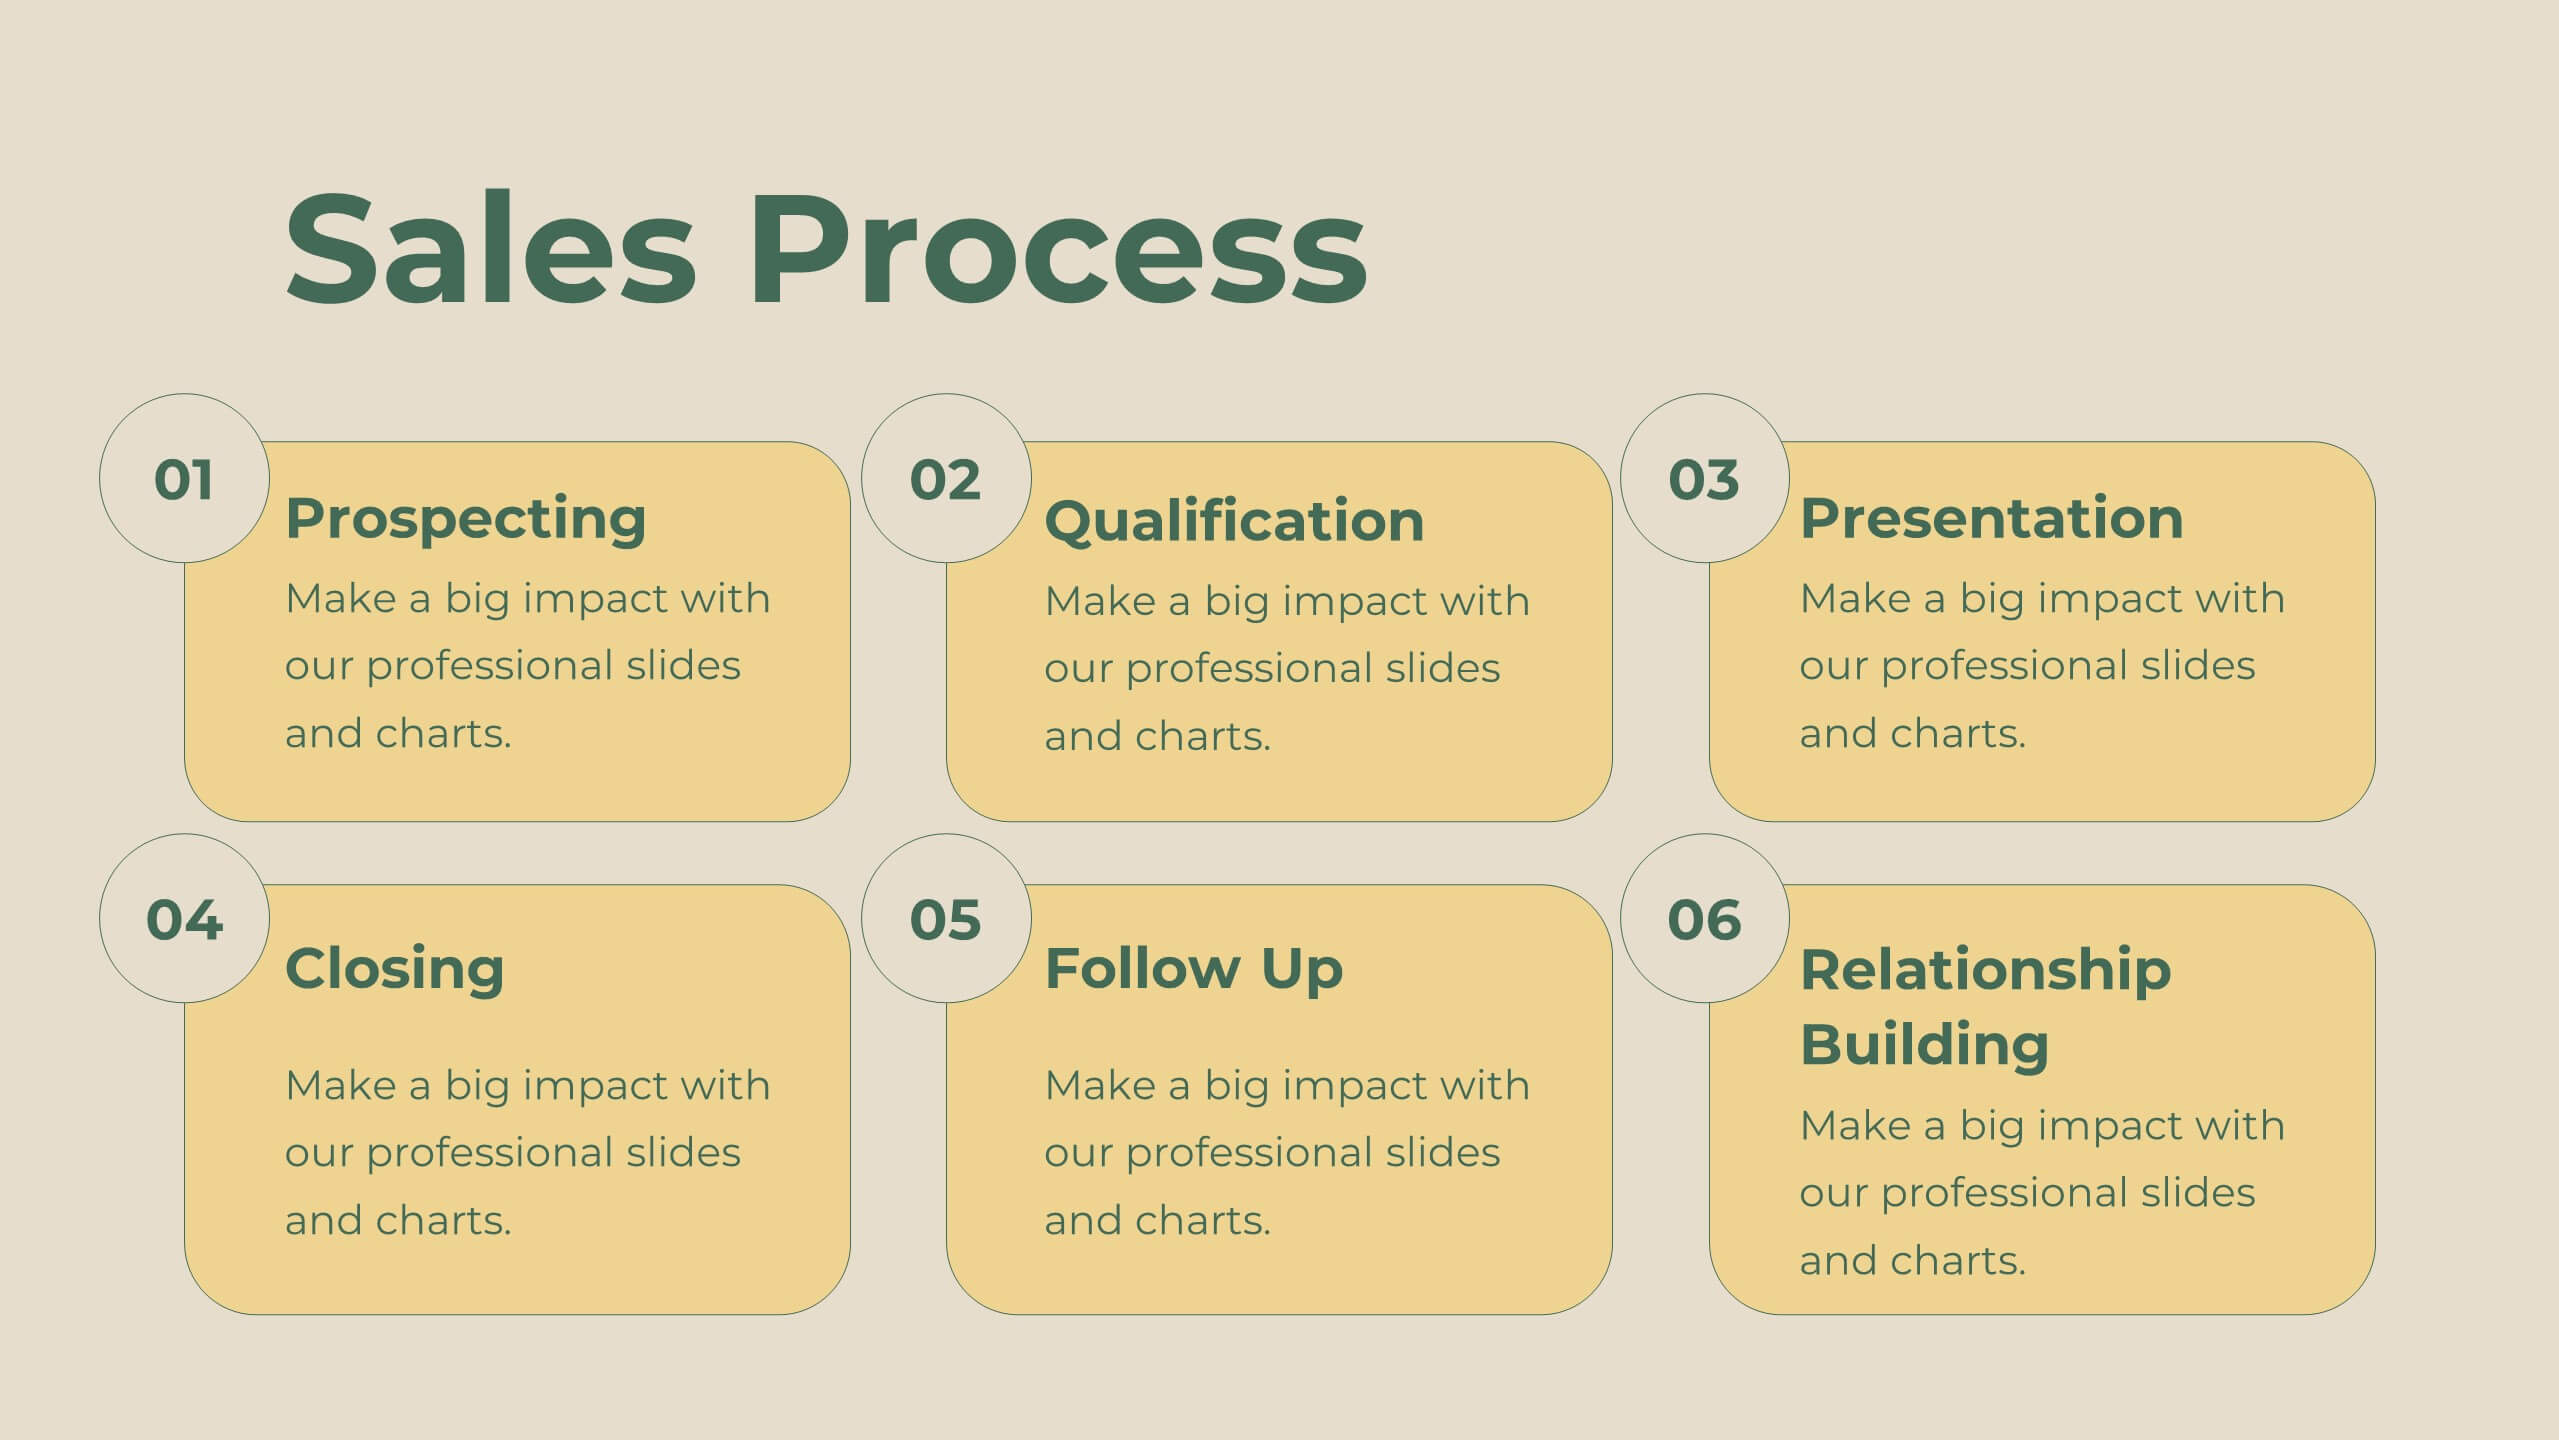
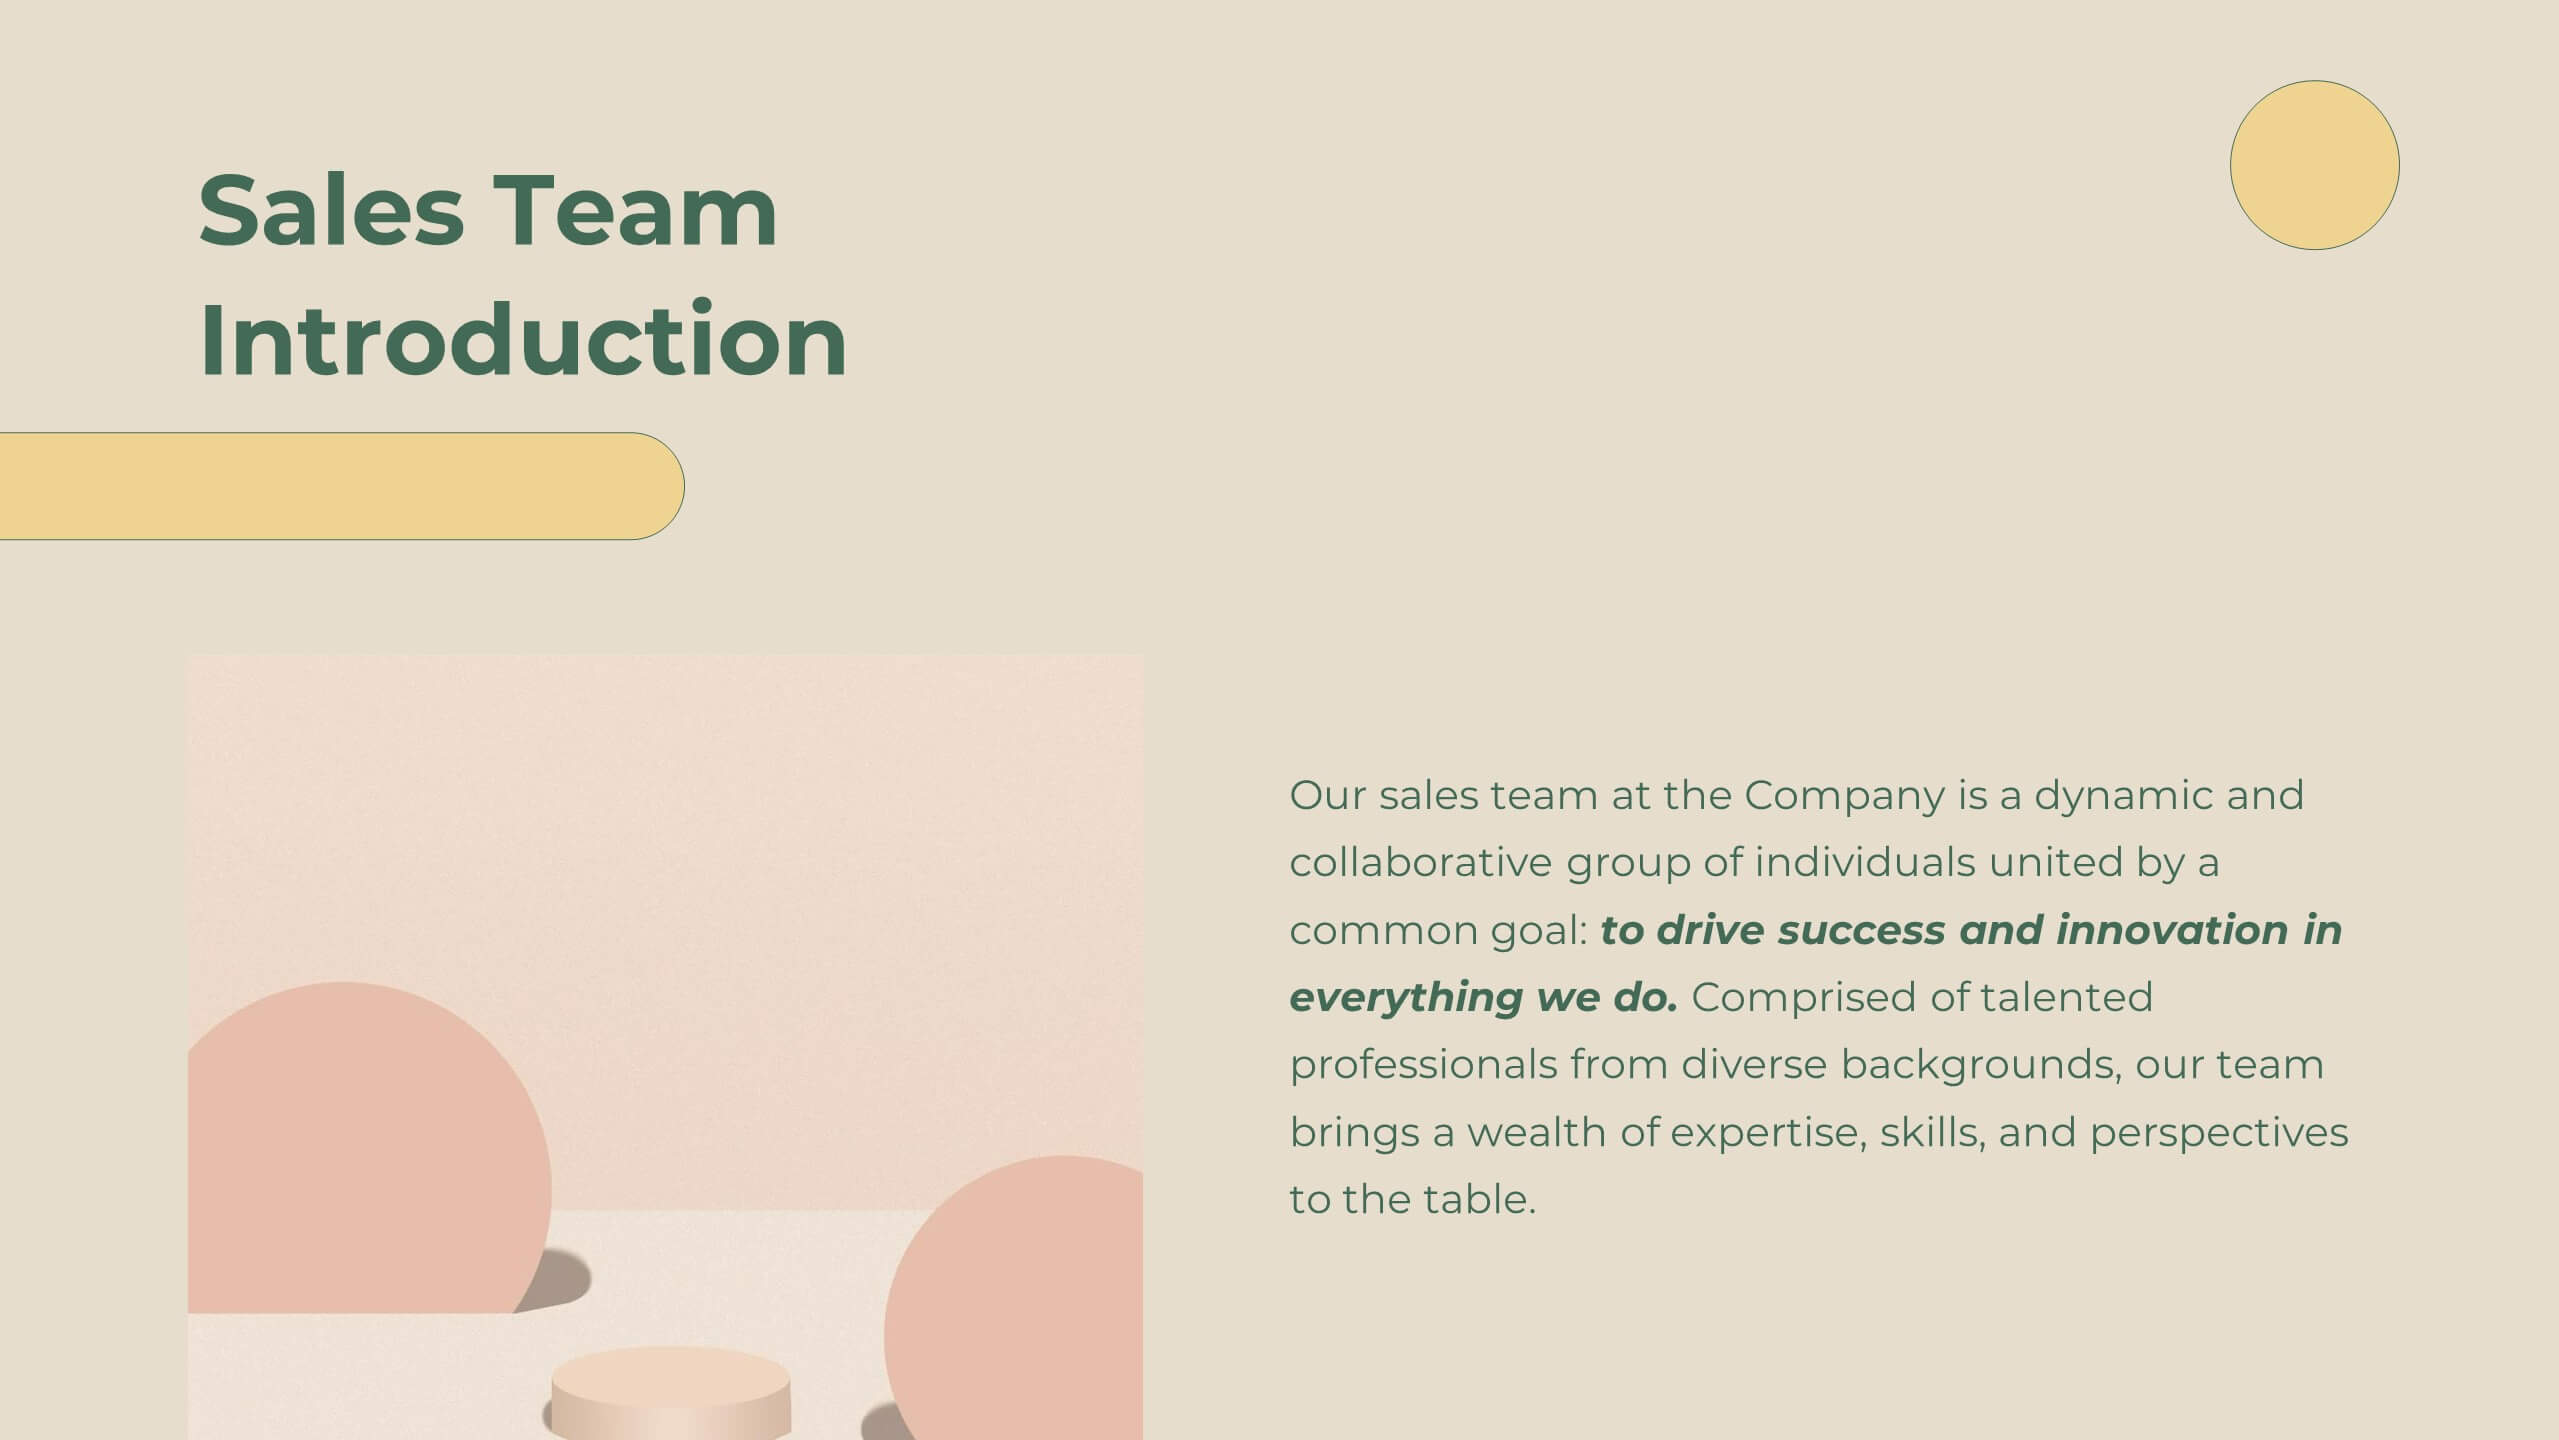
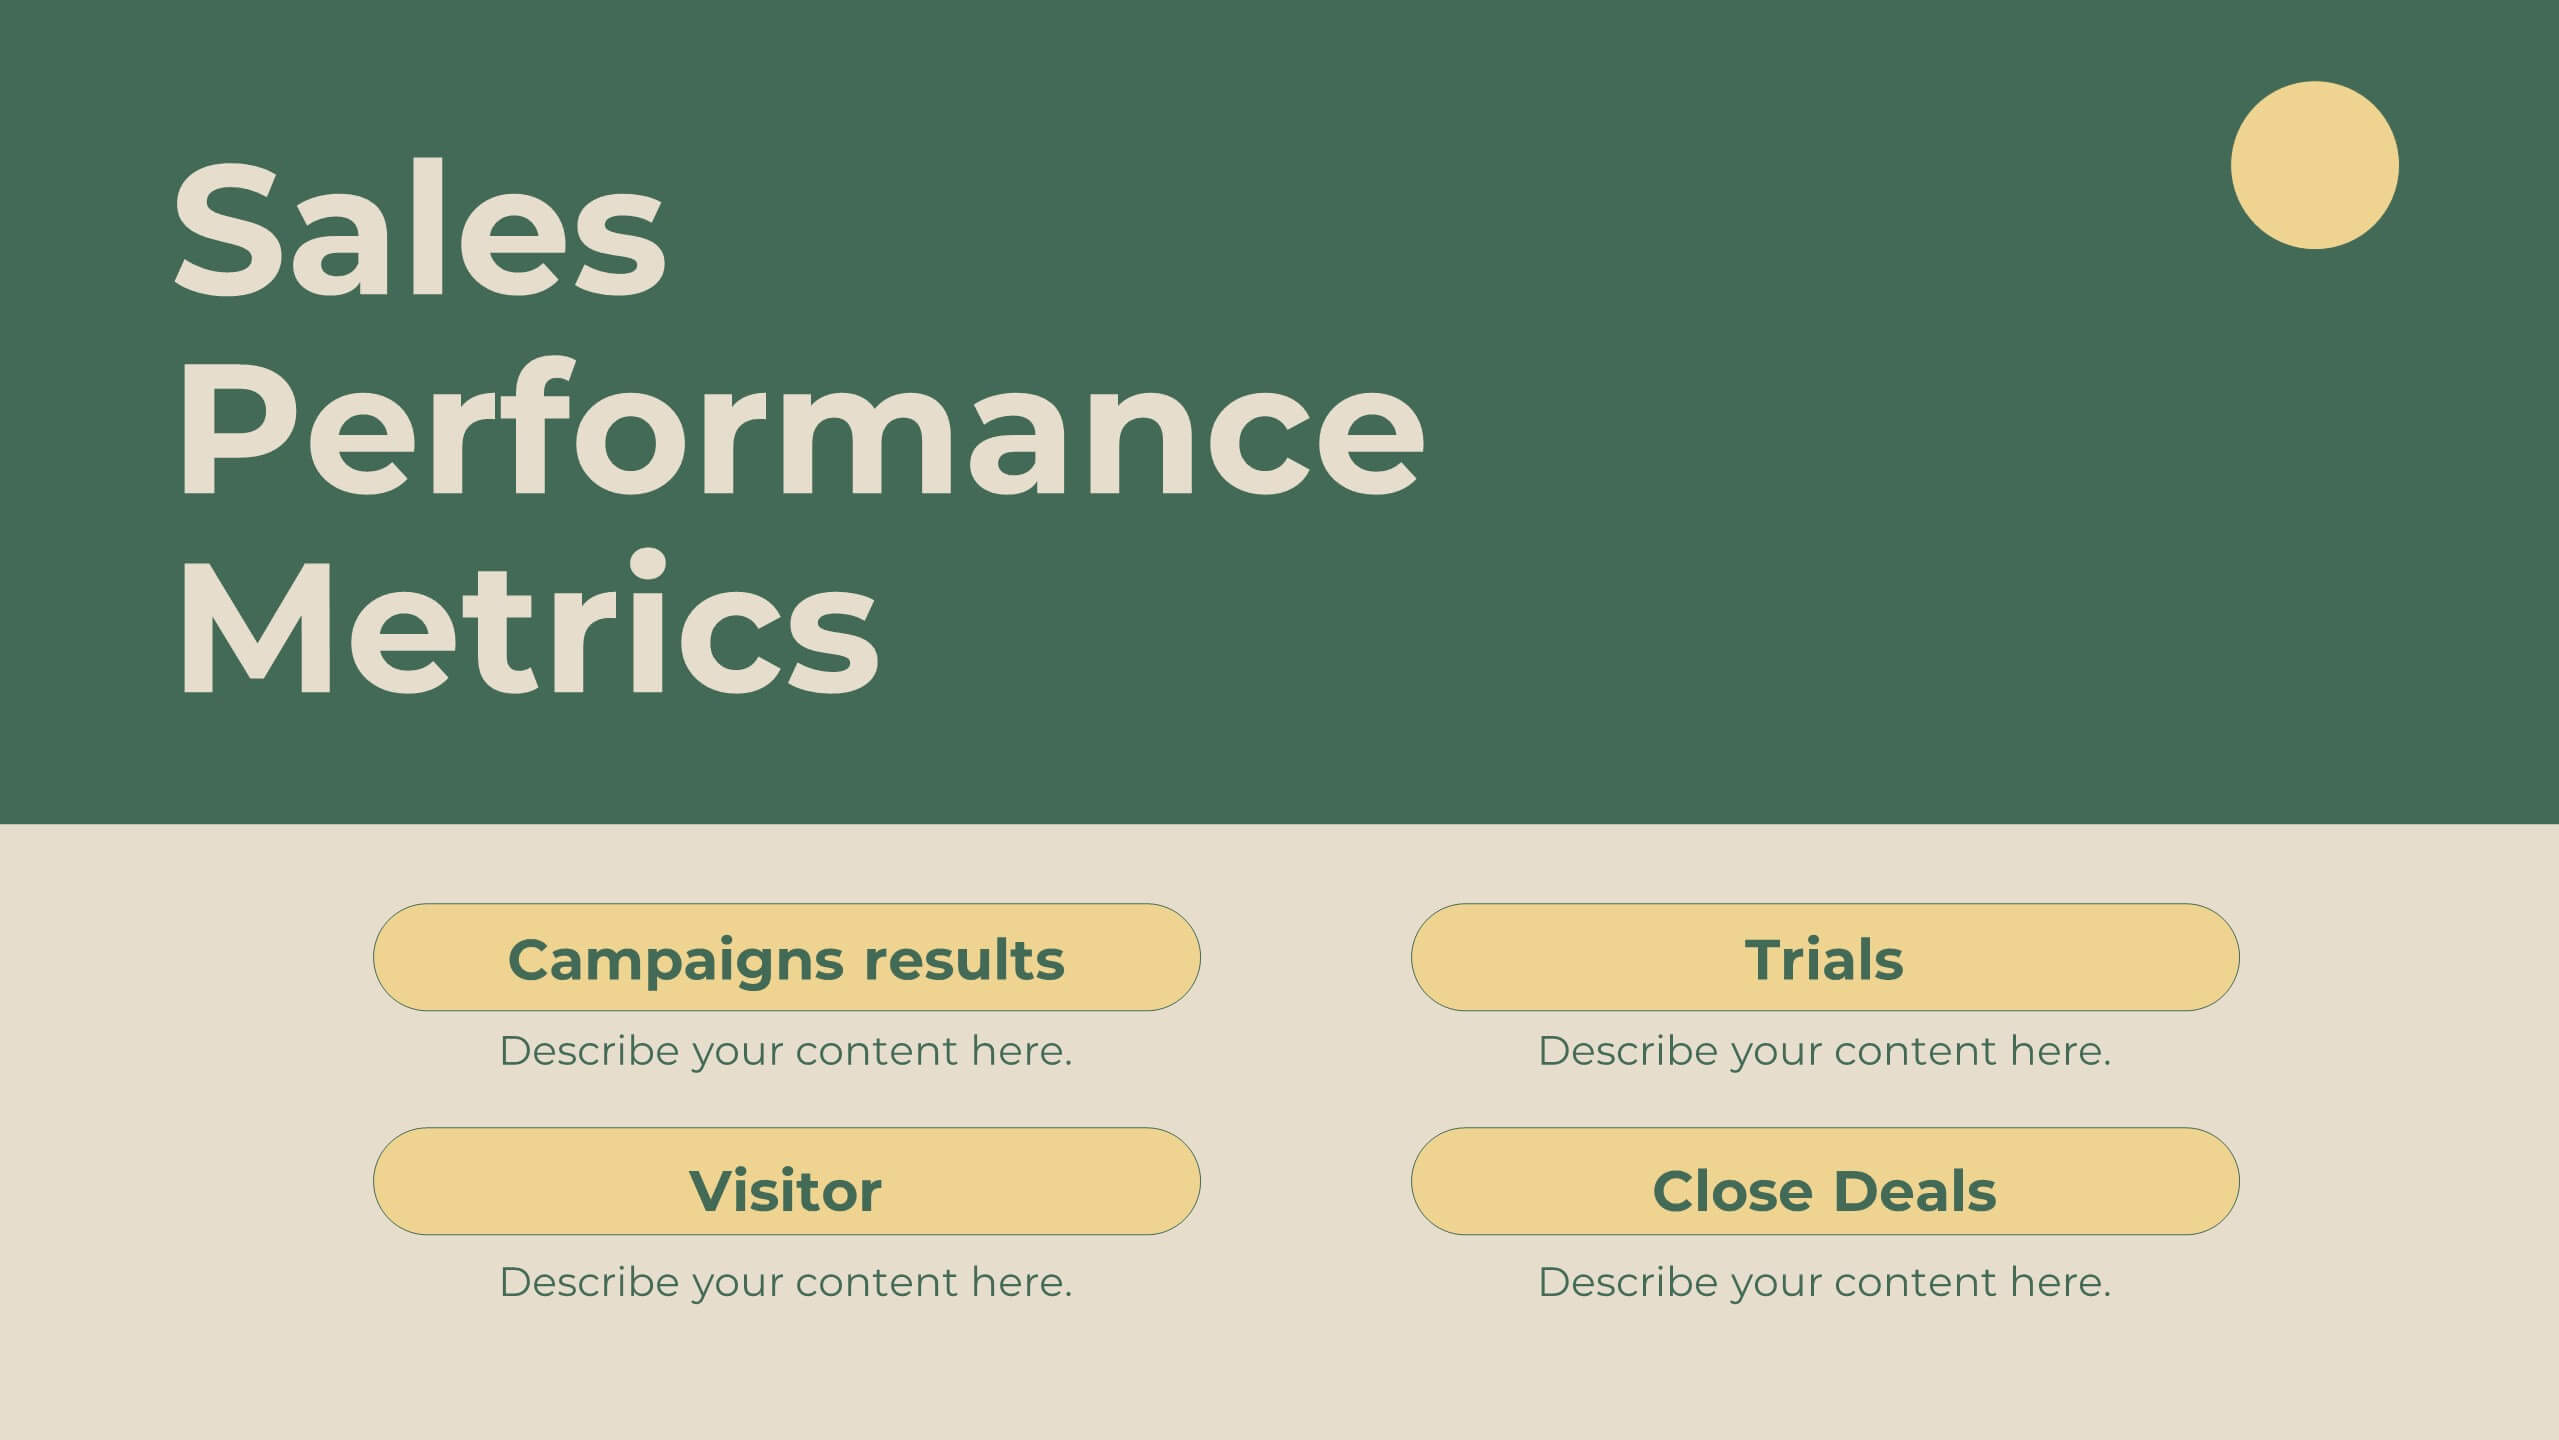
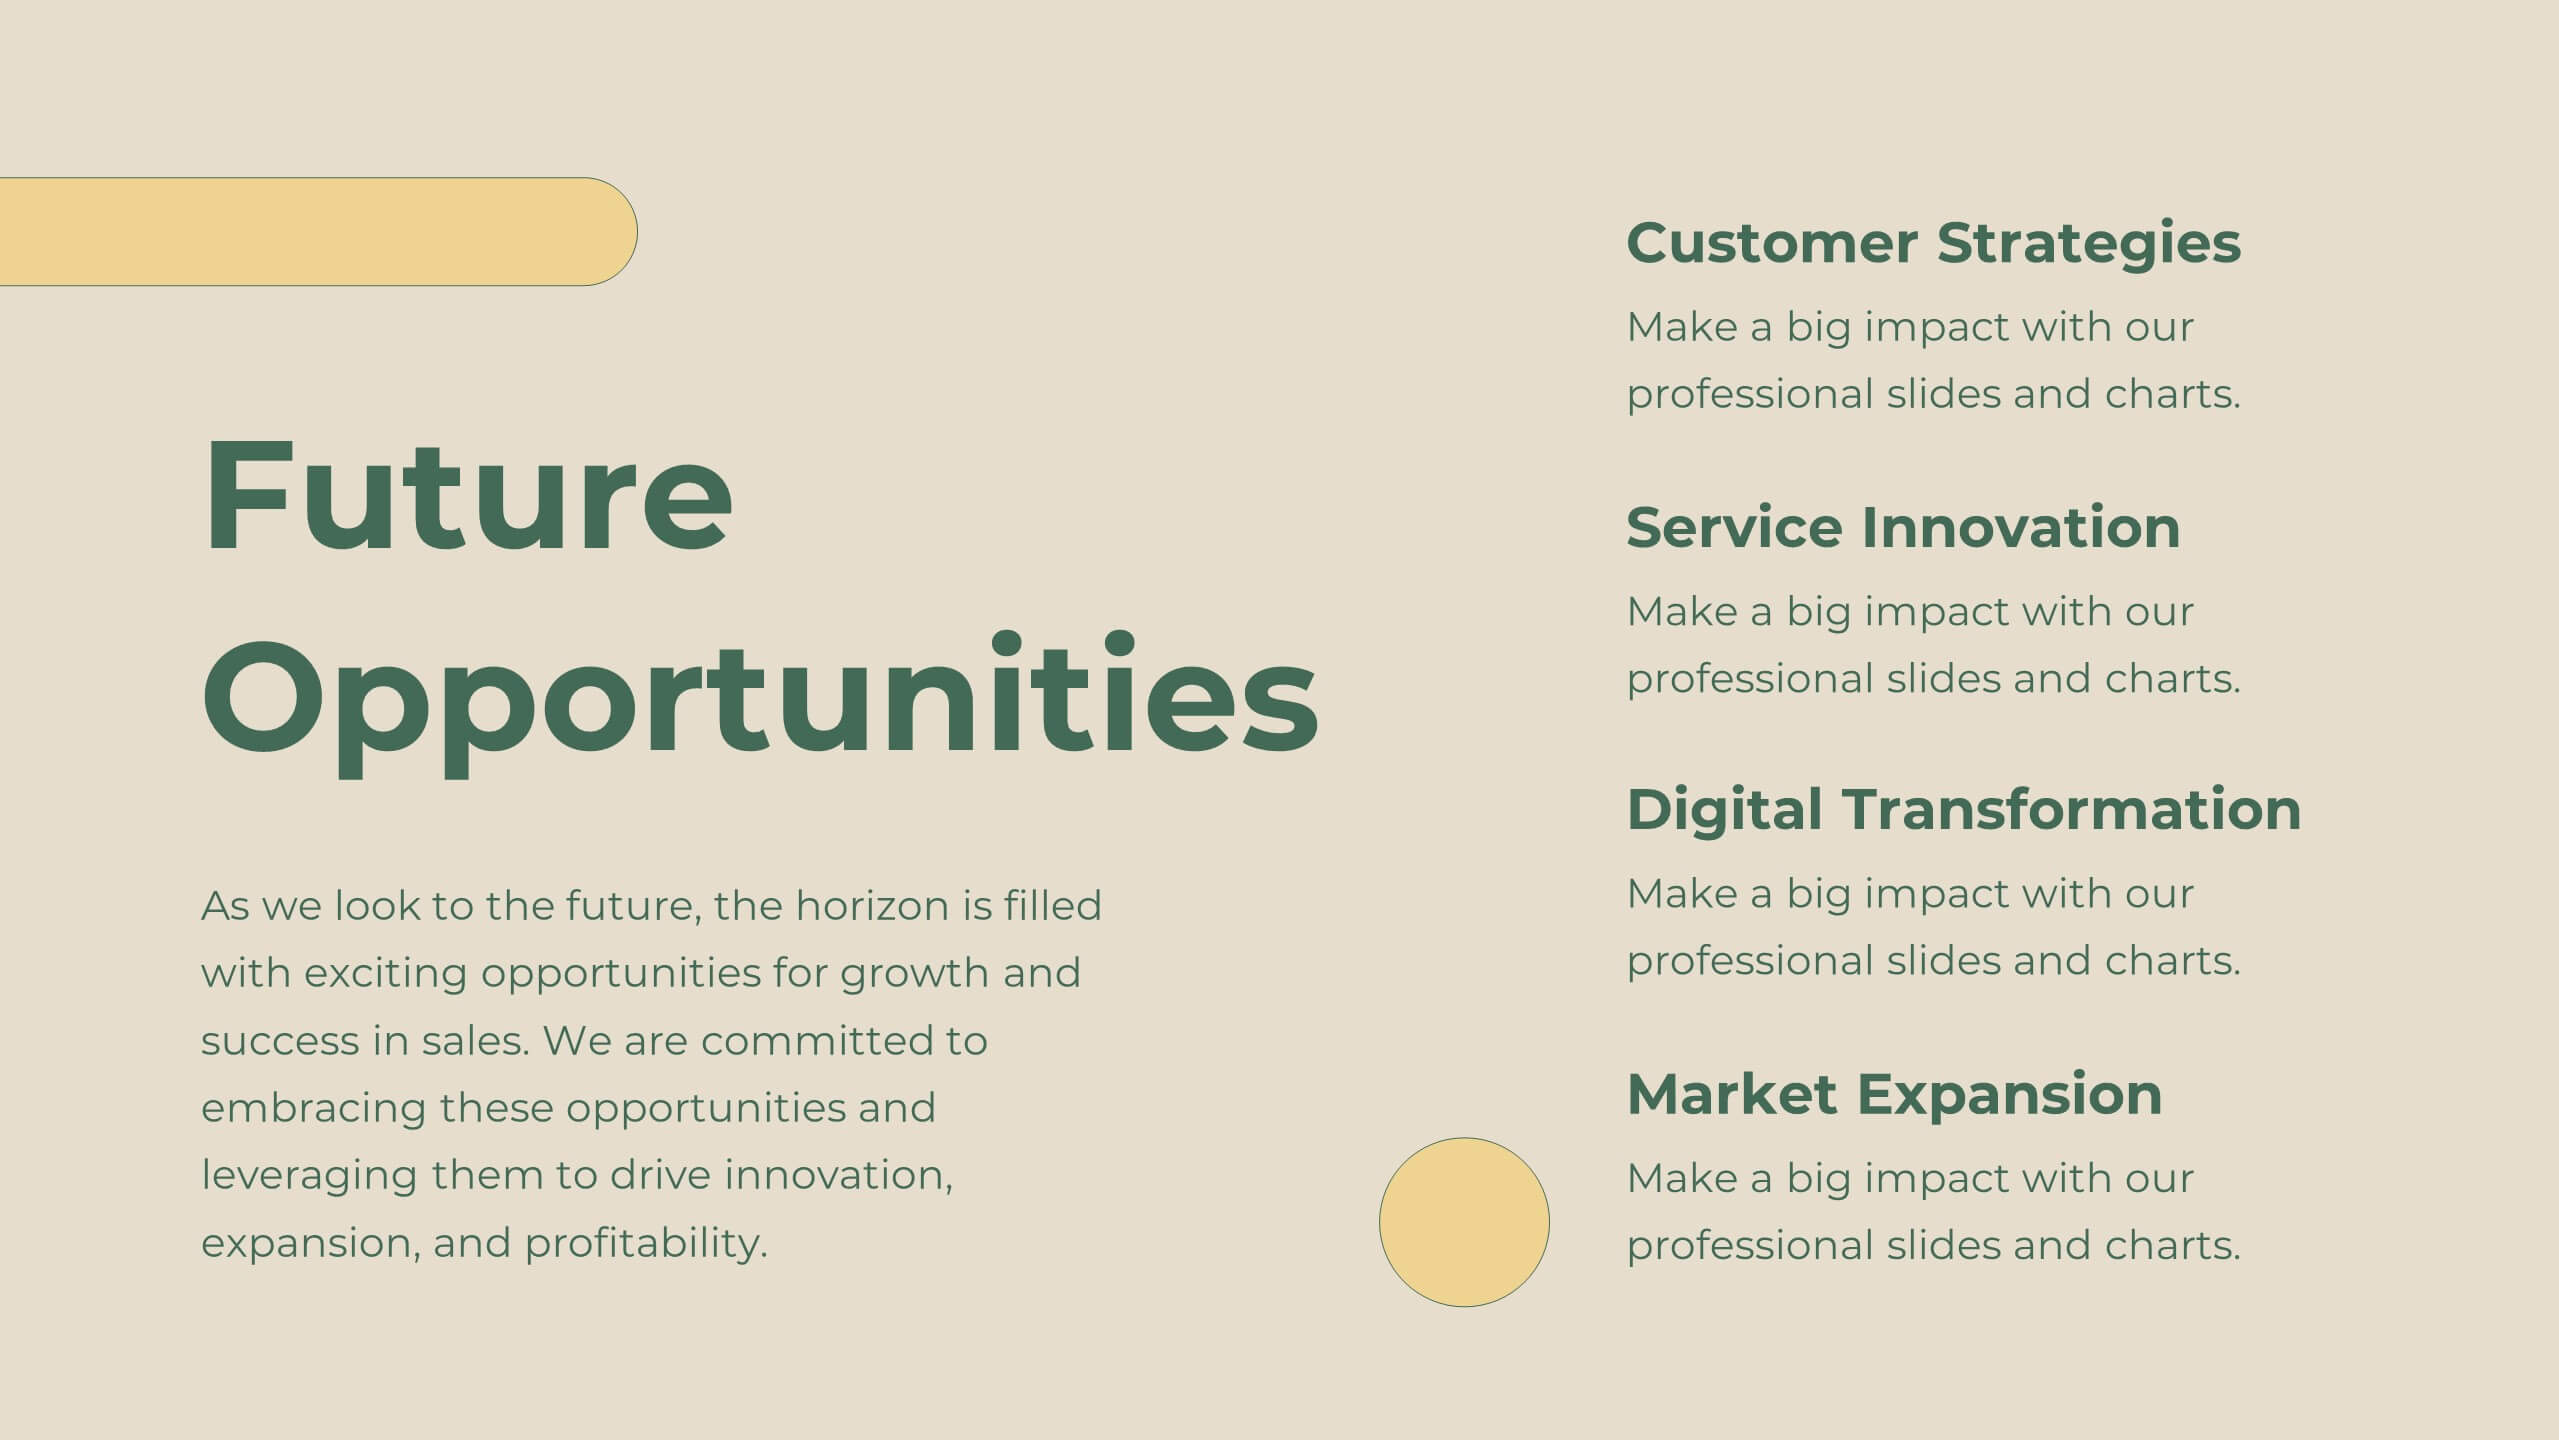
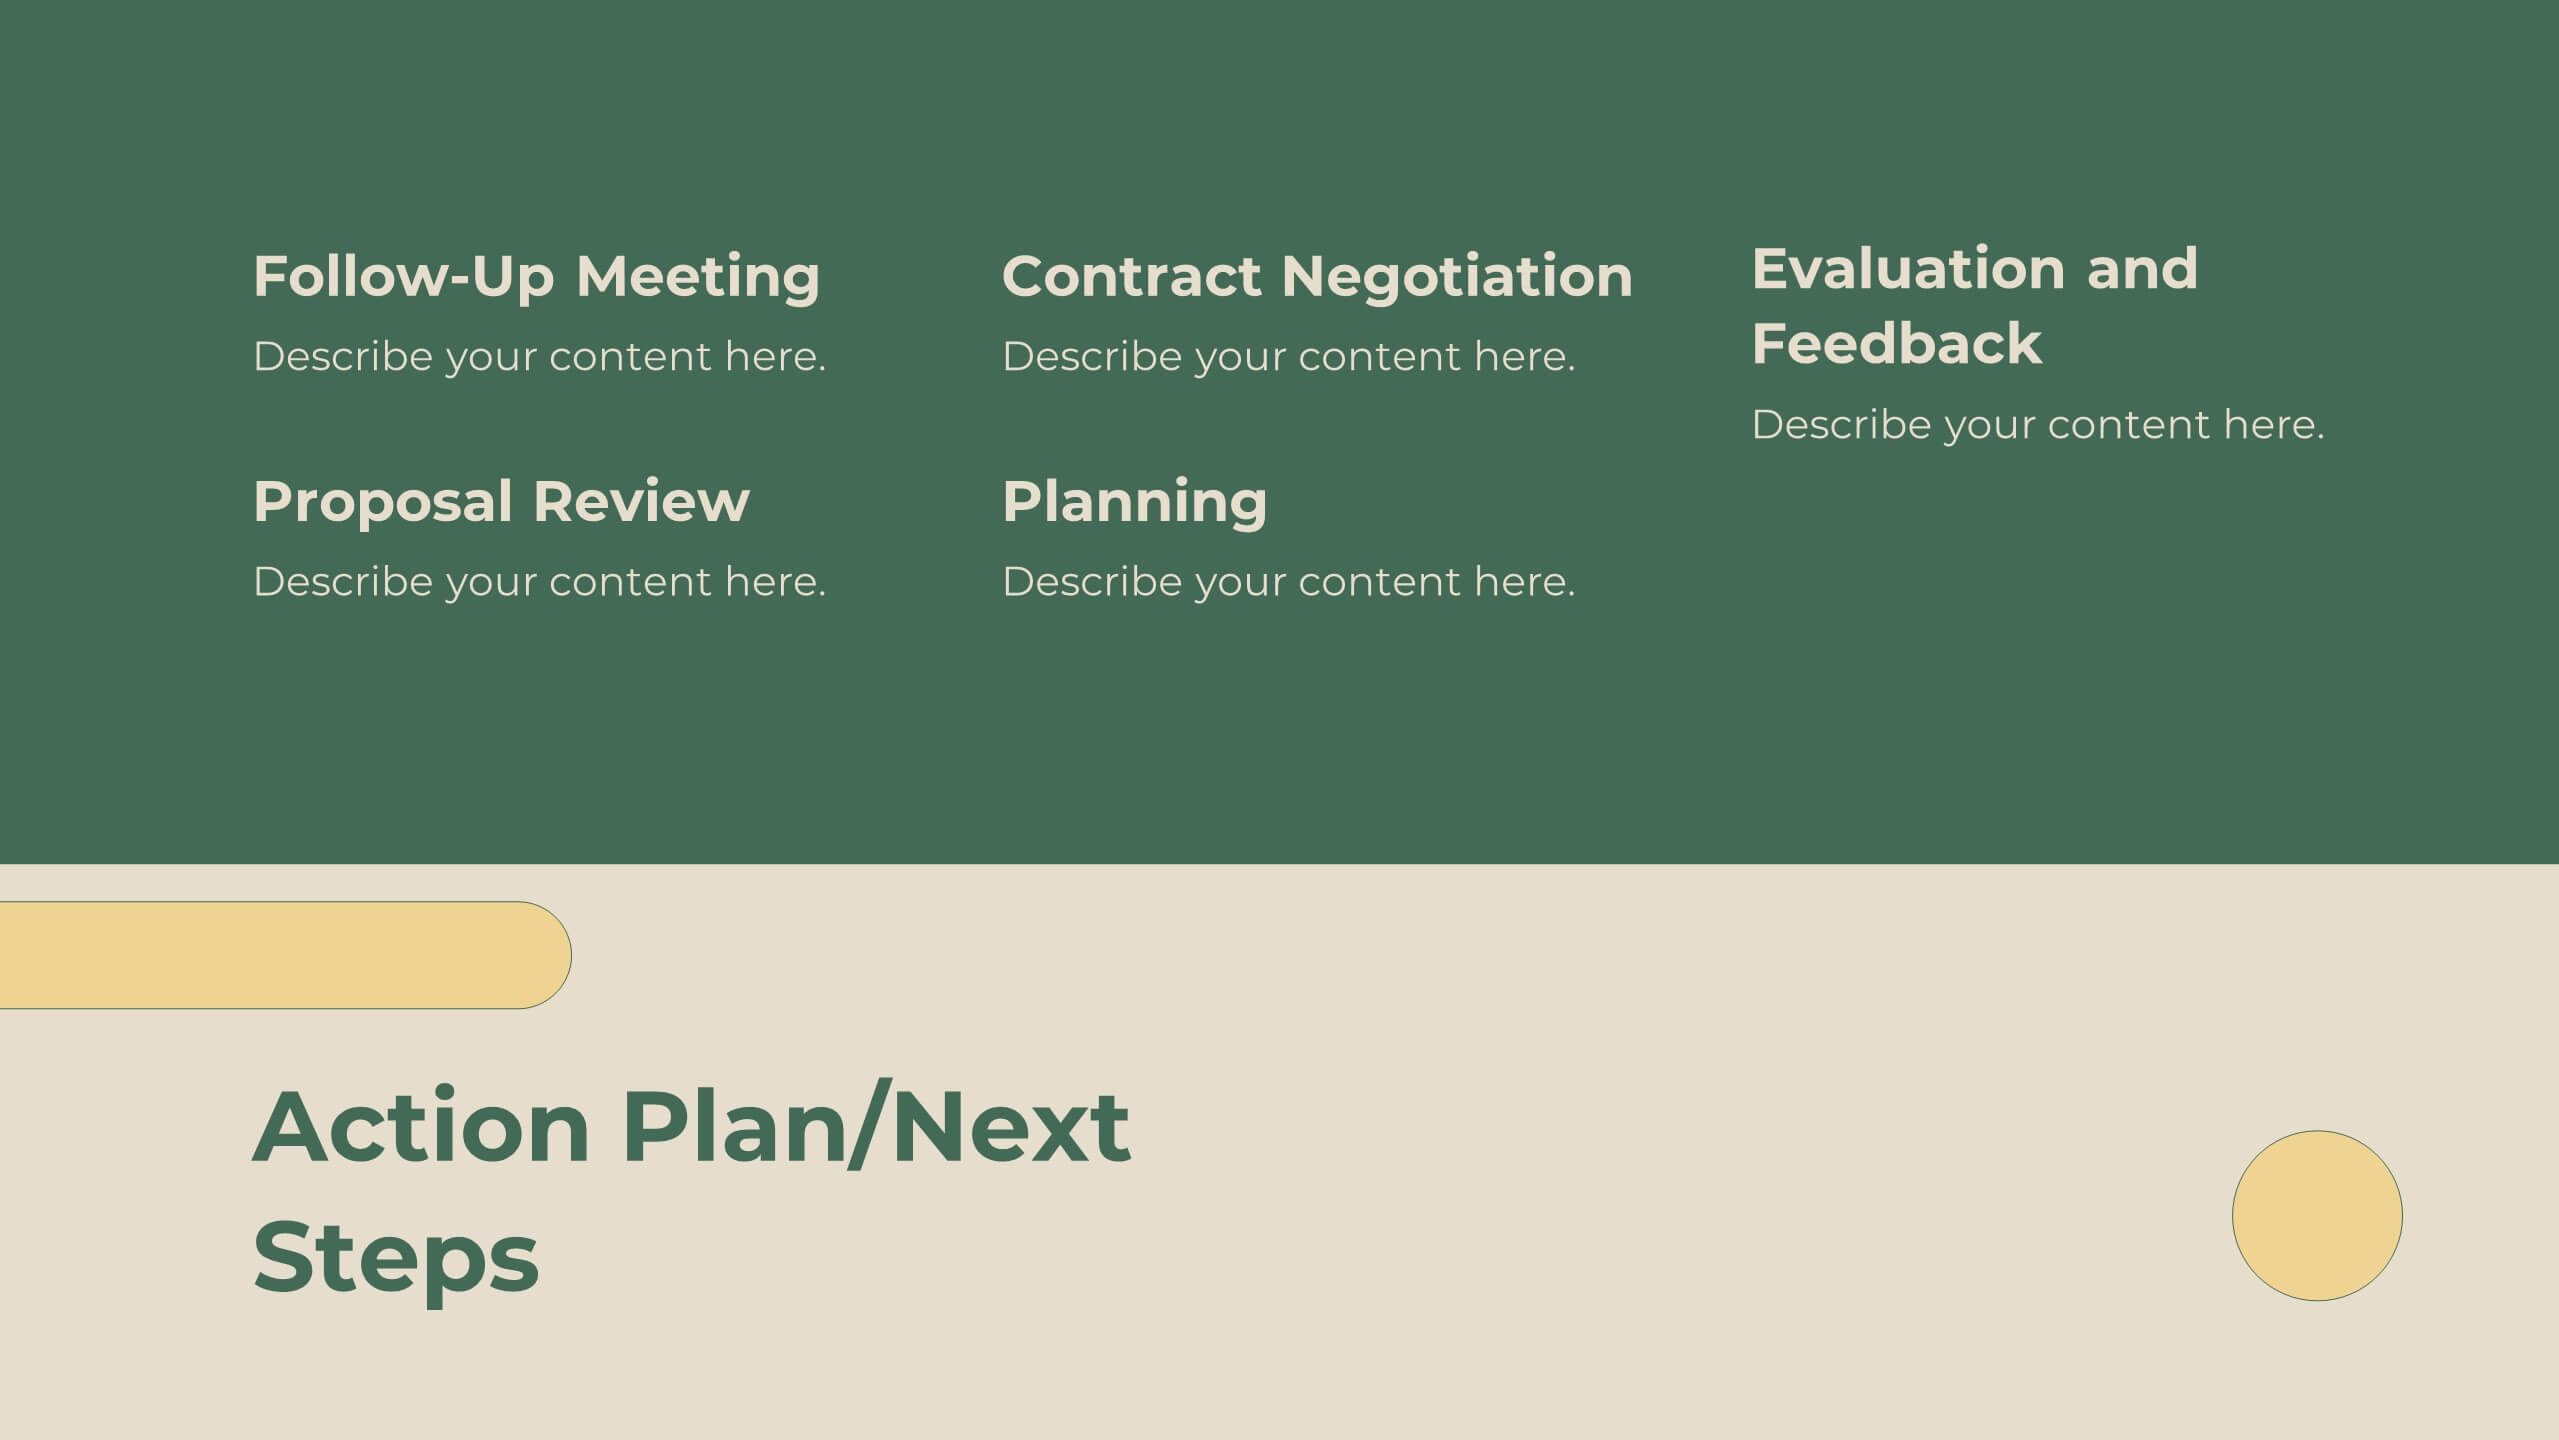
Legacy Sales Strategy Presentation
Boost your sales presentations with this modern template! It features sections for objectives, process, team introduction, customer testimonials, and performance metrics. Ideal for outlining strategies, opportunities, and pricing. Engage your audience with a professional, clean design. Compatible with PowerPoint, Keynote, and Google Slides for seamless integration. Make your sales strategy stand out!


6 diapositivas
Effective Meeting Strategies Presentation
Maximize meeting productivity with the "Effective Meeting Strategies" presentation template. This tool offers a visually engaging layout that helps you outline and implement meeting tactics that promote efficiency and focus. Ideal for team leads and managers looking to streamline communication within meetings, it is compatible with PowerPoint, Keynote, and Google Slides, ensuring accessibility across various platforms.


20 diapositivas
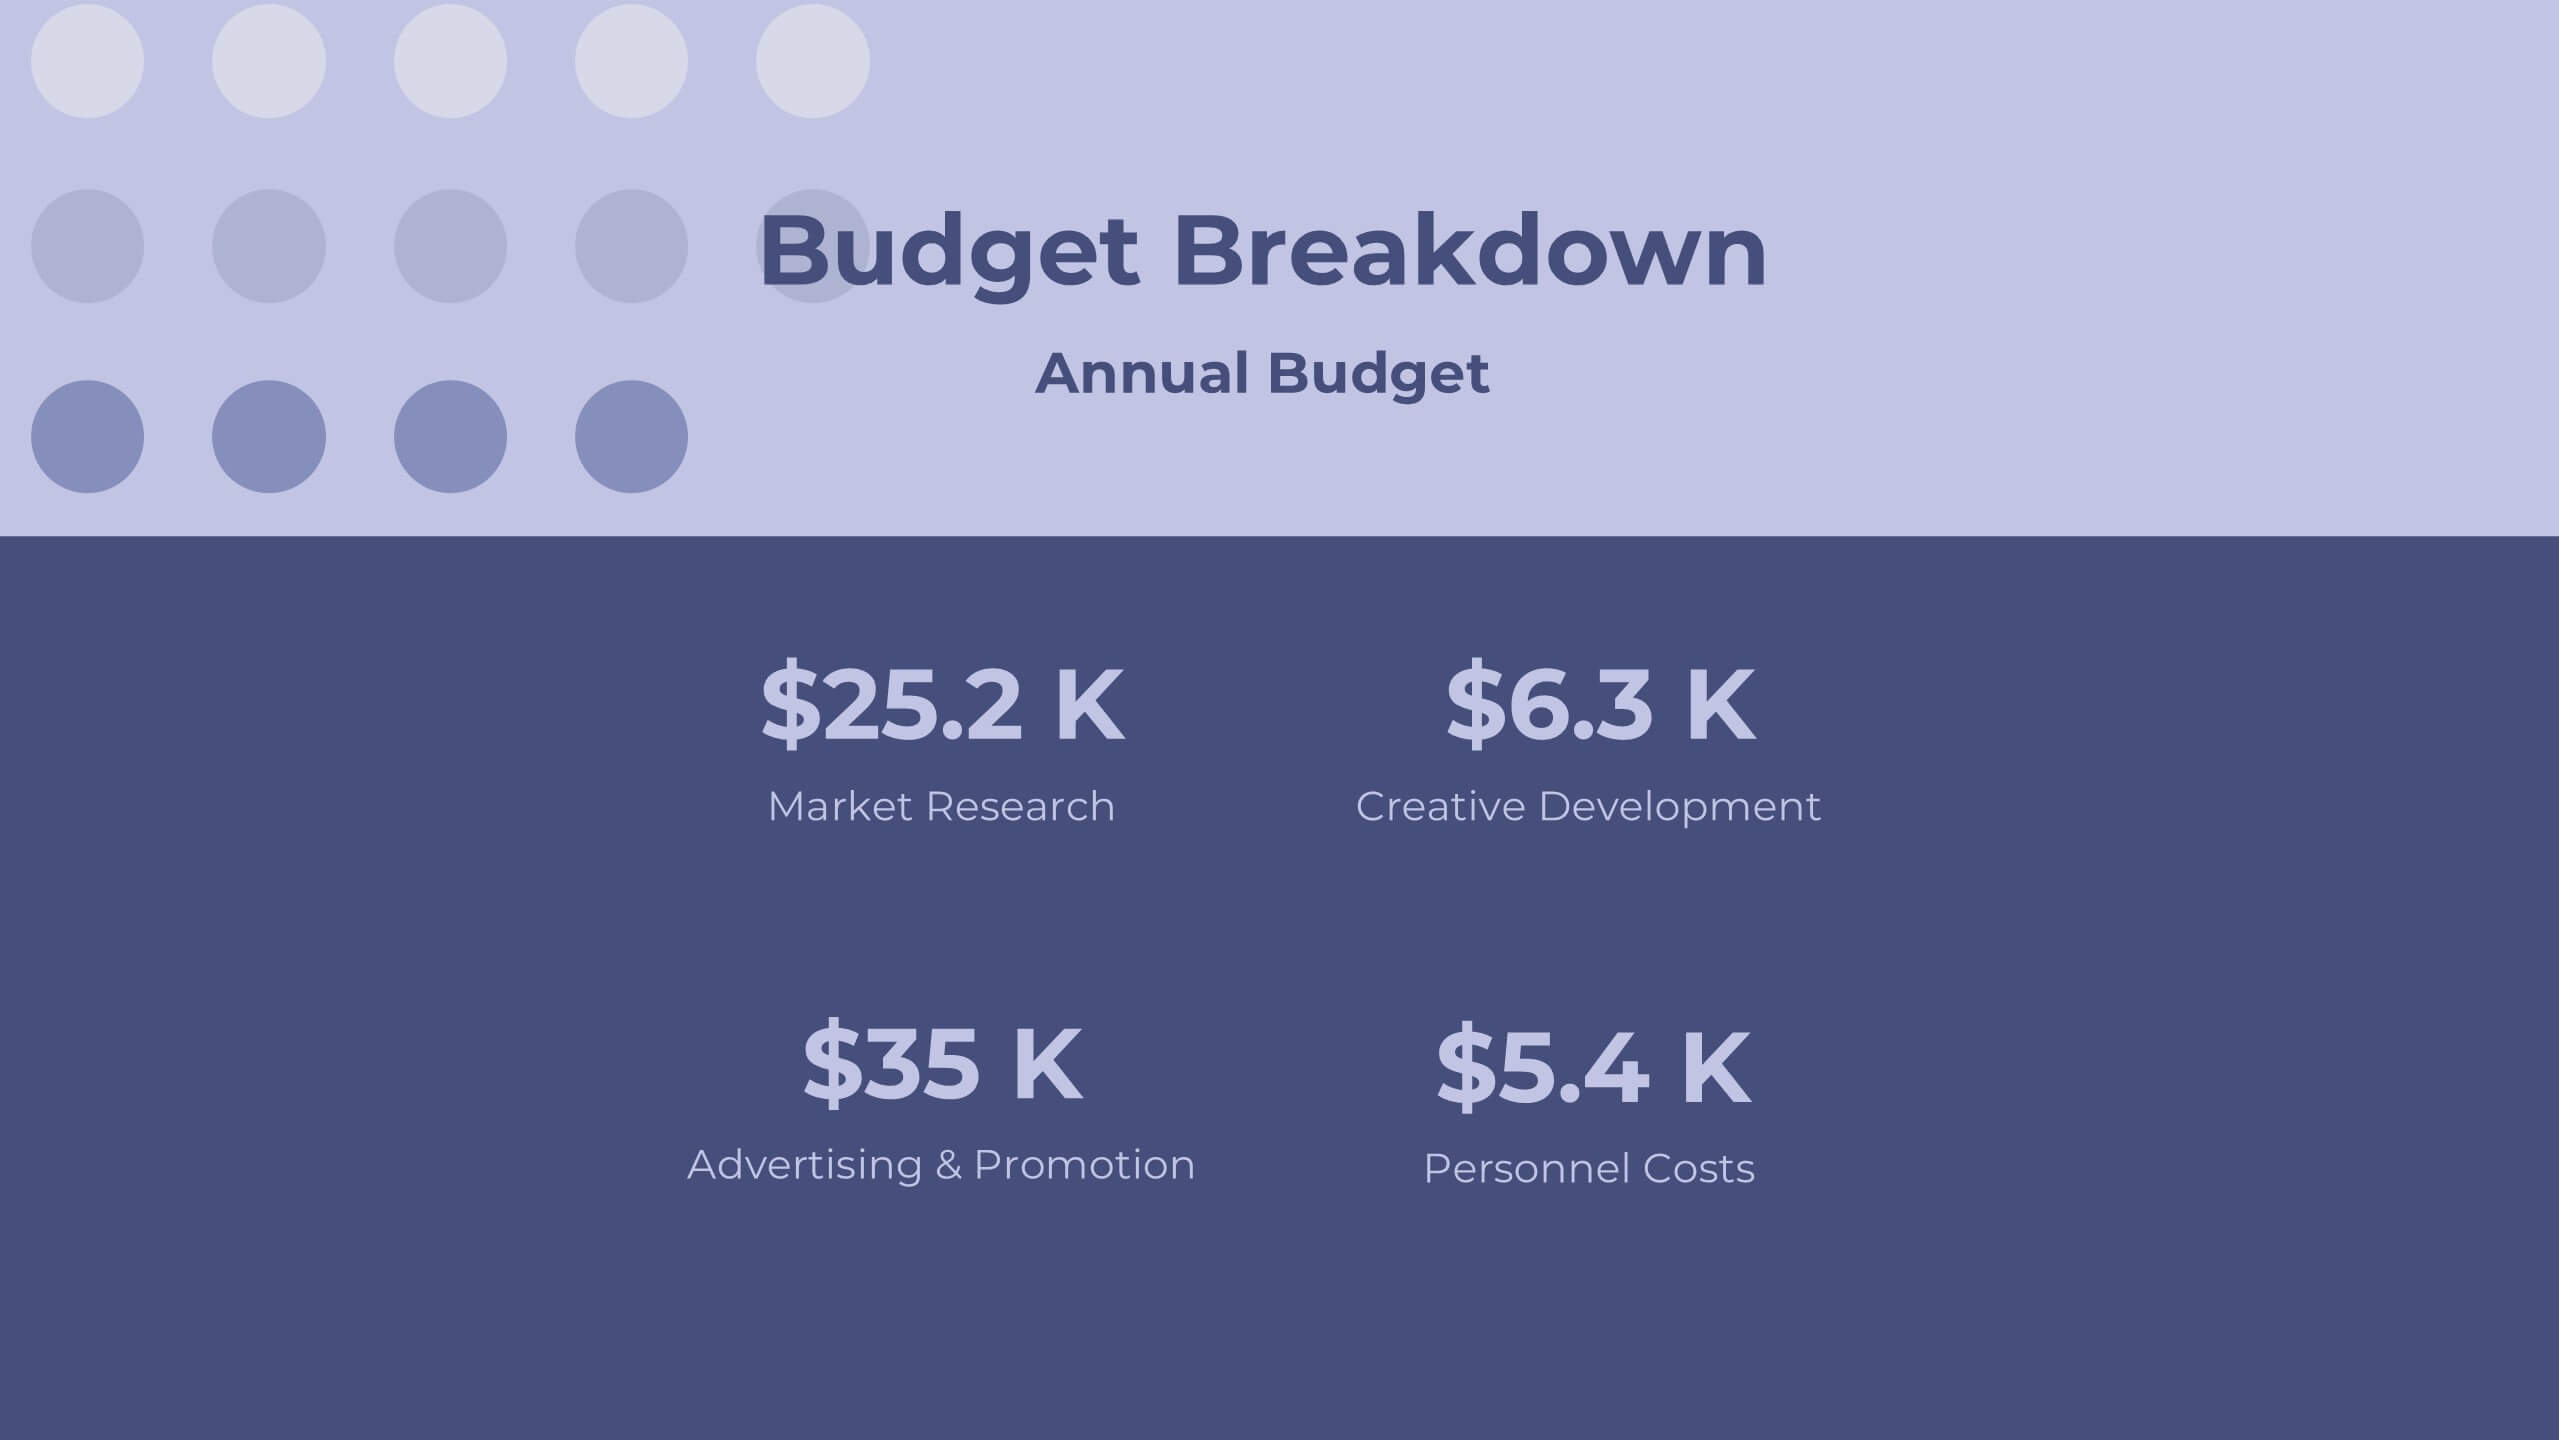
Labyrinth Project Proposal Presentation
Present your project proposal with this clean and professional template! Covering sections such as objectives, scope of work, timeline, and budget breakdown, it helps you convey your plan clearly and effectively. Fully customizable and compatible with PowerPoint, Keynote, and Google Slides, it’s perfect for delivering impactful proposals to clients.


26 diapositivas
Digital Art Tools and Techniques Presentation
Unleash your creativity with this vibrant presentation on digital art tools and techniques. Covering essential topics like graphic design software, digital brushes, layering methods, and creative workflows, this template helps artists and designers enhance their skills. Fully customizable and compatible with PowerPoint, Keynote, and Google Slides for a seamless and visually stunning presentation experience.


6 diapositivas
System Maintenance and Support Presentation
Streamline your technical processes with the System Maintenance and Support Presentation. This slide features a clean alphabetical list layout (A–E) paired with icons and concise text areas—ideal for illustrating maintenance protocols, support categories, or troubleshooting stages. The right-side wrench graphic adds a visual metaphor for IT upkeep. Fully editable in PowerPoint, Keynote, and Google Slides.


6 diapositivas
Supply Chain Management Infographics
Elevate your presentation with our Supply Chain Management template, designed for clarity and impact. The slides are a blend of professional and engaging visuals, perfect for showcasing the intricacies of supply chain operations. Ideal for professionals and educators, they simplify complex logistics concepts into understandable visuals. The design is clean, making it perfect for business presentations that need to convey detailed processes and strategies effectively. With these slides, you're equipped to deliver a powerful message about the importance of streamlined supply chain management.


7 diapositivas
Blue Ocean Strategy Infographic Presentation Template
The Blue Ocean strategy is a highly practical, step-by-step process for leaders to create uncontested market space and make the competition irrelevant. With this template you will be able to identify and capitalize on the growth opportunities your company has been overlooking or avoiding due to industry constraints. Our template is designed to help you identify market opportunities and formulate your strategy to avoid the threat of competition. Use this as a graphic organizer to help you think about how you can best compete in the marketplace. This template is perfect for your next presentation!


8 diapositivas
3D Infographic Design Presentation
Make your data pop—literally—with a stacked design that brings depth and clarity to your message. This 3D infographic template helps break down layered concepts, step-by-step processes, or hierarchical data in a visually striking way. It’s fully customizable and compatible with PowerPoint, Keynote, and Google Slides for easy presentation building.


6 diapositivas
Project Gantt Chart Presentation
This Project Gantt Chart Presentation helps visualize your project timeline with clarity. Featuring six tasks, weekly progress bars, and colorful icons, it’s ideal for tracking milestones. Fully customizable and easy to edit, this slide works seamlessly in PowerPoint, Keynote, and Google Slides for organized, professional project management presentations.