


Características


¿Tienes alguna pregunta?
Recomendar


7 diapositivas
Implementation Models and Frameworks Slide Presentation
Visualize your entire process clearly with the Implementation Models and Frameworks Slide Presentation. This sleek arrow-based timeline features six distinct stages, each with icons and text placeholders to highlight key milestones, actions, or phases. Ideal for showcasing workflows, strategic initiatives, or rollout plans, this slide ensures your audience follows the journey from start to finish. Fully editable in PowerPoint, Keynote, and Google Slides, it’s perfect for project managers, consultants, and team leads aiming for clarity and impact.


5 diapositivas
Startup Business Pitch Deck Presentation
Impress investors with this clean and modern pitch deck slide, designed to showcase business growth and funding stages. Featuring a sleek stacked ring graphic with a rocket icon for visual impact, this layout is perfect for presenting milestones, KPIs, or financial progress. Fully editable in PowerPoint, Keynote, and Google Slides.


6 diapositivas
Business Process Flowchart Presentation
Streamline your workflow with the Business Process Flowchart presentation. This structured and visually engaging template helps you map out processes, optimize efficiency, and improve communication within your team. Designed for business analysts, managers, and strategists, this fully editable slide ensures clarity in decision-making and operations. Compatible with PowerPoint, Keynote, and Google Slides.


6 diapositivas
Customer Satisfaction Smile Chart Presentation
Bring your data to life with a slide that instantly shows how customers feel, blending clean visuals with an intuitive emotion scale. This presentation helps you communicate feedback trends, highlight satisfaction levels, and support decision-making with clarity. Ideal for reports, reviews, and strategy updates. Fully compatible with PowerPoint, Keynote, and Google Slides.


7 diapositivas
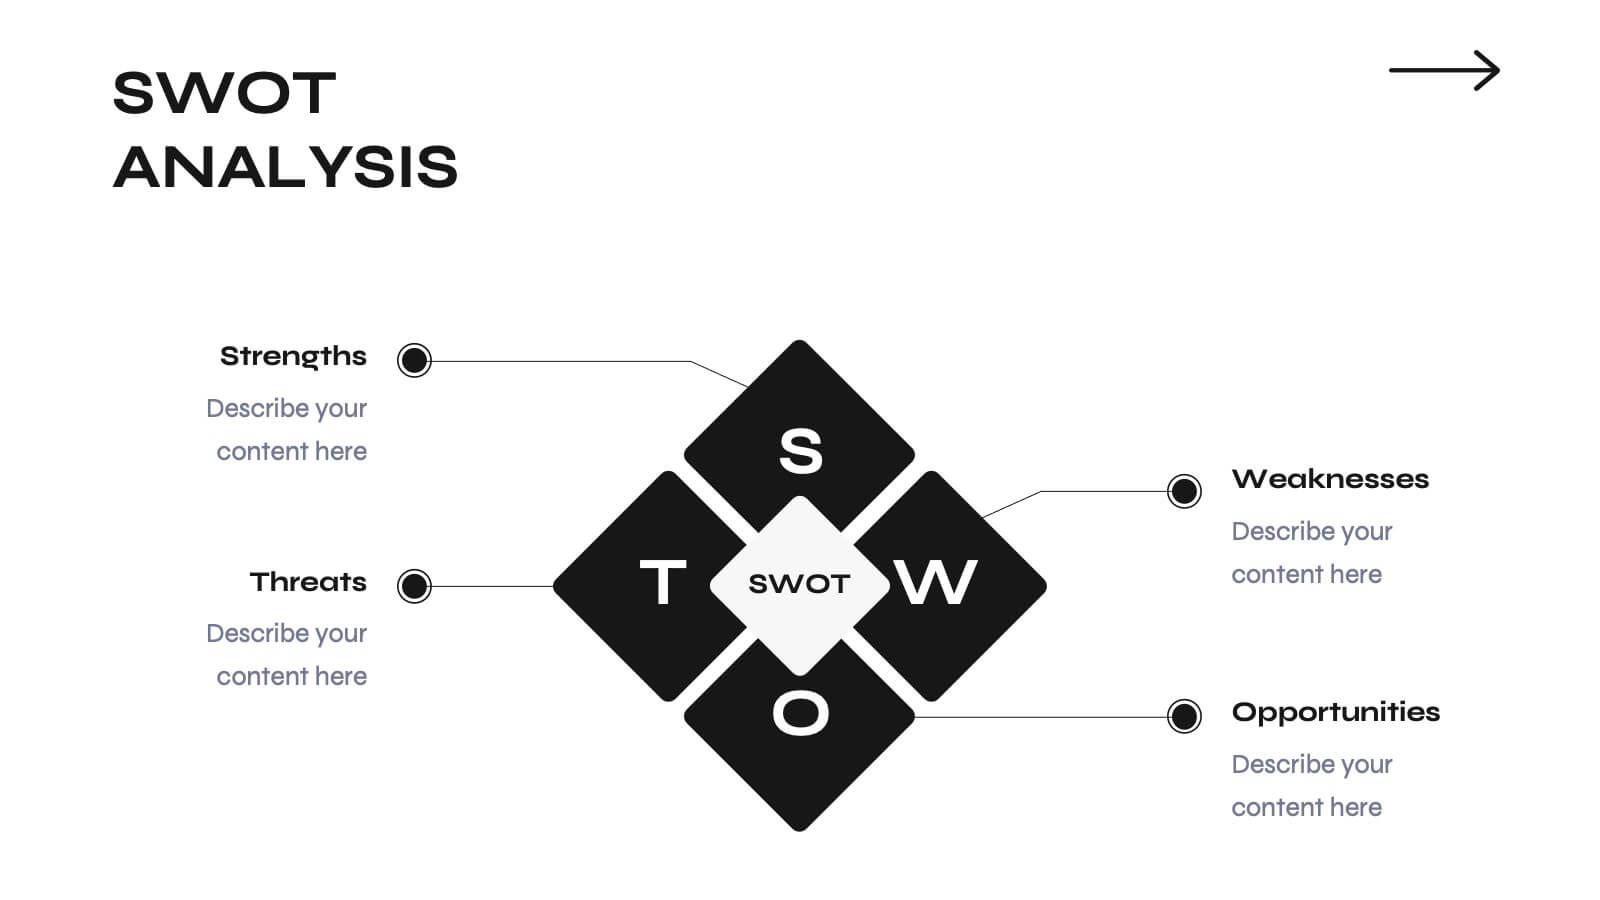
PESTEL Market Analysis Infographic
PESTEL analysis is a crucial framework for comprehending the macro-environmental factors influencing a market. Our PESTEL market analysis infographic, rendered in lively shades of green and orange against a pristine white backdrop, provides a concise yet comprehensive overview of Political, Economic, Social, Technological, Environmental, and Legal aspects. Specifically tailored for business analysts, strategists, and market researchers, this template serves as a vibrant visual guide for dissecting the external market environment. With compatibility spanning PowerPoint, Keynote, and Google Slides, it promises a dynamic addition to your market analysis presentations.


6 diapositivas
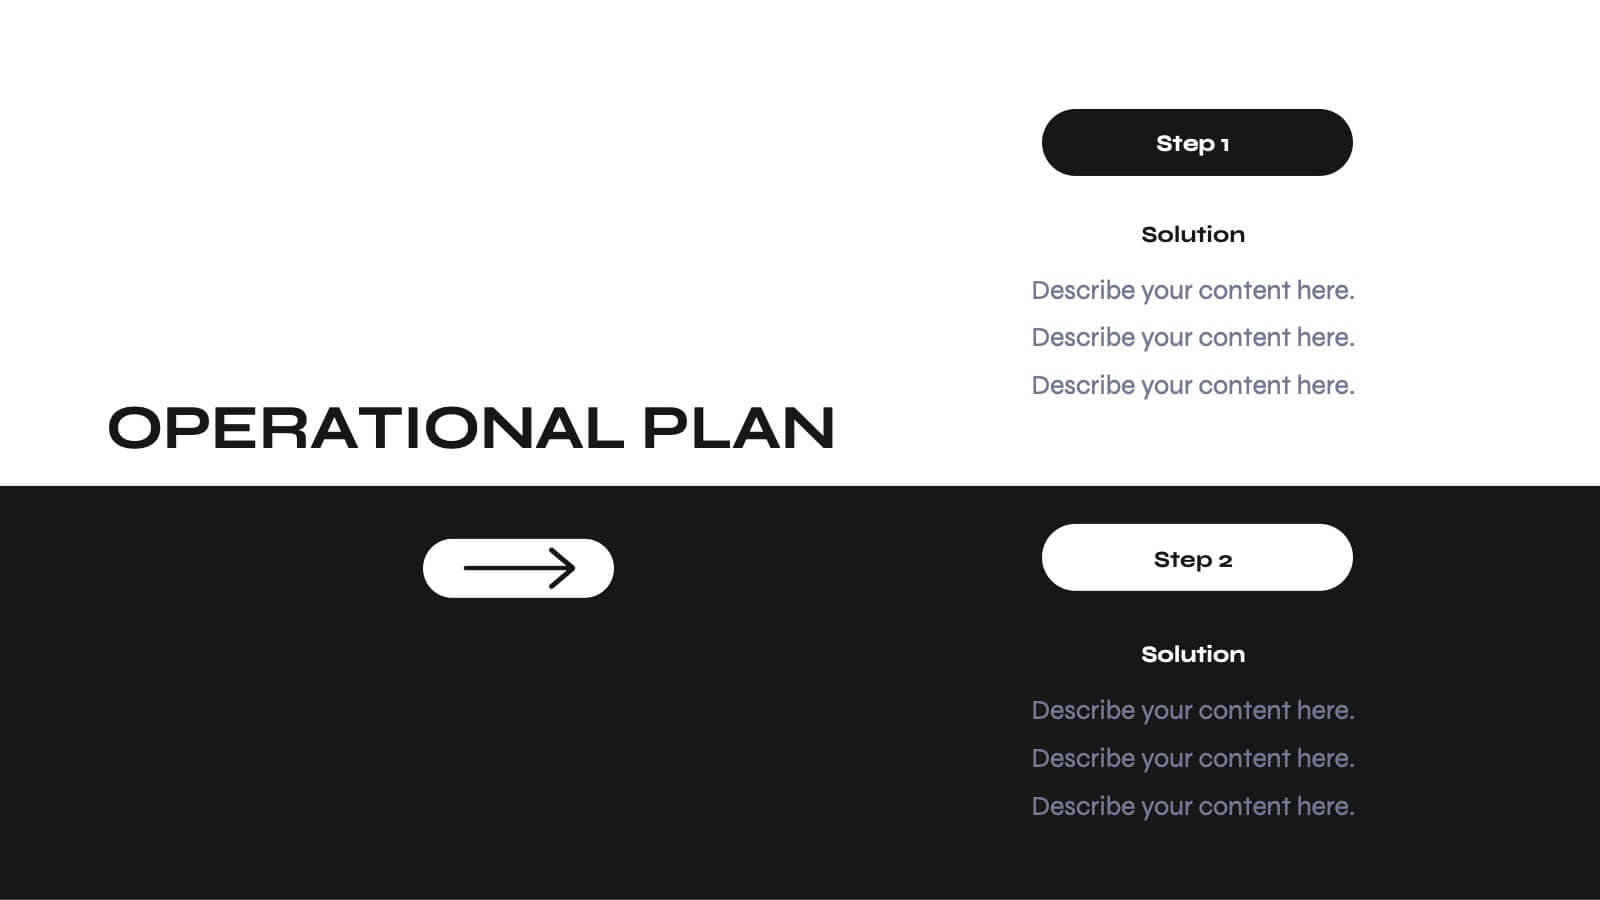
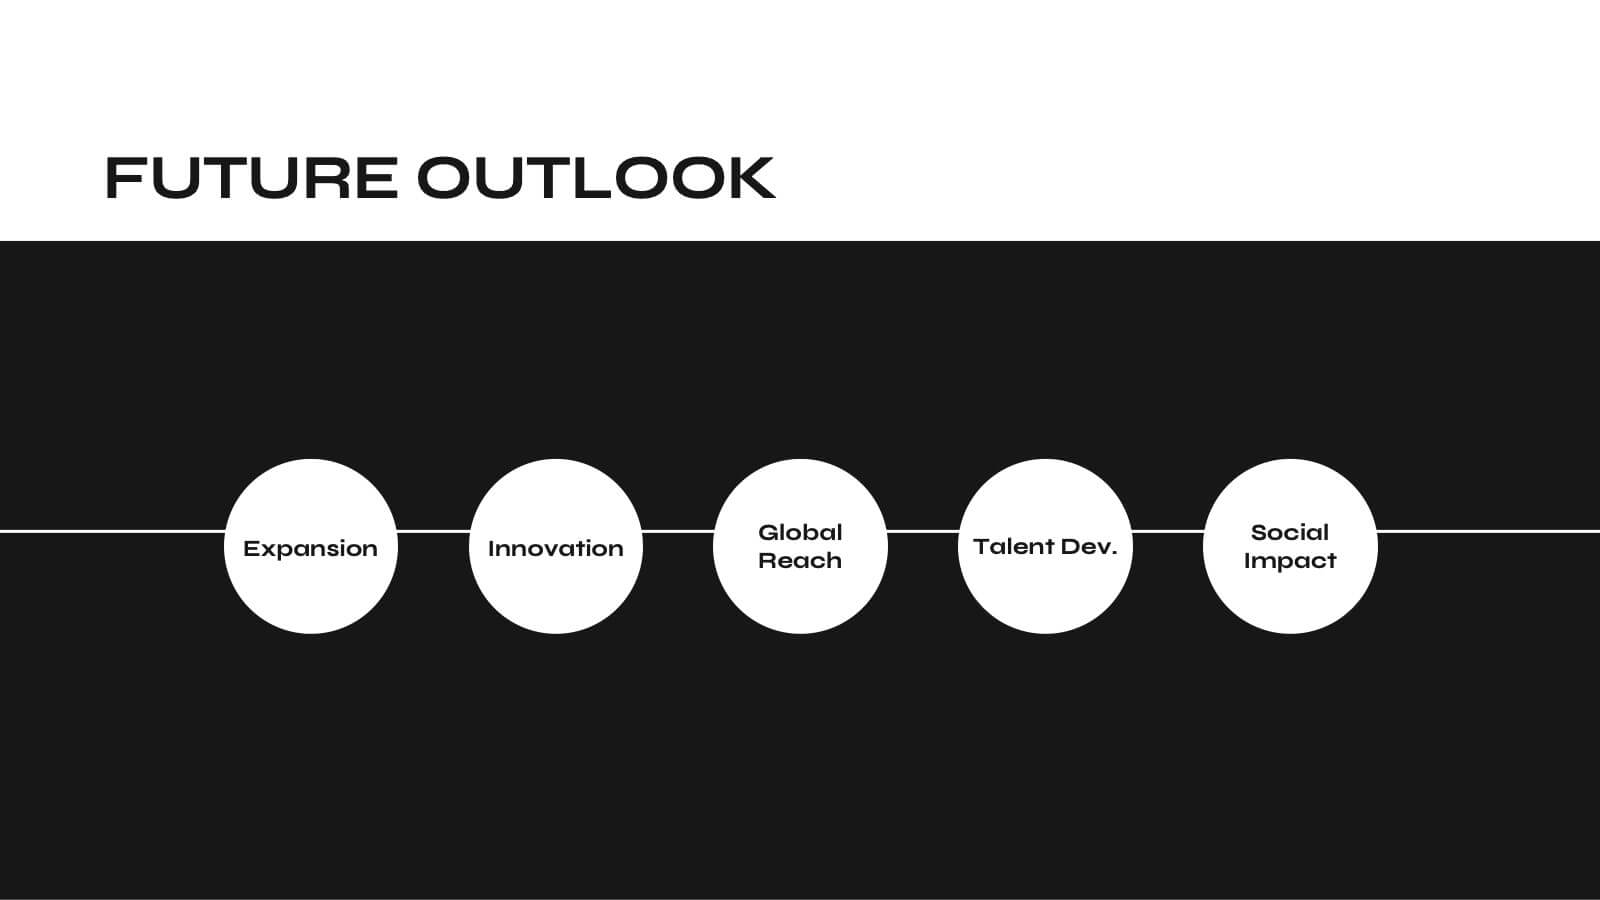
Strategic Next Steps Planning Presentation
Bring your strategy to life with a clear, visual roadmap that guides audiences through each phase of your plan. Ideal for outlining goals, milestones, and next steps, this layout makes progress easy to follow and professional to present. Compatible with PowerPoint, Keynote, and Google Slides for effortless customization.


5 diapositivas
Watercolor Background Design Presentation
Add an artistic edge to your presentation with this Watercolor Background Design Template. Featuring soft, abstract paint splashes behind vibrant alphabet icons, it’s perfect for creative professionals, educators, or marketing teams looking to highlight four core ideas or comparisons. Fully editable in PowerPoint, Keynote, and Google Slides for a seamless customization experience.


3 diapositivas
Cost-Benefit Analysis and Strategic Outcomes Presentation
Present trade-offs with clarity using the Cost-Benefit Analysis and Strategic Outcomes Presentation. Designed with visual balance scales and segmented callouts, this layout helps you compare investments versus returns, making complex decisions easier to explain. Ideal for proposals, audits, or business strategy reviews. Fully editable in PowerPoint, Keynote, and Google Slides.


4 diapositivas
Management Levels Hierarchy
Illustrate your team’s structure using this modern pyramid-style hierarchy chart. Featuring space for names, roles, and profile photos, it’s ideal for highlighting top, middle, and lower-level management. Fully editable in PowerPoint, Keynote, and Google Slides.


23 diapositivas
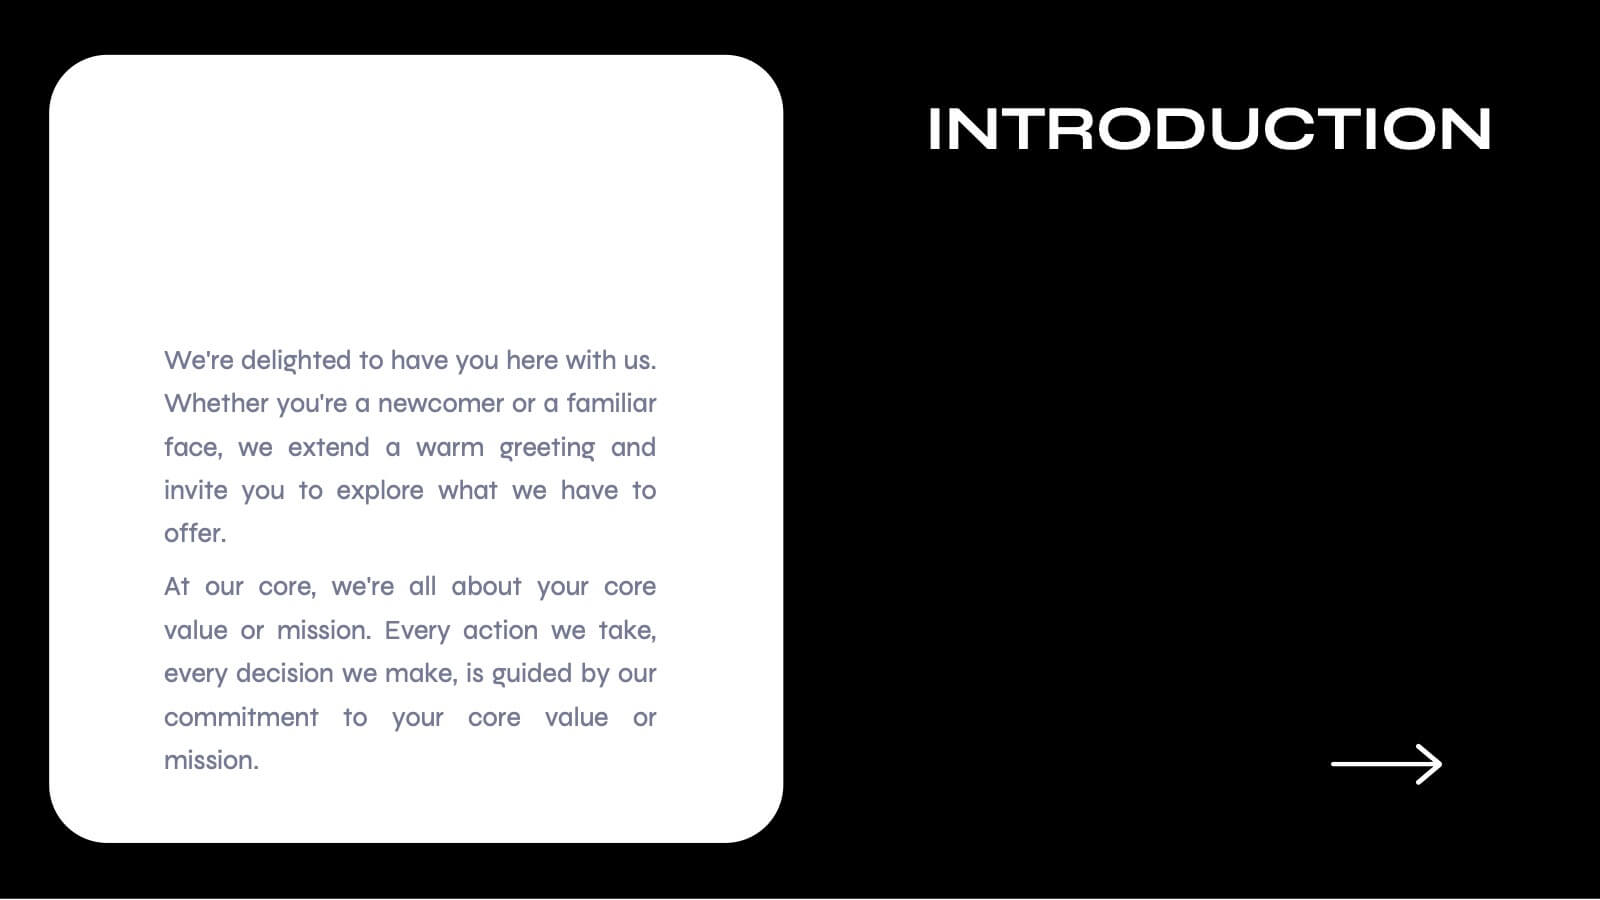
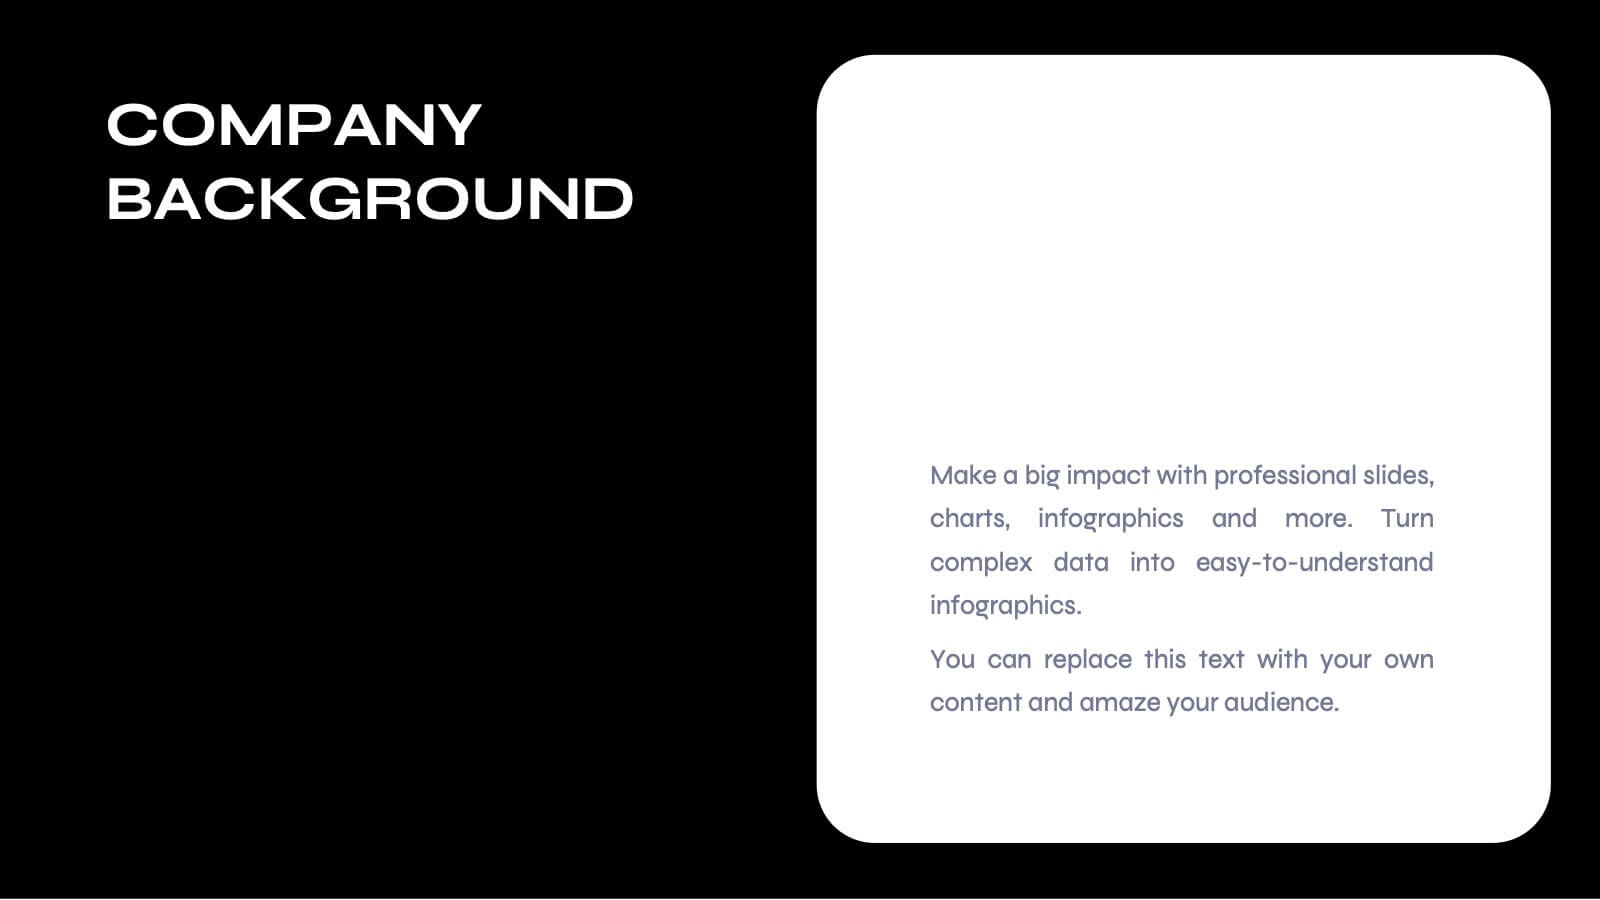
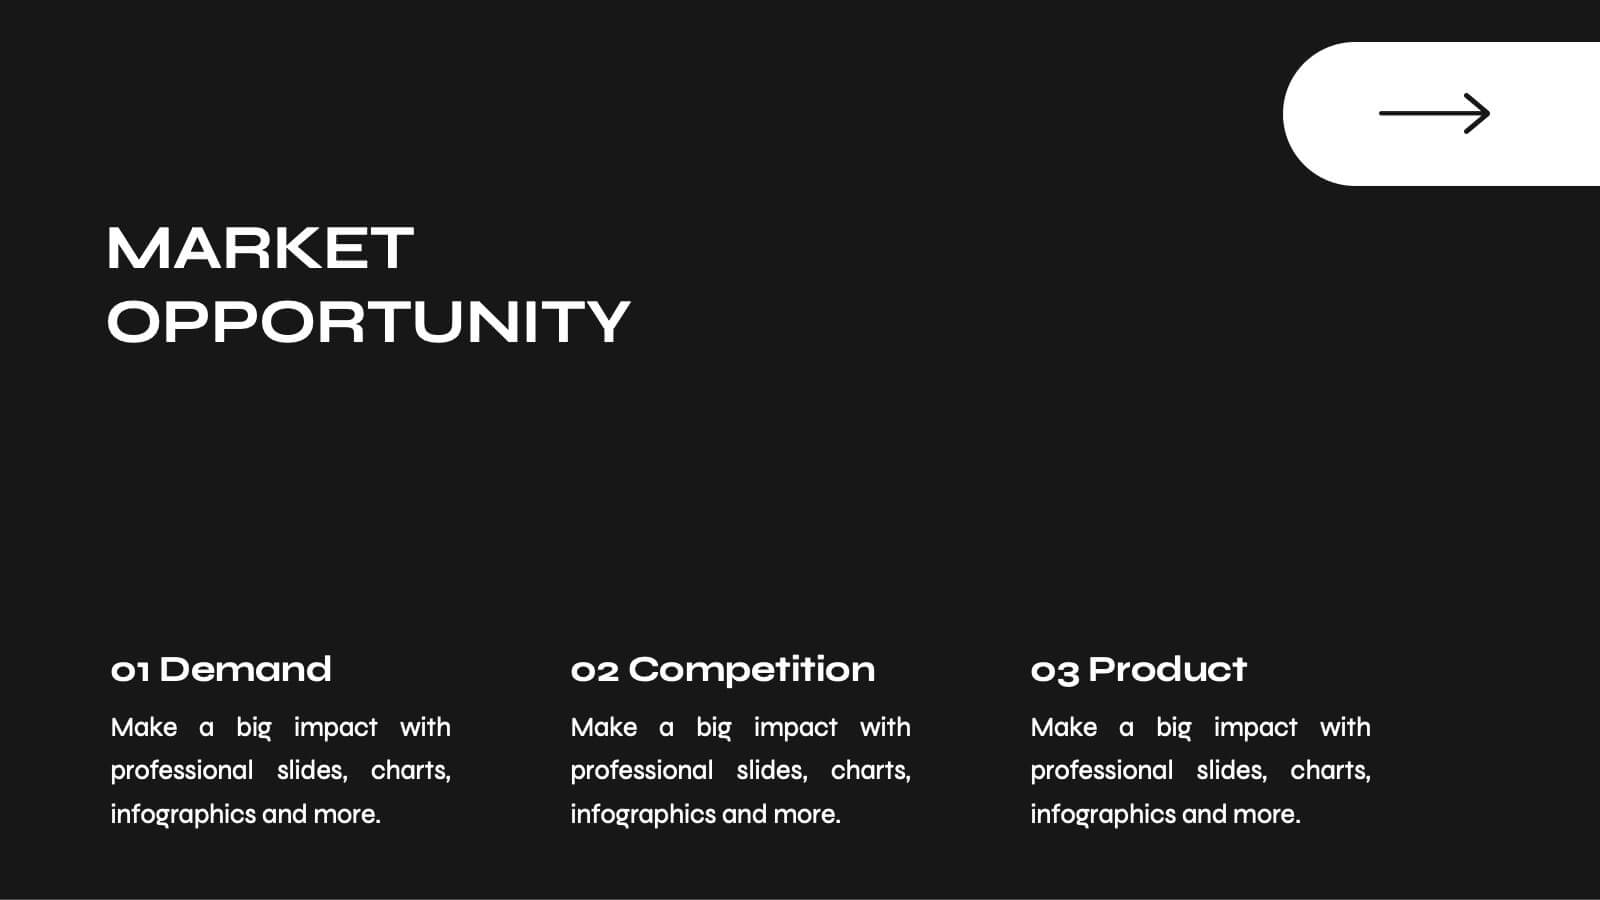
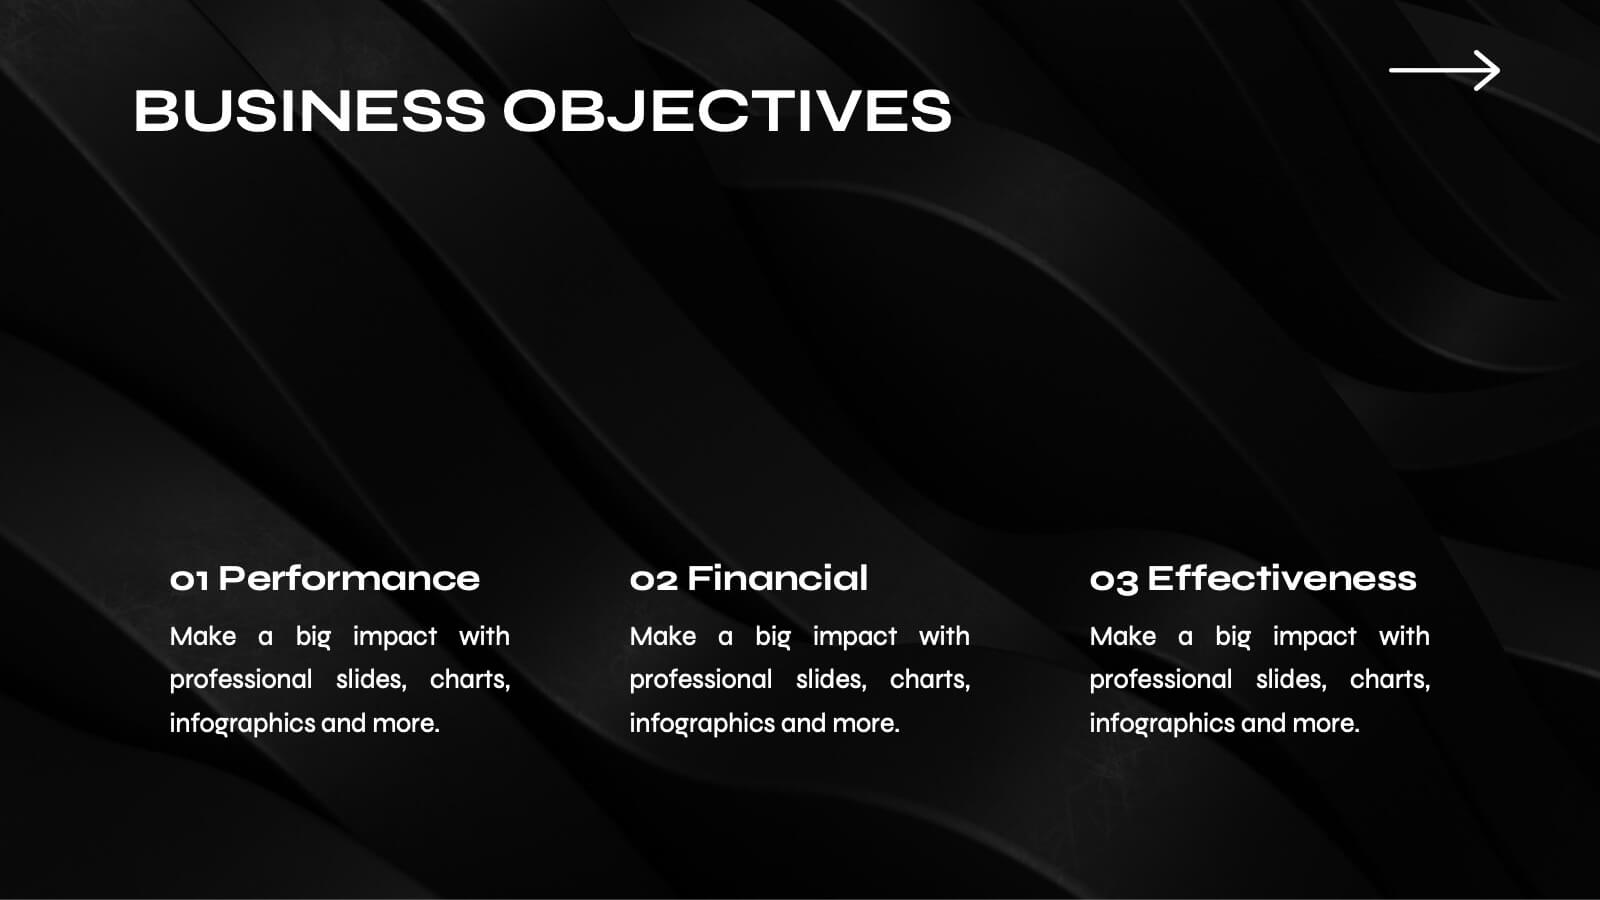
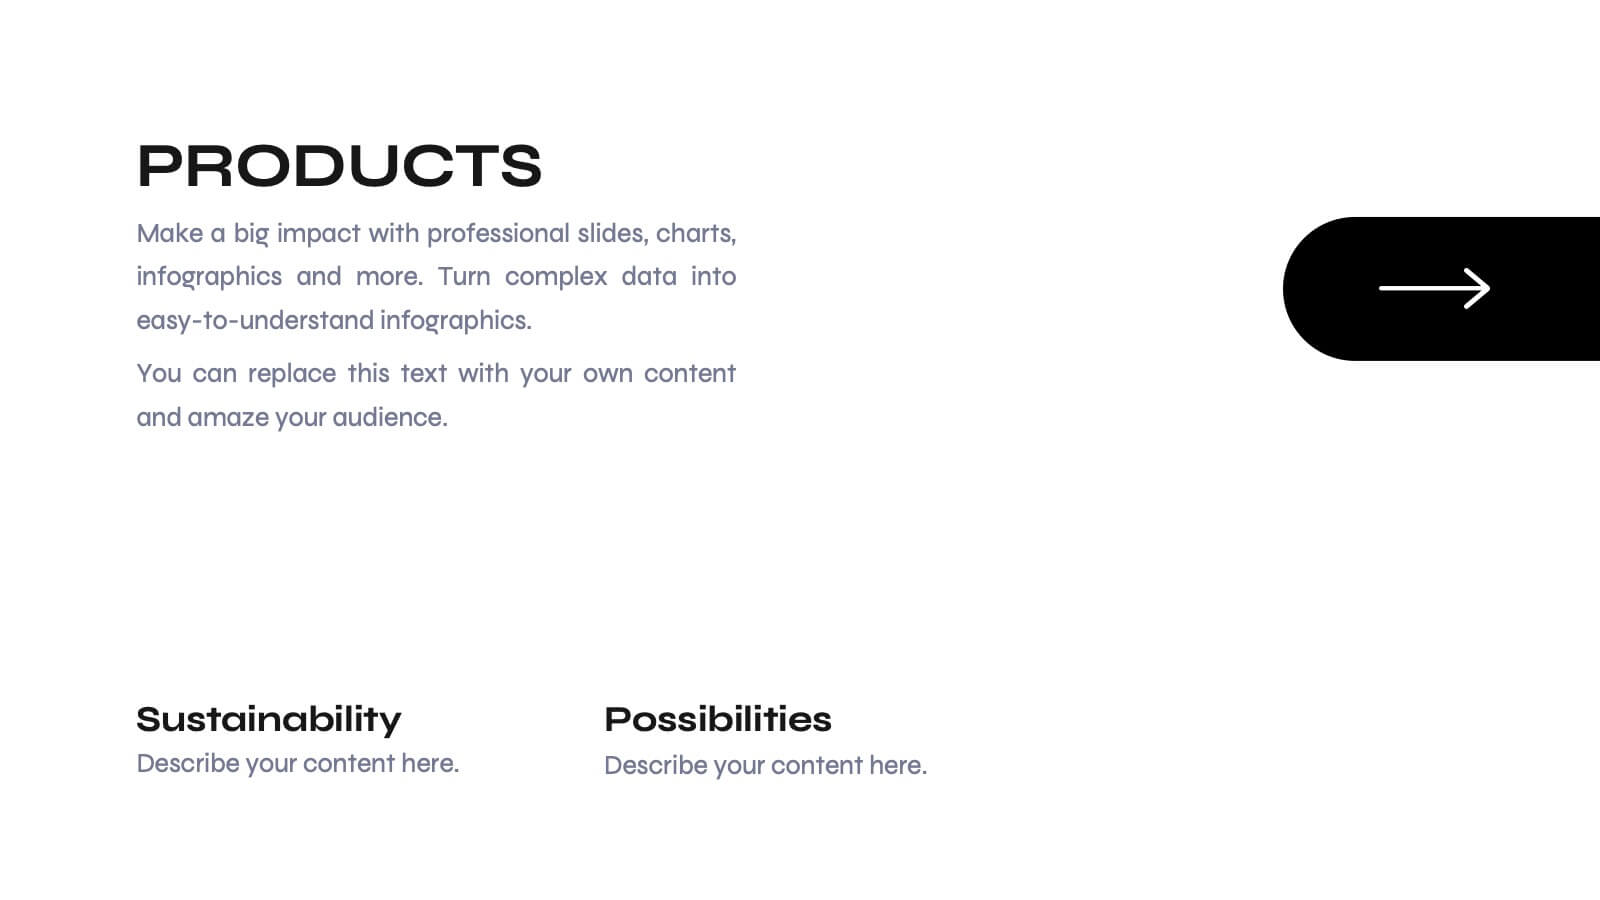
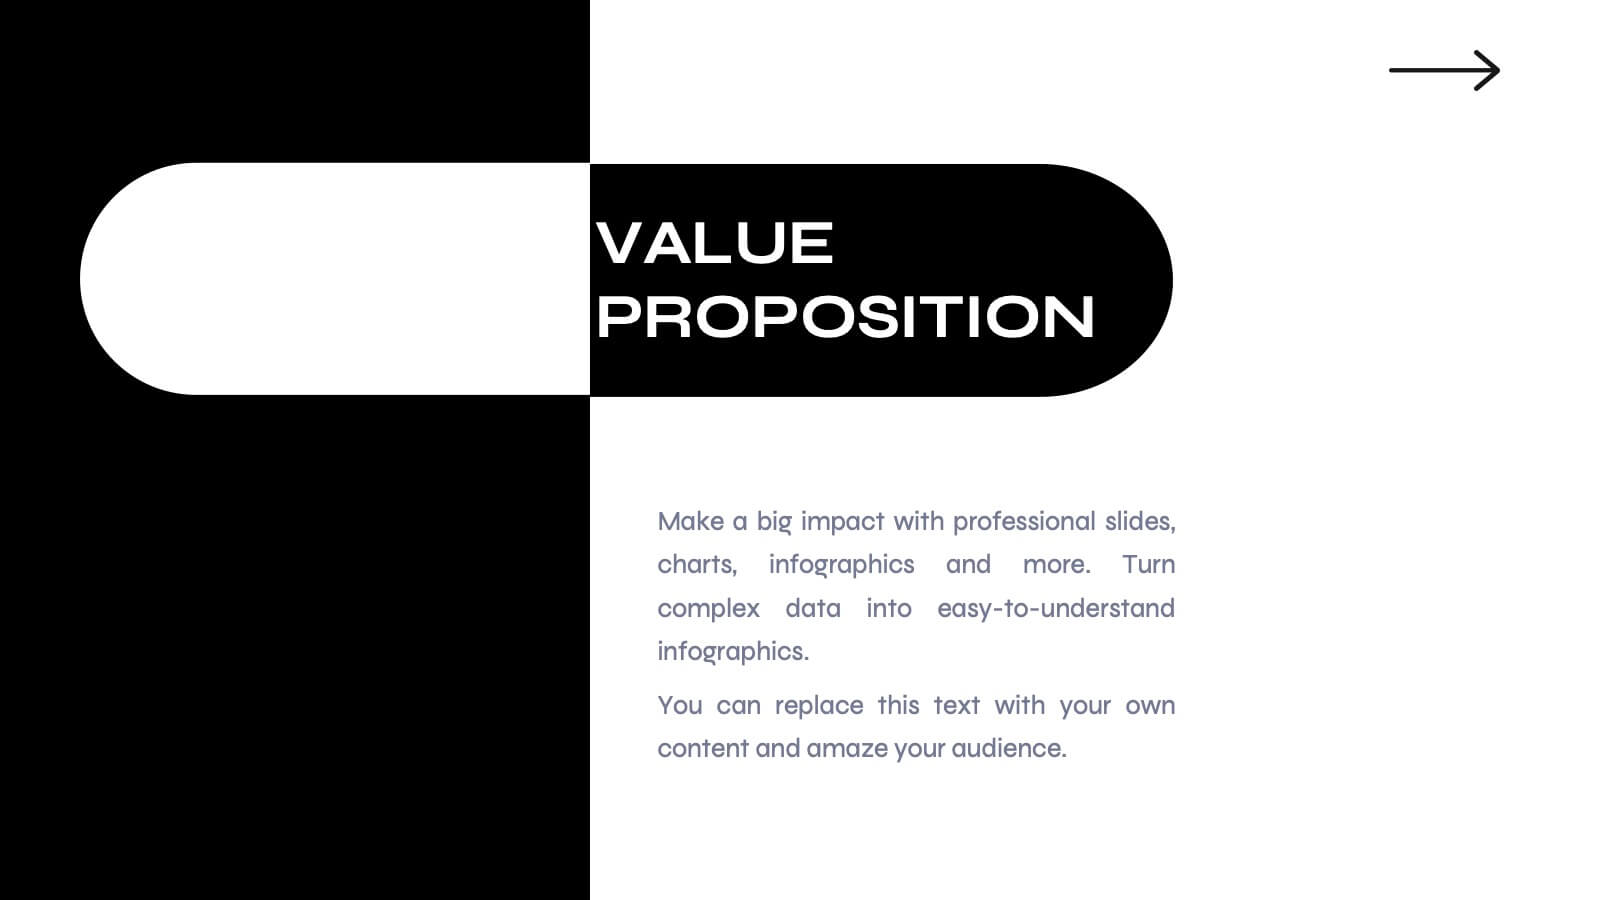
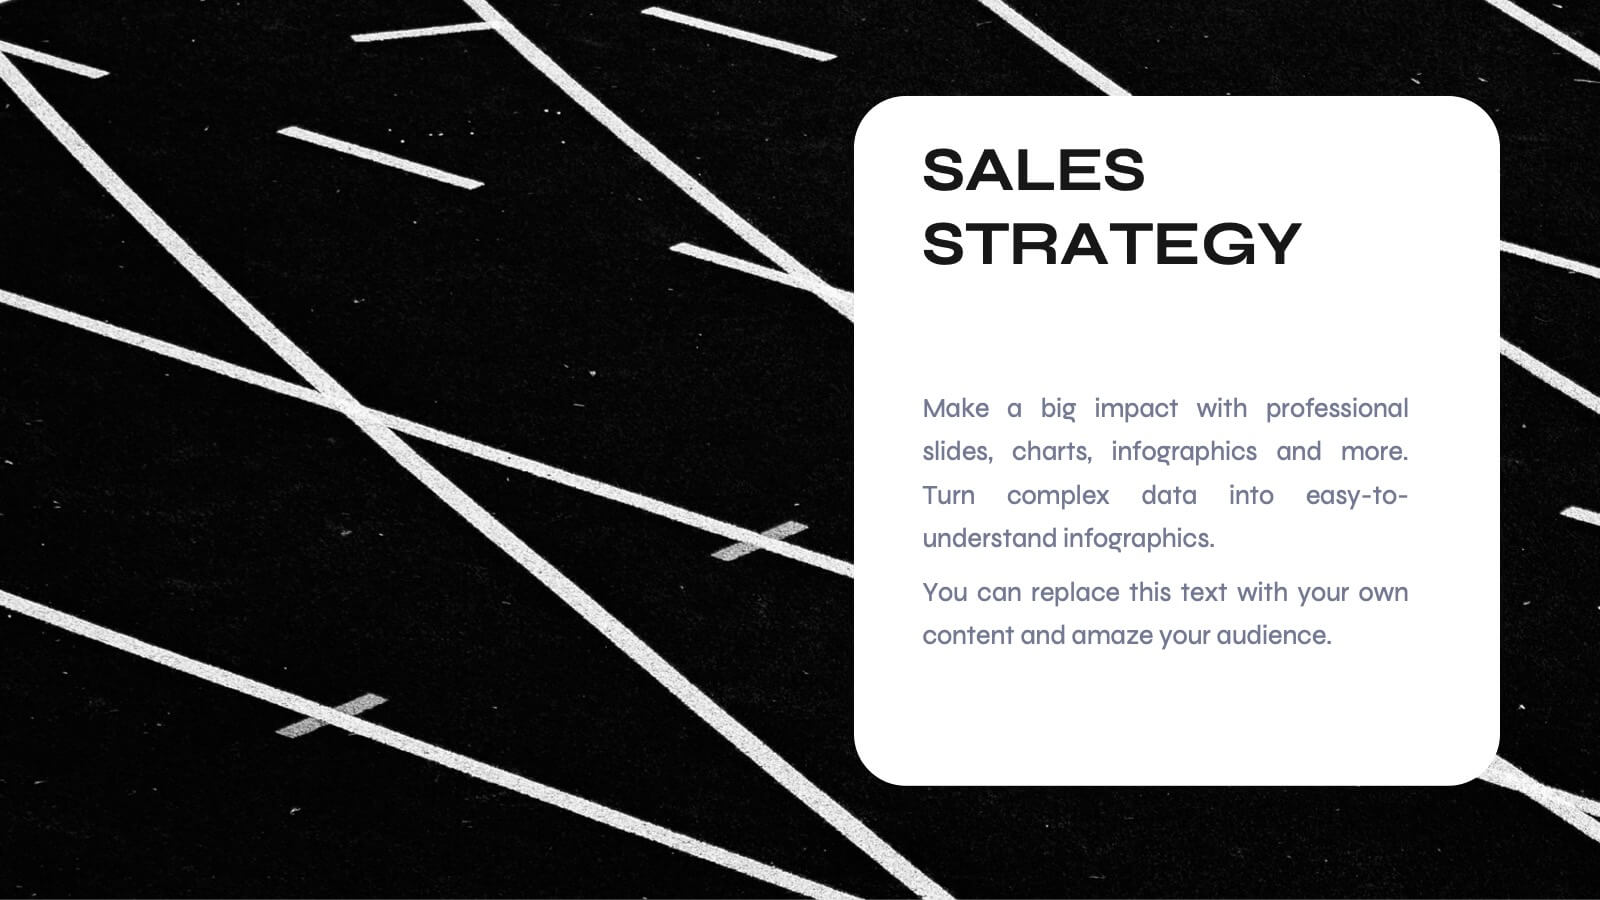
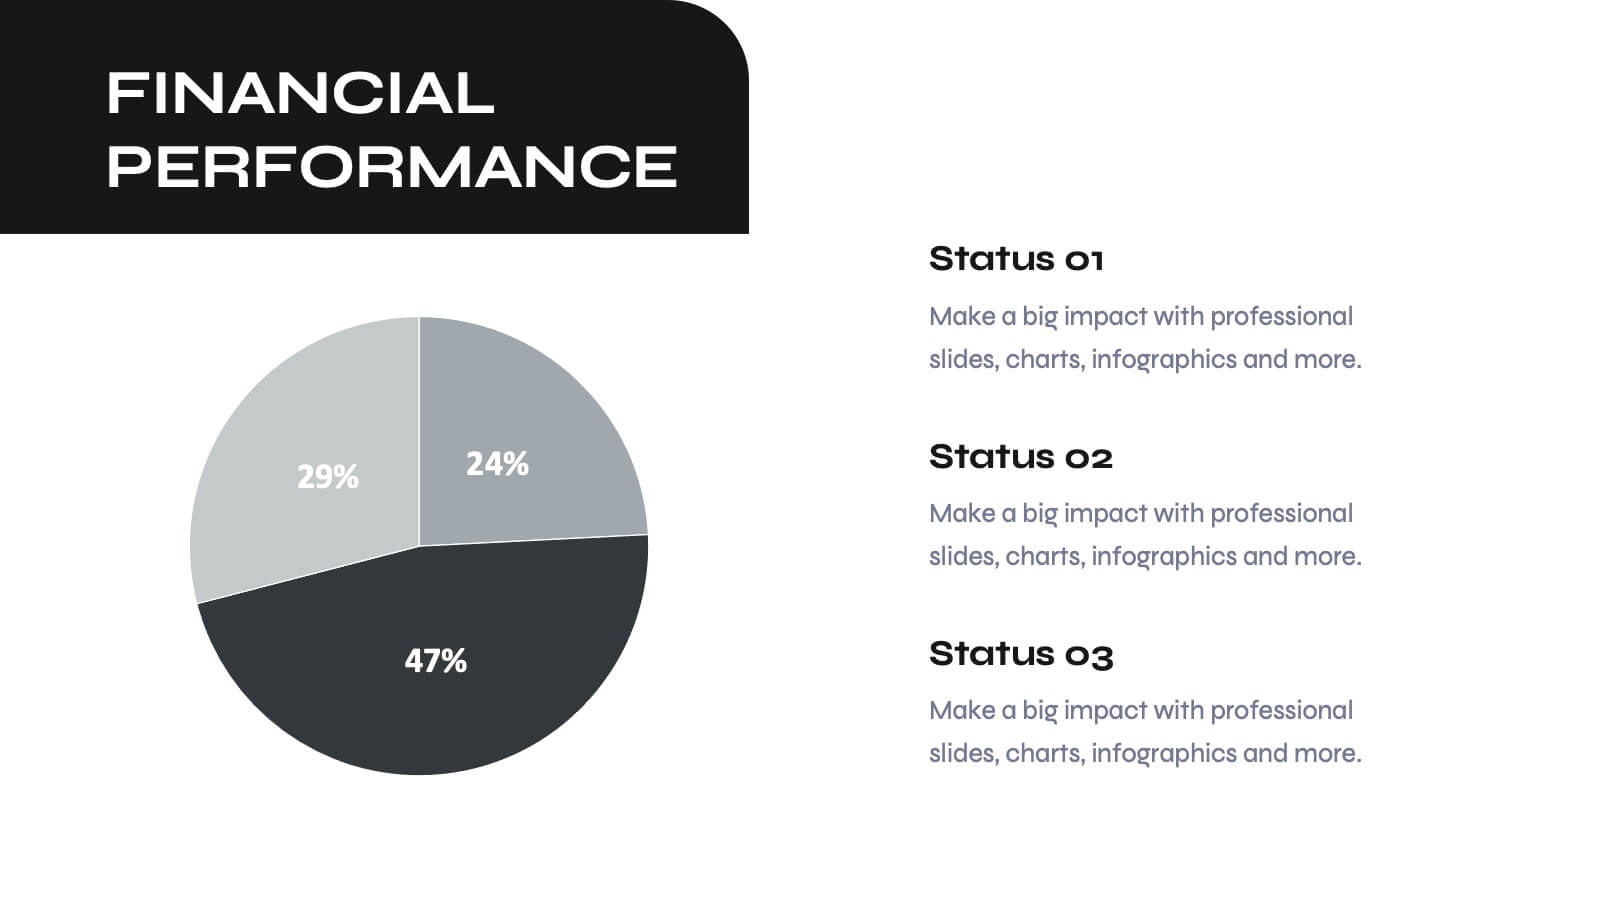
Odyssey Small Business Pitch Deck Presentation
Elevate your business pitch with this sleek, monochrome presentation template. Perfect for presenting company backgrounds, market opportunities, and financial performance, it features a minimalist design that enhances clarity and impact. Highlight your value proposition and strategic plans to captivate investors. Compatible with PowerPoint, Keynote, and Google Slides, it ensures seamless presentations on any platform.


8 diapositivas
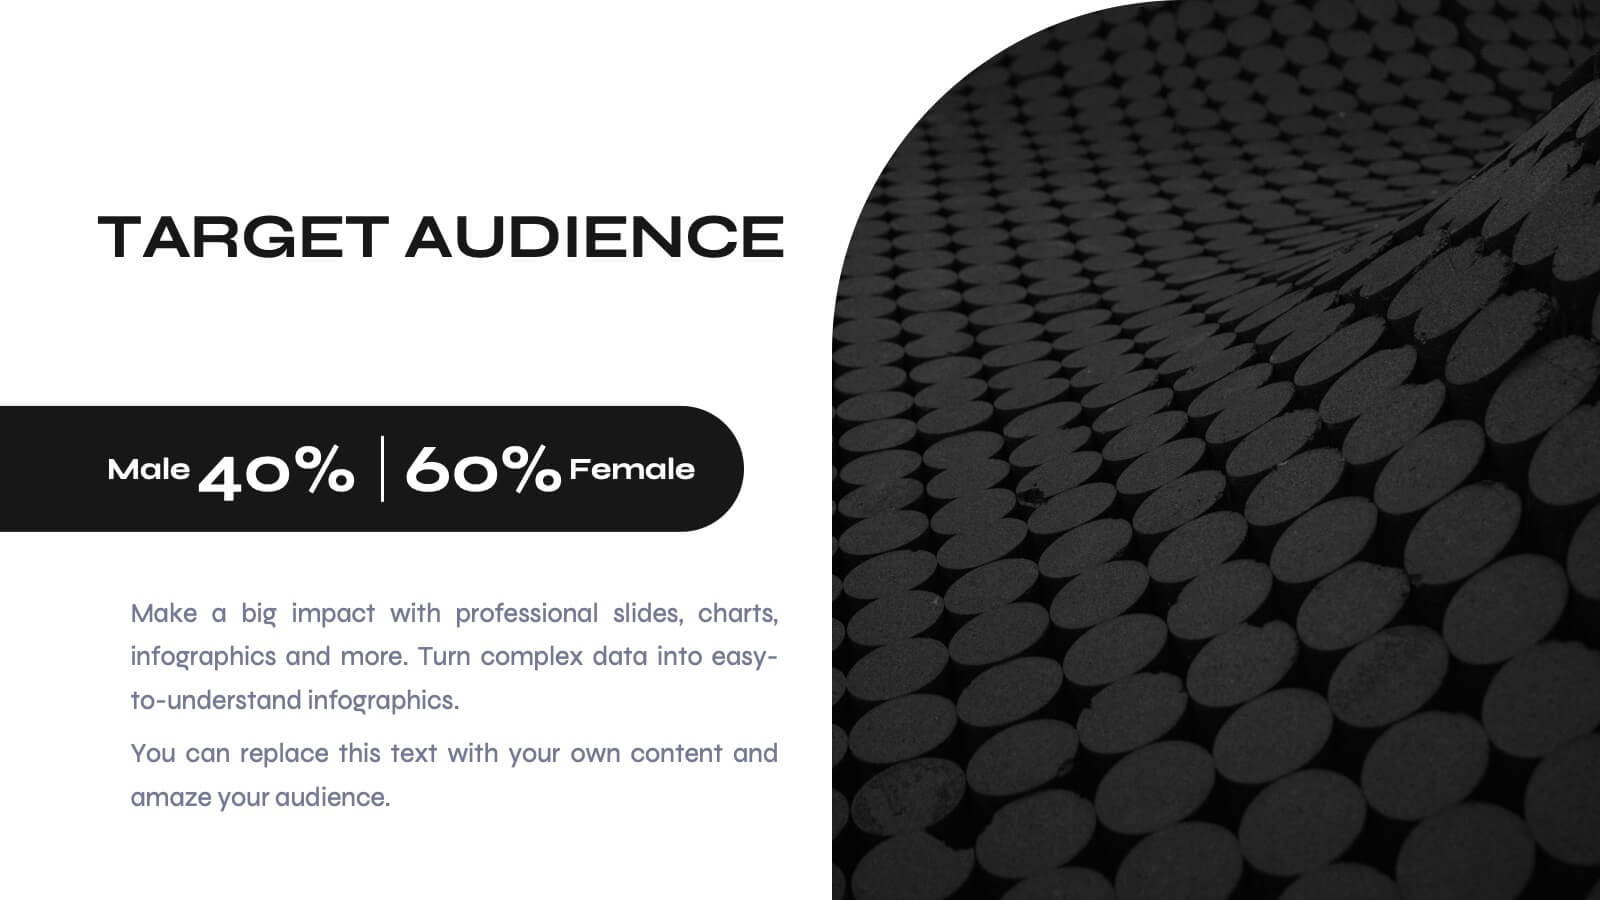
Customer Targeting and Persona Creation Presentation
Hook your audience with a clean, modern layout that zooms in on what really matters—your ideal customer. This customer persona template helps visualize traits, behaviors, and key targets for effective marketing. Perfect for campaign planning, branding, or audience research. Fully compatible with PowerPoint, Keynote, and Google Slides.


7 diapositivas
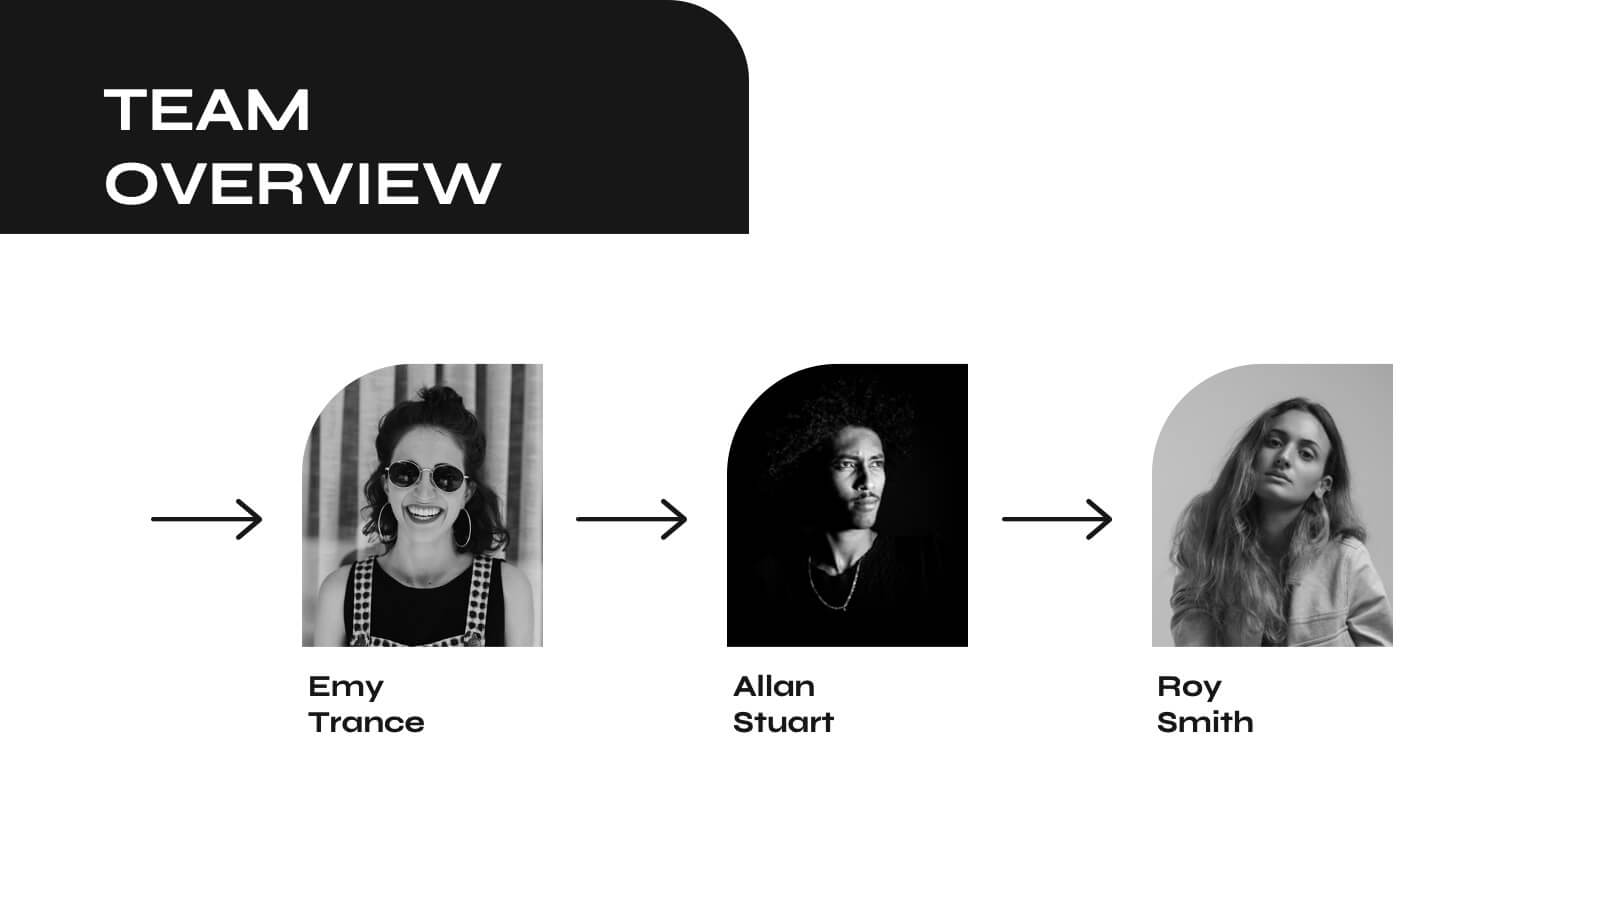
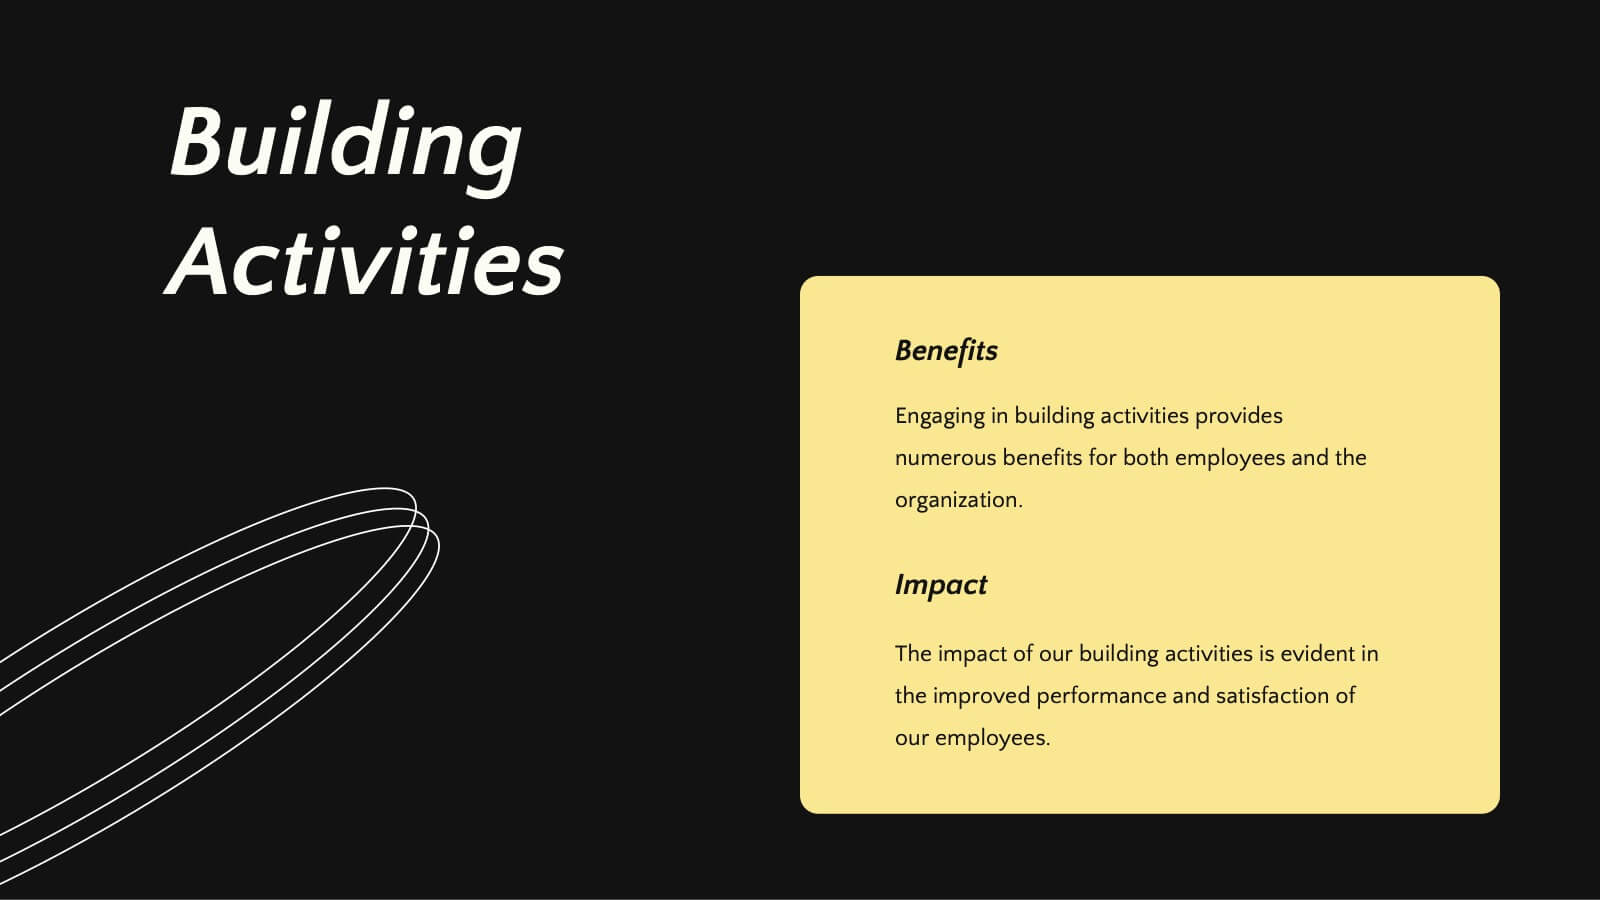
Development Team Infographic
The showcased slides are meticulously designed for development teams, aiming to present key project details, timelines, and development processes effectively. The templates utilize a mixture of sleek designs and intuitive layouts that help visualize the complexities of software development and project management. The selection includes various infographic styles that cater to different informational needs such as workflow diagrams, progress timelines, and team structures.These templates are essential for development teams to communicate their strategies, milestones, and team roles clearly. They allow for the integration of technical data in a user-friendly manner, which can be crucial during stakeholder presentations or team meetings. With options ranging from minimalistic to data-rich layouts, these slides support detailed reporting and strategic planning, ensuring that every member of the team and stakeholders are on the same page regarding the project’s progression and objectives. The use of modern graphics and customizable elements also ensures that these presentations can be adapted to match the branding and aesthetic of different companies.


6 diapositivas
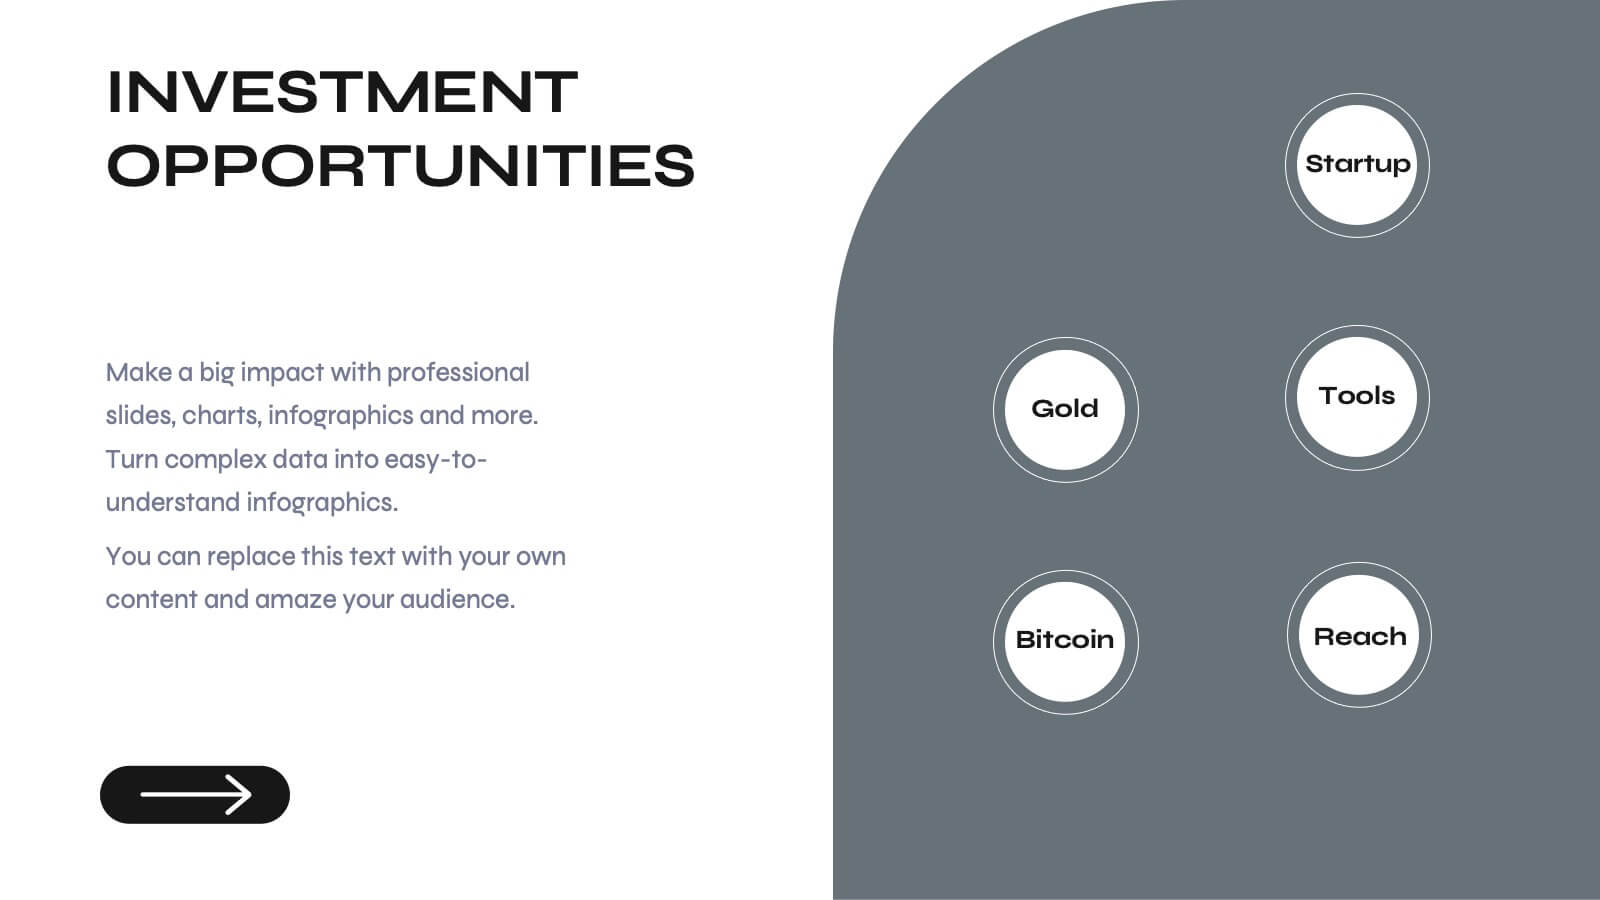
Bitcoin and Blockchain Technology Presentation
Unlock the potential of cryptocurrency and distributed ledger technology with our "Bitcoin and Blockchain Technology" presentation templates. These templates are designed to elucidate complex concepts in an understandable format, making them ideal for educators, technologists, and business professionals. Compatible with PowerPoint, Keynote, and Google Slides, they are a versatile tool for anyone looking to explain or explore the innovative world of blockchain.


6 diapositivas
Lean Six Sigma Framework Slide Presentation
Bring your audience in with a bold, energetic layout that makes each stage feel clear and engaging. This presentation explains the DMAIC framework in a streamlined way, helping users outline process improvement steps with confidence and clarity. Fully customizable and compatible with PowerPoint, Keynote, and Google Slides.
20 diapositivas
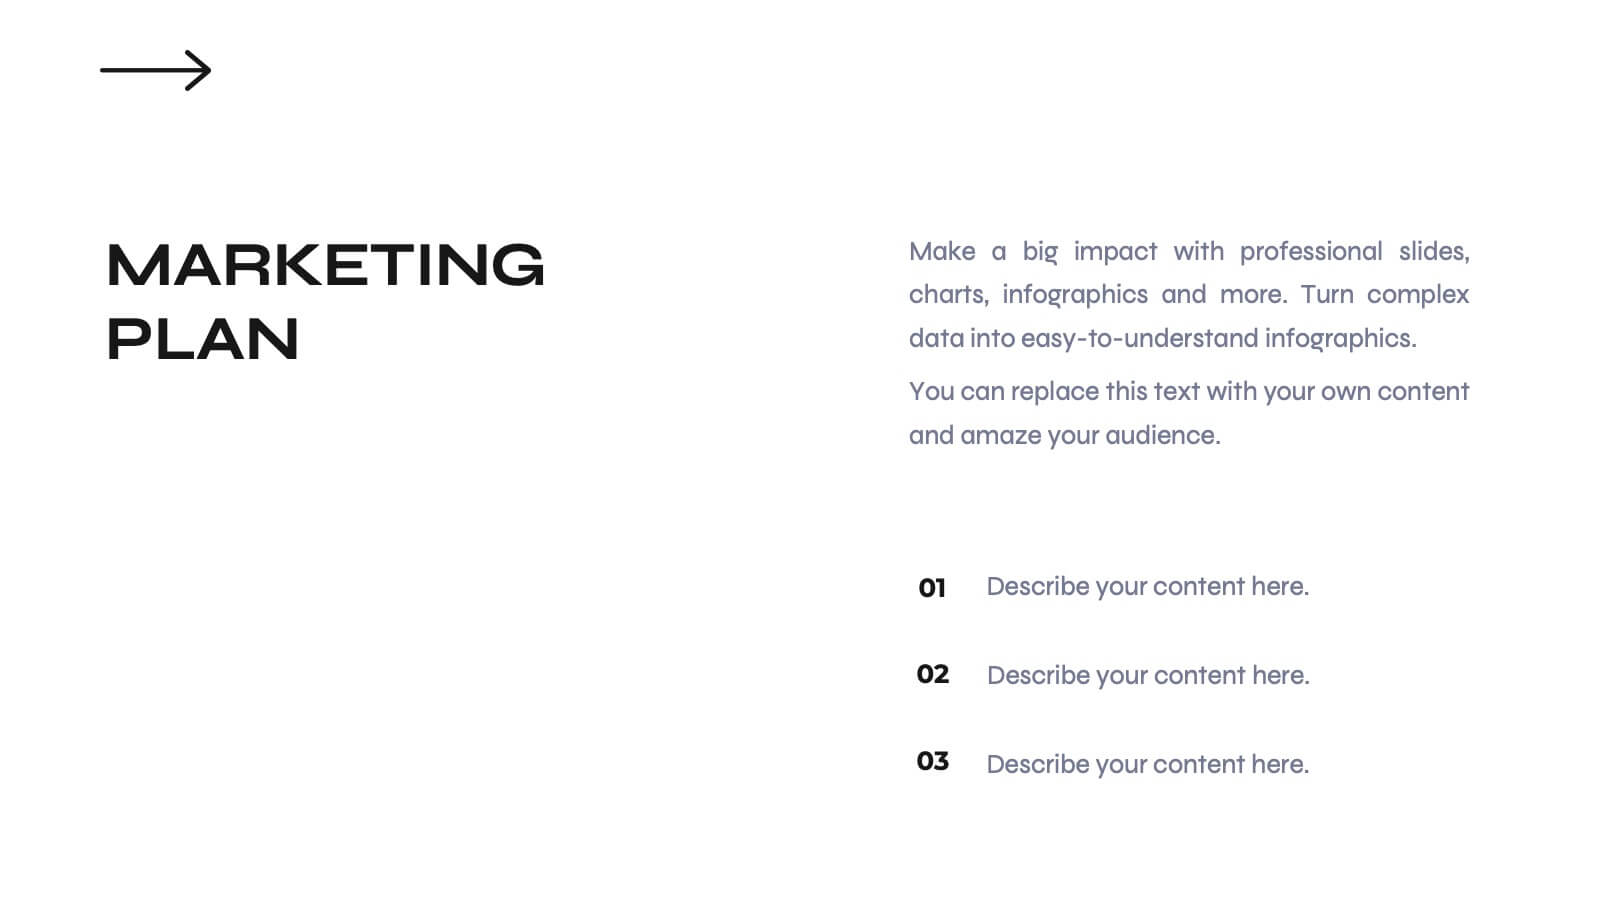
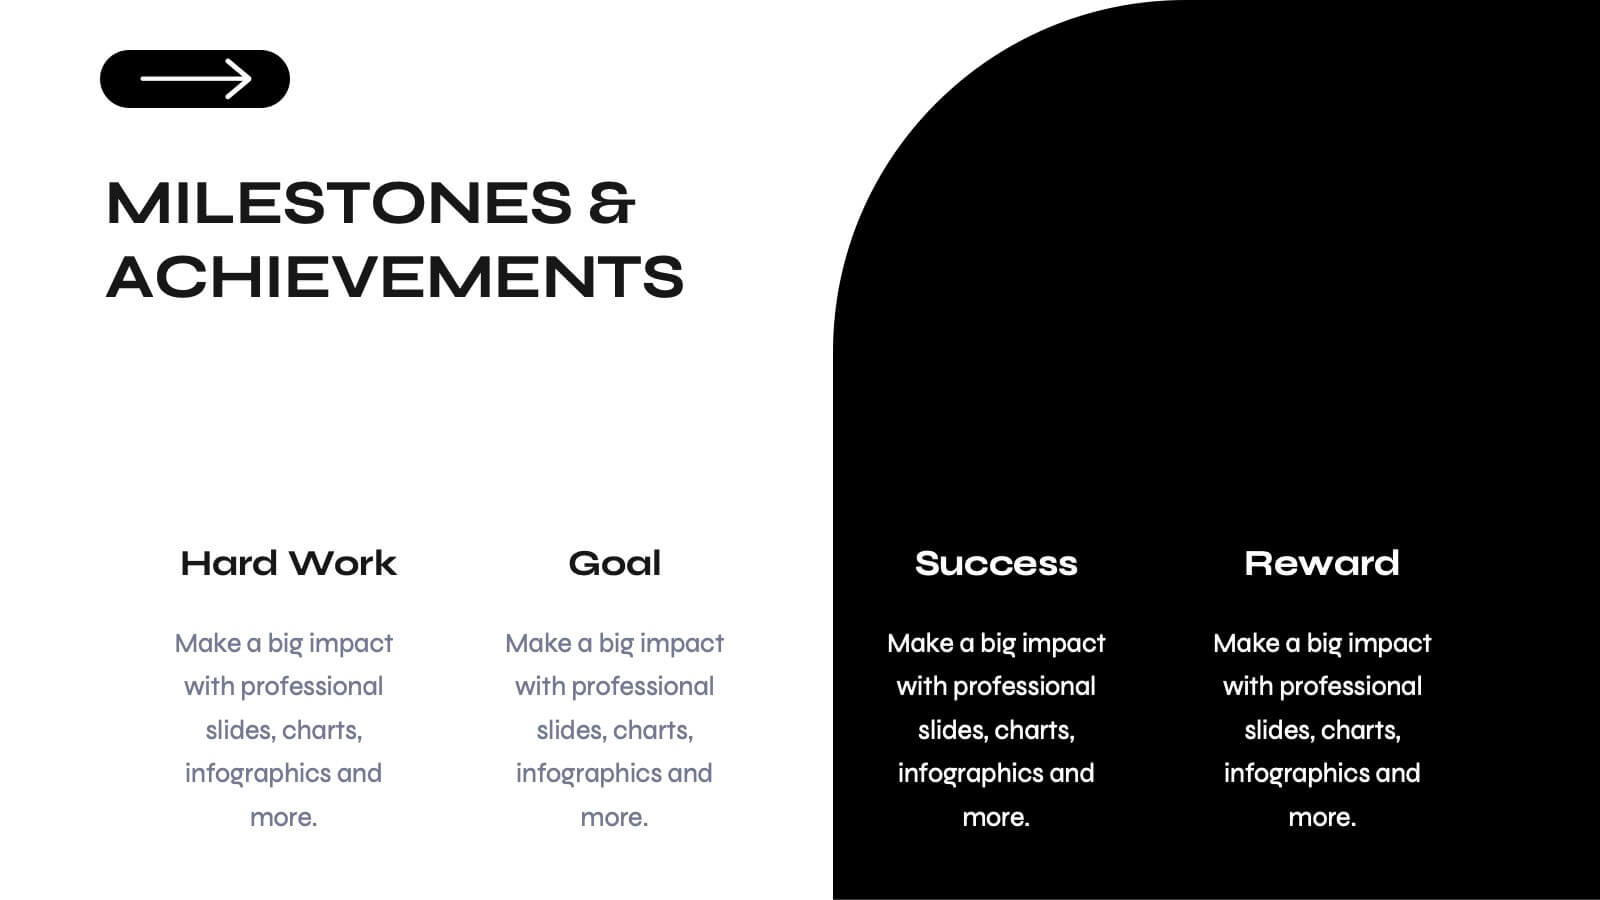
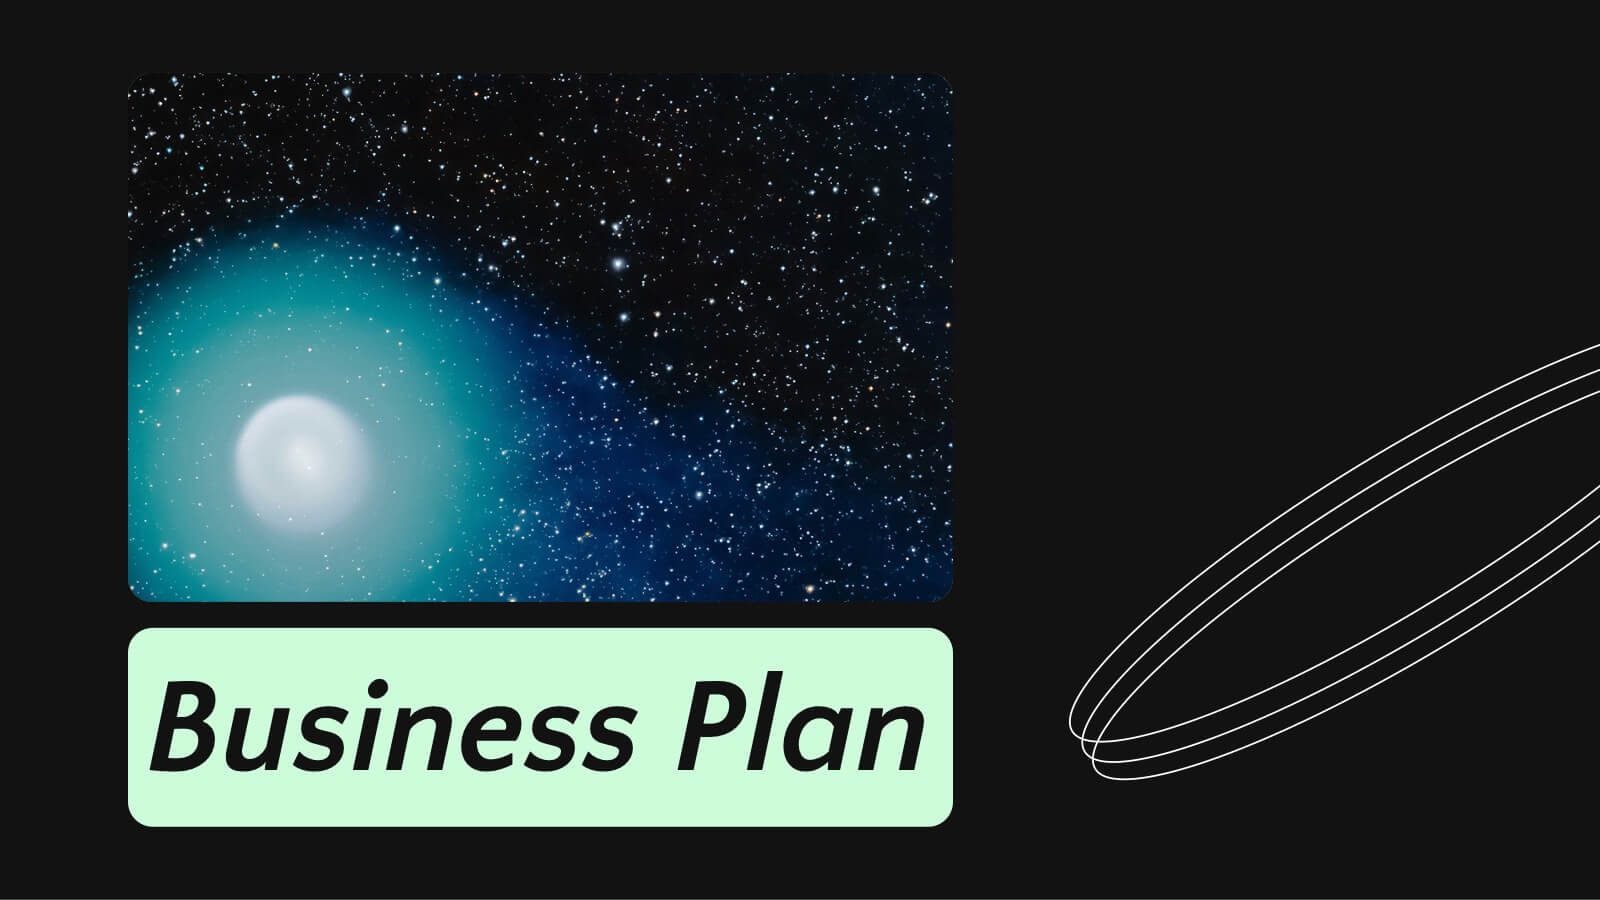
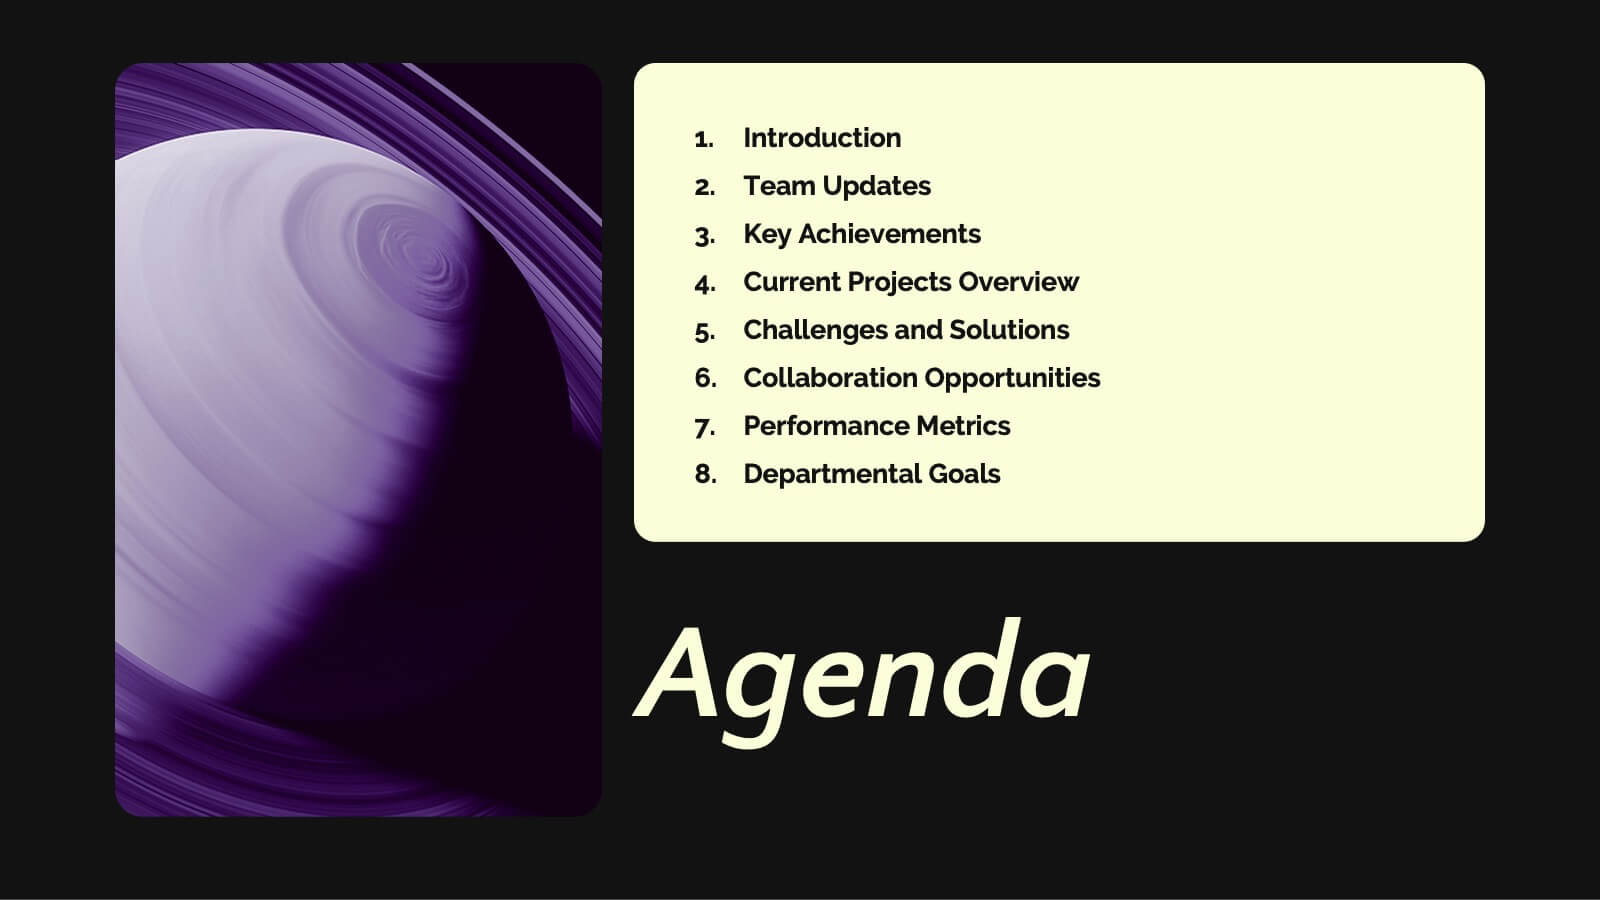
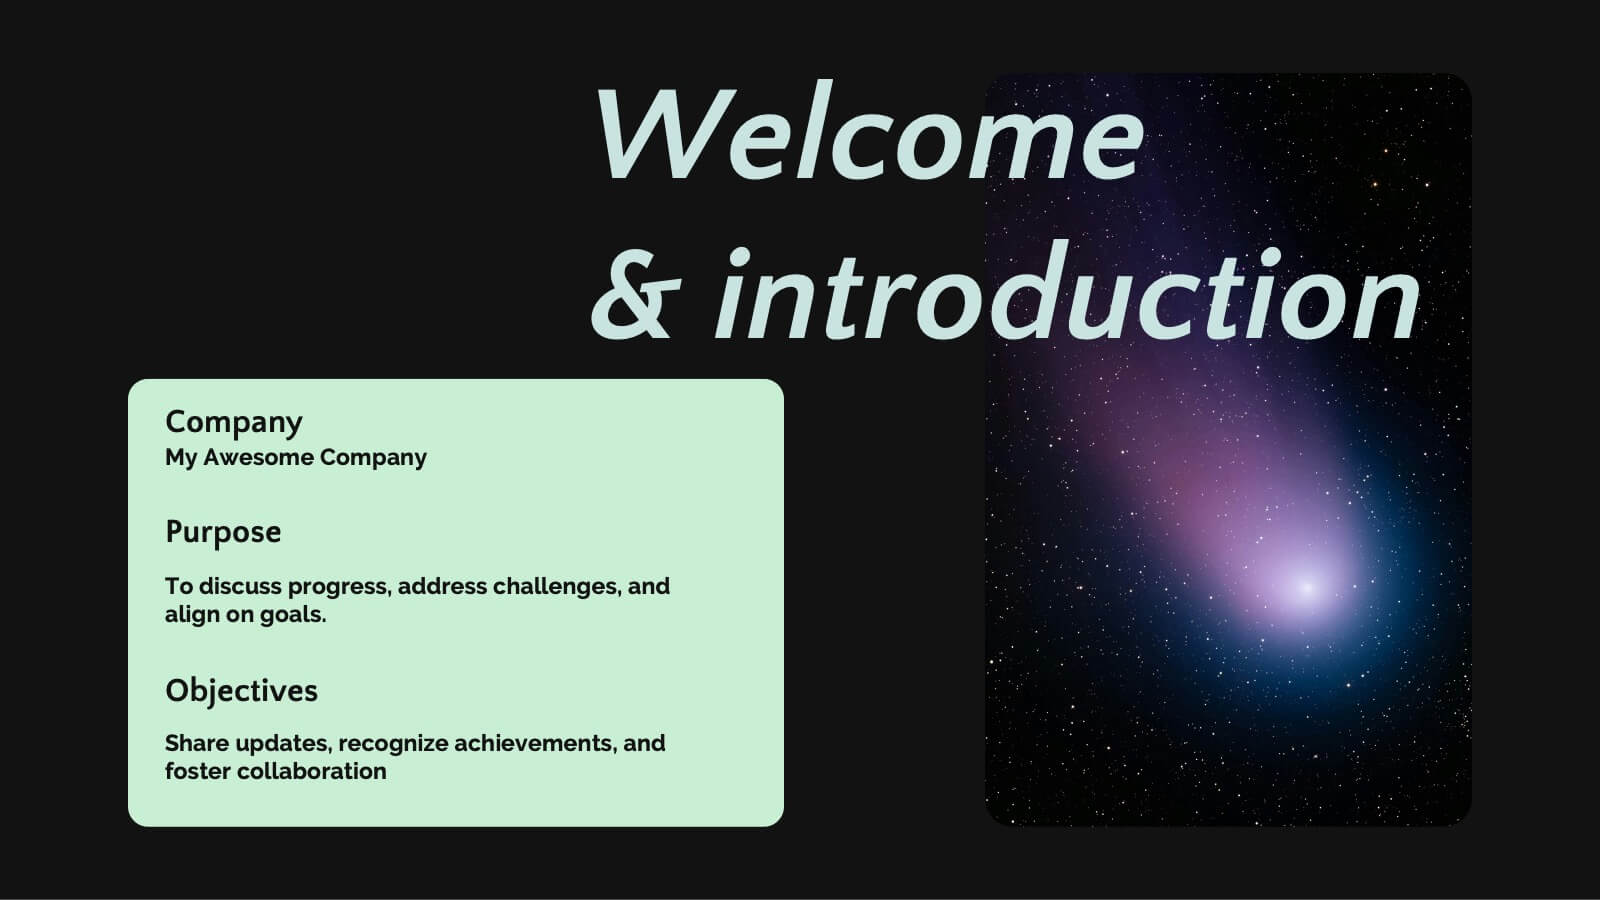
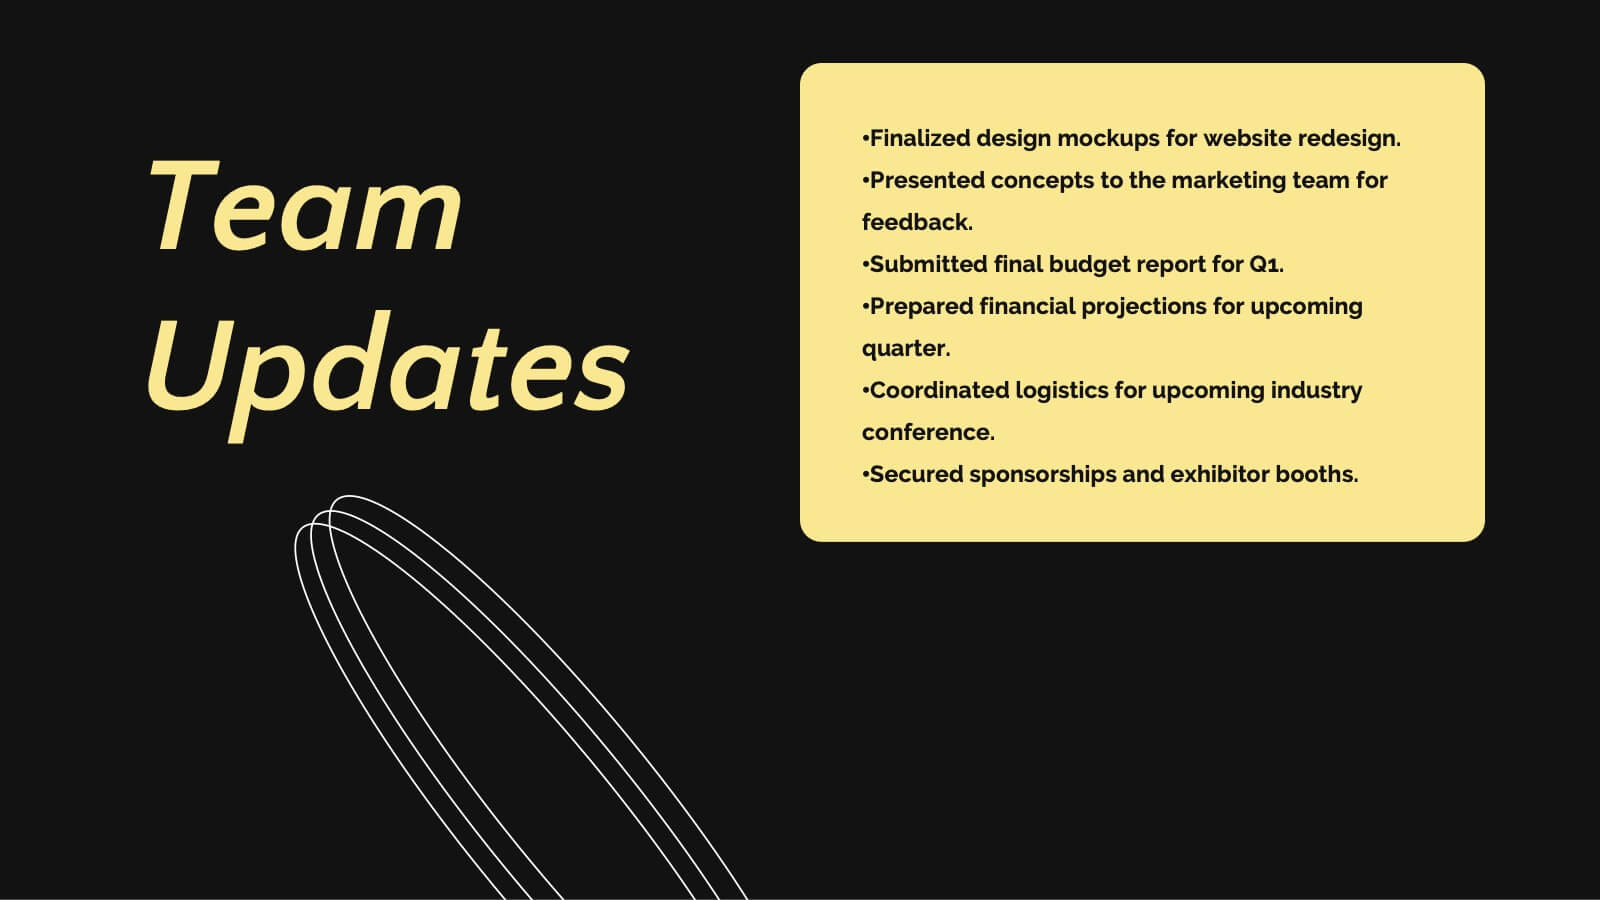
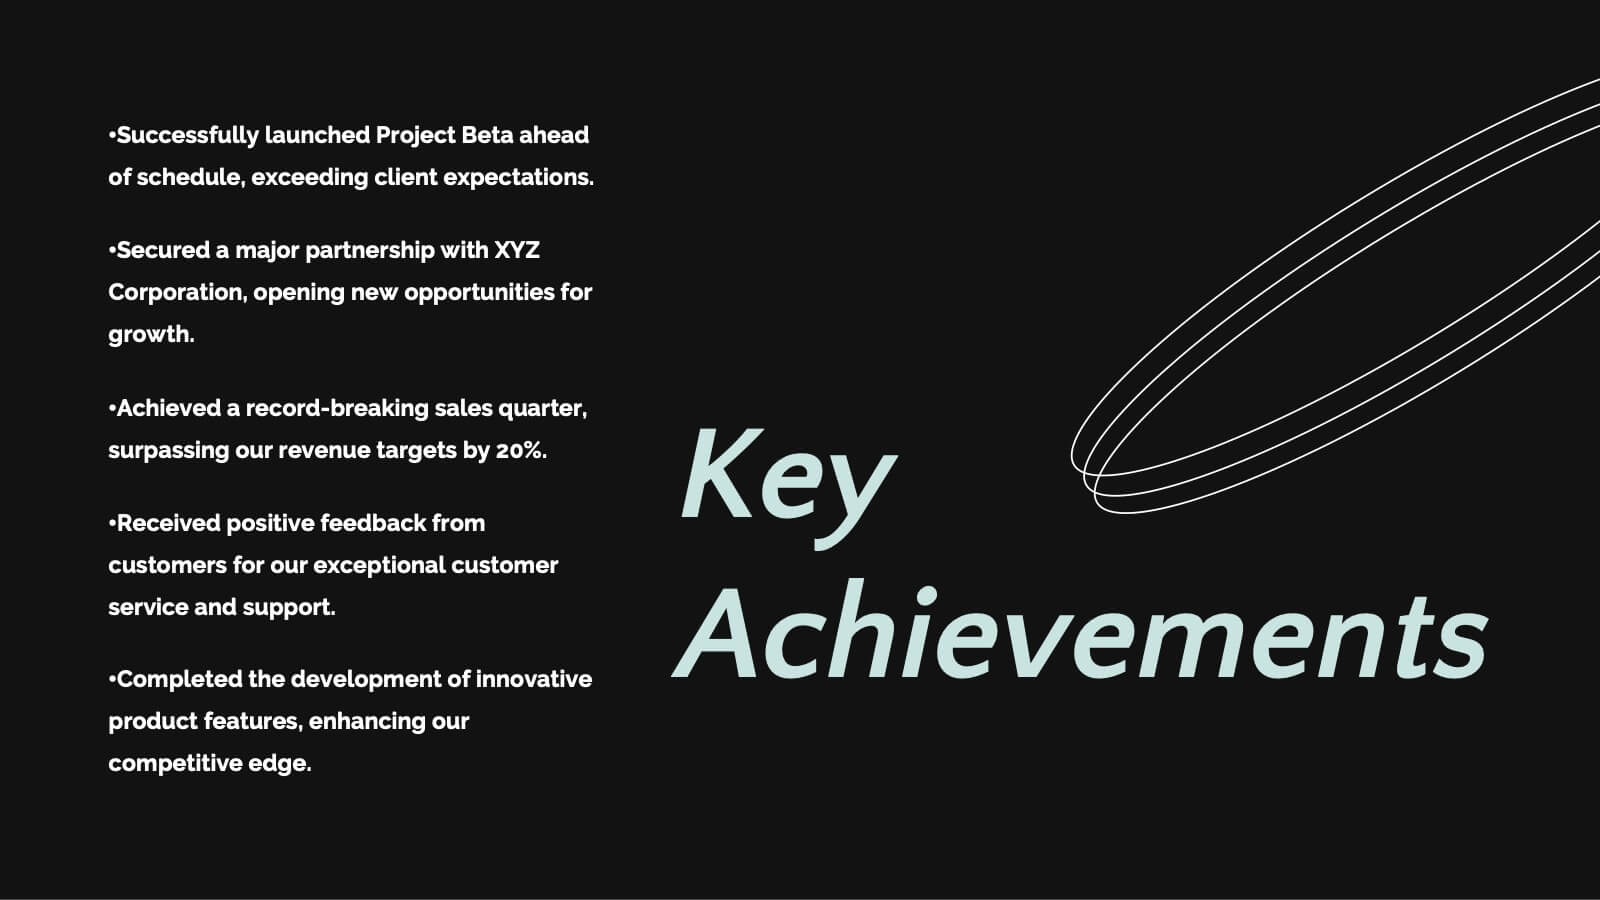
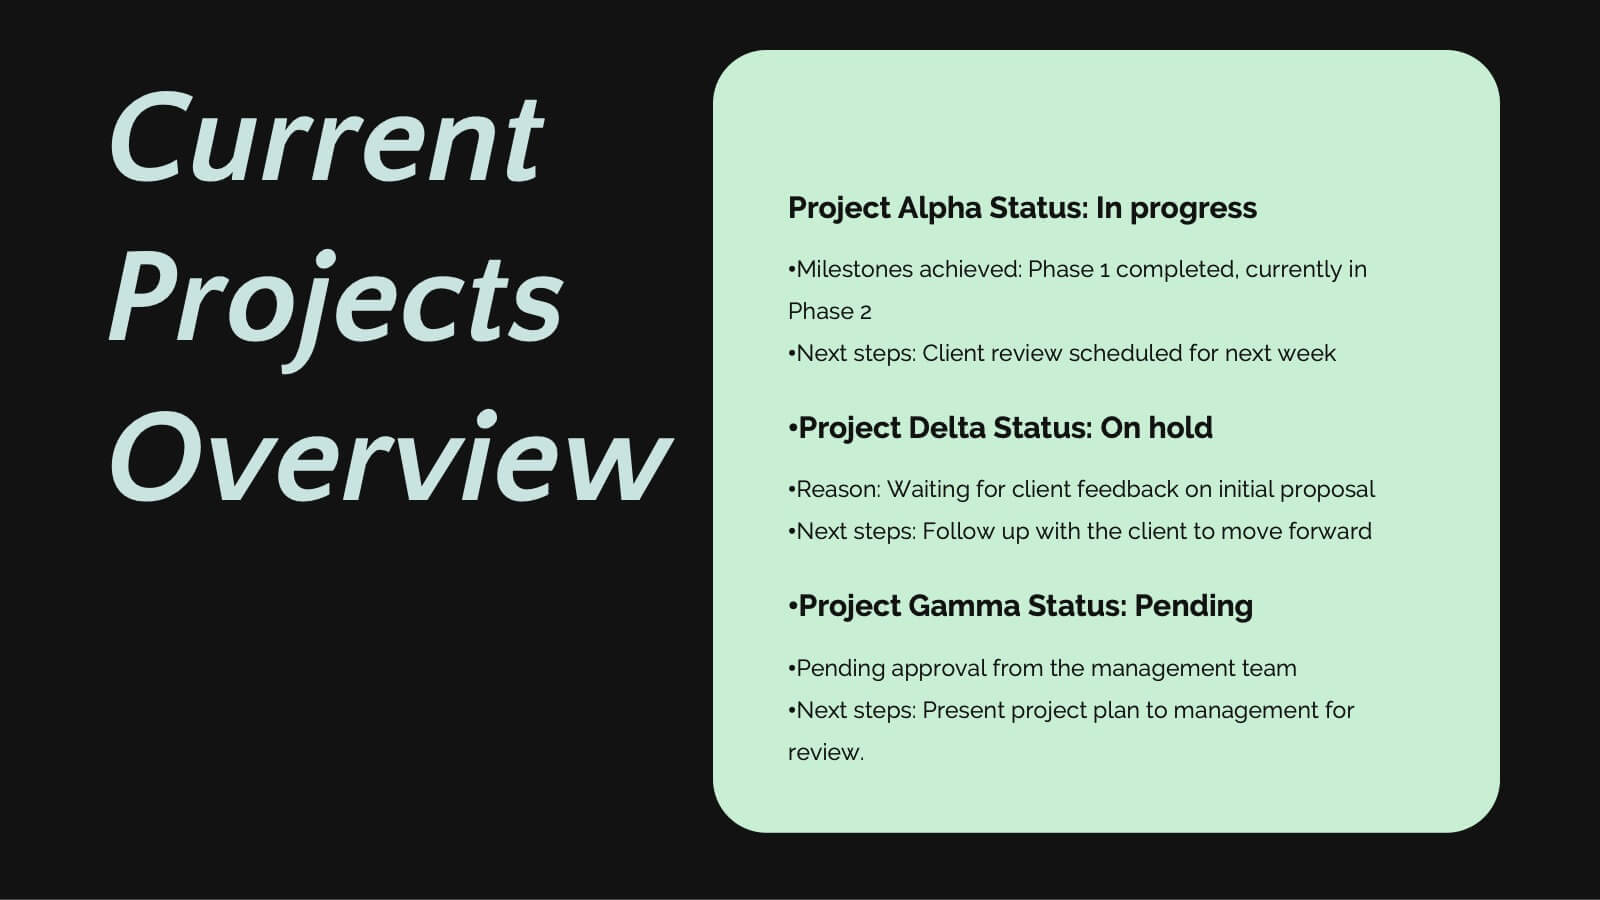
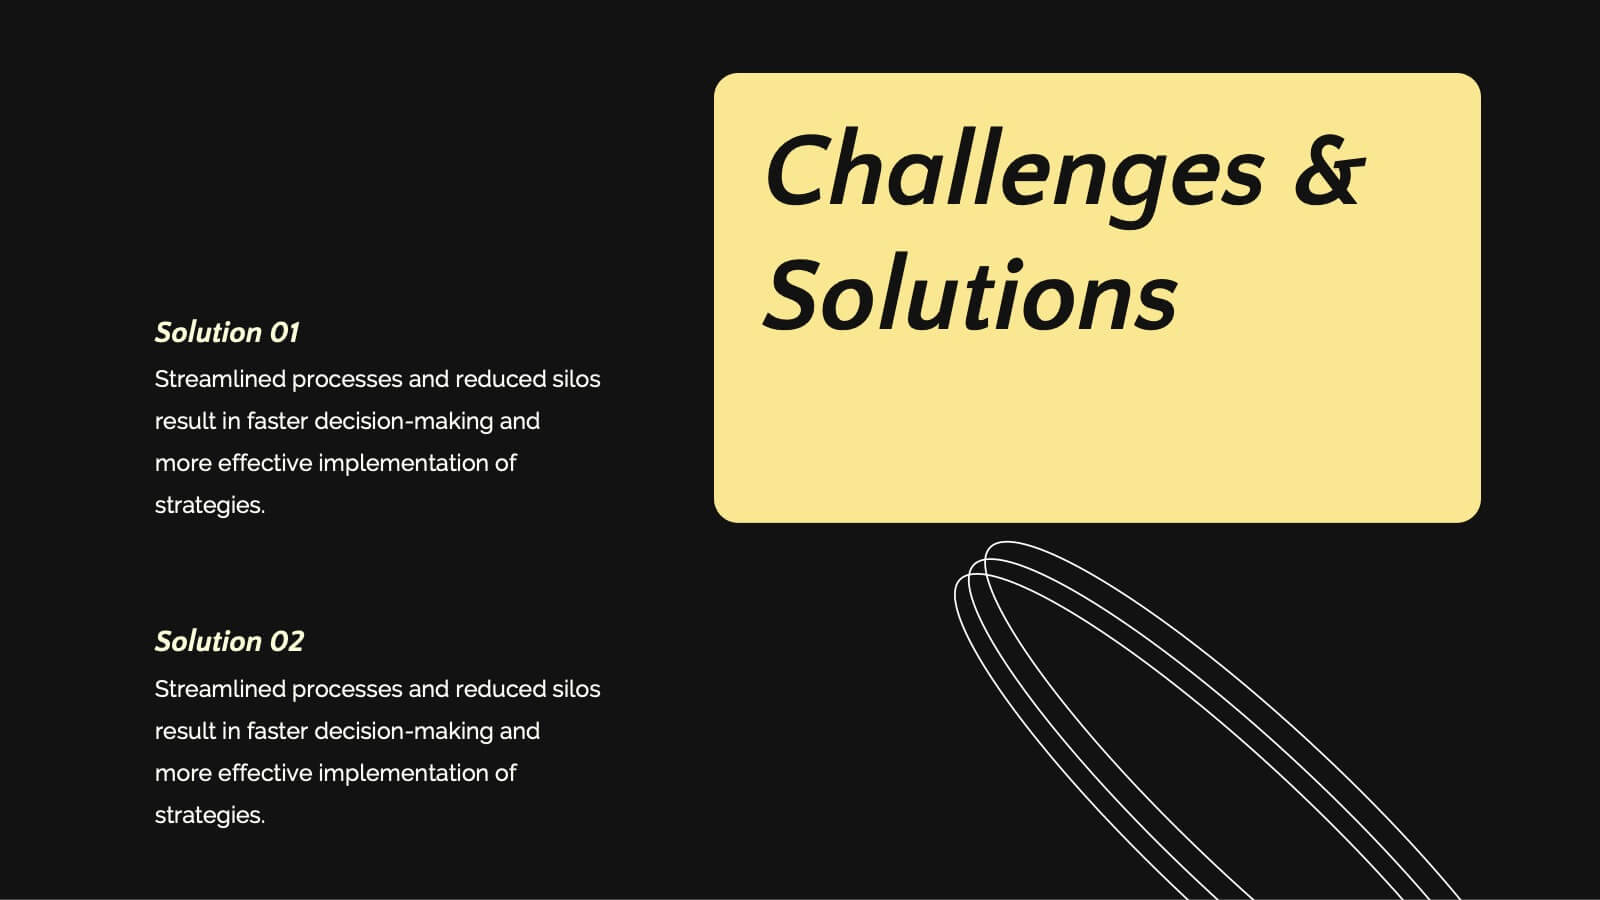
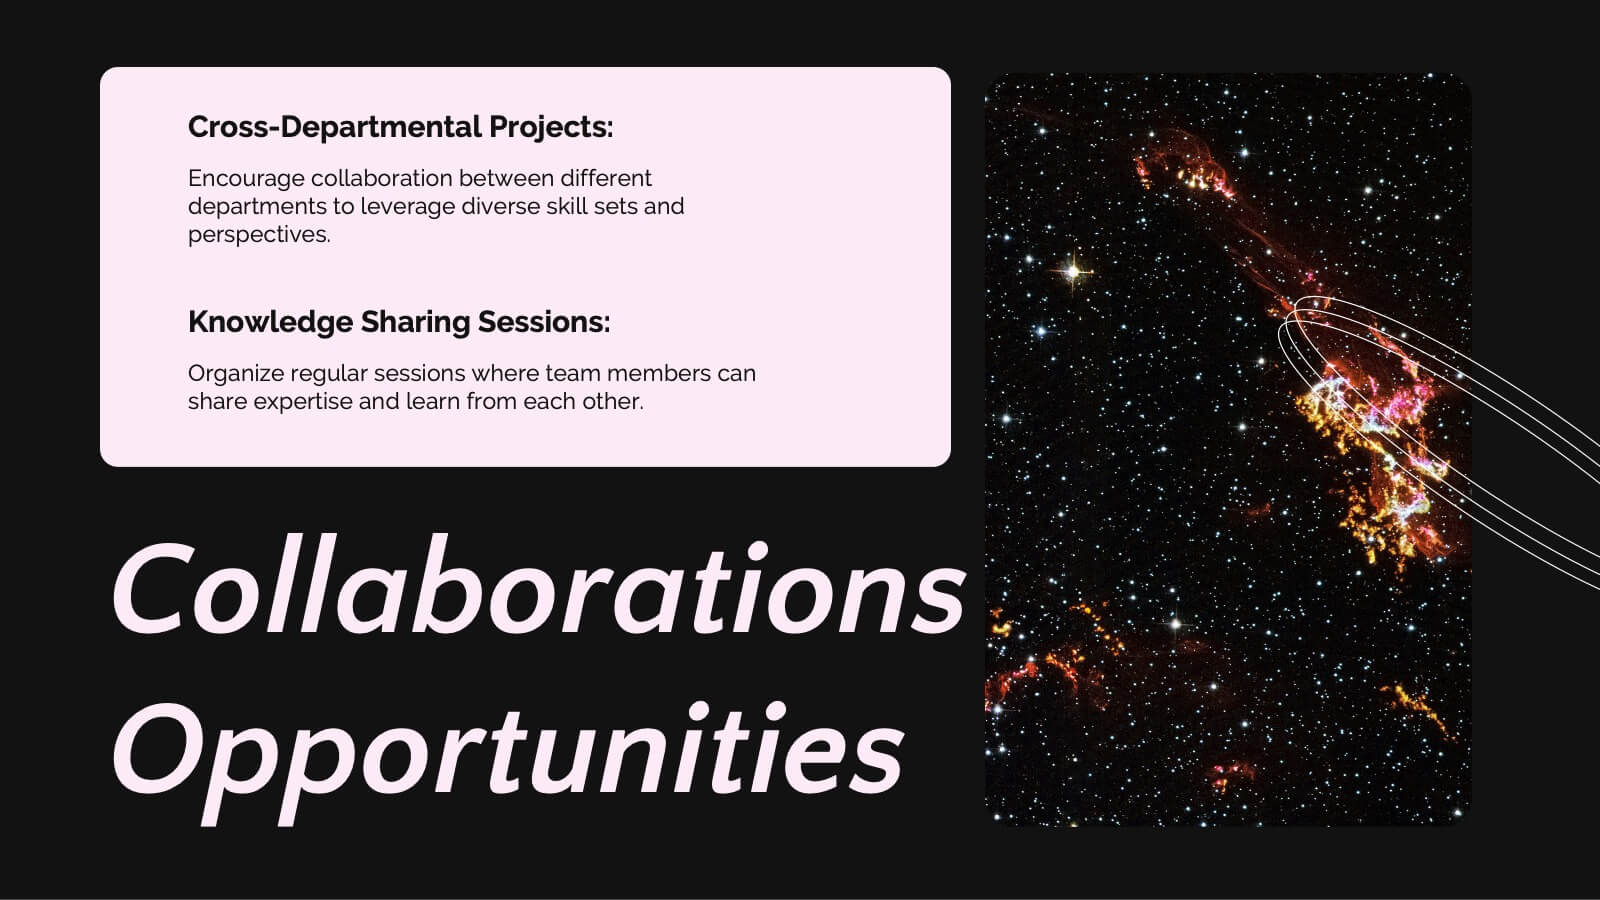
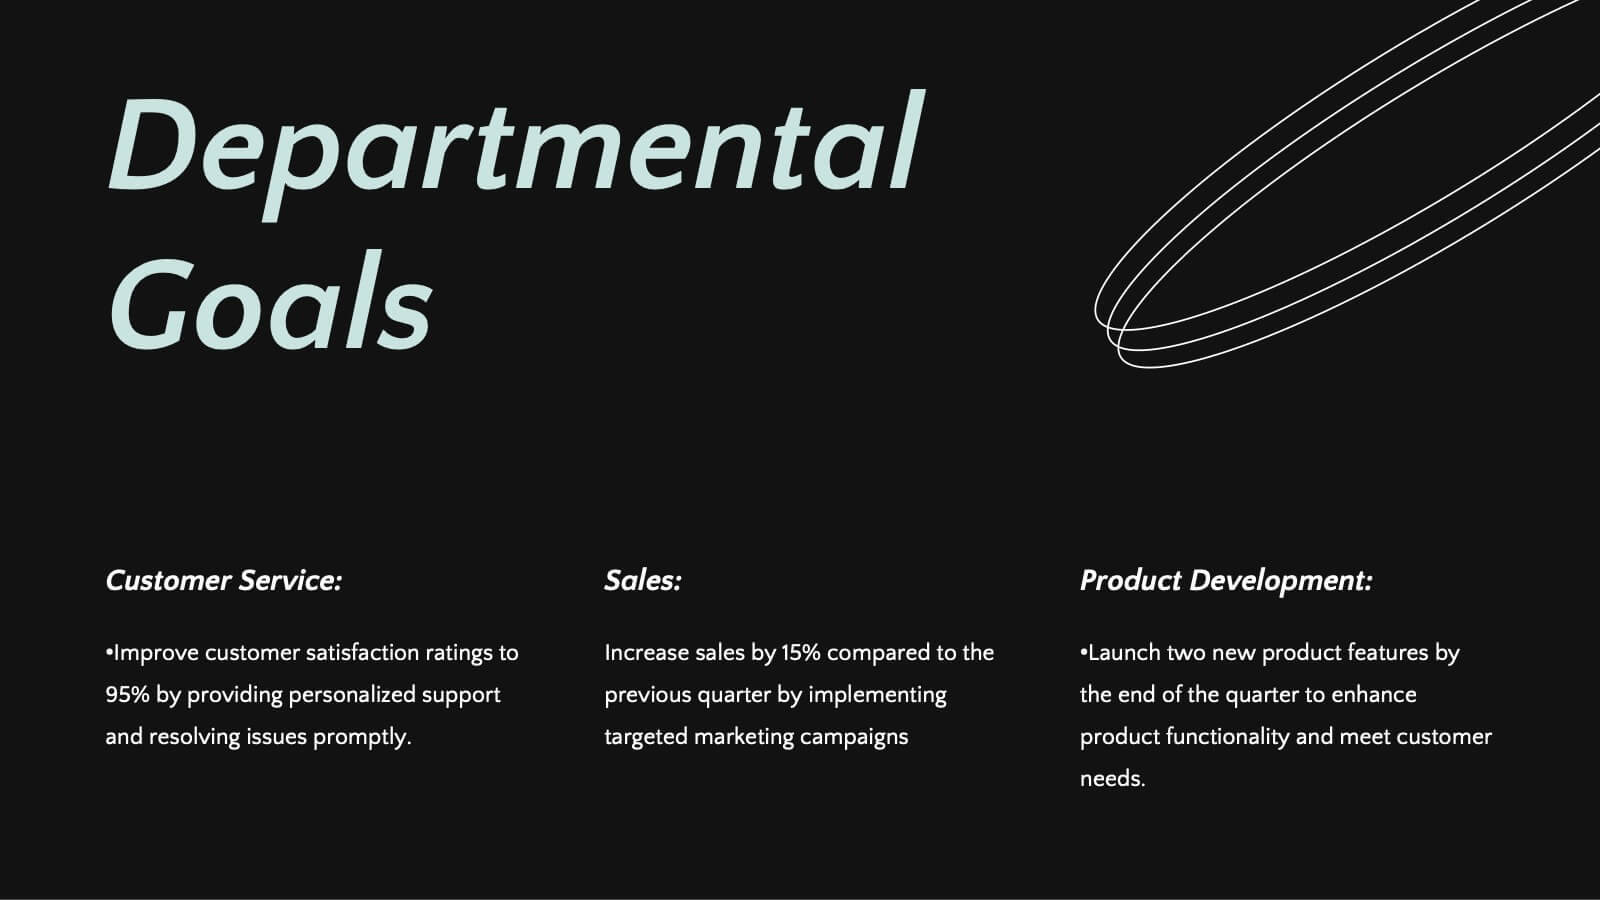
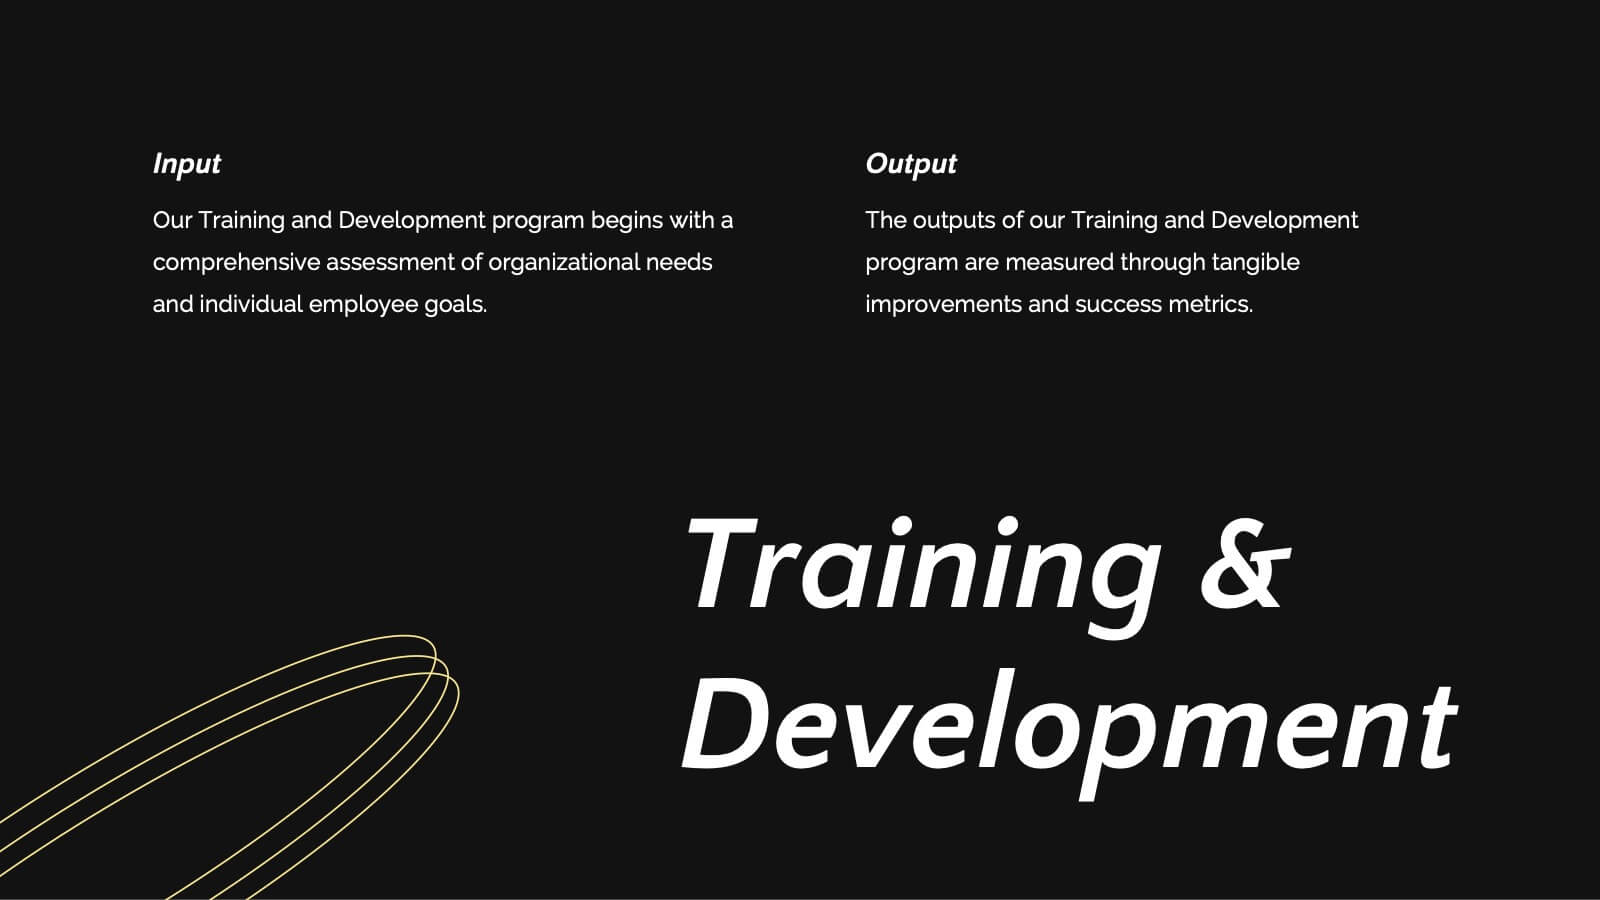
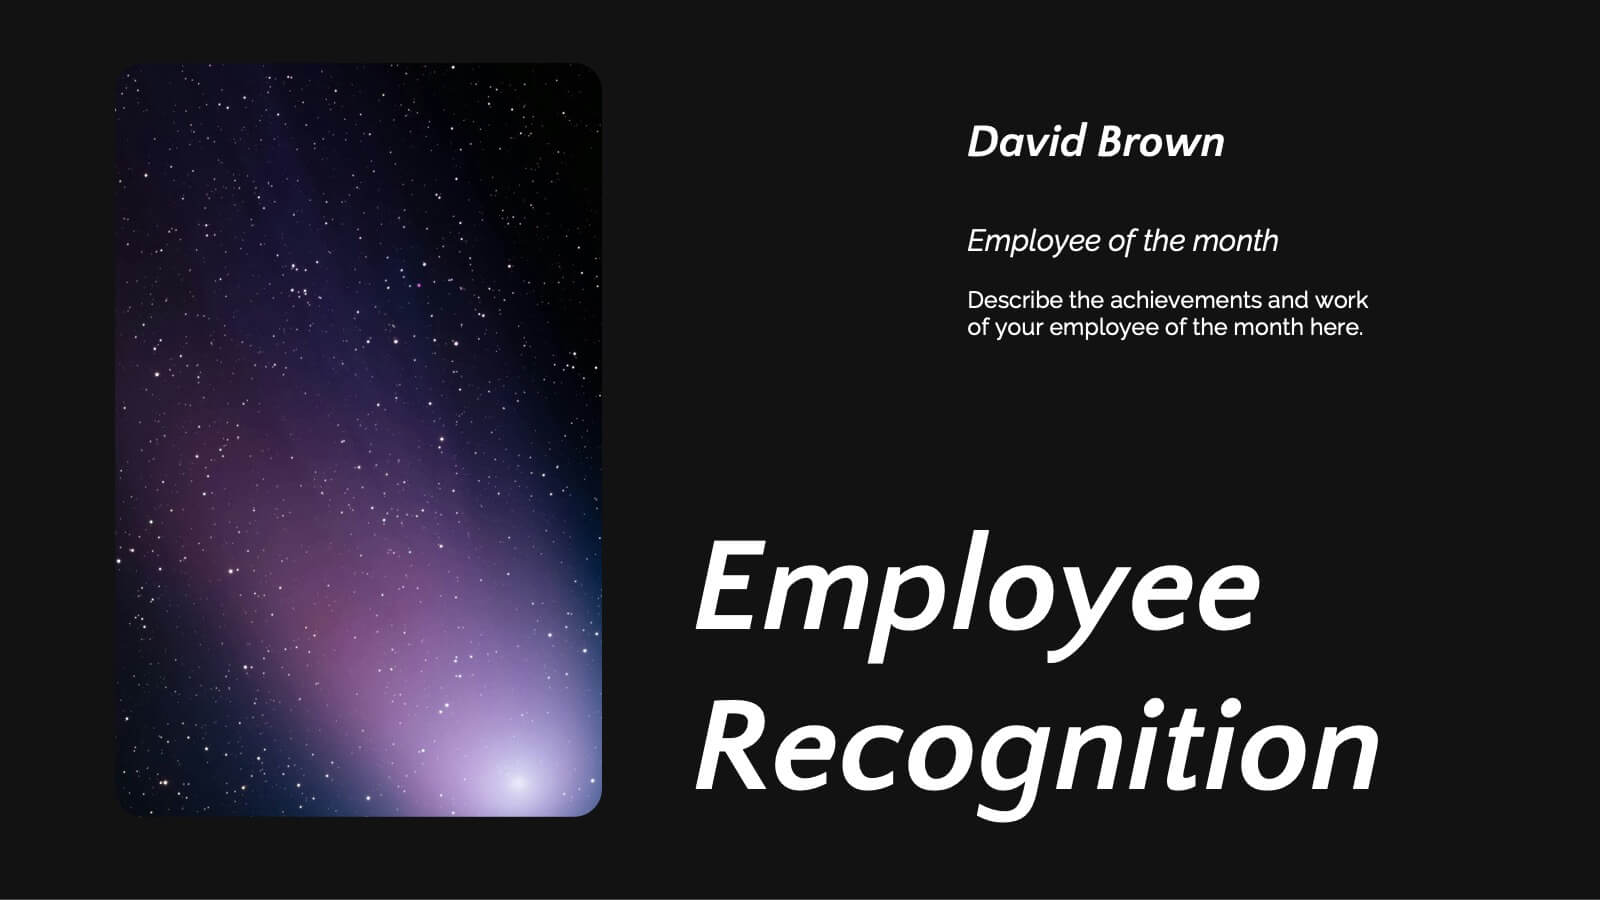
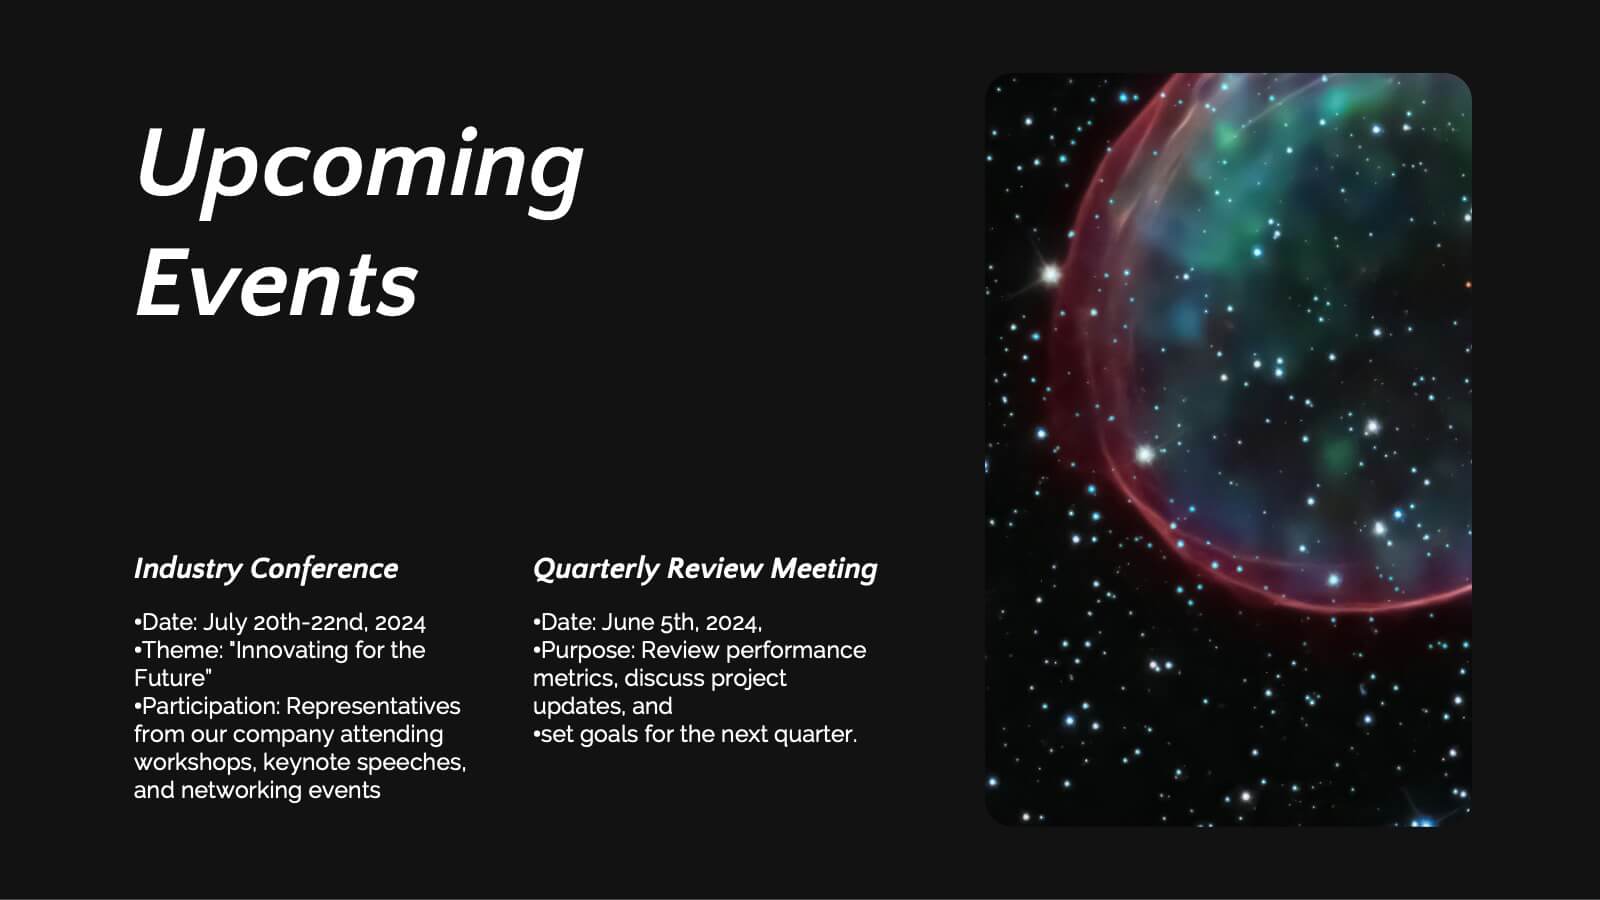
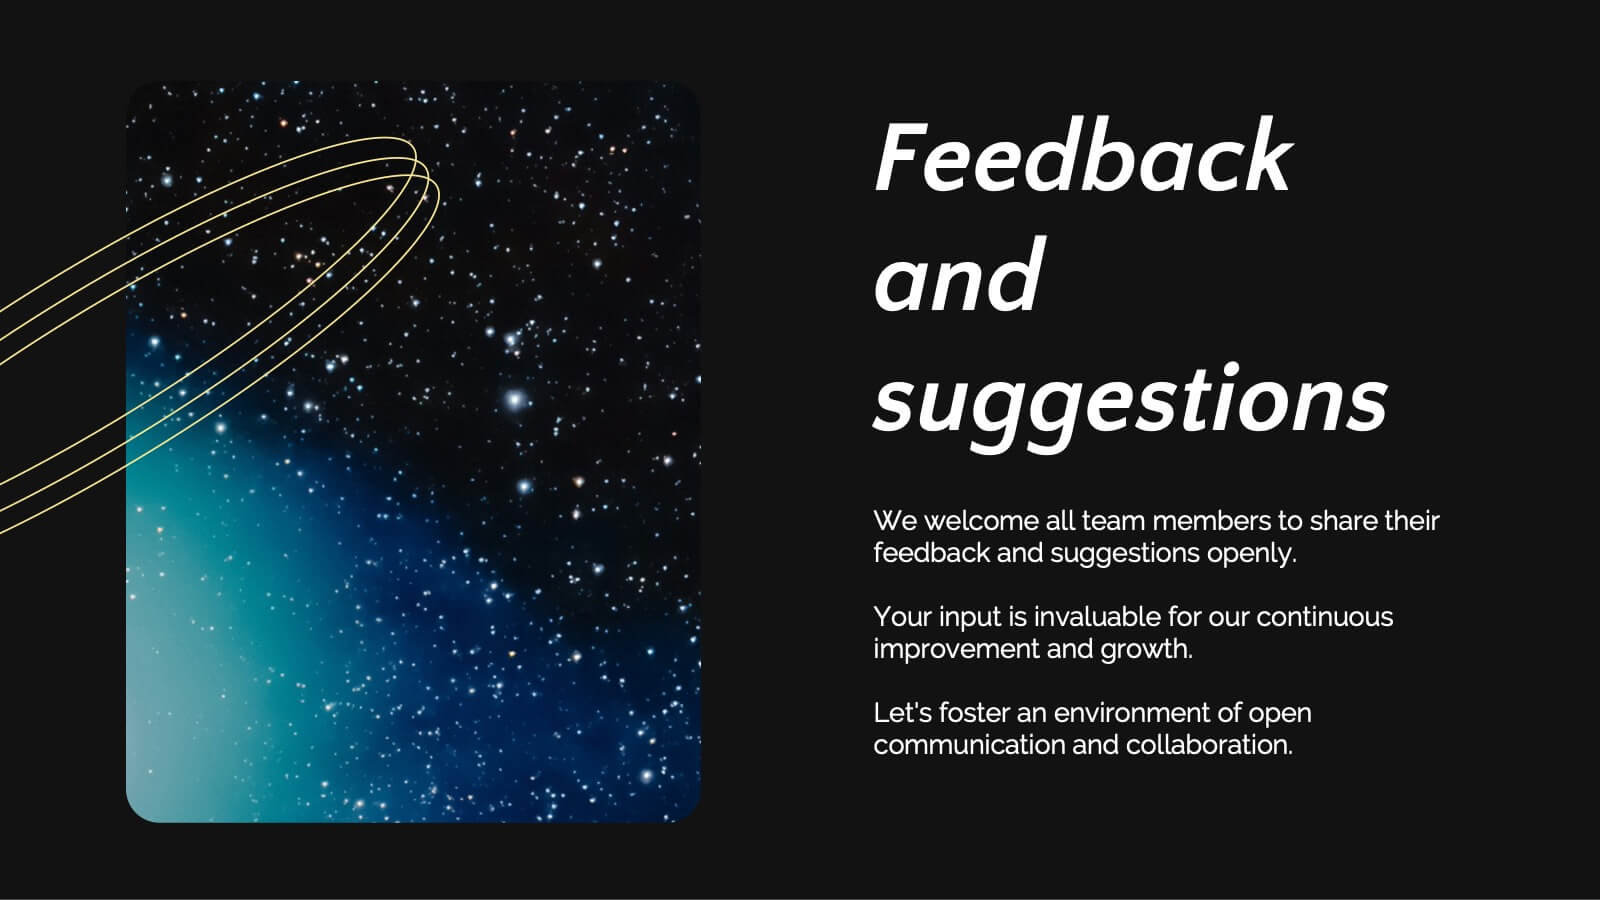
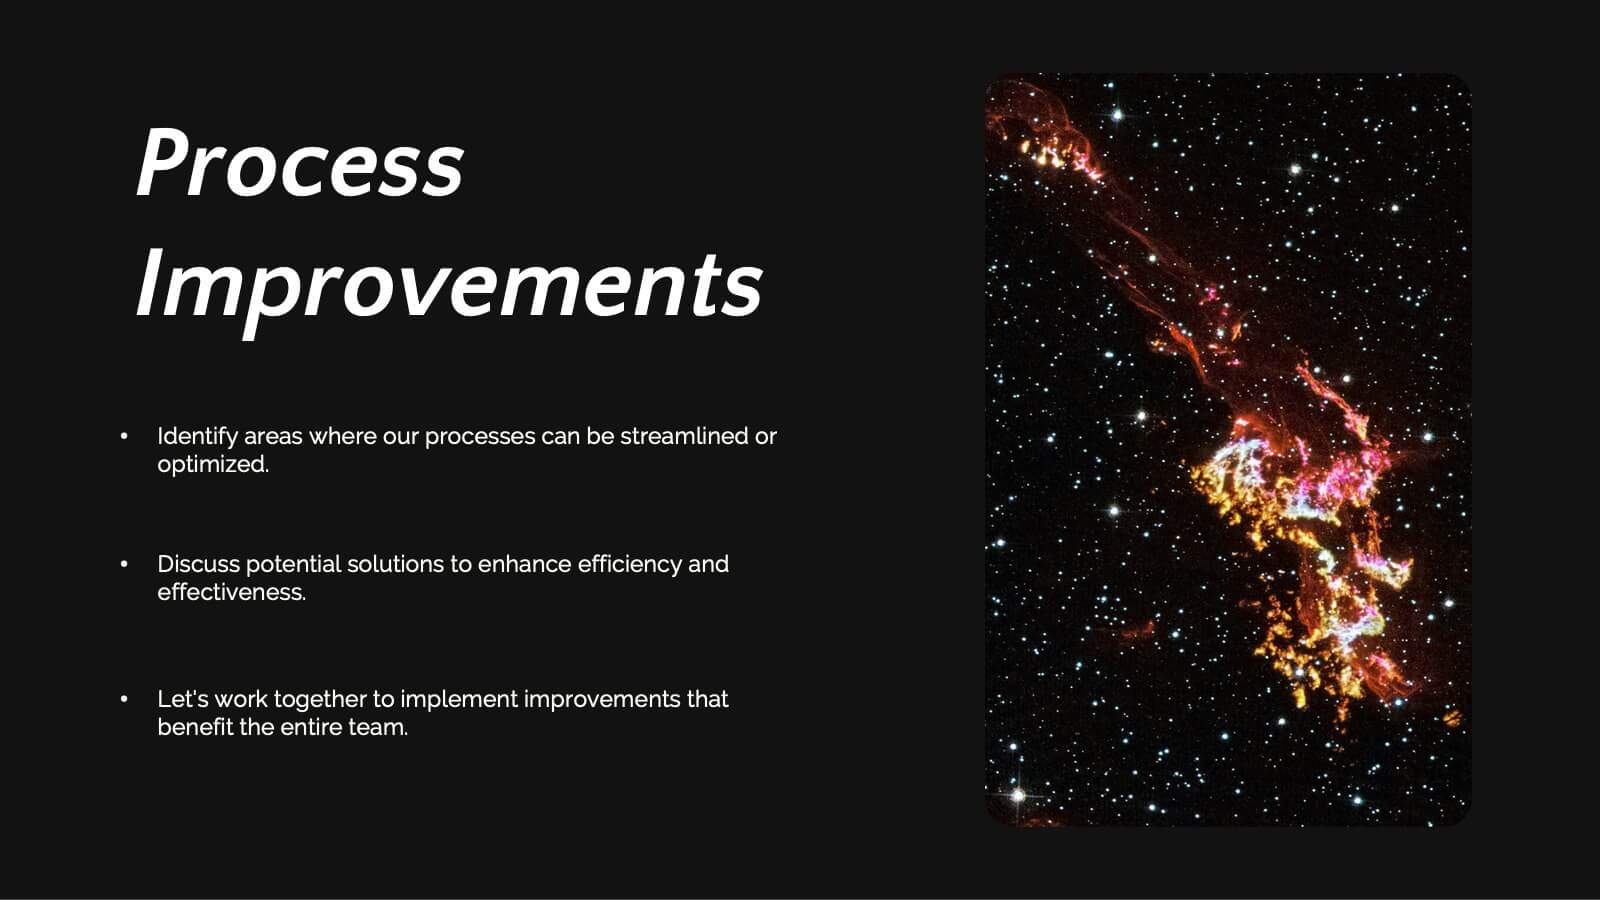
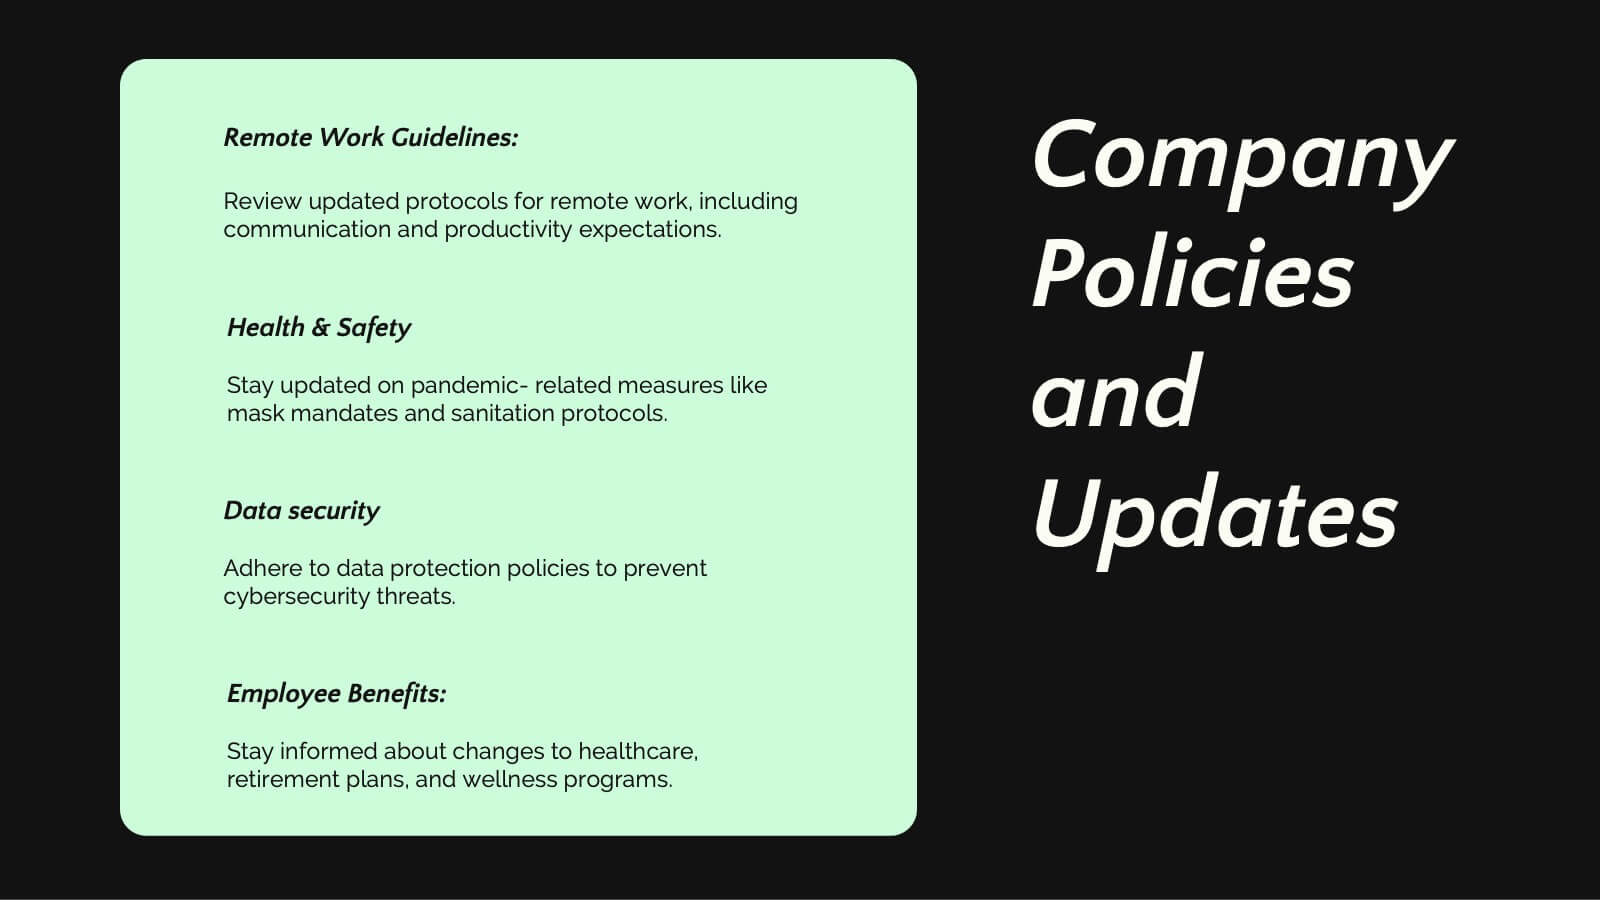
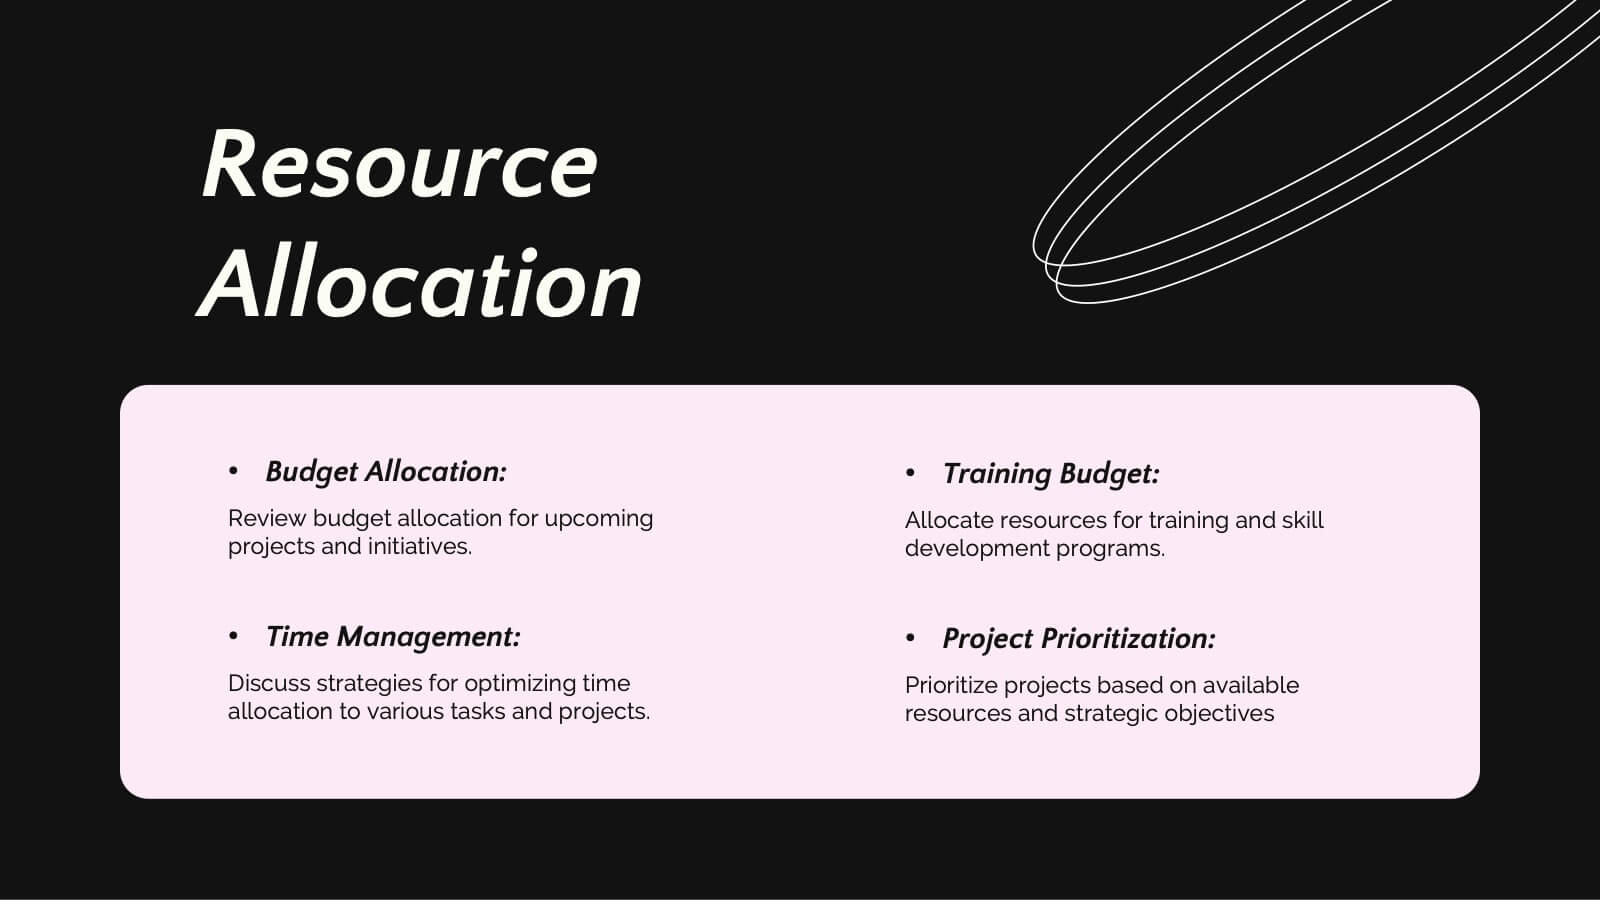
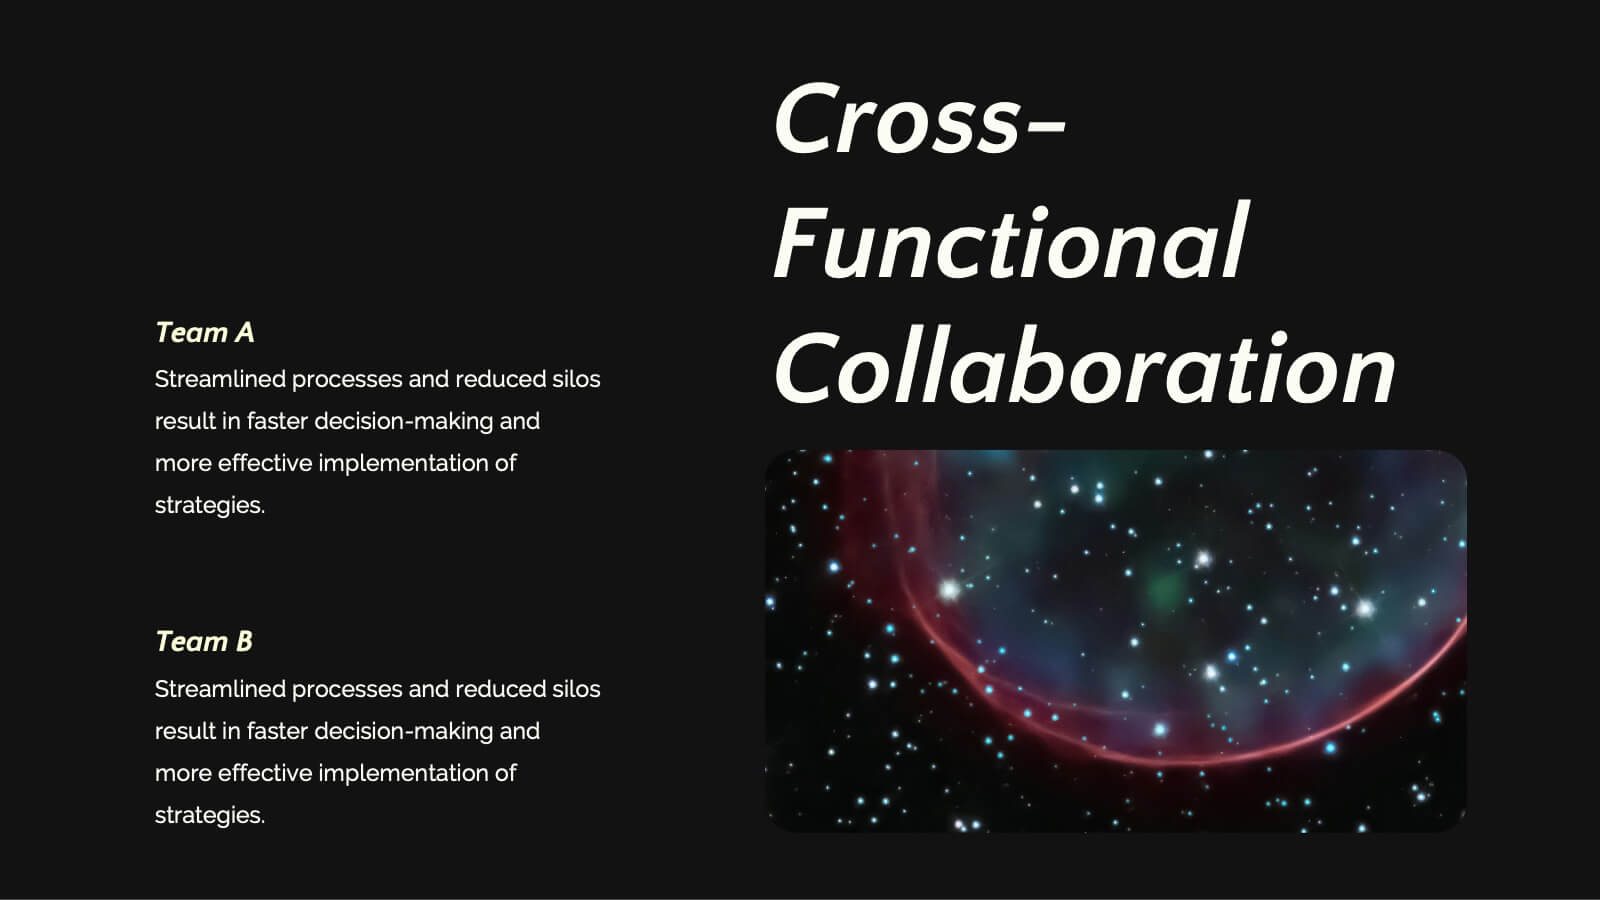
Saturn Business Plan Presentation
Embark on a journey to present your business plan like never before with this stellar presentation template! Perfect for diving deep into key updates, achievements, collaborations, and future goals, it guides your team through essential business strategies and challenges. Compatible with PowerPoint, Keynote, and Google Slides, it offers seamless flexibility and polished professionalism.


23 diapositivas
Agency Portfolio Presentation
Elevate your creative agency's presentation with this Agency Portfolio template. It highlights your best projects, core competencies, client testimonials, and unique services. Ideal for showcasing a professional portfolio, it’s compatible with PowerPoint, Keynote, and Google Slides, facilitating a dynamic and engaging presentation experience.


4 diapositivas
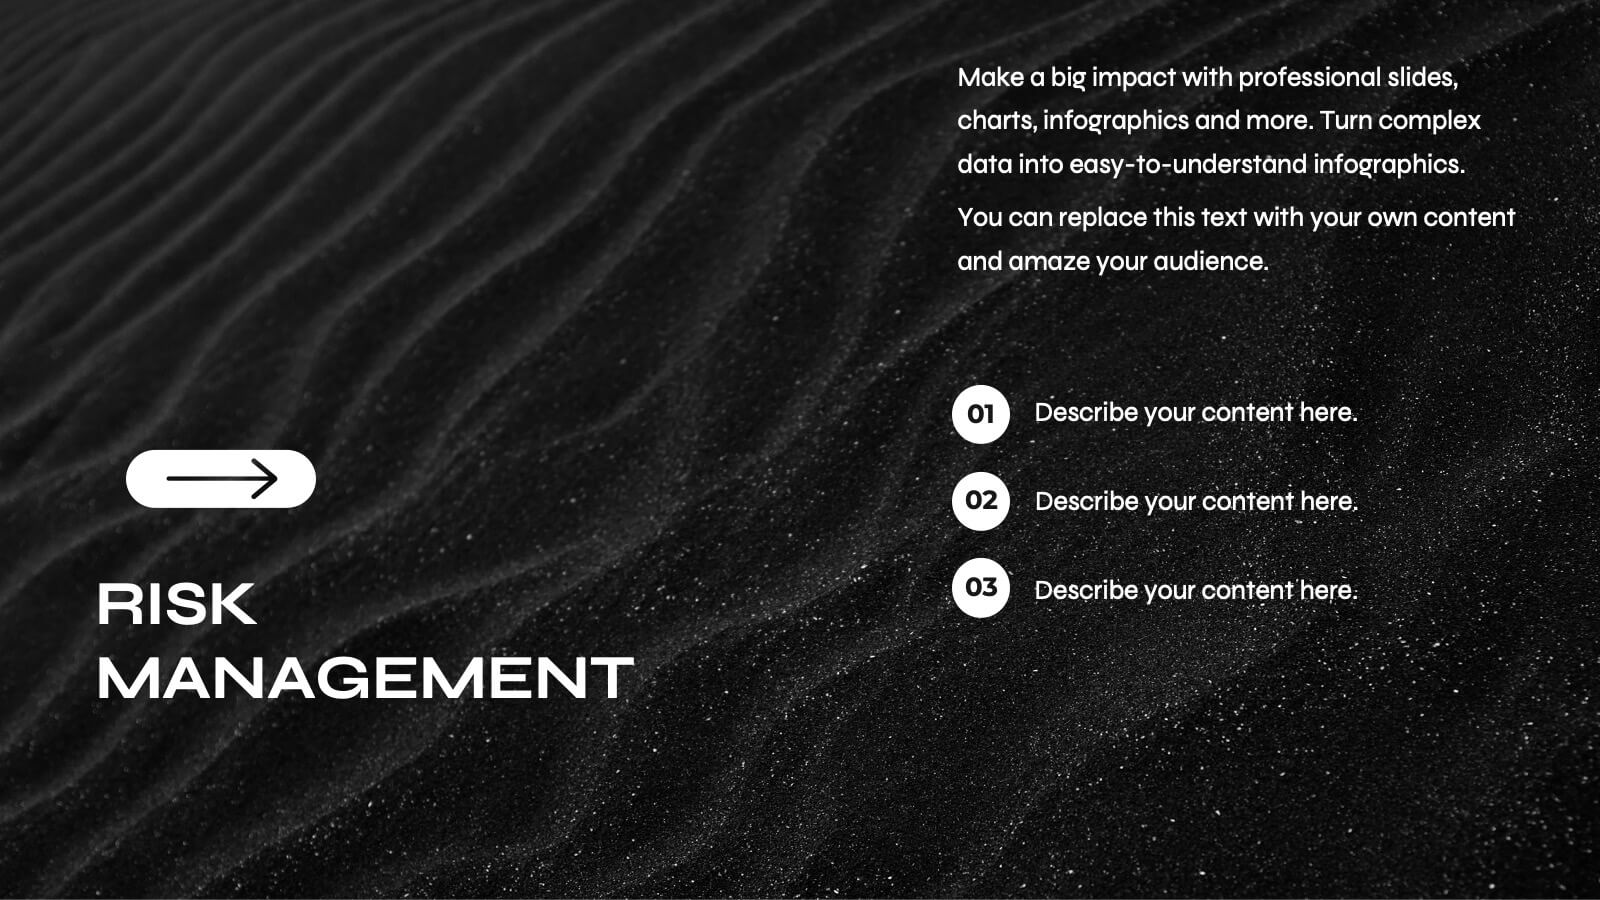
Data Breach Prevention Planning Deck Presentation
Stop breaches before they start with this clean, visual data protection slide. Designed to help teams outline risks, access controls, and mitigation steps, this template makes complex security workflows easy to present. A great fit for compliance reviews or cybersecurity briefings. Compatible with PowerPoint, Keynote, and Google Slides.